Article

Artificial Intelligence-Enhanced Decision Support for Informing Global Sustainable Development: A Human-Centric AI-Thinking Approach

1
National Institute of Education, Nanyang Technological University, Singapore 639798, Singapore
2
Center for Management Practice, Singapore Management University, Singapore 188065, Singapore
3
Faculty of Education, Monash University, Victoria 3800, Australia
*
Authors to whom correspondence should be addressed.
Information 2020, 11(1), 39; https://doi.org/10.3390/info11010039
Submission received: 17 December 2019 / Revised: 6 January 2020 / Accepted: 9 January 2020 / Published: 11 January 2020
(This article belongs to the Special Issue Artificial Intelligence and Decision Support Systems)

Abstract

:
Sustainable development is crucial to humanity. Utilization of primary socio-environmental data for analysis is essential for informing decision making by policy makers about sustainability in development. Artificial intelligence (AI)-based approaches are useful for analyzing data. However, it was not easy for people who are not trained in computer science to use AI. The significance and novelty of this paper is that it shows how the use of AI can be democratized via a user-friendly human-centric probabilistic reasoning approach. Using this approach, analysts who are not computer scientists can also use AI to analyze sustainability-related EPI data. Further, this human-centric probabilistic reasoning approach can also be used as cognitive scaffolding to educe AI-Thinking in the analysts to ask more questions and provide decision making support to inform policy making in sustainable development. This paper uses the 2018 Environmental Performance Index (EPI) data from 180 countries which includes performance indicators covering environmental health and ecosystem vitality. AI-based predictive modeling techniques are applied on 2018 EPI data to reveal the hidden tensions between the two fundamental dimensions of sustainable development: (1) environmental health; which improves with economic growth and increasing affluence; and (2) ecosystem vitality, which worsens due to industrialization and urbanization.

1. Introduction

1.1. Gaining Insights from Unified Analysis of Data Related to the Environmental Performance Index (EPI) and the Sustainable Development Goals Index (SDGI)

1.1.1. Environmental Performance Index (EPI)

The world has partaken in a period of data-driven environmental policymaking. In this new era, stakeholders and policymakers are interested in utilizing evidence-based findings to support decision-making as environmental policy shifted away from its unsteady origins by the end of the 20th century. The Environmental Performance Index (EPI) was developed and eventually recognized as the index of sustainability metric in response to these needs. The EPI was developed by researchers and policy experts at the Yale Centre for Environmental Law and Policy (Yale University) and Columbia University’s Centre for International Earth Science Information Network (CIESIN) in collaboration with the World Economic Forum [1]. According to the official methodology of EPI, it provides a global view on the environmental performance of 180 countries on 24 performance indicators across ten issue categories covering environmental health and ecosystem vitality. Countries are scored on a scale of 0–100. Countries with long-standing commitments towards preserving natural resources, protecting public health and decoupling greenhouse gas (GHG) emissions from economic activity will exhibit high scores. On the other hand, countries with low EPI scores suggest the need for national sustainability efforts, especially in the protection of biodiversity, cleaning up air quality and reducing GHG emissions [2]. It is noteworthy that good governance emerges as the critical factor required to balance these distinct dimensions of sustainability. The EPI draws attention to the issues on which policymakers must take further action. These metrics thus give insights on best practices of well-performing countries and provide guidance for countries that aspire to be leaders in sustainability.

1.1.2. Sustainable Development Goals Index (SDGI)

A good EPI score [1] is a major contributor for a country to achieve the goals of United Nations’ Sustainable Development Goals (SDG) [2]. Progressively, governments are asked to justify their performance on sustainability management and pollution control with reference to EPI metrics in conjunction with the Sustainable Development Goals Index (SDGI). The SDGI illustrates this commitment, fixing metrics at the heart of the policy process in setting international targets and tracking progress toward SDG. Through rigorous data analytics, the EPI metrics in conjunction with SDGI, serve as a data-driven and empirical approach to environmental protection. These metrics allow policymakers to track trends, identify best practices, highlight policy successes and failures, and optimize the gains from investments in environmental protection. The SDGI and Dashboard Report is the first worldwide study to assess their positions to reach countries’ SDGs. The SDGI and Dashboard Report, prepared annually by Bertelsmann Stiftung and the Sustainable Development Solutions Network (SDSN), covered 156 countries’ current positions in terms of the 17 sustainability target items and provides indication from the ecological point of view, on the issues to be prioritized in the SDGs targets expected to be realized by 2030. Most of the data is furnished by international organizations (e.g., World Health Organization, World Bank, Food and Agriculture Organization, International Labor Organization, United Nations International Children’s Emergency Fund, Organization for Economic Co-operation and Development), non-governmental organizations (e.g., Oxfam, Tax Justice Network), household surveys (e.g., Gallup World Poll), and peer-reviewed journals. The findings showed that countries with good results of EPI also have the good positions on SDGI [3]. Moreover, the findings showed that GDP per capita and EPI are correlated; countries with higher GDP per capita have better positions on the EPI [4]. Combining data on environmental performance into composite scores and generating a global ranking of countries had proven to be influential in shaping policy agendas. Supporting stronger global data systems thus emerges as essential to better management of sustainable development challenges. It has led the way to today’s state of environmental policymaking that is more informed, focused and effective.

1.2. How Unified Analytics of Sustainability Indicators Related to EPI and SDGI Can Inform Education and Policy-Making

A data-driven and empirical approach to environmental policymaking is made possible with Environmental Performance Index (EPI), in which it ranks 180 countries on 24 performance indicators across ten issue categories: air quality, water and sanitation, heavy metals, biodiversity and habitat, forests, fisheries, climate and energy, air pollution, water resources, and agriculture [1]. Policymakers are able to measure themselves against these metrics, and determine how close or how far off they are from the desired environmental goals [5,6,7]. This empowers policymakers to identify trends, possible problems, best practices and maximize returns from environmental investments, in order to seek a balance between environmental health and ecosystem vitality.
In the current paper, a rudimentary AI-based approach will be illustrated to suggest how AI [8], and specifically, explainable-AI (XAI) [9] can assist in the intuitive use of human-centric probabilistic reasoning to interpret the counterfactual results generated by predictive models. AI-based analytics warrant a reasonably comprehensive source of information needed to determine regional health needs, assess the patterns of illness, and predict patterns of health care spending. AI-based analytics can achieve this by predicting knowledge on health trends, costs and the effectiveness, and quality of health care services. AI-based analytics can also contribute to improvements in quality of care by making information available to institutions and user groups for their use in quality improvement programs for regional health planning. AI-based analytics is useful in addressing policy questions and national debate related to health care reform.
The latter part of this paper explores a predictive modeling approach based on AI to investigate how sustainability analysts can use AI-assisted probabilistic reasoning to interpret counterfactual scenarios that could theoretically be used to inform policy making. Instead of being unquestionably led by AI, humans should take the lead by thinking more discursively while using AI. The concept of human-centric AI-Thinking will be presented in the next section to facilitate this discussion.

1.3. The Theoretical Basis of AI-Thinking

Even without manual interventions by humans, AI-based machine learning is able to discover the seemingly hidden relations between variables in data sets. It does not mean, however, that human beings can be substituted by AI. It is important that humans take the lead in interpreting the results provided by the AI. With the cognitive ability that straddles both AI and human-centric realms, humans will continue to play a vital role. Zeng first offered the concept of this mode of understanding and thinking—AI-Thinking [10] as a conceptual framework that could be used to exploit cognitive computing data analytics, thus improving learning by challenging people to interpret new findings from the machine-learned discovery of hidden data patterns. It has been observed that the interplay of the use of artificial intelligence in education can educe (draw out) AI-Thinking in learners [11]. Educators are also involved in instilling AI-Thinking [10,12] in learners to help students create more questions when they discover the machine-learned hidden relationships between data variables [13].
AI-Thinking could be construed as follows: “AI” stands for machine-based artificial intelligence, while “Thinking” stands for human-in-the-loop (HuIL) [14] reasoning. AI-Thinking will allow sustainability professionals to recognize opportunities for applying AI and to collaborate with multidisciplinary experts to inform policymaking. To understand and interpret the technical results produced by AI into meaningful human-centric terms, stakeholders involved in sustainability must be sufficiently informed on how the AI processed the information. In the current context, for instance, they must learn how the Bayesian theorem’s mathematical algorithm operates.
AI-Thinking is not a linear process of thinking. It can be regarded as a form of complex human cognition that involves the co-emergence of two concomitant forms of thoughts reaching a state of “vital simultaneities” [15], that is, in human-initiated AI analysis that informs human-focused reasoning, and conversely, in human-centric reasoning which informs more AI analysis, and so on. They are connected inextricably and cannot easily be separated from each other. However, the importance of educing AI-Thinking for humans to lead and guide AI cannot be overstated, because—like it or not—the use of AI is gaining traction all over the world.

1.4. The Democratization of the Use of AI by Analysts Who Are Not Computer Scientists

AI has been more closely associated with university computer science departments than with departments involved with sustainability-related studies. It has been perceived as difficult to understand [16]. Nonetheless, AI has gained so much popularity across sectors in recent years, that it is referred to as Industry 4.0. It emphasizes the importance of training people not only to solve problems using knowledge that they know from any particular discipline, but also from AI. In the field of sustainability-related research, AI usage has also been steadily gaining traction [17]. The use of AI-Thinking as a form of educational scaffold for training analysts who are not computer scientists allows them to better understand AI and raise more questions for meaningful discussions with stakeholders [18]. In addition to teachers of computer science, other educators in countless academic disciplines have also been trying to introduce common AI concepts to learners, such as machine vision, natural language processing (NLP), machine learning (ML), deep learning (DL) or reinforcement learning (RL) and, thereafter, train these learners to create artificial neural networks (ANN), recurrent neural networks (RNN), convolutional neural networks (CNN), or generative adversarial networks (GAN). However, Correa, Bielza and Pamies-Teixeira [19] point out that in these various forms of artificial neural networks, node-to-model relationships could be equivalent to black boxes. Either they are hidden from the user, or are far too complicated for human to comprehend. Researchers and analysts who may not be computer scientists also need to be trained in AI-improved data-driven human-centric reasoning skills, so that they can work in teams and interact intuitively to think about practical ideas. Therefore, in this paper we suggest another AI-based approach which can facilitate human-centric reasoning.

2. Research Problem and Research Questions

2.1. Research Problem

Data analytics has become a professional skill that potential employers expect their staff to have, regardless of whether they have been formally taught in school [20]. It is worth asking: is there any more practical approach to human reasoning that is easy-to-use for beginners, so that people who may not be so familiar with computer programming or advanced mathematics can also analyze data and interpret the results? In addition, is there any user-friendly AI-based software that could be used by beginners to experiment with different variables in different computational simulation scenarios? Would it be possible to communicate their ideas from the results of the analyzed data, using intuitive human-centric reasoning that can also be easily understood by colleagues who are not computer scientists or mathematicians (e.g., policymakers)? The current paper argues that there is one approach of this kind that might be worth considering. It is an AI-based Bayesian Network (BN) probabilistic reasoning approach [21,22,23], using an easy-to-use software that is suitable for beginners. Instead of trusting unquestionably in the results produced by AI, however, humans should and could take the lead, e.g., by carefully analyzing the models and results created by AI using the analytical notions of AI-Thinking.
Logical reasoning, probabilistic reasoning and deep data-driven learning are the main theoretical paradigms that have influenced the conceptual framework of AI-Thinking [24]. The use of AI as a tool of analyses, representation of complex knowledge and development of AI are examples where AI-Thinking are cognitively involved [25]. With AI-Thinking, probabilistic reasoning through data-driven cognitive models is more intuitive for resolving complexities in real-world problems, as it is similar to human thought [12].
With this in mind, the examples in the current paper aim to provide ample opportunities for educing AI-Thinking. For example, AI-Thinking could be educed when pondering about how the prediction and subsequent re-adjustment of variables could potentially lead to better or worse levels of sustainability. AI-Thinking could also be educed in probabilistic reasoning (e.g., via the Bayesian probabilistic reasoning approach), and deep data-driven learning (e.g., discovery of hidden patterns of relationships between sustainability statistics variables using machine learning).
BN’s primary advantage is that its strong probabilistic theory allows users to gain an intuitive understanding of the processes involved. It enables predictive reasoning because, given evidence observations, questions can be asked to determine the posterior probability of any variable. Nonetheless, the current paper does not plan to analyze the comparison of BN and ANN in predictive models, as this has already been well established by Correa, Bielza and Pamies-Teixeira [19]. They note that BN can explain the relationships that occur between the nodes in a model and offers more knowledge about the relationships. On the other hand, ANNs have been comparable to a black box. This is not an attempt to undermine the efforts of research studies that are focused on other approaches. Rather, it hopes to offer a more user-friendly multidisciplinary approach for predictive probabilistic reasoning.
The current paper demonstrates a supervised BN model. In the context of this paper, the BN model can be used to calculate how much the variables from the sustainability dataset might have direct and/or integrative influences on the probability of occurrences of different levels of the EPI. BN modeling has also been well known for its reliability in predictive applications of real-world scenarios [26,27].

2.2. Research Questions

In order to study the “behavioral dynamics” of the informational motif of the system by analyzing the dataset, the three over-arching research questions that guide the current paper are:
  • RQ1: From descriptive analytics of the dataset, what is the overall characterization of the sustainability variables and the EPI?
  • RQ2: From predictive analytics of the dataset, what are the conditions in the best-case scenario that could result in high EPI?
  • RQ3: From predictive analytics of the dataset, what are the conditions in the worst-case scenario that could result in low EPI?

3. Methods

3.1. Rationale for Using the AI-Based Bayesian Network Approach in Sustainability Research

Among the vast amount of tools in AI-related research, the BN approach for analyzing statistical data is one of the easiest AI-based approaches for beginners as it uses human-centric probabilistic reasoning, which is similar to intuitive human thought [28]. Coupled with the advancement of processing power in affordable computer hardware, it has resulted in BN gaining traction in research in recent years [29]. The BN method is ideal for analyzing non-parametric data because it does not need the underlying parameters of the model to assume normal parametric distribution [30,31,32]. The Bayesian approach helps researchers to conduct simulations by allowing them to integrate prior knowledge into the analyses. Consequently, multiple rounds of null hypothesis testing become unnecessary when analysts are using Bayesian data-analytical techniques [33,34,35].
Researchers in the field of sustainability have also utilized the Bayesian approach [36,37]. This helps them to quantify mutual information, as espoused in Claude Shannon’s Information Theory [38], which measures the probabilistic amount of commonality between two distributions of data that may not be parametric. BN can also be used to predict the so-called rare and unexpected worst-case “black swan” scenarios [39], and for failure analysis in systems [40]. In particular, BN excels in the counterfactual simulations of the conditions and their outcomes when there is uncertainty [41]. In the current paper, BN will be used to predict the best-case scenario, and also the worst-case black swan scenario of the uncertain conditions that could potentially adversely affect the EPI. This form of predictive analytics is particularly helpful for informing sustainability stakeholders, such as policy-makers and researchers who are trying to protect the environment, as they face ever-changing uncertainty.

3.2. The Bayesian Theorem

Presented here is a short introduction of the Bayesian theorem and BN. Readers who are interested to learn more about BN’s well-established corpus can peruse the works of Cowell et al. [42]; Jensen [43]; and Korb and Nicholson [44].
The mathematical formula upon which BN is based (see Equation (1)), was developed by Reverend Thomas Bayes, and posthumously published in 1763 [28]:
P ( H | E )   =   P ( E | H ) . P ( H ) P ( E )
In the Bayesian Theorem, (see Equation (1)), H represents the hypothesis, and E represents the observed evidence. P(H|E) represents the conditional probability of the hypothesis H, which analyzes the likelihood of H occurring given the condition that the evidence E is true. It is also known as the posterior probability, which analyzes the probability of the hypothesis H being true by calculating how the evidence E influences the verity of the hypothesis H.
P(H) and P(E) represent the independent probabilities of the likelihood of the hypothesis H being true, and of the likelihood of the evidence E being true. It is also known as the prior or marginal probability—P(H) and P(E), respectively. P(E|H) represents the conditional probability of the evidence E, that is, the likelihood of E being true, given the condition that the hypothesis H is true. The expression P(E|H)/P(E) represents the support which the hypothesis H is provided for by the evidence E.

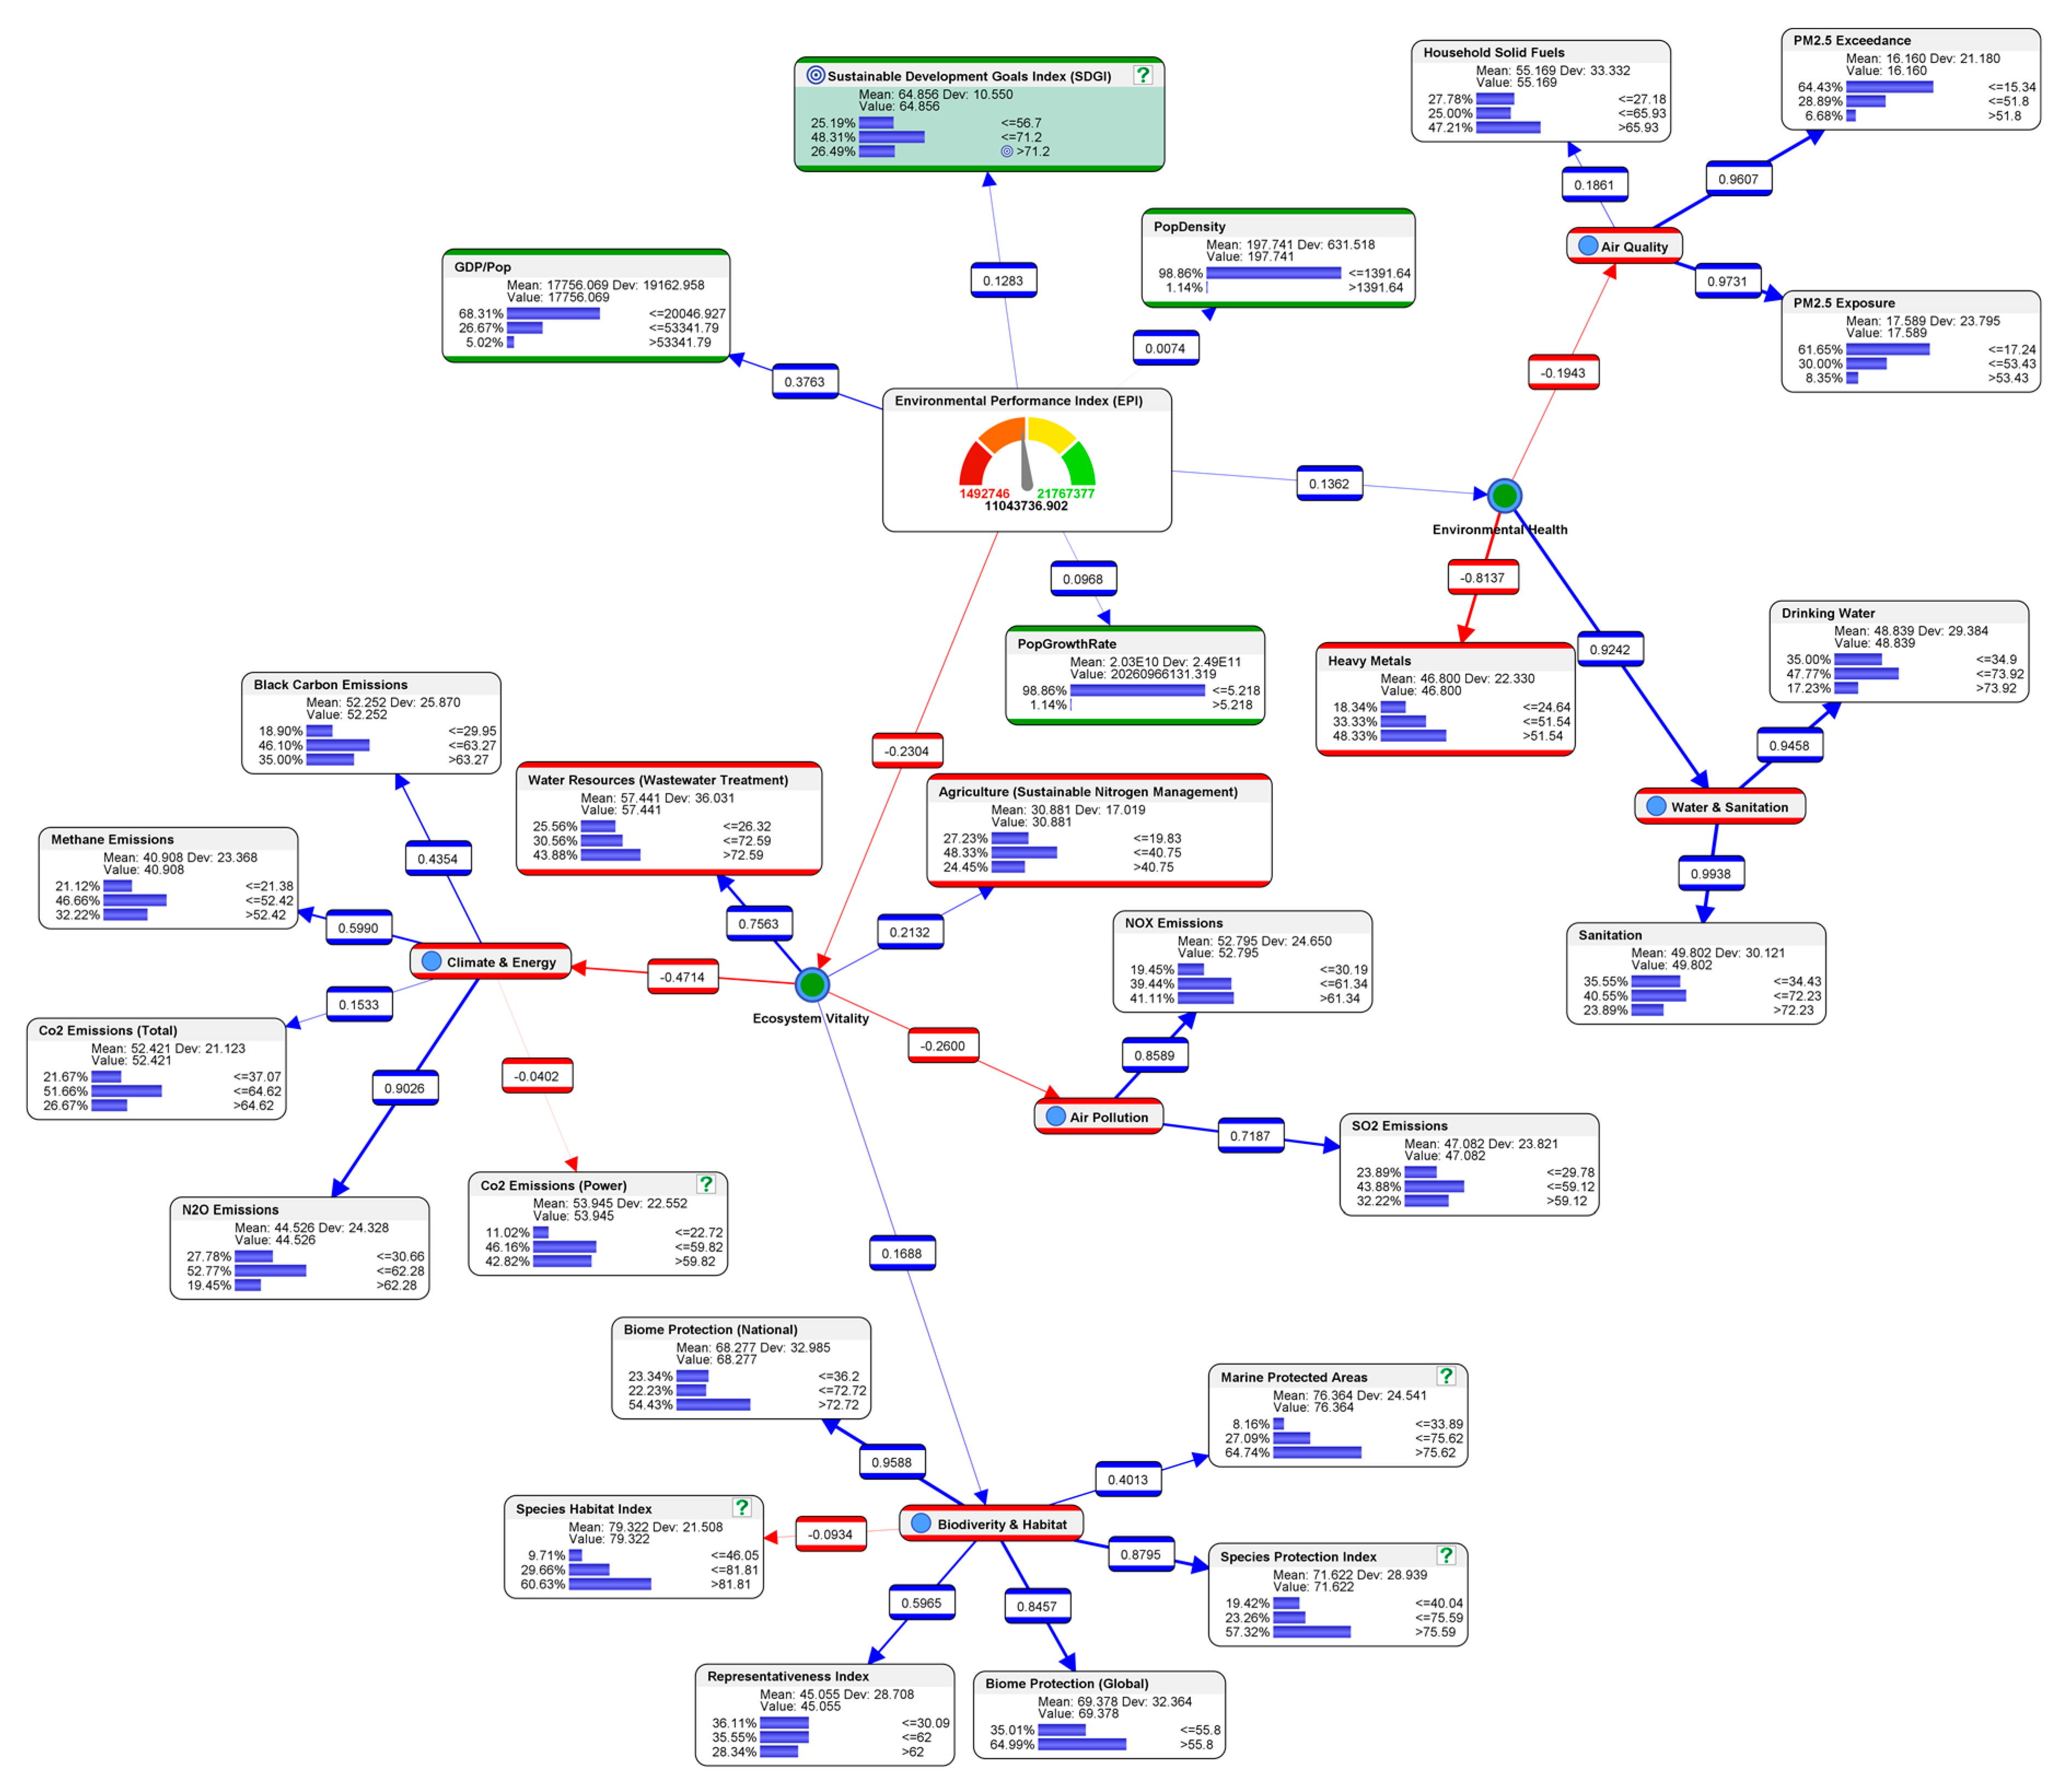
3.3. The Research Model

The main objective of this paper is to illustrate one way for educing AI-Thinking when analysts use AI to analyze data. The purpose of these examples is not to advance the Bayesian Network as the best tool to educe AI-Thinking. Rather, it is to encourage researchers to reflect on the credibility of AI-based analytical techniques in general, as they use AI to discuss and ask further questions about sustainability-related issues with the stakeholders. In other words, raising questions and exploring the possibilities for problem-solving is far more important than trying to obtain a so-called correct answer.
The probabilistic reasoning methods are based upon BN. The Bayesian approach was selected because it is a technique that has been used to model system performance where the concept of the Markov Blanket [45], in conjunction with Response Surface Methodology (RSM) [46,47,48,49] are utilized. It is a proven engineering technique for examining the optimization of the relationships between variables of theoretical constructs, even if they are not physically related.
The current paper proffers an approach which enables the facilitation of discussions pertaining to AI and sustainability-related EPI statistics with the use of descriptive analytics as well as predictive simulations using the data from EPI hosted by the NASA Socioeconomic Data and Applications Center (SEDAC) [50].
In subsequent sections, the detailed BN models generated from sustainability-related EPI statistics will be presented. The current paper proposes a practical Bayesian approach to demonstrate how educators and researchers who are concerned with sustainability—other than computer scientists—could also utilize AI-based tools to explore any possible hidden motif in the data. To introduce the reader to a user-friendly form of AI, a supervised machine learning BN model will be illustrated to achieve the following:

3.3.1. Descriptive Analytics of “What Has Already Happened?”

Purpose: to use descriptive analytics to discover the motifs in the collected data. For descriptive analytics, BN modeling will use the parameter estimation algorithm to detect the data distribution of each column in the dataset automatically. More descriptive statistical methods which will be used to better understand the current baseline conditions of the sustainability-related variables include sensitivity analysis and Pearson correlations.

3.3.2. Predictive Analytics Using “What-If?” Hypothetical Scenarios

Purpose: to use predictive analytics to conduct in-silico experiments with completely controllable parameters in order to predict counterfactual results in the EPI. A Bayesian probabilistic approach will be used to model best-case and worst-case scenarios of EPI levels in order to better inform policy-makers. Counterfactual simulations will be used for predictive analytics to investigate the “behavior” or the “dynamics” of the informational motif. The BN model’s predictive efficiency will be assessed using evaluation techniques such as the gains curve, lift curve, mean reliability, Gini index, lift index, calibration index, the binary log-loss, the correlation coefficient R, the coefficient of determination R2, root mean square error (RSME) and normalized root mean square error (NRSME).
In the subsequent sections, the procedures taken in descriptive analytics to make sense of “what has already happened?” in the collected dataset, will be presented.

3.4. Data Source

The data file used in the current paper is a subset of the EPI’s publicly available sustainability-related indicator statistics dataset [51]. The full dataset containing indicators of sustainability statistics was donated to the public domain by Yale University [52]. The dataset comprised 180 rows and represented data from 180 countries. The categorization of the data in the 2018 EPI dataset are summarized in Table 1. The EPI is a composite index made up of two policy objectives: environmental health and ecosystem vitality, which are in turn spread across ten issue categories. The issue categories of forests and fishery were excluded from the analysis in this paper, because not all 180 countries have forests or fishery. The eight issue categories have 21 indicators among them.

3.5. AI-Based BN Software Used and Pre-Processing of the Data

The software which will be utilized is Bayesialab [53]. Before continuing with the examples in the following sections, a highly recommended pre-requisite activity for the reader is to get acquainted with Bayesialab by downloading and reading the free-of-charge user guide. This provides explanations of the various Bayesialab software tools and functionalities which are too extensive to include in this paper.
The dataset containing sustainability-related EPI indicators was imported into Bayesialab. The first step was to check the data for any irregularities or missing values. If there were missing values in the dataset, researchers could use Bayesialab to predict and fill in the missing values instead of discarding the affected row. Through machine learning, Bayesialab would be able to analyze the overall structural features of that entire dataset before generating the expected values. To predict the missing values, Bayesialab uses Structural EM and Dynamic Imputation algorithms [54]. To demonstrate the capability of how BN could be used for harnessing uncertainty and disorder (e.g., in a situation when there were missing values in a complex dataset), and transforming it to the analyst’s advantage [55], the data was first imported into Bayesialab, in preparation for machine learning analysis. Even though there were some missing values (3.08% of the data), they were predictively filled in by Bayesialab. The Bayesialab program could automatically discretize the continuous data in multiple columns. The algorithm R2-GenOpt used in this example was the optimal discretization approach recommended by Bayesialab. It was a genetic discretization algorithm to maximize the R2 determination coefficient between the discrete variable and its continuous variable [56].

3.6. Overview of the BN Approach Used to Machine-Learn the Data

Before presenting the results of BN’s machine learning method, a brief description of the nomenclature used to describe the BN’s structure is provided here. Nodes (both round dots and round cornered rectangles displaying data distribution histograms) represent variables of interest. These nodes may correspond to symbolic/categorical variables, discrete numerical variables or discretized continuous variables. While BN can handle continuous variables, we are only discussing BN with discrete nodes in this paper because it is more relevant to classify the variables heuristically into high-, mid- and low levels to encourage discussions among stakeholders.
BNs are the visual structures composed of nodes (variables) and arrows (probabilistic relationships). They also referred to as belief networks, causal probabilistic networks and probabilistic influence diagrams. Every node includes the corresponding variable’s data distribution. The arches and arrows between the nodes indicate the likelihood that the variables are associated [57].
Directed links (arrows) could represent information (statistical) or causal dependence among variables. Directions are used to define relationships between parent nodes and child nodes. However, it is important to note that, in the current paper, the presented Bayesian network is the result of probabilistic structural equation modeling (PSEM) that has been machine-learned by Bayesialab. It is not a causal model diagram and, therefore, arrows are not causal; they merely reflect probabilistic relational relationships between the parent nodes and the child nodes.
BN can be used to evaluate the relationships between nodes (variable variables) and the manner (motif or pattern) in which initial probabilities of various input variables of sustainability measures may influence future outcome probabilities of EPI levels.
Conversely, BN can also be used to perform counterfactual speculations on the initial data distribution status in the nodes (variables) given the final outcome. To explain how counterfactual simulations can be applied using BN, examples will be provided in the predictive analytics segments in the context of the current paper. For example, we can simulate these hypothetical scenarios in the BN if we want to find out the conditions of the initial states in the nodes (variables) that would lead to a high probability of achieving low-level EPI.
The relationship between each pair of connected nodes (variables) is determined by their respective Conditional Probability Table (CPT), which is the probability of correlations between the parent node’s data distribution and the child node [58]. Bayesialab can automatically machine-learn the values in the CPT based on the data distribution of each column/variable/node in the dataset. However, if the human user wants to bypass the machine learning program, it is possible to manually input the probability values into the CPT.

4. Results

4.1. Descriptive Analytics: Current State of Global Environmental Performance

Supervised machine learning through a naïve Bayes model (which the easiest for beginner users of AI to understand) is used in this section to examine how input variables could affect the output. To learn more about the characteristics of their pattern or motif, descriptive analytics is first performed on the collected data. Next, predictive analytics will use the motif machine-learned by descriptive analytics to generate simulations of scenarios in silico to predict counterfactual initial conditions. These counterfactual findings can inform stakeholders who are concerned with global sustainability about the conditions which they may like to achieve or avoid. The results of the descriptive analytics are presented in Figure 1 and Table 2.
The results are interpreted as follows. In terms of air quality, there is moderate likelihood (47.21%) of a high level of household solid fuels, low probability (6.68%) of high level of PM2.5 exceedance, and low probability (8.35%) of high level of PM2.5 exposure. In terms of water and sanitation quality, there are higher probabilities of drinking water and sanitization quality (47.77% and 40.55% respectively) to be at the mid-level. However, high lead exposure is likely (48.33%) to occur.
In the biodiversity and habitat category, the probability of having marine protected areas is high (64.74%). Biome protection at the global and national levels are also expected to be above average (with probabilities of 64.99% and 54.43%, respectively). There is no mid-level for biome protection (global) indicator due to the automatic clustering of the data by Bayesialab at the low and high levels only. The Species Habitat Index and Species Protection Index are expected to be at the moderate levels (60.63% and 57.32% probabilities respectively). The probability of Protected Area Representiveness Index is distributed more evenly than the other indicators at the low, mid-, and high levels (36.11%, 35.55% and 28.34% respectively).
In terms of climate and energy, CO2, methane, N2O, and black carbon emissions are most likely to be at the mid-levels (51.66% for CO2 (total), 46.16% for CO2 (power), 46.66% for methane, 52.77% for N2O, 46.10% for black carbon). However, NOX emission (39.44% and 41.11% for mid- and high levels, respectively) and SO2 emission (43.88% and 32.22% for mid- and high levels, respectively) is expected to be above the mid-level. Wastewater treatment (43.88% probability at the high level) is expected to be more prevalent than sustainable nitrogen management (48.33% probability at the mid-level).
The answer to RQ1 is as follows: The EPI indicators that performed well in the base case include low levels of PM2.5 exposure and exceedance, high number of marine protection areas, high biome protection levels (both global and national), high Species Habitat Index, high Species Protection Index and high prevalence of wastewater treatment. However, the usage of household solid fuels and lead exposure would call for the most attention, due to the high likelihood of high levels of occurrence in these two areas. Other areas that needed to be improved include drinking water and sanitization quality, harmful emissions (CO2, methane, black carbon emissions, NOX and SO2) and sustainable nitrogen management.

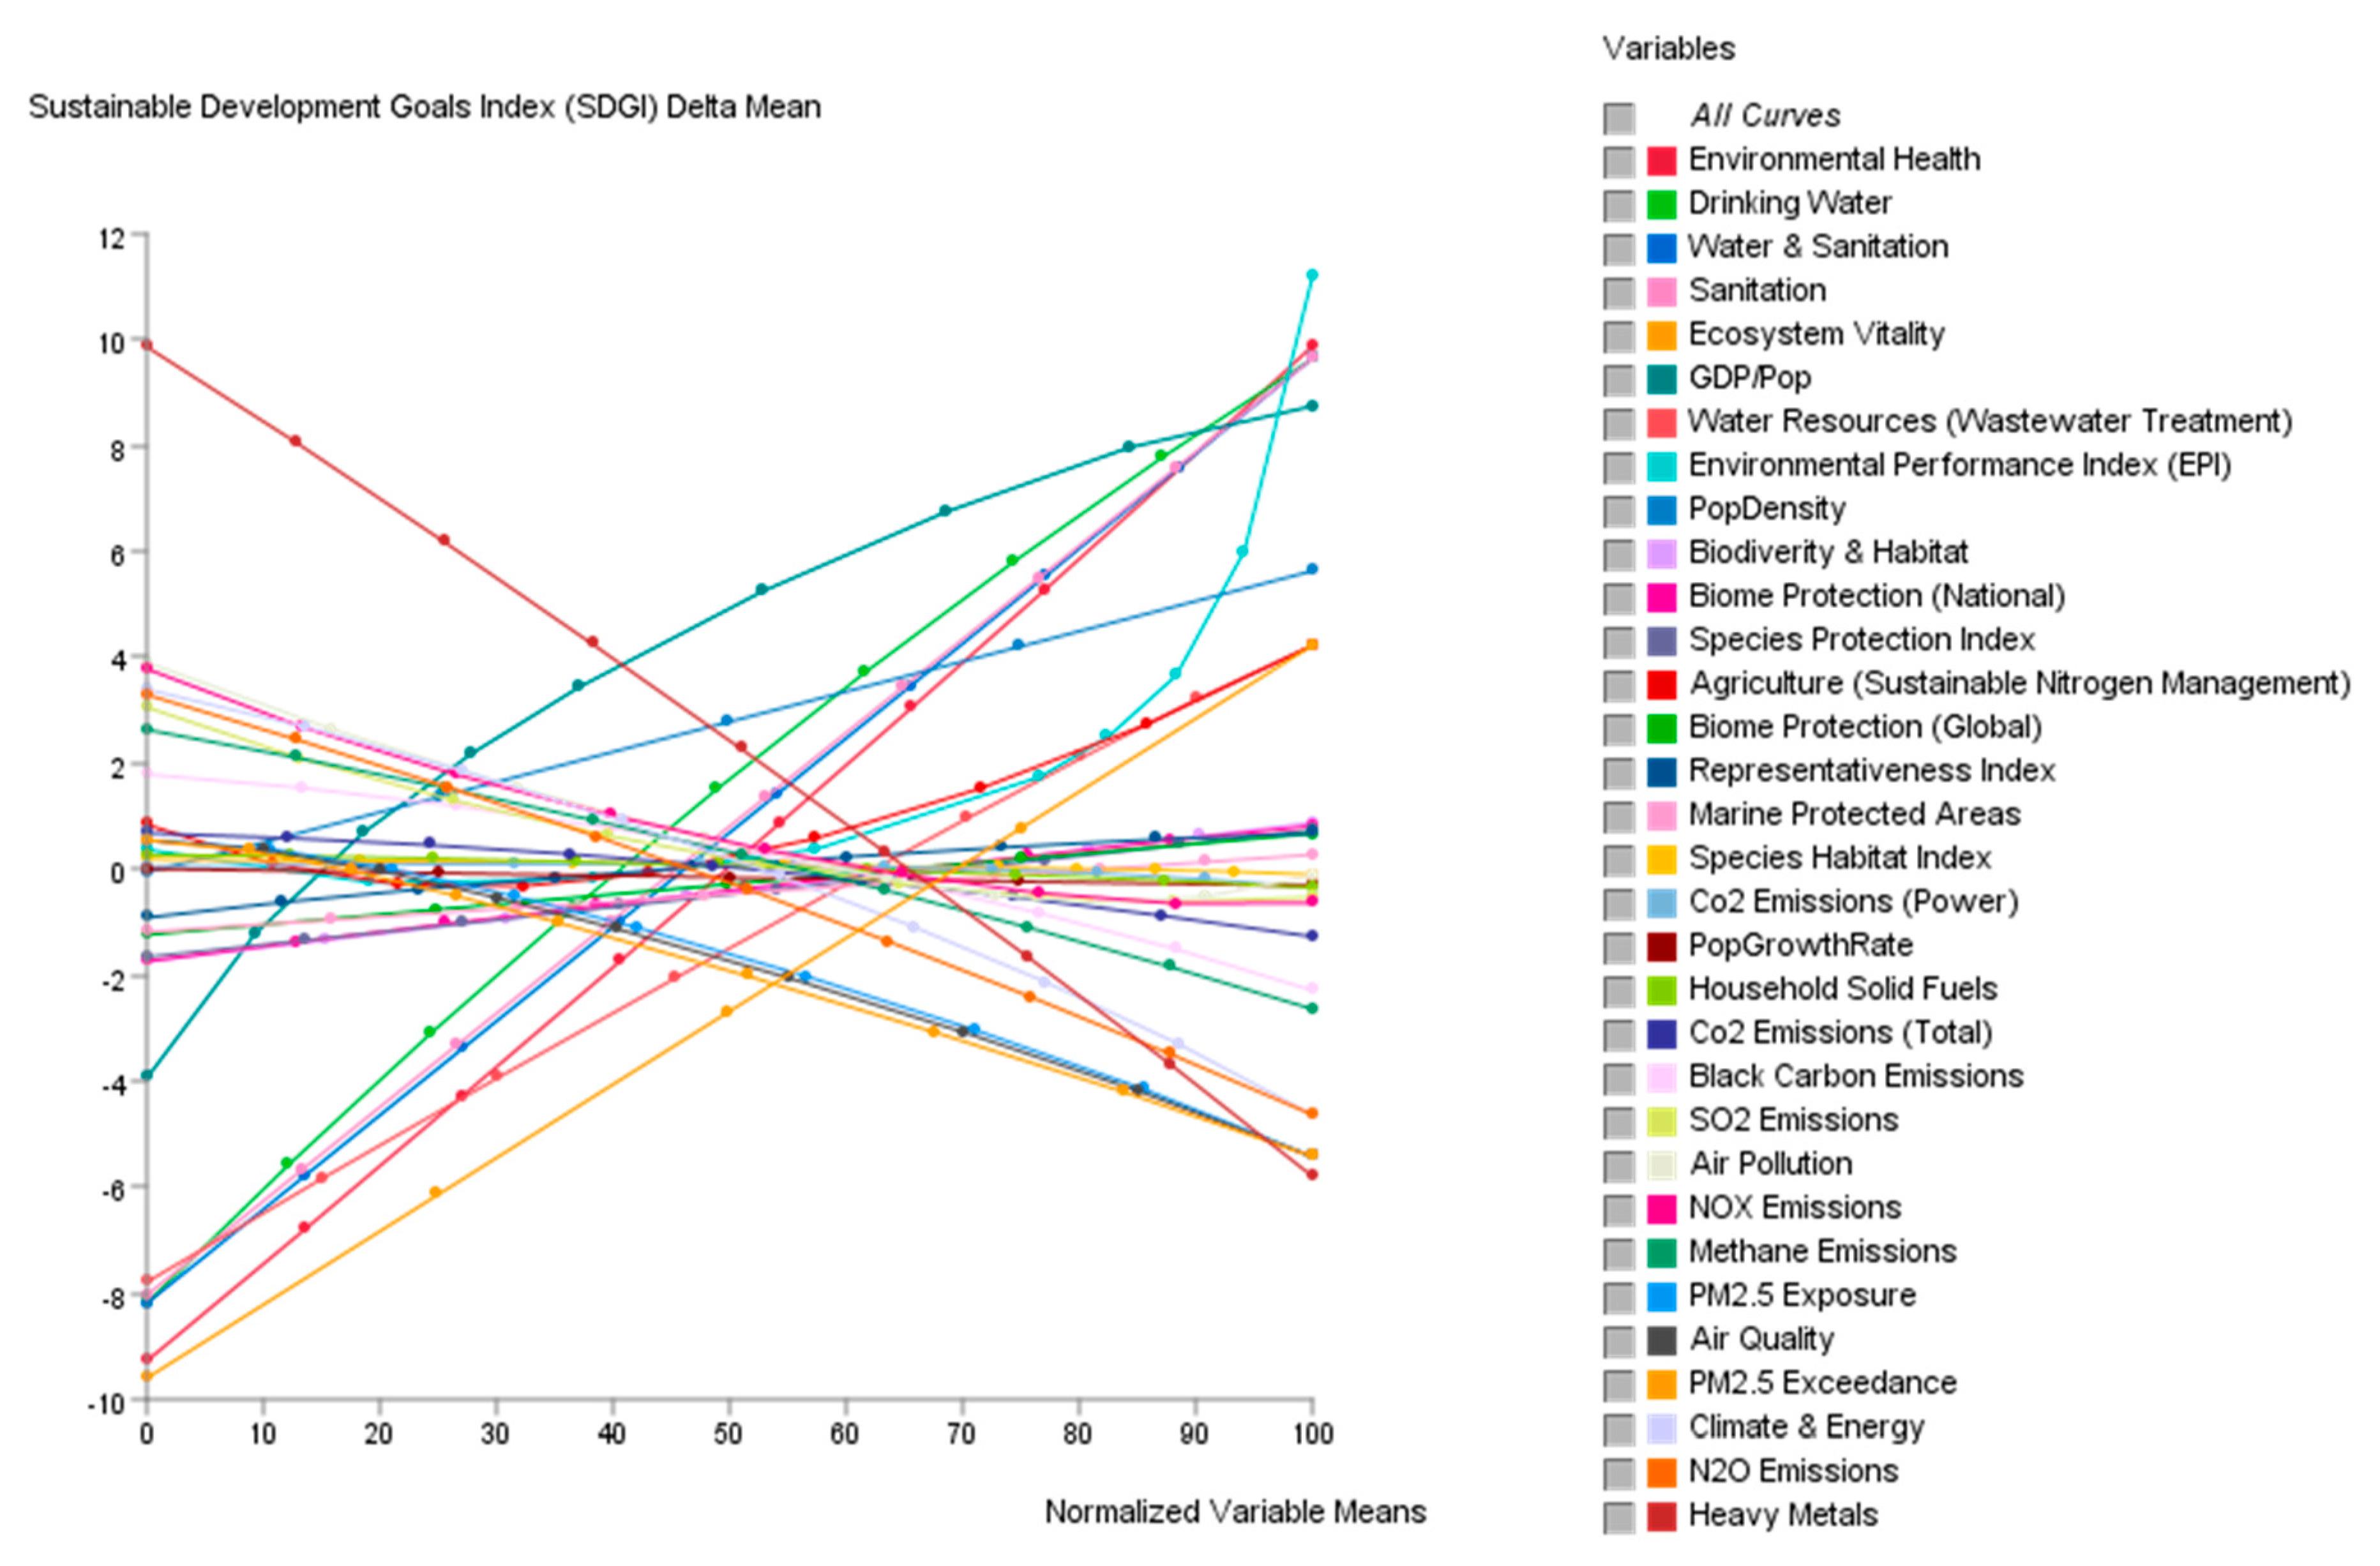
4.2. Mean-Target Total Effects Analysis

To exploratively visualize the influence of the variables on the target node in the BN, the Total Effects tool in Bayesialab can be used. As observed in Figure 2, the plots of the total effects of the sustainability-related variables on the target node (the outcome of the SDGI level) suggest that their relationships are either linear or curvilinear. Here is where BN excels in calculating the probabilities of how the linear or curvilinear data from the variables might influence the outcome of the percentage of number of people who are malnourished, because the concept of the Markov Blanket [45], in conjunction with Response Surface Methodology (RSM) [46,47,48,49] are utilized for examining the optimization of relations between variables in the computational model.

4.3. Sensitivity Analysis

Sensitivity analysis is used to reveal the variables that are most impacted under conditions of uncertainty, and the results enable the analyst to focus on the most important indicators. A tornado chart (see Figure 3) was generated by Bayesialab to visualize the factors that might drive the largest impact (either positively or negatively) towards achieving the SDGI. The red bars represent the sensitivity of the variables which contribute to low SDGI (defined as, e.g., 56.7); the green bars represent the sensitivity of the variables which contribute to mid-level SDGI (defined as between 56.7 and 71.2); the blue bars represent the sensitivity of the variables which contribute to high SDGI (defined as ≥71.2). The longer horizontal bars require more attention while the shorter ones do not.
To make it easier for the analyst to see the factors that contributed the largest impact to a high SDGI, the focus is turned to only the blue bars (see Figure 4). The results suggest the quality of drinking water, sanitization and heavy metals exposure, which come under the environmental health policy objective, could potentially contribute to a high SDGI score.
Turning the focus to red bars only, the factors contributing the largest impact to a low SDGI can be observed (see Figure 5). The results suggest that priority attention should be given to improve the quality of drinking water, sanitization and heavy metals exposure, which are under the environmental health policy objective, as well as wastewater treatment under the ecosystem vitality policy objective. An interesting observation is the significance of the three indicators, the quality of drinking water, sanitization and heavy metals exposure, as they could contribute to both high and low SDGI.

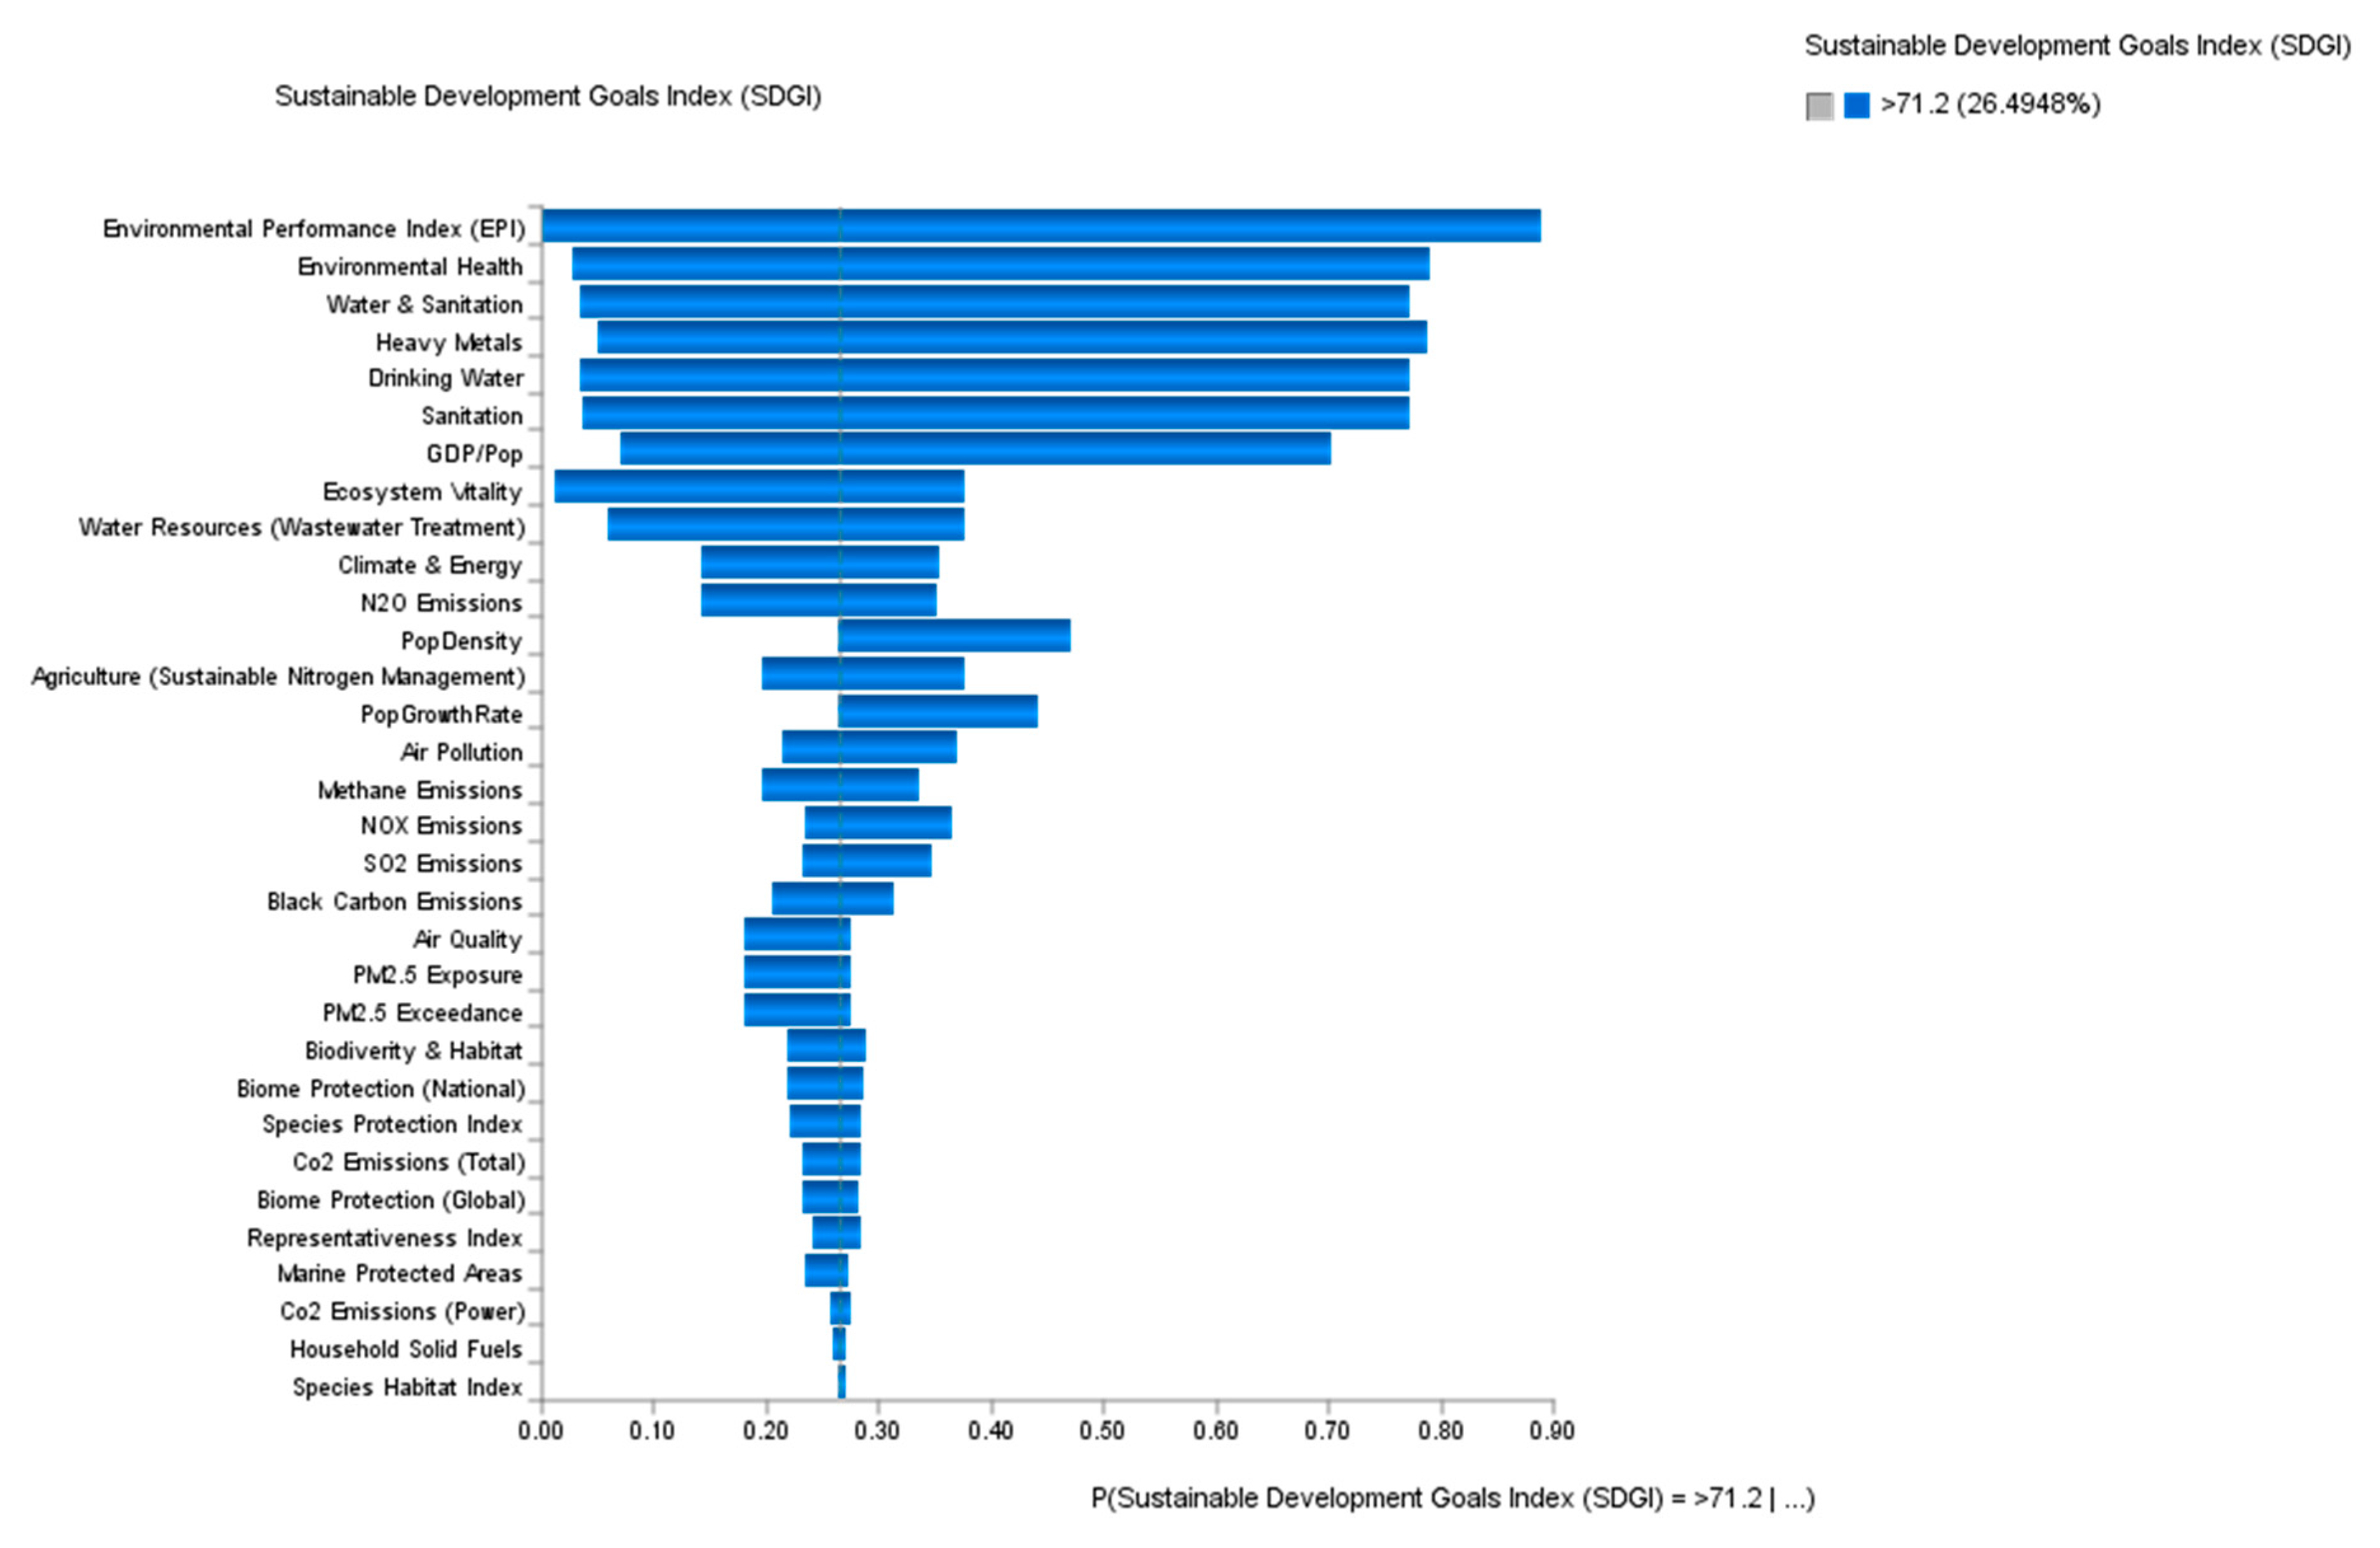
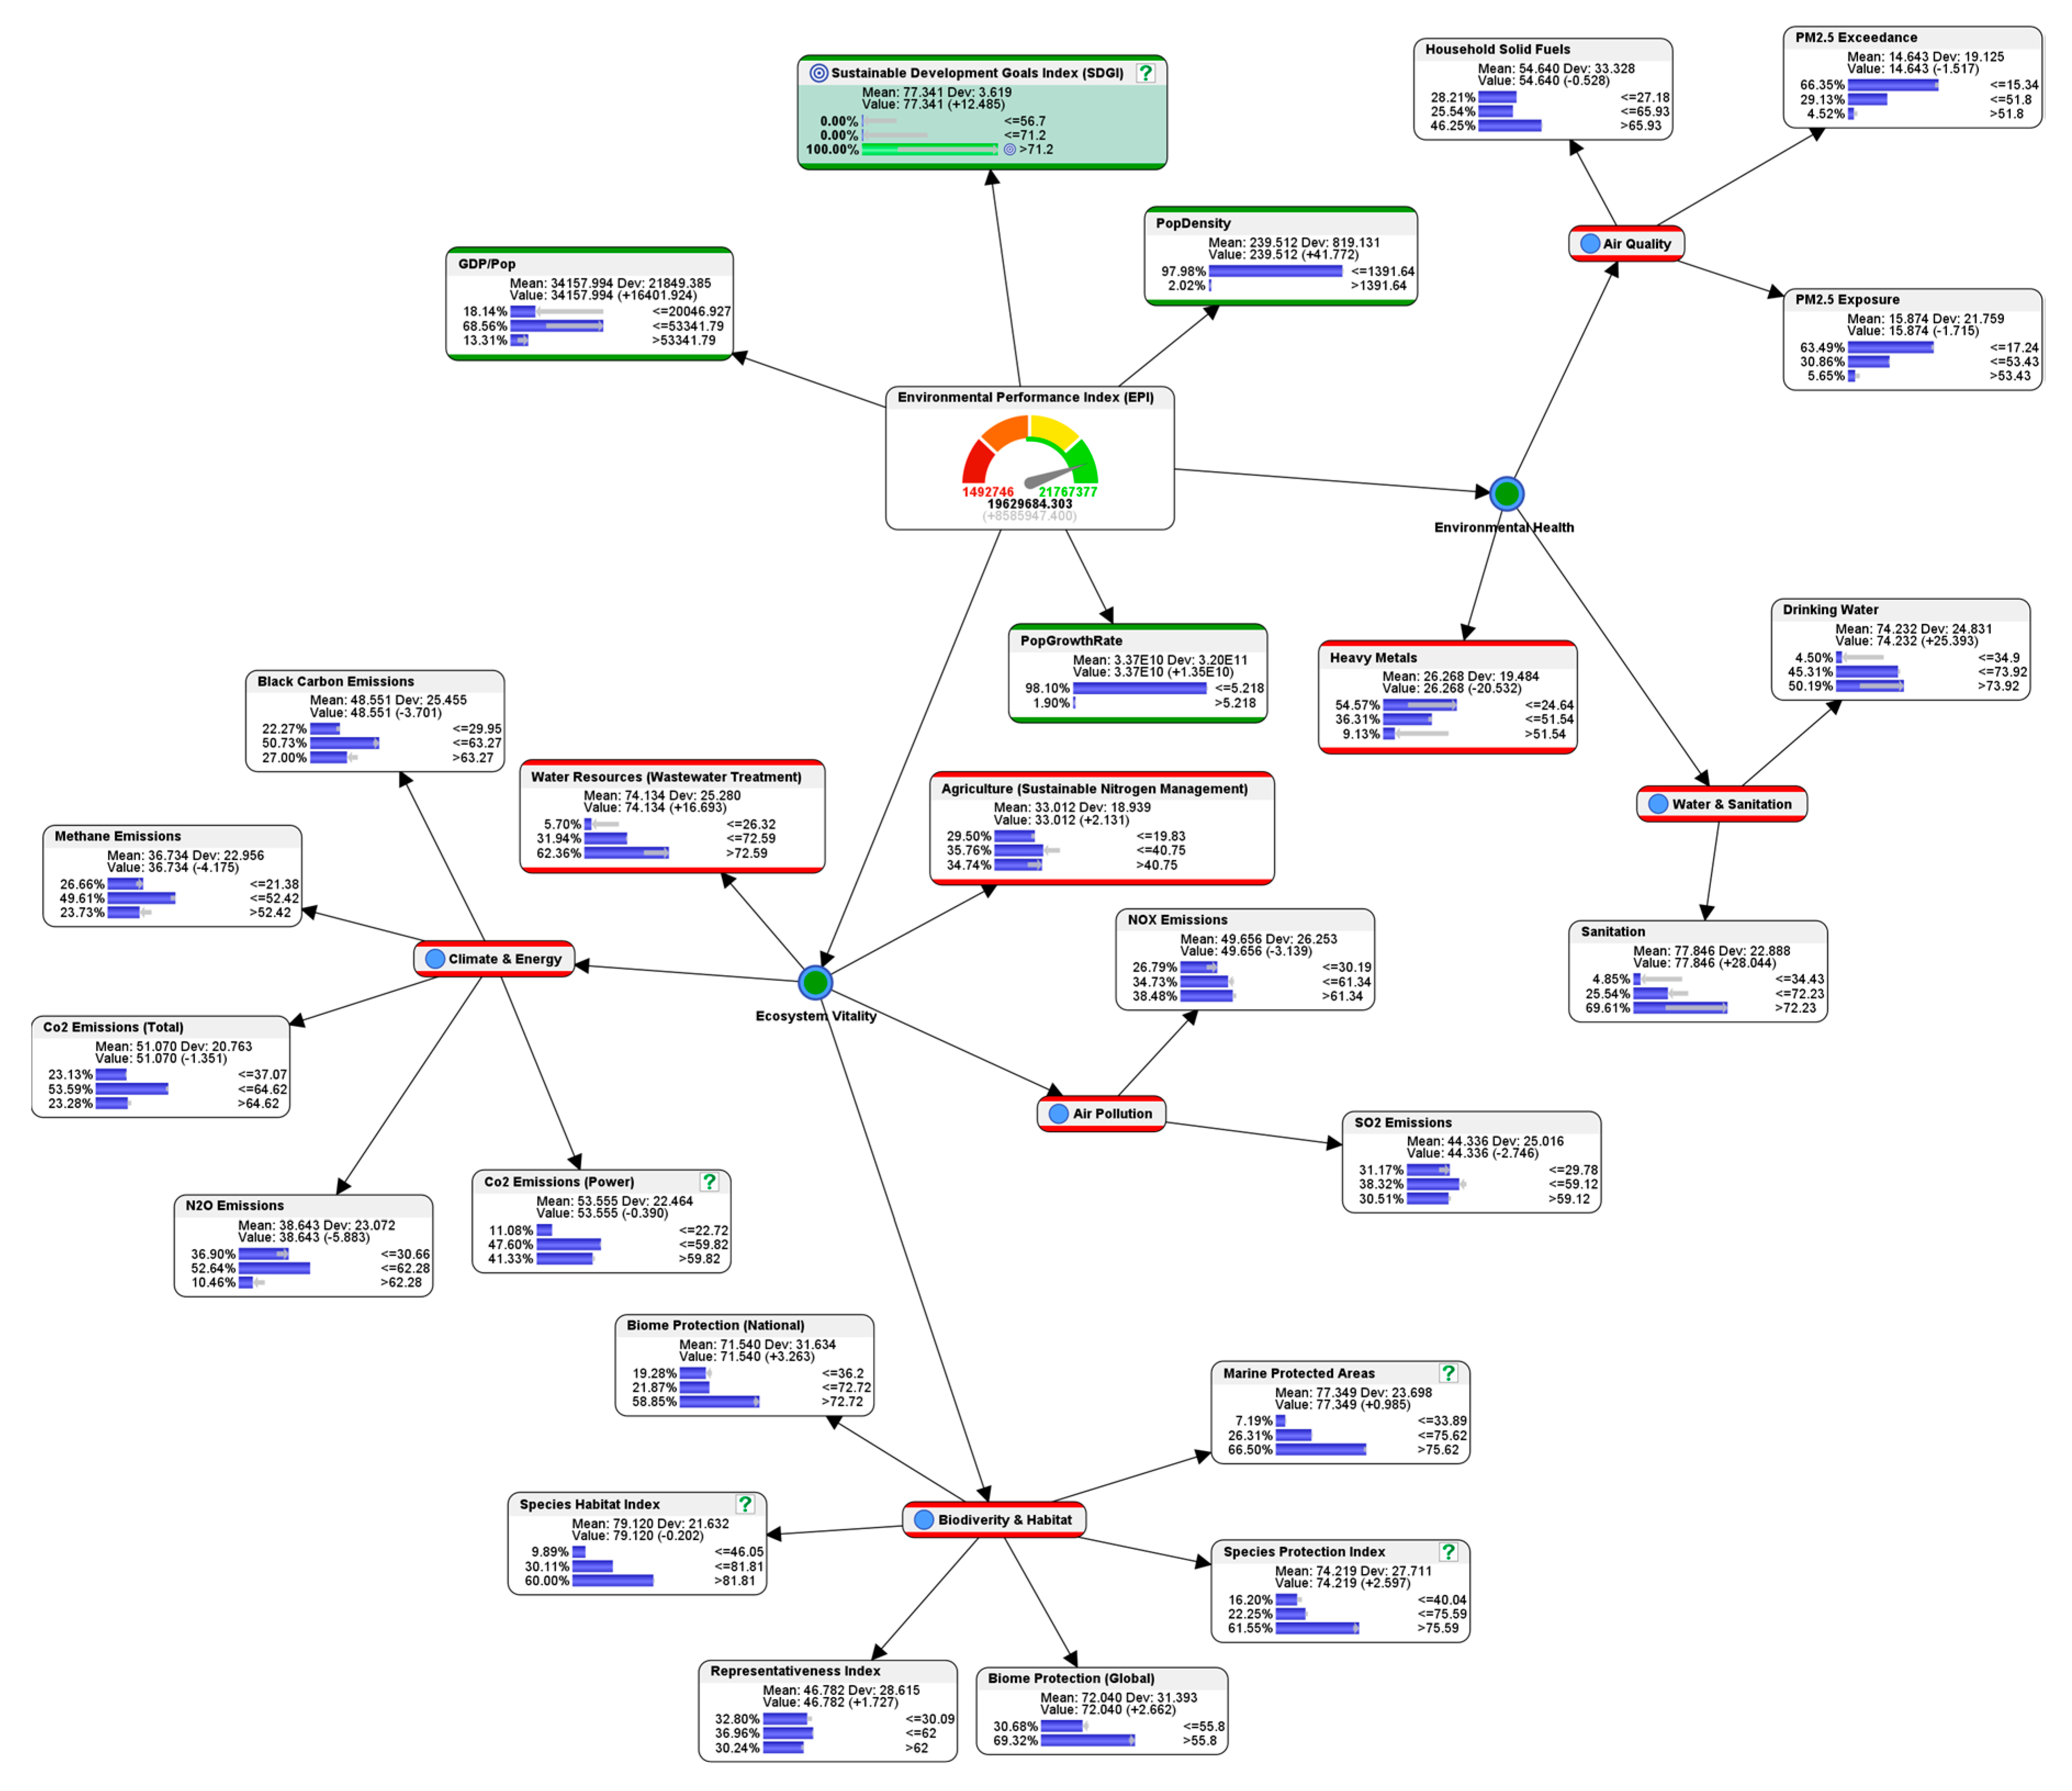
4.4. Predictive Analytics: What If We Want to Achieve High-Level SGDI?

To simulate the best-case scenario (see Figure 6), hard evidence was applied to the node Sustainable Development Goals Index (SDGI) in Bayesialab, so that 0% of the countries is at the low level (defined as e.g., 56.7) compared to the original 25.19%; 0% at the mid-level (defined as e.g., 71.2) compared to the original 48.31%; and 100% is at the high level (defined as >71.2) compared to the original 26.49%. The results of the best-case scenario are presented in Table 3.
The results of the best-case scenario are interpreted as follows. Exposure to heavy metal is expected to reduce significantly (from 48.33% probability to 9.13% at the high level). Significant improvement is also expected on the quality of drinking water (from 17.23% to 50.19% probability) and sanitization (from 23.89% to 69.61%). Wastewater treatment and sustainable nitrogen management would have moderate improvements (10%–20% change in probabilities).
There are only slight changes (less than 10% change in probabilities) in the household use of solid fuels, PM2.5 exposure and exceedance, marine protection areas, biome protection (global and national), Species Habitat Index, Protected Area Representiveness Index and emissions of CO2 (both total and from power), methane, black carbon, SO2, NOX and N2O.
The answer to RQ2 is as follows: Under the best-case scenario, the EPI indicators that performed well (with probabilities above 50% at the high level) include drinking water, sanitization, marine protected areas, biome protection (global and national), Species Protection Index, Species Habitat Index and wastewater treatment. Exposure to lead and PM2.5 air particles would be minimal (with probabilities below 10% at the high level). At this juncture, instead of totally trusting the counterfactual results generated by the AI, it would be an example of an opportunity where AI-Thinking can be educed. As a suggestion, sustainability analysts might like to consider asking further questions by perusing the works of other sustainability researchers (e.g., see [59,60,61,62,63]).

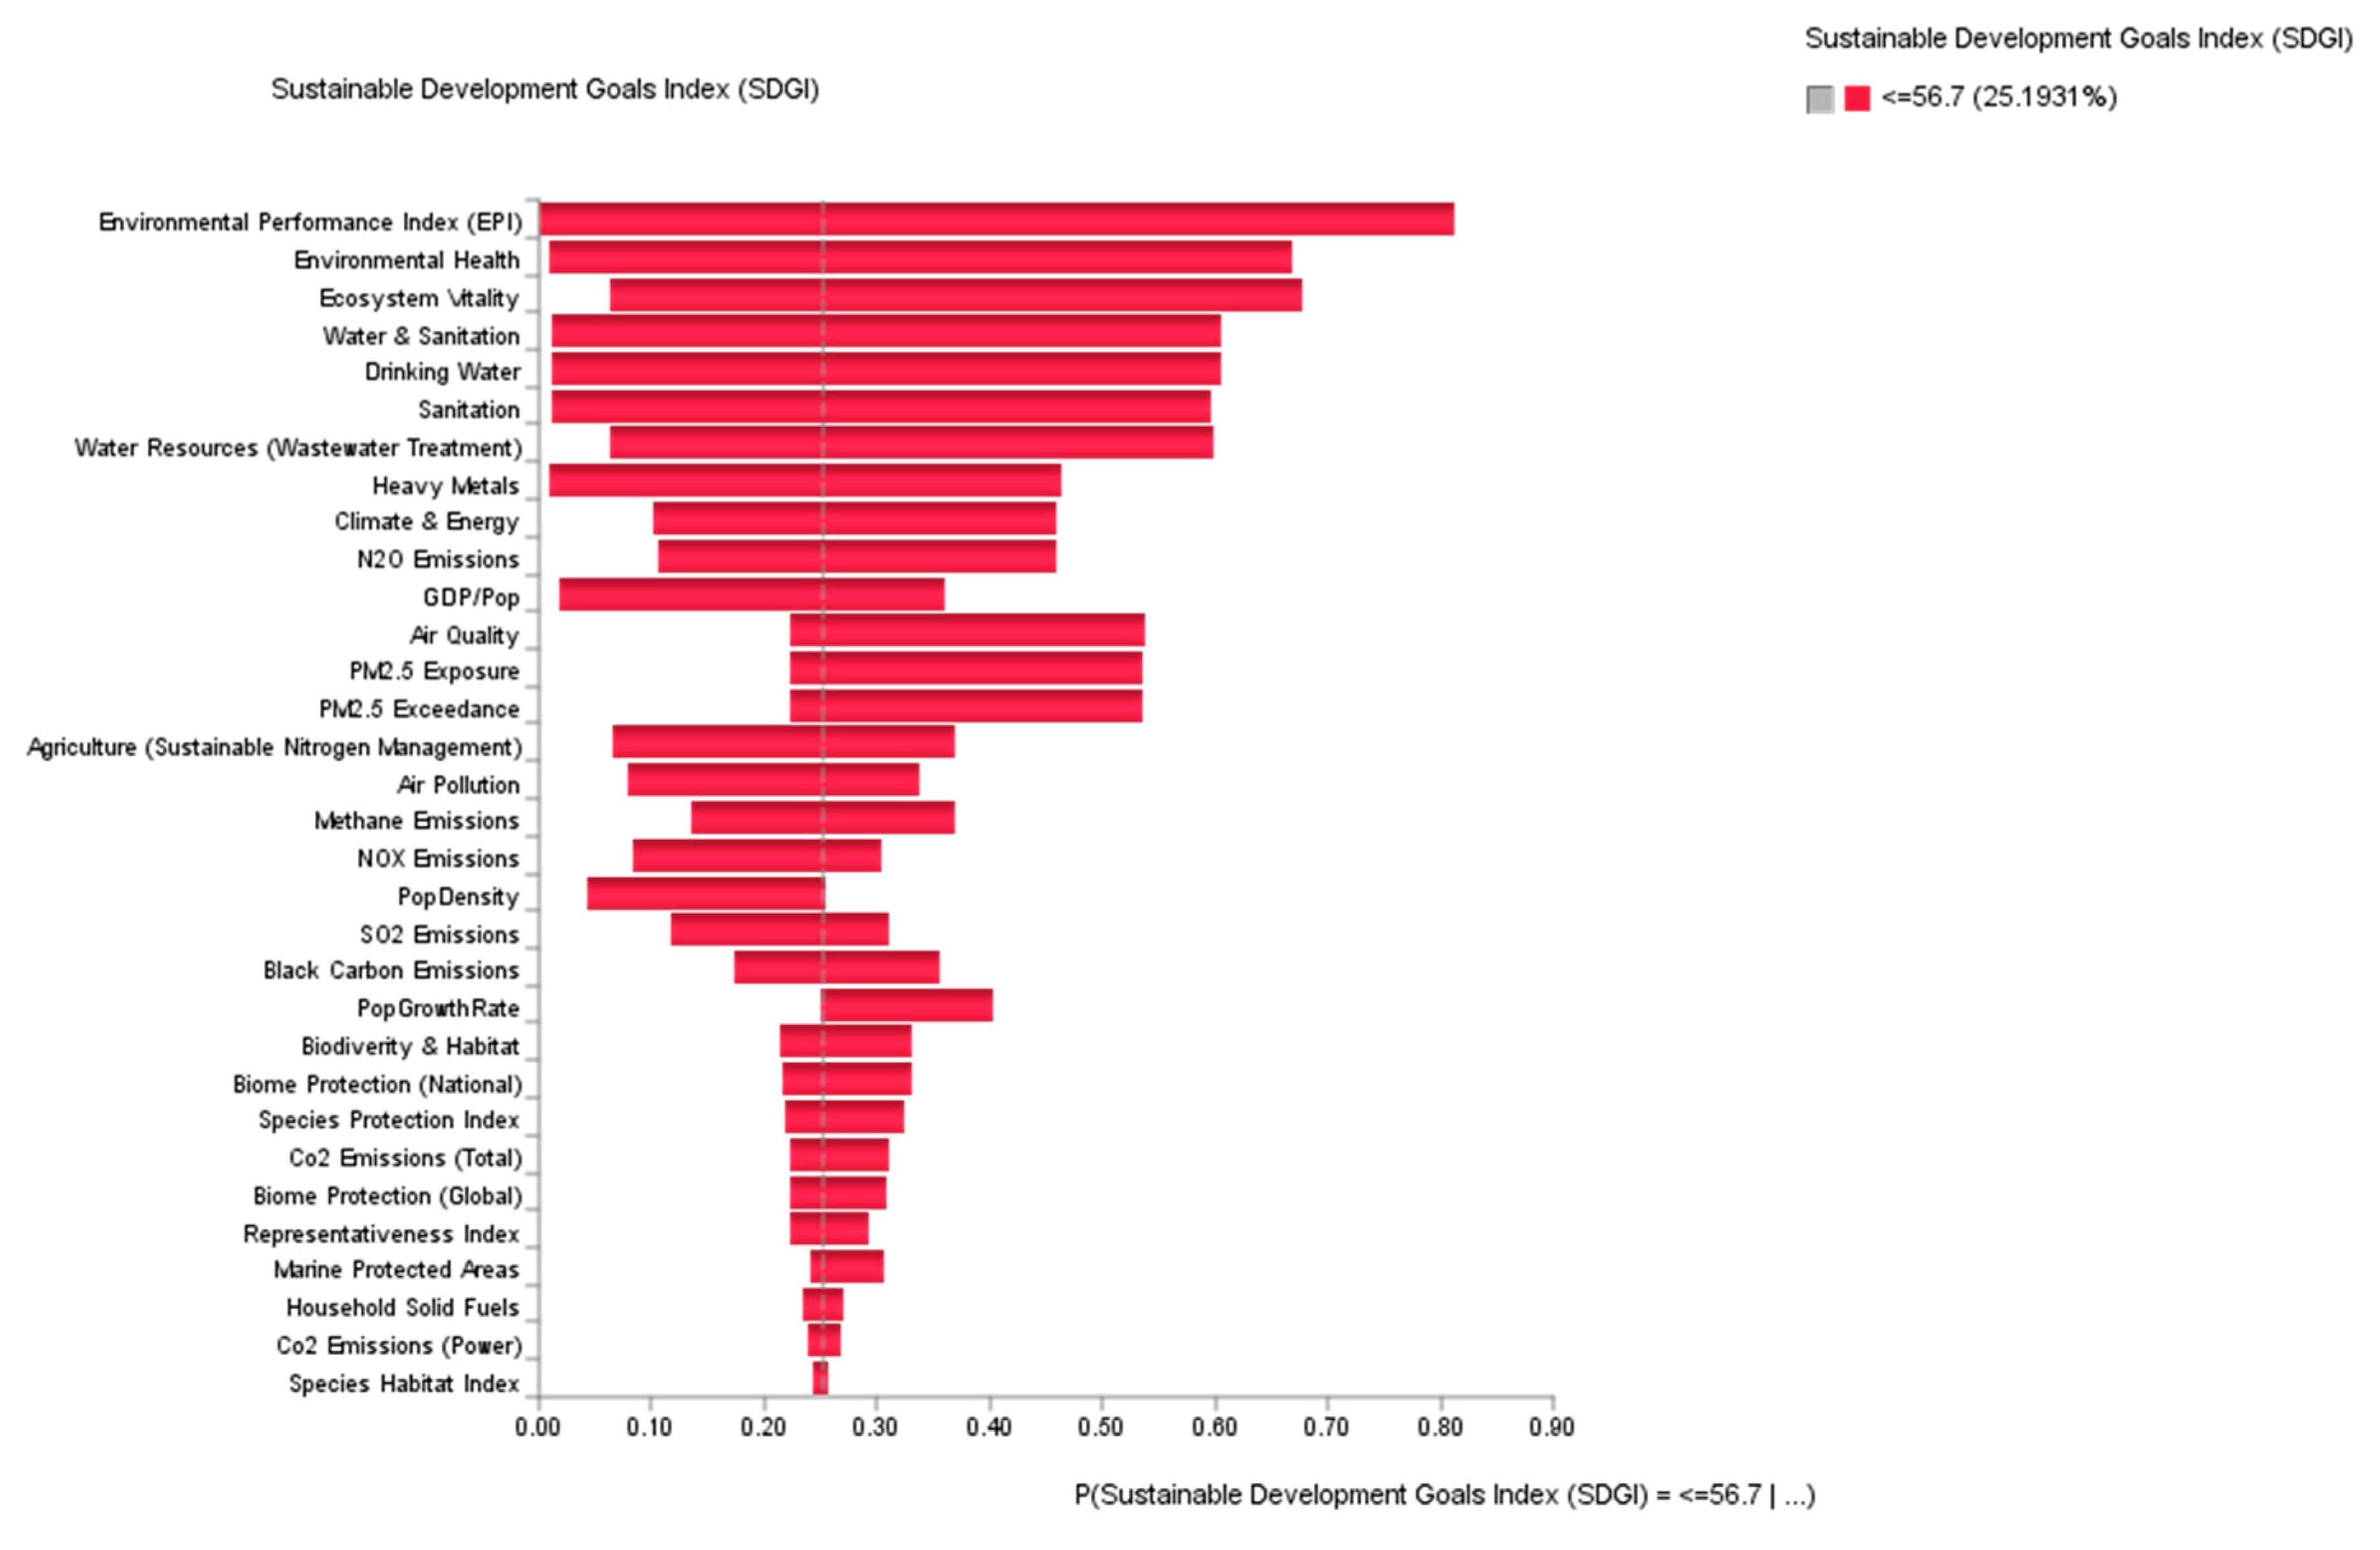
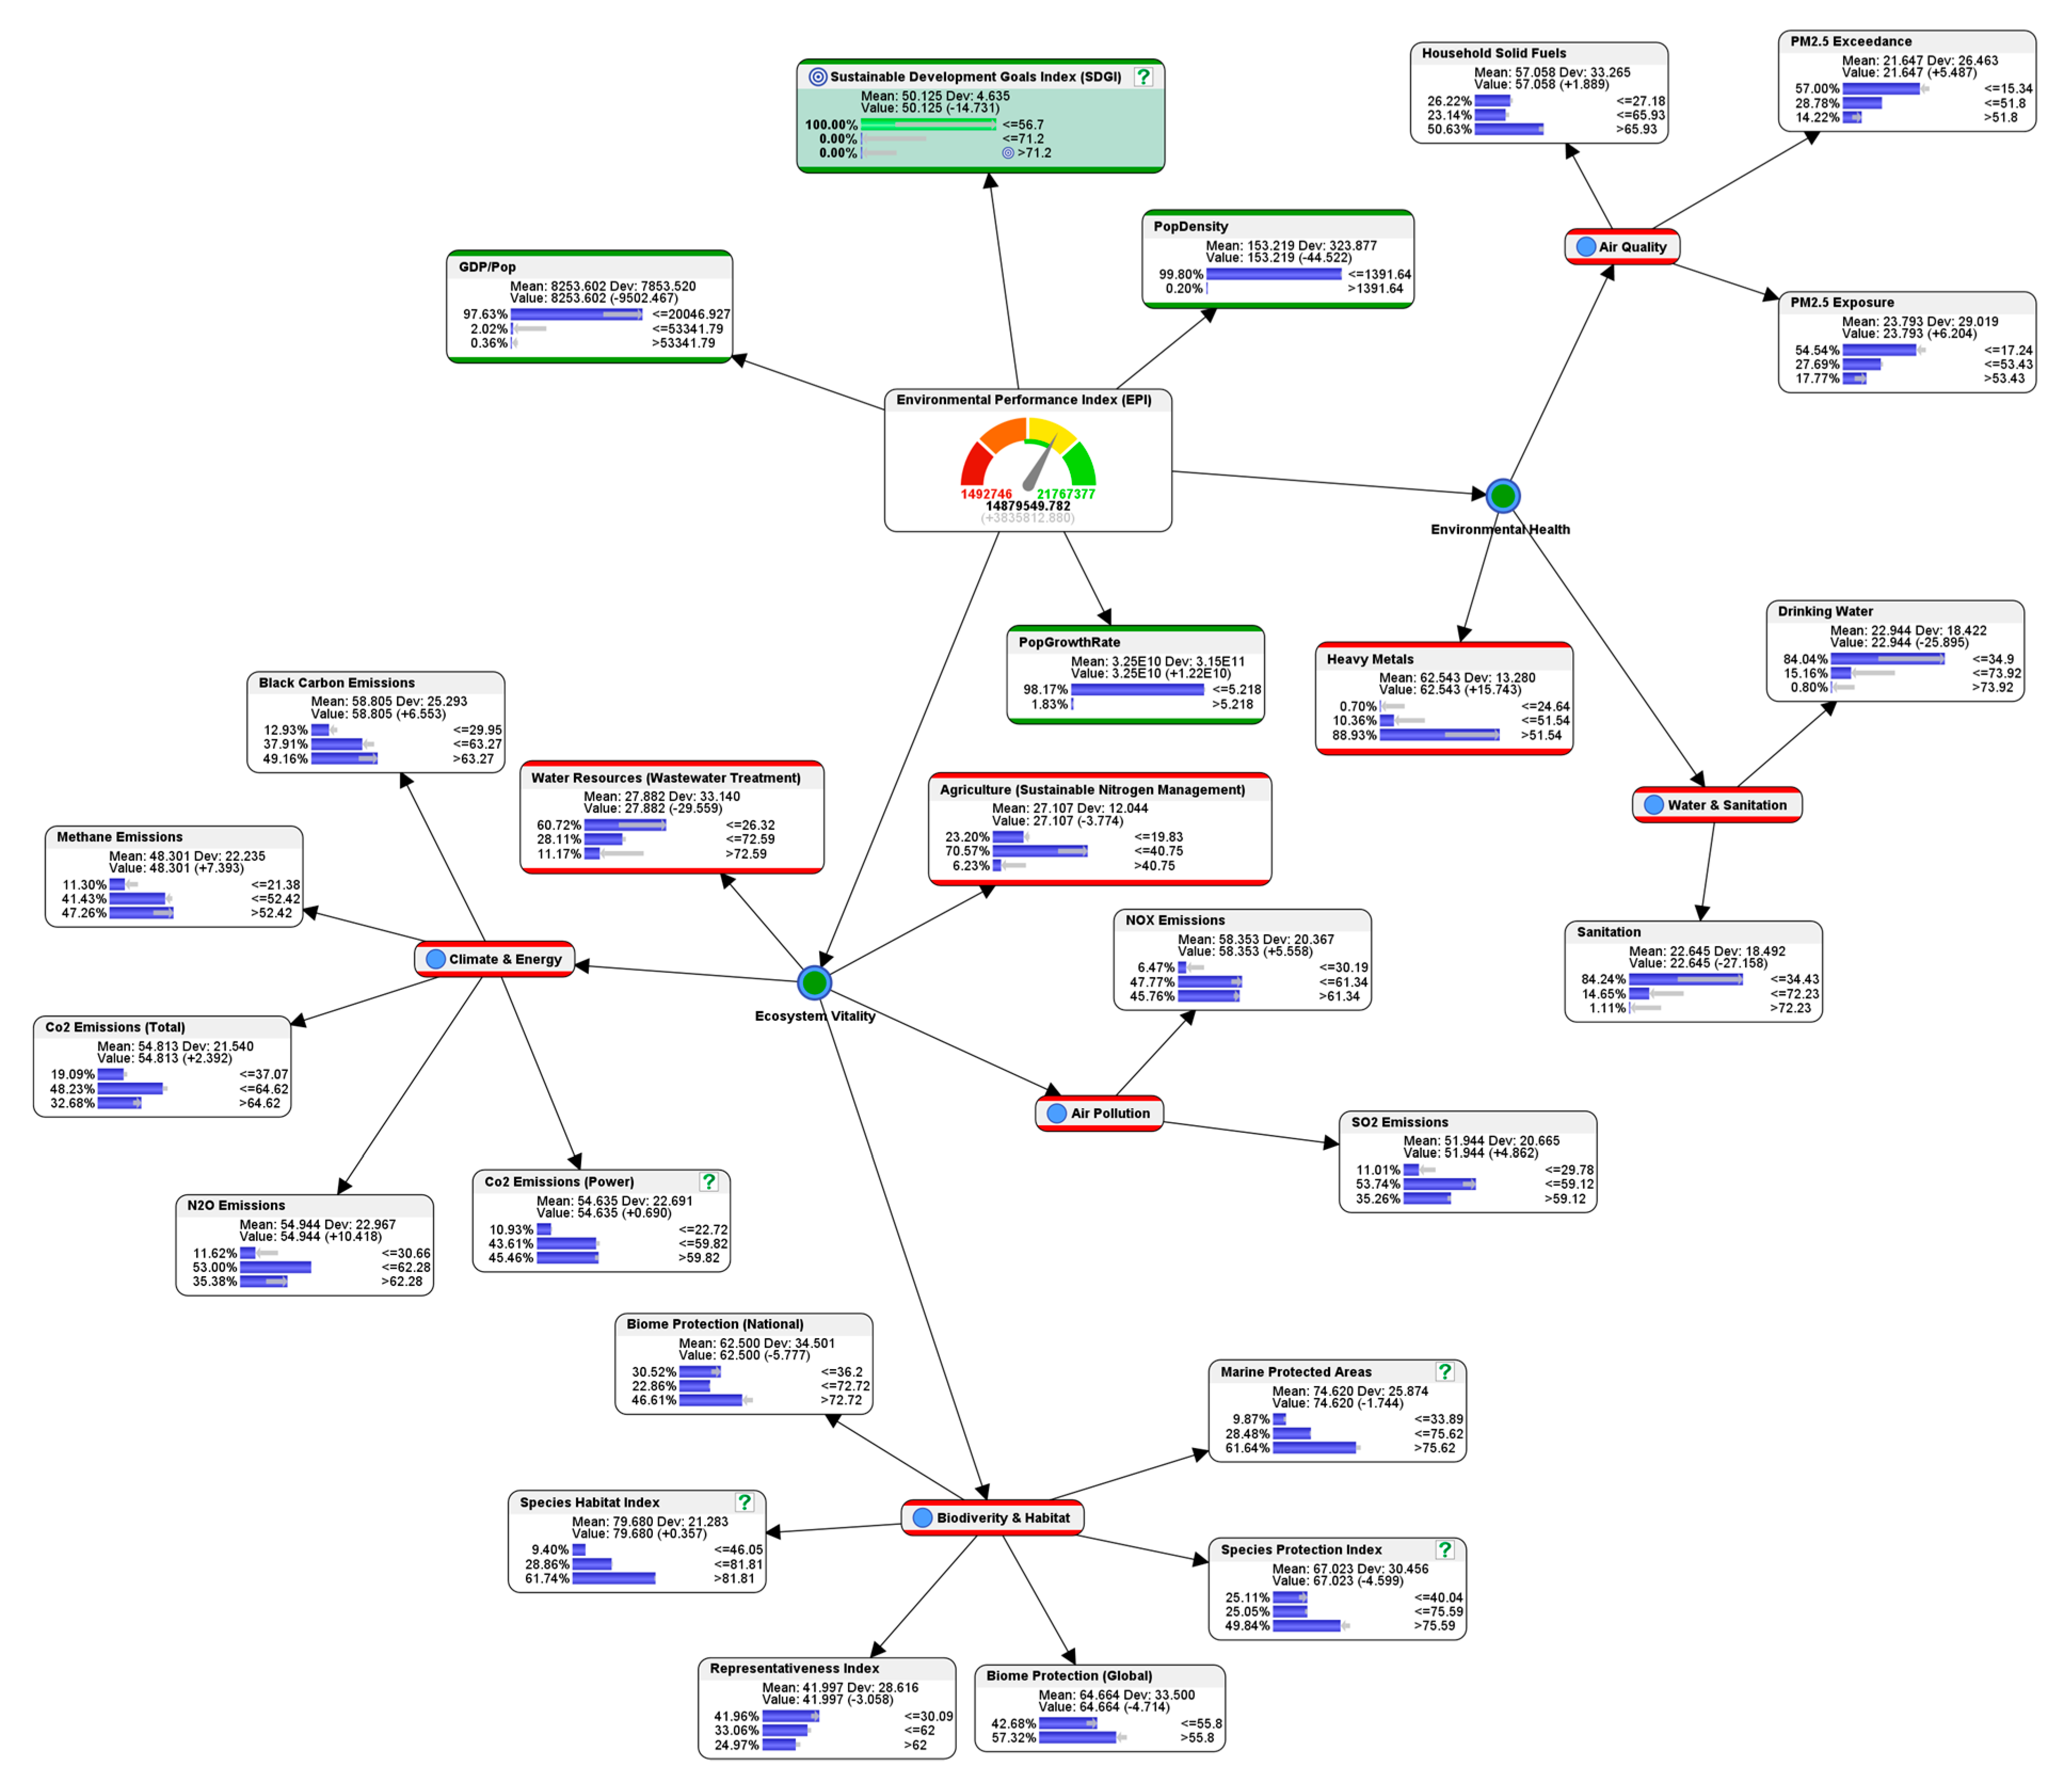
4.5. Predictive Analytics: What Are the Conditions to Avoid in Order to Prevent the Worst-Case Scenario from Happening?

To simulate the worst-case scenario, hard evidence was applied to the node Sustainable Development Goals Index (SDGI), so that 100% of the countries is at the low level (defined as, e.g., 56.7) compared to the original 25.19%; 0% is at the mid-level (defined as, e.g., 71.2) compared to the original 48.31%; and 0% is at the high level (defined as >71.2) compared to the original 26.49%. Figure 7 and Table 4 present the results of the worst-case scenario.
The results of the worst-case scenario are interpreted as follows. The quality of drinking water and sanitization are very likely to be poor (84.04% and 84.24% probabilities, respectively), and lead exposure is likely high (88.93% probability). Moderate changes are expected for PM2.5 exposure and exceedance, biome protection (global and national), Species Protection Index, Protected Area Representiveness Index, harmful emissions (CO2 (total), methane, N2O, black carbon and NOx) and sustainable nitrogen management. Indicators that would have marginal changes (less than 10% change in probabilities) are the number of marine protected areas, Species Habitat Index, emissions of CO2 (power) and SO2.
The answer to RQ3 is as follows. Under the worst-case scenario, the EPI indicators that performed poorly are quality of drinking water, sanitization and wastewater treatment (with probabilities above 50% at the low level). The usage of household solid fuels and lead exposure are expected to be the worst (with probabilities above 50% at the high level).
In addition to sensitivity analysis, Table 5 shows the comparison of best- and worst-case for each of the three levels.
The results suggest significant differences for the quality of drinking water and sanitization, lead exposure (>70% at the low level), and wastewater treatment (around 50% at the high level). On the other hand, it is observed that there is negligible difference (less than 5% difference in probabilities) for these indicators: household solid fuels, the number of marine protected areas, Species Habitat Index and CO2 Emissions (power). Here would be another example of an opportunity to educe AI-Thinking in the analysts. Rather than unquestioningly relying on the counterfactual results produced by the AI-based method, the analysts may like to peruse the work of other sustainability researchers or AI researchers (e.g., see [64,65,66,67,68]), and in turn, ask even more meaningful questions.

4.6. Evaluation of the Predictive Performance of the Bayesian Network Model

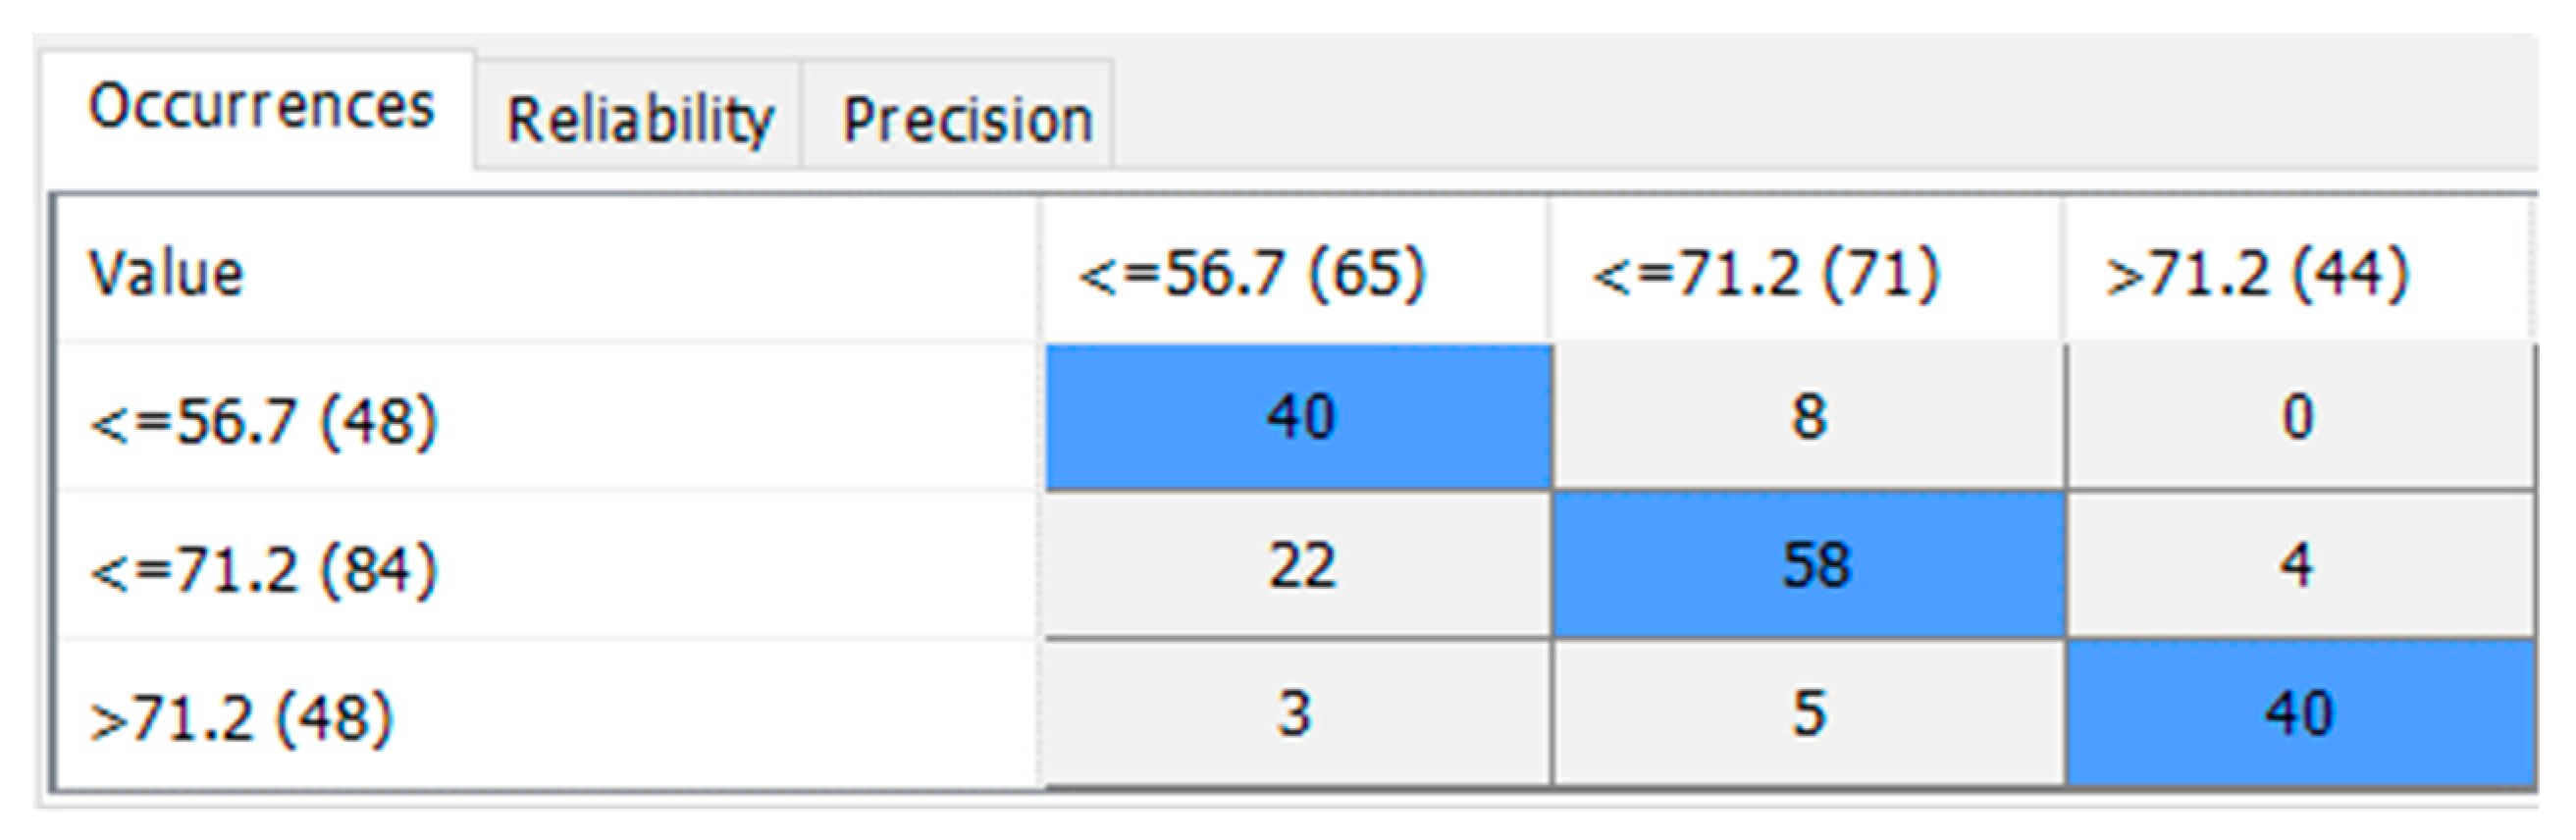
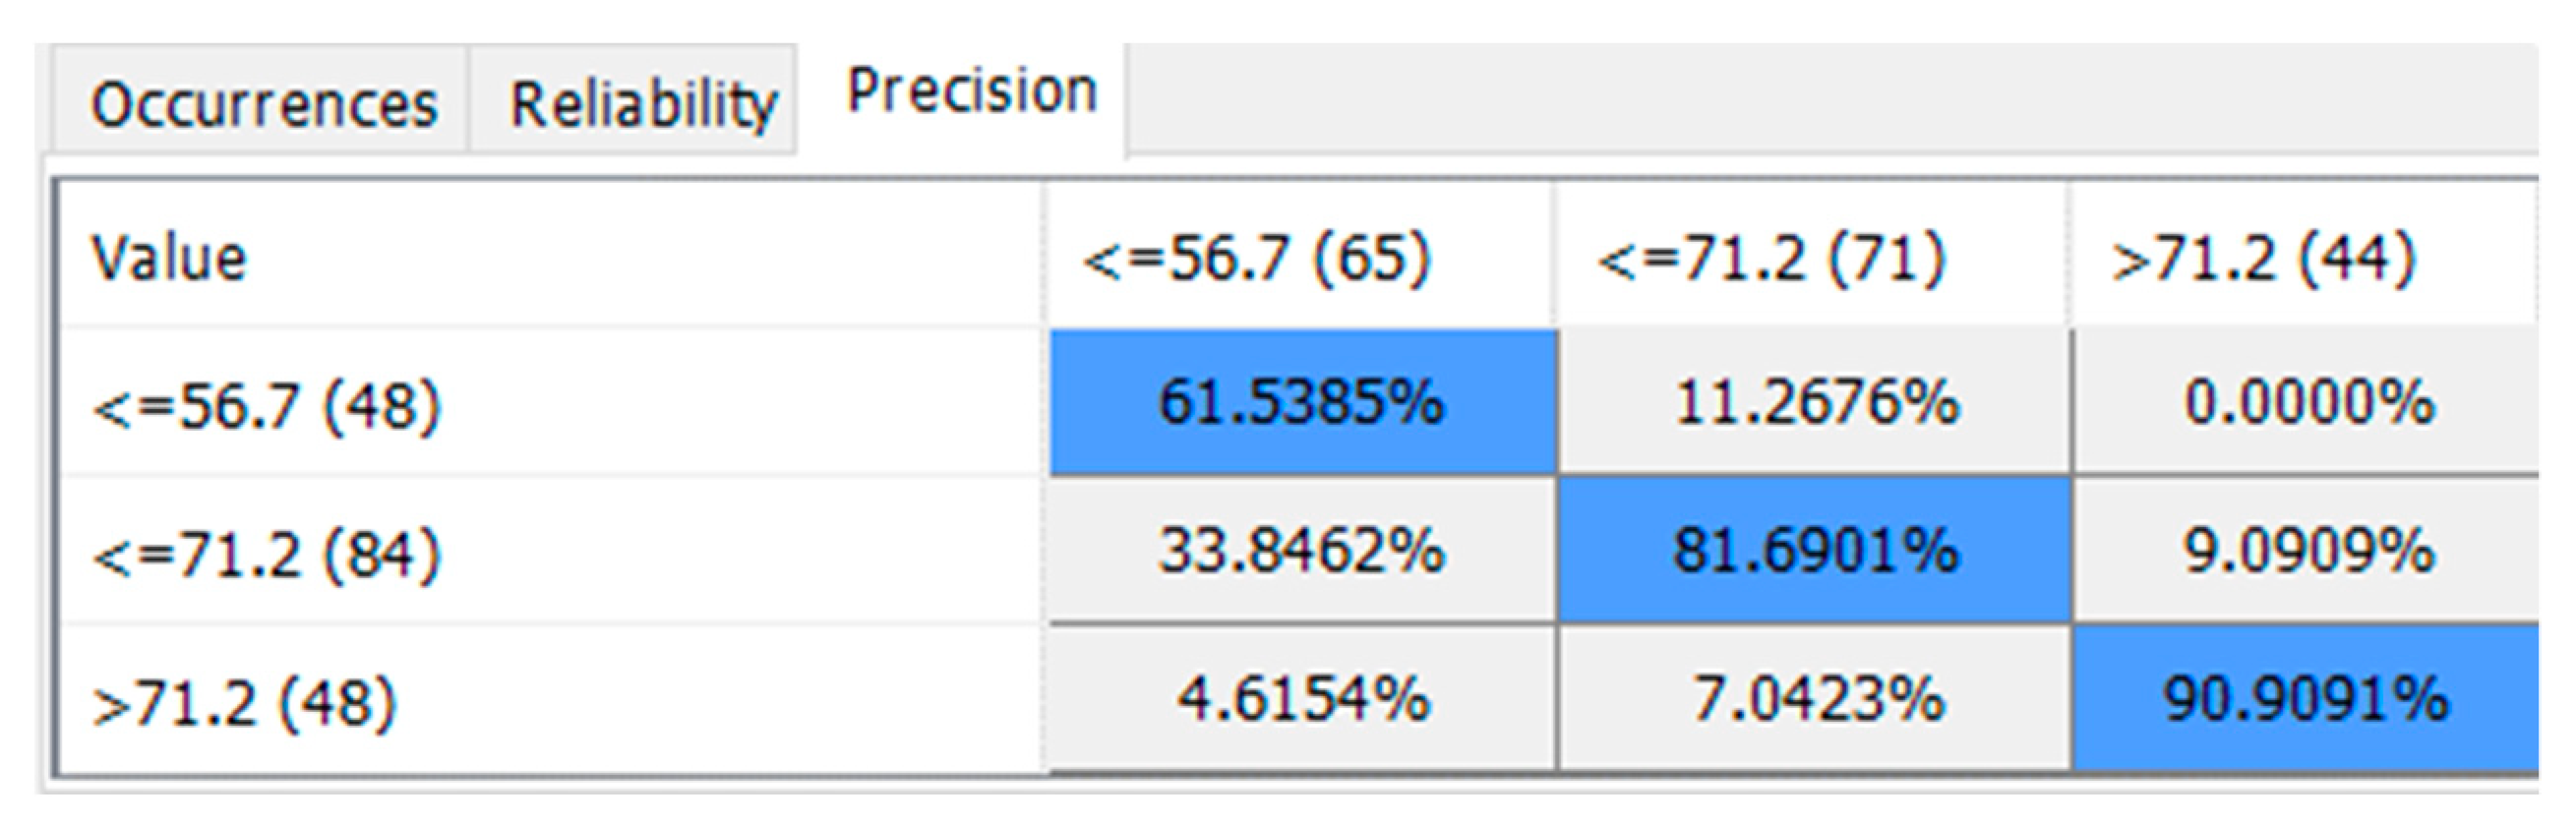
4.6.1. Evaluation of the Predictive Performance Using Target Evaluation Cross-Validation by K-Folds

The predictive performance of a model can be evaluated using measurement tools, such as the gains curve, lift curve, and cross-validation by K-fold. In Bayesialab, these tools can be accessed in the “network performance” menu.
As observed in Bayesialab after performing target evaluation cross-validation by K-folds on the data distribution of each node in the BN, the overall precision was 76.6667%; the mean precision was 78.0459%; the overall reliability was 77.6984%; the mean reliability was 78.5714%; the Gini Index was 68.1566%; the Relative Gini Index was 90.2072%; the Lift Index was 2.1790; the Relative Lift Index was 90.7851%; the receiver operating characteristic (ROC) Index was 95.1036%; the Calibration Index was 61.5214%; the binary log-loss was 0.2138; the correlation coefficient R was 0.7290; the coefficient of determination R2 was 0.5315; the root mean square error (RMSE) was 7.9261; and the normalized root mean square error (NRSME) was 16.2089%.
A confusion matrix (for cross-validating the data by K-fold in every node) can provide additional information about the computational model’s predictive performance. The leftmost column in the matrix contained the predicted values, while the actual values in the data were presented in the top row. Three confusion matrix views would be available by clicking on the corresponding tabs. The occurrences matrix (see Figure 8) would indicate the number of cases for each combination of predicted versus actual values. The diagonal shows the number of true positives.
The reliability matrix (see Figure 9) would indicate the probability of the reliability of the prediction of a state in each cell. Reliability measures the overall consistency of a prediction. A prediction could be considered as highly reliable if the computational model produces similar results under consistent conditions.
The precision matrix (see Figure 10) would indicate the probability of the precision of the prediction of a state in each cell. Precision is the measure of the overall accuracy which the computational model can predict correctly.

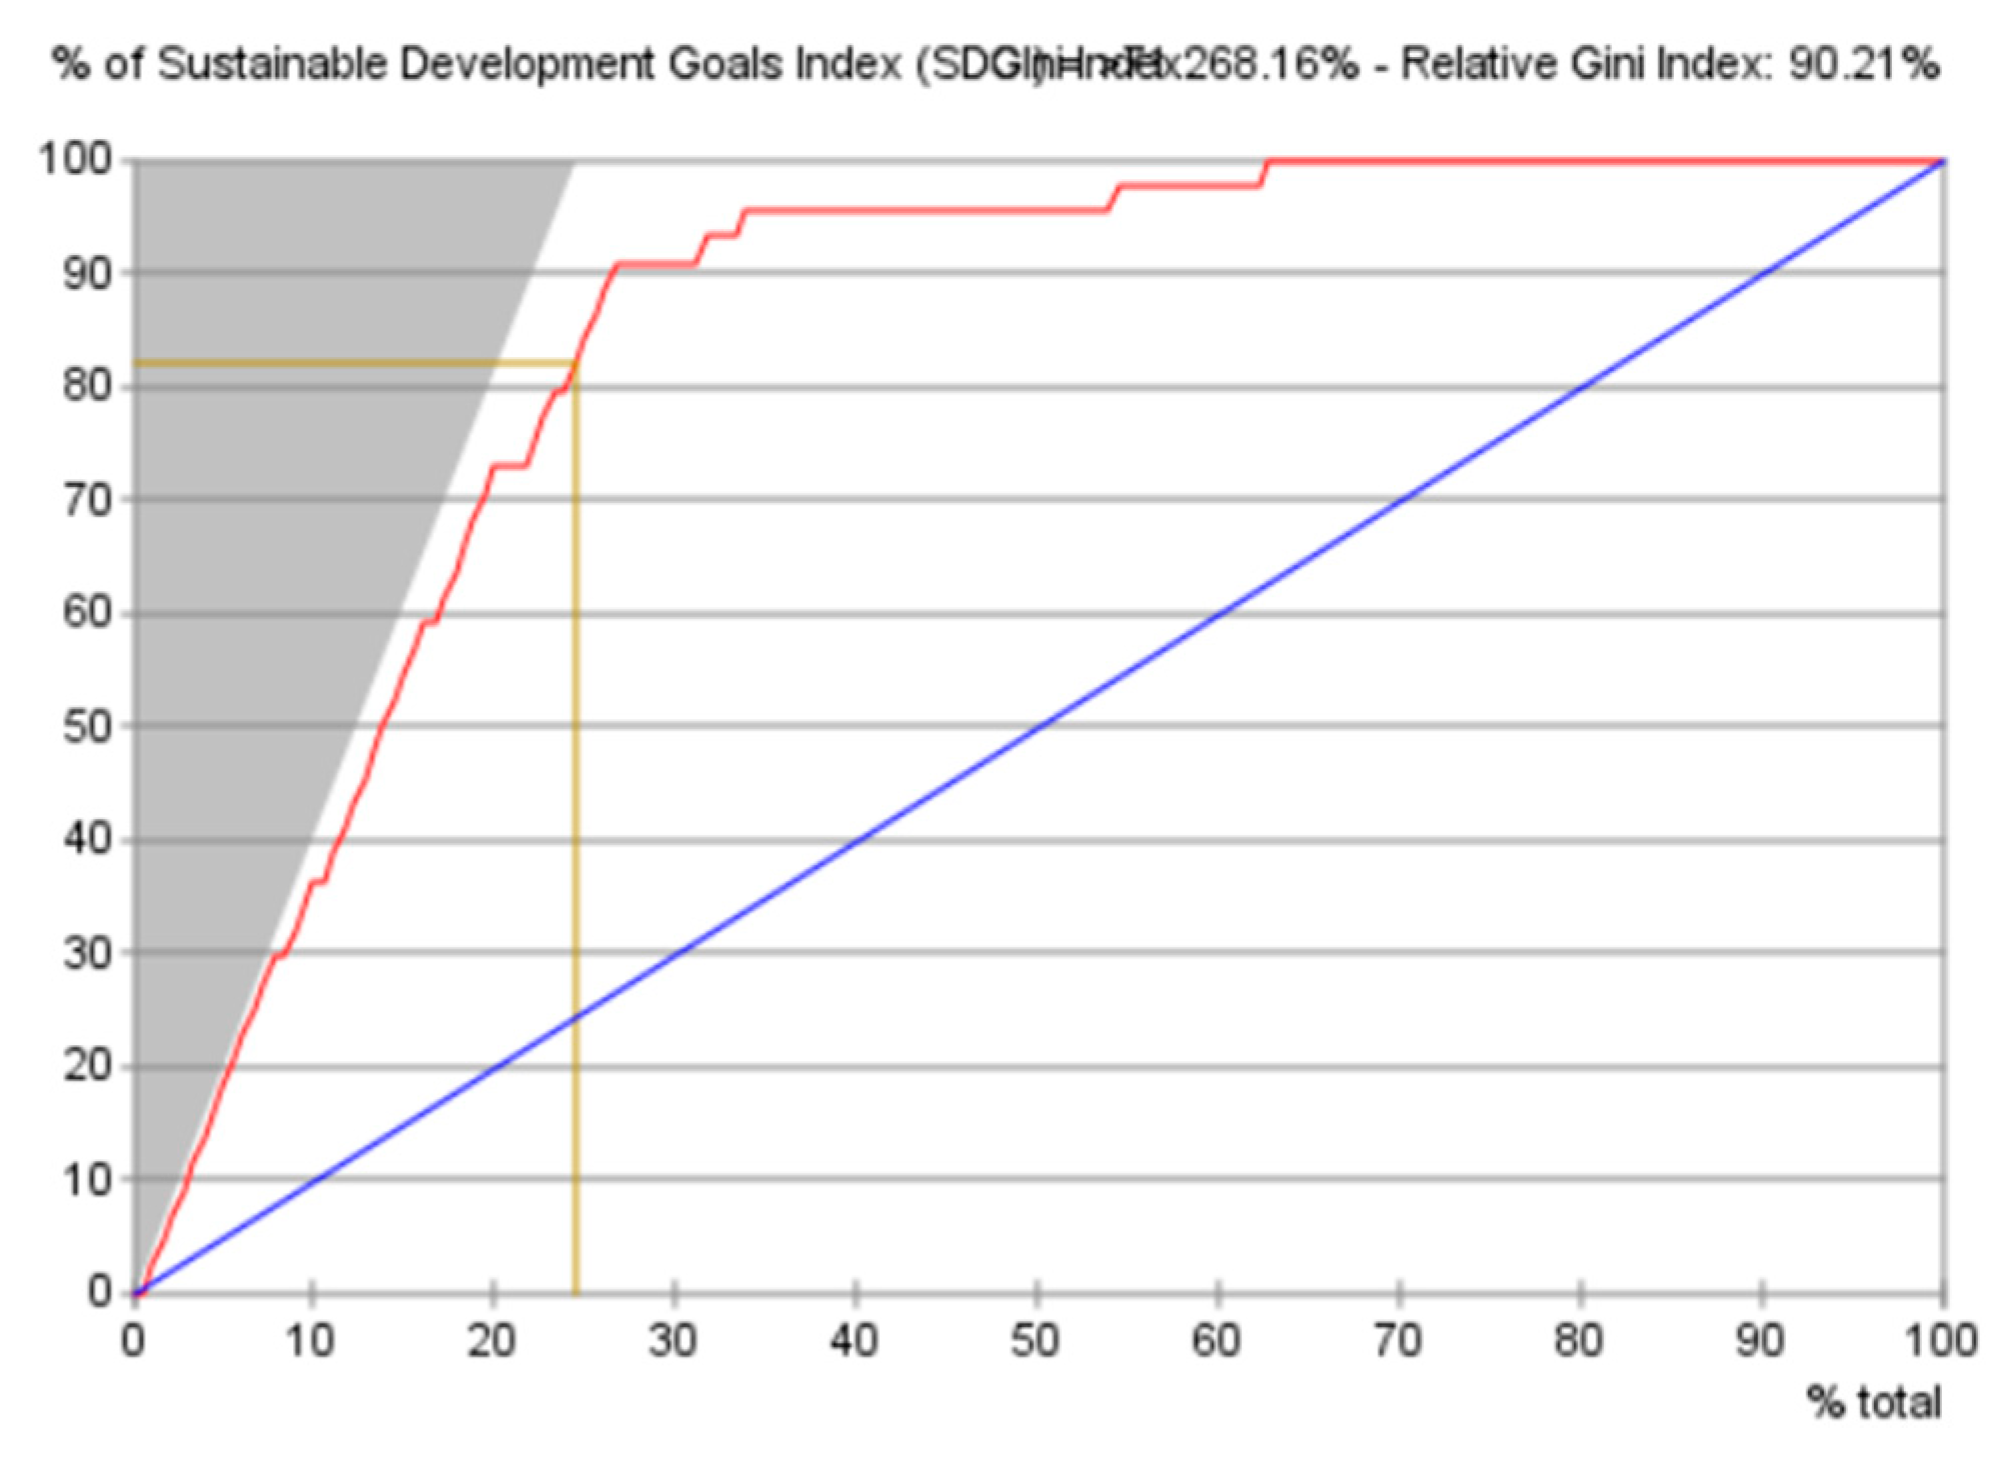
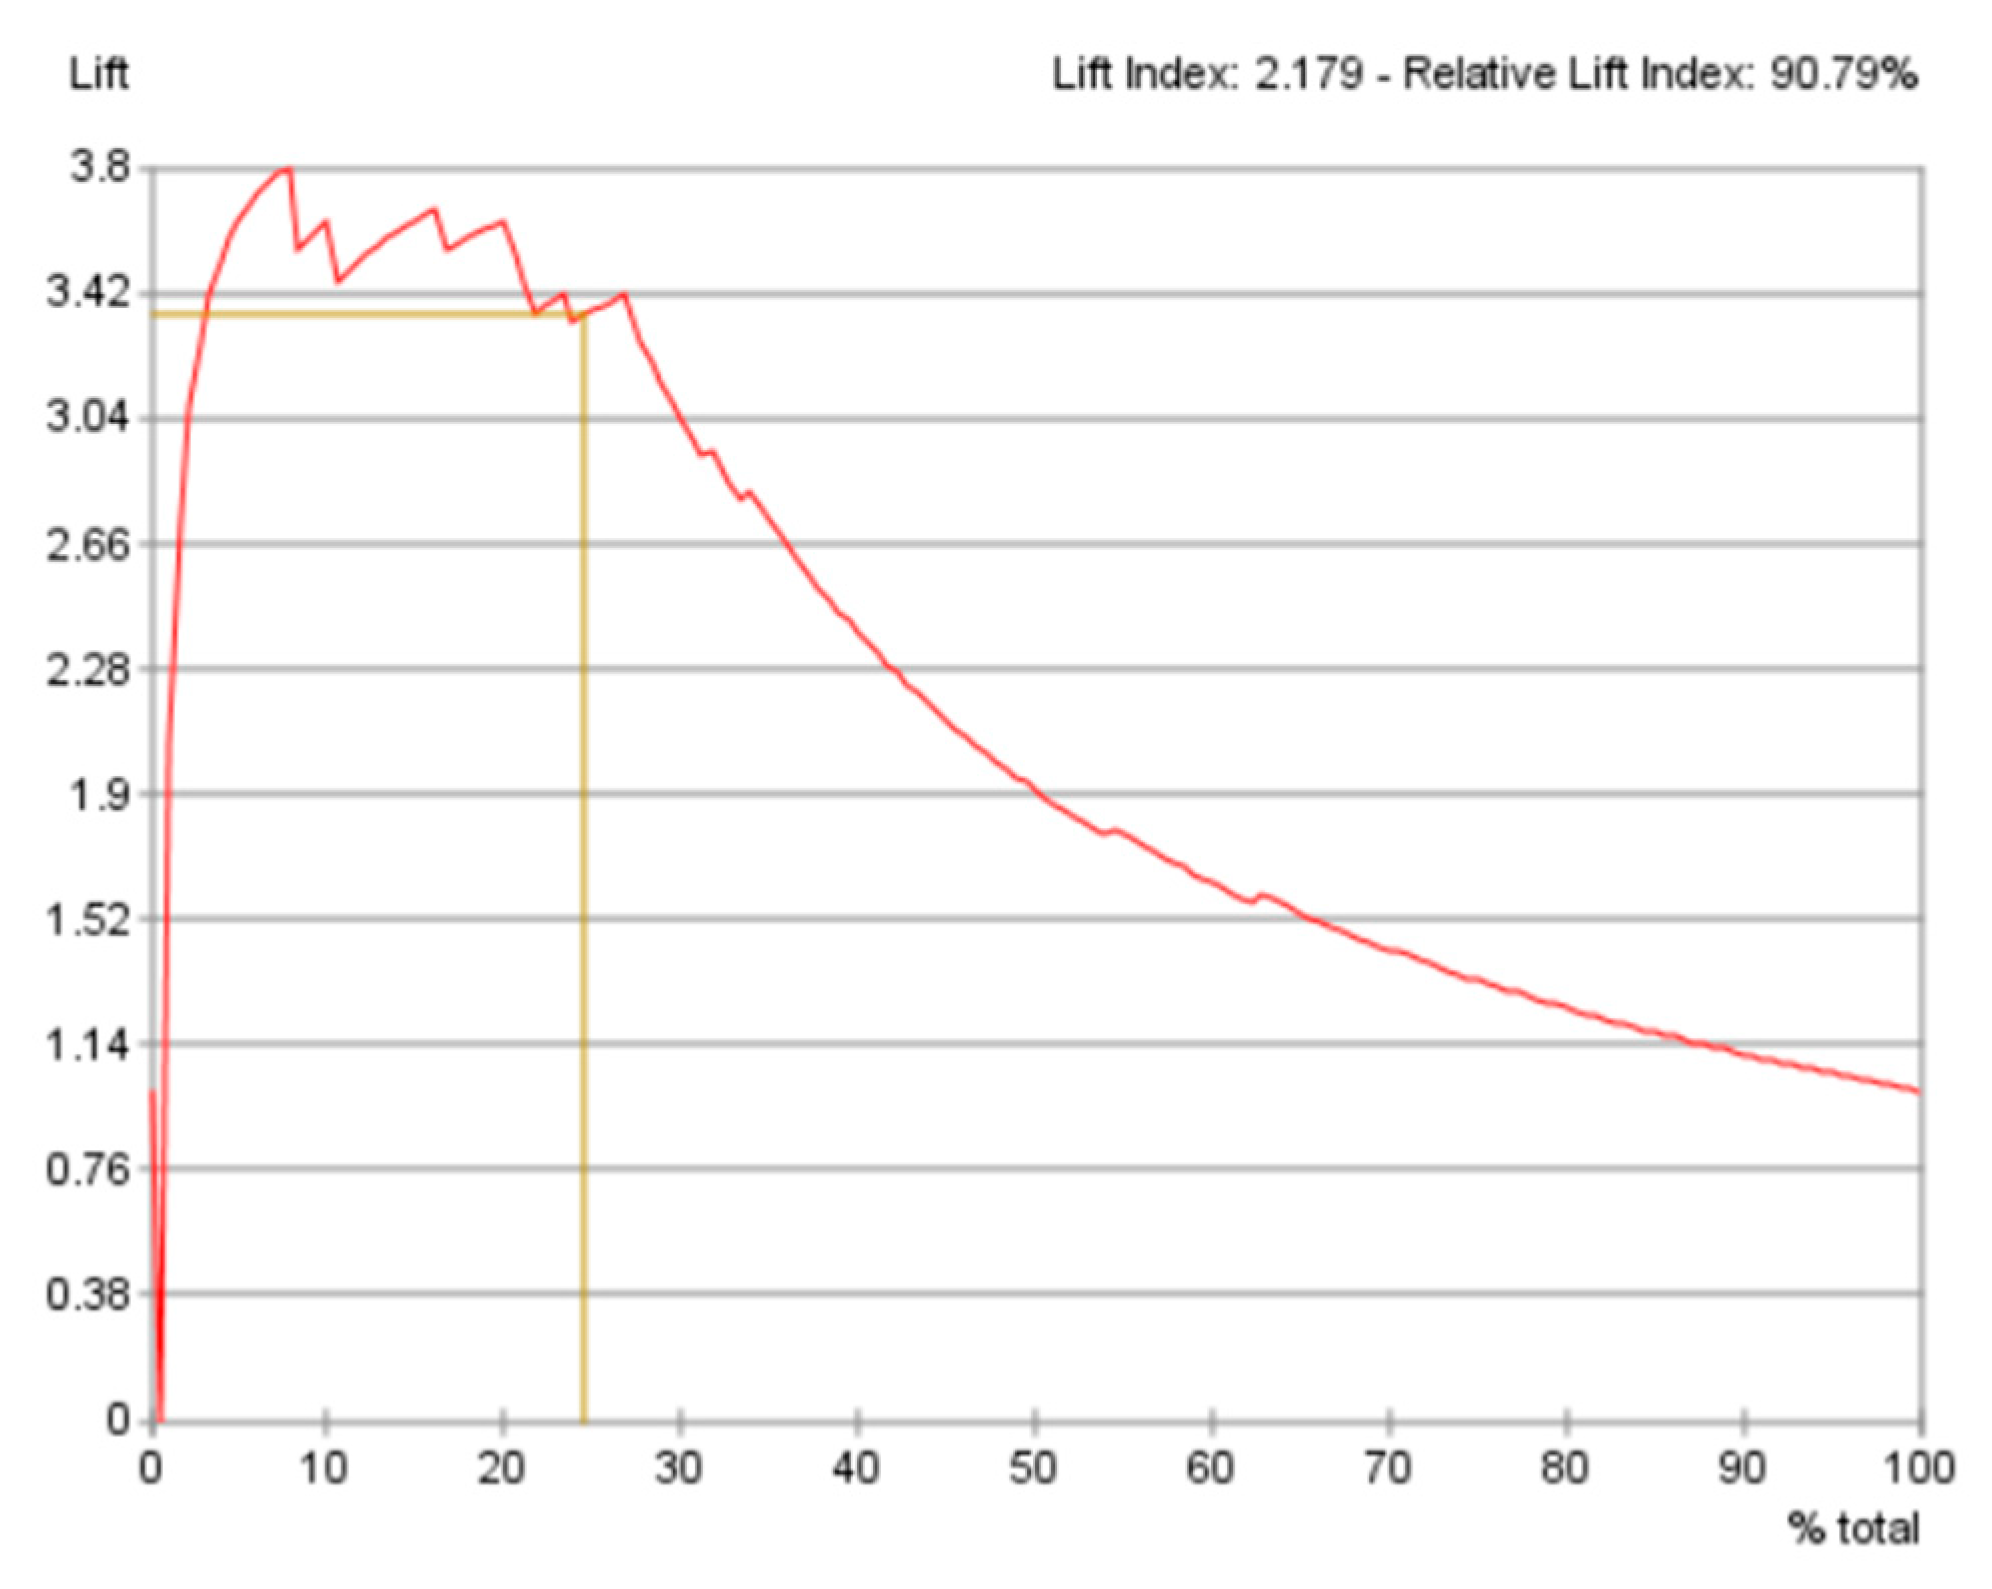
4.6.2. Evaluation of the Predictive Performance Using the Gains Curve, Lift Curve and ROC Curve

In the gains curve (see Figure 11), around 24% of the attributes were predicted to be most impactful towards high-level category in the node SDGI. The blue diagonal line represented the gains of a pure random policy, which is prediction without this predictive model. The red lines represented the gains using this predictive model. The Gini index of 68.16% and relative Gini index of 90.21% suggested that the gains of using this predictive model vis-à-vis not using it, was acceptable.
The lift curve (see Figure 12) was generated from the results of the previous gain curve. The value of the best lift around 3.42, was interpreted as the ratio between 100% and 24% (optimal policy divided by random policy). The lift index of 2.179 and relative lift index of 90.79% suggested that the performance of this predictive model was acceptably good.
Together, the gains curve and the lift curve indicated that the predictive performance of the Bayesian network model in the current paper was good.

4.6.3. Limitations of the Study

The exploratory aspect of predictive analytics via BN in this research renders the theoretical counterfactual findings plausible for discussions and for educing AI-Thinking, but it is not definitive. For illustration purposes, the current paper used only one supervised machine learning approach. Further, it only applied to the BN models produced from the current dataset. Caution must therefore be exercised when evaluating the possible relationships between the variables (nodes) in the BN model. As in any simulation analysis, the results depend on the dataset that produced the computational model. The model of the Bayesian network used in the current study was based on the naïve Bayes algorithm because it is ideal for exploratory studies that do not presume causal relationships between nodes. Analysts should, however, be willing to consider alternative models that might characterize the dataset better.
Thus far, methods of the AI-based BN approach, assessments of the BN’s predictive performance, and the limitations of the analysis have been described. Discussions and the conclusion will be presented in the next section.

5. Discussion and Conclusions

Policymakers might have preferred to use predictive analysis and simulations of alternative variables combinations to simulate in-silico what could not be easily accomplished in real-world. Using the AI-based BN approach provided in the current paper, a multitude of scenarios could be simulated to calculate the conditions for the best and worst outcomes of EPI levels at a global system level. The results of the predictive analysis consistently suggest four indicators that are most influential in both best- and worst-case scenarios—quality of drinking water, sanitization, lead exposure, and wastewater treatment.
AI-Thinking can improve the learning processes of an individual by expanding and deepening the use of conceptual abstraction, problem-solving heuristics and data analysis [69]. Using user-friendly applications, for example, Bayesialab [70] or other BN software, such as GeNie by BayesFusion [71] or Netica by Norsys [72] or Bayes Server [73], the examples in the current paper could be adapted by sustainability analysts using their own data at the regional, national or world level.
The current paper significantly contributes to the literature by offering a user-friendly approach to democratize the use of AI. This approach enables beginner users of AI to conduct research analysis through probabilistic reasoning via AI-based BN. Sustainability analysts, researchers and policymakers—and not only computer scientists—may also use AI to provide decision support by designing predictive models using EPI or other environmental data related to sustainability. Controlled experiments could be conducted in computational models using this approach. Specific variables may be constant, while others may be altered to model various theoretical scenarios. This allowed simulations of “what-if” scenarios to predict the conditions for maximizing desirable outcomes and to predict “at-risk” conditions for avoiding undesirable results.
Beyond sustainability-related research, the user-friendly AI-based approach offered in this paper can also democratize the use of AI by making it accessible to multidisciplinary analysts who may not be computer scientists. Moreover, AI-Thinking can transform how AI could be used cognitively and lead to more data explorations via AI and more human-centric insights for informing policymaking.

Author Contributions

Conceptualization, M.-L.H., S.-M.C., Y.-J.C., A.C.K., E.M.P.S.; methodology, M.-L.H., S.-M.C.; software, M.-L.H.; validation, M.-L.H., S.-M.C.; formal analysis, M.-L.H., S.-M.C.; investigation, M.-L.H., S.-M.C., Y.-J.C., A.C.K., E.M.P.S.; resources, M.-L.H., S.-M.C., Y.-J.C., A.C.K., E.M.P.S.; data curation, M.-L.H., S.-M.C.; writing—original draft preparation, M.-L.H., S.-M.C., Y.-J.C., A.C.K., E.M.P.S.; writing—review and editing, M.-L.H., S.-M.C., Y.-J.C., A.C.K., E.M.P.S.; visualization, M.-L.H., S.-M.C.; funding acquisition, M.-L.H. All authors have read and agreed to the published version of the manuscript.

Funding

The funding for this research was provided by the Education Research Funding Programme (ERFP) via the Office of Education Research in the National Institute of Education, Nanyang Technological University, Singapore. [grant number: ERFP OOE].

Acknowledgments

The authors sincerely thank the editors, the staff of the journal, the anonymous reviewers, and friends who have contributed in one way or another to this study.

Conflicts of Interest

The authors of this manuscript declare that there are no conflicts of interest.

References

  1. Wendling, Z.; Esty, D.; Emerson, J.; Levy, M.; de Sherbinin, A. The 2018 Environmental Performance Index Report; Yale Center for Environmental Law and Policy: New Haven, CT, USA, 2018. [Google Scholar]
  2. Sachs, J.; Kroll, C.; Schmidt-Traub, G.; Lafortune, G.; Fuller, G.; Woelm, F. The Sustainable Development Report 2019: Transformations to Achieve the Sustainable Development Goals; Bertelsmann Stiftung and Sustainable Development Solutions Network (SDSN): New York, NY, USA, 2019. [Google Scholar]
  3. The World Bank. The World Bank Logistics Performance Index. Available online: https://lpi.worldbank.org/about (accessed on 13 December 2019).
  4. Arvis, J.-F.; Ojala, L.; Wiederer, C.; Shepherd, B.; Raj, A.; Dairabayeva, K.; Kiiski, T. Connecting to Compete 2018: Trade Logistics in the Global Economy: The Logistics Performance Index and Its Indicators; The International Bank for Reconstruction and Development/The World Bank: Washington, DC, USA, 2018. [Google Scholar]
  5. Hsu, A.; Lloyd, A.; Emerson, J.W. What progress have we made since Rio? The 2012 Environmental Performance Index (EPI) and Pilot Trend EPI. Environ. Sci. Policy 2013, 33, 171–185. [Google Scholar] [CrossRef]
  6. Kraemer, R.A.; Peichert, H. Analysis of the Yale Environmental Performance Index (EPI); German Federal Environment Agency: Dessau, Germany, 2008. [Google Scholar]
  7. Kulin, J.; Sevä, I.J. The Role of Government in Protecting the Environment: Quality of Government and the Translation of Normative Views about Government Responsibility into Spending Preferences. Int. J. Sociol. 2019, 49, 110–129. [Google Scholar] [CrossRef] [Green Version]
  8. Association of Computing Machinery, A.M. Turing Award Laureate Dr. McCarthy’s Lecture “The Present State of Research on Artificial Intelligence”. Available online: https://amturing.acm.org/award_winners/mccarthy_1118322.cfm (accessed on 10 July 2019).
  9. Holzinger, A. From Machine Learning to Explainable AI. In Proceedings of the 2018 World Symposium on Digital Intelligence for Systems and Machines (DISA), Kosice, Slovakia, 23–25 August 2018; pp. 55–66. [Google Scholar]
  10. Zeng, D. From Computational Thinking to AI Thinking [A letter from the editor]. IEEE Intell. Syst. 2013, 28, 2–4. [Google Scholar] [CrossRef]
  11. Gadanidis, G. Artificial intelligence, computational thinking, and mathematics education. Int. J. Inf. Learn. Technol. 2017, 34, 133–139. [Google Scholar] [CrossRef]
  12. Rad, P.; Roopaei, M.; Beebe, N.; Shadaram, M.; Au, Y. AI Thinking for Cloud Education Platform with Personalized Learning. In Proceedings of the 51st Hawaii International Conference on System Sciences, Waikoloa Village, HI, USA, 3–6 January 2018; pp. 3–12. [Google Scholar]
  13. Klebanov, B.B.; Burstein, J.; Harackiewicz, J.M.; Priniski, S.J.; Mulholland, M. Reflective Writing About the Utility Value of Science as a Tool for Increasing STEM Motivation and Retention—Can AI Help Scale Up? Int. J. Artif. Intell. Educ. 2017, 31, 151. [Google Scholar]
  14. Rosenberg, L. Artificial Swarm Intelligence, a Human-in-the-Loop Approach to A.I. In Proceedings of the Thirtieth AAAI Conference on Artificial Intelligence (AAAI-16), Phoenix, AR, USA, 12–17 February 2016; pp. 4381–4382. [Google Scholar]
  15. Davis, B. Complexity and Education: Vital simultaneities. Educ. Philos. Theory 2008, 40, 50–65. [Google Scholar] [CrossRef]
  16. Gherheș, V.; Obrad, C. Technical and Humanities Students’ Perspectives on the Development and Sustainability of Artificial Intelligence (AI). Sustainability 2018, 10, 3066. [Google Scholar] [CrossRef] [Green Version]
  17. Khakurel, J.; Penzenstadler, B.; Porras, J.; Knutas, A.; Zhang, W. The Rise of Artificial Intelligence under the Lens of Sustainability. Technology 2018, 6, 100. [Google Scholar] [CrossRef] [Green Version]
  18. Hill, P.; Barber, M. Preparing for a Renaissance in Assessment; Pearson: London, UK, 2014. [Google Scholar]
  19. Correa, M.; Bielza, C.; Teixeira, J.P. Comparison of Bayesian networks and artificial neural networks for quality detection in a machining process. Expert Syst. Appl. 2009, 36, 7270–7279. [Google Scholar] [CrossRef]
  20. Georgiopoulos, M.; Demara, R.F.; Gonzalez, A.J.; Wu, A.S.; Mollaghasemi, M.; Gelenbe, E.; Kysilka, M.; Secretan, J.; Sharma, C.A.; Alnsour, A.J. A Sustainable Model for Integrating Current Topics in Machine Learning Research Into the Undergraduate Curriculum. IEEE Trans. Educ. 2009, 52, 503–512. [Google Scholar] [CrossRef] [Green Version]
  21. Pearl, J. Causality: Models, Reasoning, and Inference, 2nd ed.; Cambridge University Press: Cambridge, UK, 2010; ISBN 978-0-521-89560-6. [Google Scholar]
  22. Pearl, J. Causes of Effects and Effects of Causes. Sociol. Methods Res. 2015, 44, 149–164. [Google Scholar] [CrossRef] [Green Version]
  23. Pearl, J. Fusion, propagation, and structuring in belief networks. Artif. Intell. 1986, 29, 241–288. [Google Scholar] [CrossRef] [Green Version]
  24. Loveland, D.W. Automated Theorem Proving: A logical Basis; Elsevier North-Holland, Inc.: New York, NY, USA, 1978; ISBN 0-7204-0499-1. [Google Scholar]
  25. Moore, R.C. Logic and Representation; Center for the Study of Language (CSLI); Stanford University: Main Quad, CA, USA, 1995; Volume 39. [Google Scholar]
  26. Domingos, P.; Pazzani, M. On the Optimality of the Simple Bayesian Classifier under Zero-One Loss. Mach. Learn. 1997, 29, 103–130. [Google Scholar] [CrossRef]
  27. Hand, D.; You, K. Idiot’s Bayes–Not so stupid after all? Int. Stat. Rev. 2001, 69, 385–398. [Google Scholar]
  28. Bayes, T. A Letter from the Late Reverend Mr. Thomas Bayes, F.R.S. to John Canton, M.A. and F. R. S. In The Royal Society, Philosophical Transactions (1683–1775); The Royal Society Publishing: London, UK, 1763; Volume 53, pp. 269–271. [Google Scholar]
  29. van de Schoot, R.; Kaplan, D.; Denissen, J.; Asendorpf, J.B.; Neyer, F.J.; van Aken, M.A.G. A Gentle Introduction to Bayesian Analysis: Applications to Developmental Research. Child Dev. 2014, 85, 842–860. [Google Scholar] [CrossRef] [PubMed]
  30. Hox, J.; van de Schoot, R.; Matthijsse, S. How few countries will do? Comparative survey analysis from a Bayesian perspective. Surv. Res. Methods 2012, 6, 87–93. [Google Scholar]
  31. Lee, S.-Y.; Song, X.-Y. Evaluation of the Bayesian and Maximum Likelihood Approaches in Analyzing Structural Equation Models with Small Sample Sizes. Multivar. Behav. Res. 2004, 39, 653–686. [Google Scholar] [CrossRef]
  32. Button, K.S.; Ioannidis, J.P.A.; Mokrysz, C.; Nosek, B.A.; Flint, J.; Robinson, E.S.J.; Munafò, M.R. Power failure: Why small sample size undermines the reliability of neuroscience. Nat. Rev. Neurosci. 2013, 14, 365–376. [Google Scholar] [CrossRef] [Green Version]
  33. Kaplan, D.; Depaoli, S. Bayesian structural equation modeling. In Handbook of Structural Equation Modeling; Hoyle, R., Ed.; Guilford Press: New York, NY, USA, 2012; pp. 650–673. [Google Scholar]
  34. Walker, L.J.; Gustafson, P.; Frimer, J.A. The application of Bayesian analysis to issues in developmental research. Int. J. Behav. Dev. 2007, 31, 366–373. [Google Scholar] [CrossRef]
  35. Zhang, Z.; Hamagami, F.; Wang, L.L.; Nesselroade, J.R.; Grimm, K.J. Bayesian analysis of longitudinal data using growth curve models. Int. J. Behav. Dev. 2007, 31, 374–383. [Google Scholar] [CrossRef] [Green Version]
  36. Zou, L.; Kent, J.; Lam, N.S.-N.; Cai, H.; Qiang, Y.; Li, K. Evaluating Land Subsidence Rates and Their Implications for Land Loss in the Lower Mississippi River Basin. Water 2015, 8, 10. [Google Scholar] [CrossRef] [Green Version]
  37. Seydehmet, J.; Lv, G.H.; Nurmemet, I.; Aishan, T.; Abliz, A.; Sawut, M.; Abliz, A.; Eziz, M. Model Prediction of Secondary Soil Salinization in the Keriya Oasis, Northwest China. Sustainability 2018, 10, 656. [Google Scholar] [CrossRef] [Green Version]
  38. Shannon, C. The lattice theory of information. Trans. IRE Prof. Group Inf. Theory 1953, 1, 105–107. [Google Scholar] [CrossRef]
  39. Lleo, S.; Ziemba, B. The Swiss black swan bad scenario: Is Switzerland another casualty of the Eurozone crisis. IJFS 2015, 3, 351–380. [Google Scholar] [CrossRef] [Green Version]
  40. Chang, W.; Xu, Z.; You, M.; Zhou, S.; Xiao, Y.; Cheng, Y. A Bayesian Failure Prediction Network Based on Text Sequence Mining and Clustering. Entropy 2018, 20, 923. [Google Scholar] [CrossRef] [Green Version]
  41. Sperotto, A.; Molina, J.L.; Torresan, S.; Critto, A.; Pulido-Velazquez, M.; Marcomini, A. Water Quality Sustainability Evaluation under Uncertainty: A Multi-Scenario Analysis Based on Bayesian Networks. Sustainability 2019, 11, 4764. [Google Scholar] [CrossRef] [Green Version]
  42. Cowell, R.G.; Dawid, A.P.; Lauritzen, S.L.; Spieglehalter, D.J. Probabilistic Networks and Expert Systems: Exact Computational Methods for Bayesian Networks; Springer: New York, NY, USA, 1999; ISBN 978-0-387-98767-5. [Google Scholar]
  43. Jensen, F.V. An Introduction to Bayesian Networks; Springer: New York, NY, USA, 1999; ISBN 0-387-91502-8. [Google Scholar]
  44. Korb, K.B.; Nicholson, A.E. Bayesian Artificial Intelligence; Chapman & Hall/CRC: London, UK, 2010; ISBN 978-1-4398-1591-5. [Google Scholar]
  45. Tsamardinos, I.; Aliferis, C.F.; Statnikov, A. Time and sample efficient discovery of Markov blankets and direct causal relations. In Proceedings of the Ninth ACM SIGKDD International Conference on Knowledge Discovery and Data Mining—KDD, New York, NY, USA, 3 August 2003; p. 673. [Google Scholar]
  46. Chi, G.; Hu, S.; Yang, Y.; Chen, T. Response surface methodology with prediction uncertainty: A multi-objective optimisation approach. Chem. Eng. Res. Des. 2012, 90, 1235–1244. [Google Scholar] [CrossRef]
  47. Fox, R.J.; Elgart, D.; Davis, S.C. Bayesian credible intervals for response surface optima. J. Stat. Plan. Inference 2009, 139, 2498–2501. [Google Scholar] [CrossRef]
  48. Miró-Quesada, G.; Del Castillo, E.; Peterson, J.J. A Bayesian Approach for Multiple Response Surface Optimization in the Presence of Noise Variables. J. Appl. Stat. 2004, 31, 251–270. [Google Scholar] [CrossRef]
  49. Myers, R.H.; Montgomery, D.C.; Anderson-Cook, C.M. Response Surface Methodology: Process and Product Optimization Using Designed Experiments, 3th ed.; Wiley and Sons, Inc.: Somerset, NJ, USA, 2009; ISBN 978-0-470-17446-3. [Google Scholar]
  50. Socioeconomic Data and Applications Center (sedac) Environmental Performance Index, 2018 Release. Available online: https://sedac.ciesin.columbia.edu/data/set/epi-environmental-performance-index-2018/data-download (accessed on 5 January 2020).
  51. Yale University Subset of the Environment Performance Index Dataset. Available online: https://figshare.com/articles/Educing_AI-Thinking_in_Global_Sustainability_Development_Education_Dataset/11330645 (accessed on 3 January 2020).
  52. Yale University Full Dataset of the Environment Performance Index. Available online: https://sedac.ciesin.columbia.edu/data/set/epi-environmental-performance-index-2018/data-download (accessed on 3 January 2020).
  53. Conrady, S.; Jouffe, L. Bayesian Networks & BayesiaLab: A Practical Introduction for Researchers; Bayesia: Franklin, TN, USA, 2015; ISBN 0-9965333-0-3. [Google Scholar]
  54. Bayesia, S.A.S. BayesiaLab: Missing Values Processing. Available online: http://www.bayesia.com/bayesialab-missing-values-processing (accessed on 2 June 2019).
  55. How, M.-L.; Hung, W.L.D. Harnessing Entropy via Predictive Analytics to Optimize Outcomes in the Pedagogical System: An Artificial Intelligence-Based Bayesian Networks Approach. Educ. Sci. 2019, 9, 158. [Google Scholar] [CrossRef] [Green Version]
  56. Bayesia, S.A.S. R2-GenOpt* Algorithm. Available online: https://library.bayesia.com/pages/viewpage.action?pageId=35652439#6c939073de75493e8379c0fff83e1384 (accessed on 19 March 2019).
  57. Lauritzen, S.L.; Spiegelhalter, D.J. Local Computations with Probabilities on Graphical Structures and Their Application to Expert Systems. J. R. Stat. Soc. Ser. B 1988, 50, 157–194. [Google Scholar] [CrossRef]
  58. Kschischang, F.; Frey, B.; Loeliger, H.-A. Factor graphs and the sum-product algorithm. IEEE Trans. Inf. Theory 2001, 47, 498–519. [Google Scholar] [CrossRef] [Green Version]
  59. Bonilla, S.H.; Silva, H.R.O.; Da Silva, M.T.; Gonçalves, R.F.; Sacomano, J.B. Industry 4.0 and Sustainability Implications: A Scenario-Based Analysis of the Impacts and Challenges. Sustainability 2018, 10, 3740. [Google Scholar] [CrossRef] [Green Version]
  60. Valero, L.G.; Pajares, E.M.; Sánchez, I.R. The Tax Burden on Wastewater and the Protection of Water Ecosystems in EU Countries. Sustainability 2018, 10, 212. [Google Scholar] [CrossRef] [Green Version]
  61. Hou, Y.; Iqbal, W.; Shaikh, G.M.; Iqbal, N.; Solangi, Y.A.; Fatima, A. Measuring Energy Efficiency and Environmental Performance: A Case of South Asia. Processes 2019, 7, 325. [Google Scholar] [CrossRef] [Green Version]
  62. Kim, J.; Jun, S.; Jang, D.; Park, S. Sustainable Technology Analysis of Artificial Intelligence Using Bayesian and Social Network Models. Sustainability 2018, 10, 115. [Google Scholar] [CrossRef] [Green Version]
  63. Liu, G.; Brown, M.T.; Casazza, M. Enhancing the Sustainability Narrative through a Deeper Understanding of Sustainable Development Indicators. Sustainability 2017, 9, 1078. [Google Scholar] [CrossRef] [Green Version]
  64. Rodríguez-Martínez, C.C.; García-Sánchez, I.M.; Vicente-Galindo, P.; Galindo-Villardón, P. Exploring Relationships between Environmental Performance, E-Government and Corruption: A Multivariate Perspective. Sustainability 2019, 11, 6497. [Google Scholar]
  65. How, M.-L.; Hung, W.L.D. Educational Stakeholders’ Independent Evaluation of an Artificial Intelligence-Enabled Adaptive Learning System Using Bayesian Network Predictive Simulations. Educ. Sci. 2019, 9, 110. [Google Scholar] [CrossRef] [Green Version]
  66. Shen, K.-Y.; Tzeng, G.-H. Advances in Multiple Criteria Decision Making for Sustainability: Modeling and Applications. Sustainability 2018, 10, 1600. [Google Scholar] [CrossRef] [Green Version]
  67. Sun, Z.; An, C.; Sun, H. Regional Differences in Energy and Environmental Performance: An Empirical Study of 283 Cities in China. Sustainability 2018, 10, 2303. [Google Scholar] [CrossRef] [Green Version]
  68. How, M.-L. Future-Ready Strategic Oversight of Multiple Artificial Superintelligence-Enabled Adaptive Learning Systems via Human-Centric Explainable AI-Empowered Predictive Optimizations of Educational Outcomes. Big Data Cogn. Comput. 2019, 3, 46. [Google Scholar] [CrossRef] [Green Version]
  69. How, M.-L.; Hung, W.L.D. Educing AI-Thinking in Science, Technology, Engineering, Arts, and Mathematics (STEAM) Education. Educ. Sci. 2019, 9, 184. [Google Scholar] [CrossRef] [Green Version]
  70. Bayesia, S.A.S. Bayesialab. Available online: https://www.bayesialab.com/ (accessed on 18 March 2019).
  71. Bayes Fusion LLC. GeNie. Available online: https://www.bayesfusion.com/genie/ (accessed on 18 March 2019).
  72. Norsys Software Corp. FigurNetica. Available online: https://www.norsys.com/netica.html (accessed on 18 March 2019).
  73. Bayes Server LLC. Bayes Server. Available online: https://www.bayesserver.com/ (accessed on 18 March 2019).
Figure 1. Descriptive modeling of current state of 2018 EPI data.
Information 11 00039 g001
Figure 2. Target-mean analysis of the curves representing the parameters of environmental performance.
Information 11 00039 g002
Figure 3. Tornado diagram of posterior probabilities analysis of the sustainability-related variables on the target: Sustainable Development Goals Index (SDGI).
Information 11 00039 g003
Figure 4. Sensitivity analysis of the sustainability-related variables on the target: high-level SDGI (>71.2).
Information 11 00039 g004
Figure 5. Sensitivity analysis of the sustainability-related variables on the target: low-level SDGI (e.g., 56.7).
Information 11 00039 g005
Figure 6. Example of a best-case scenario.
Information 11 00039 g006
Figure 7. Example of a worst-case scenario.
Information 11 00039 g007
Figure 8. Confusion matrix of occurrences.
Information 11 00039 g008
Figure 9. Confusion matrix of reliability.
Information 11 00039 g009
Figure 10. Confusion matrix of precision.
Information 11 00039 g010
Figure 11. Gains curve.
Information 11 00039 g011
Figure 12. Lift curve.
Information 11 00039 g012
Table 1. Categorization of EPI variables.
Policy ObjectiveIssue CategoryIndicator
EPIEnvironmental HealthAir QualityHousehold Solid Fuels
PM2.5 Exposure
PM2.5 Exceedance
Water and SanitationDrinking Water
Sanitation
Heavy MetalsLead Exposure
Ecosystem Vitality Biodiversity and HabitatMarine Protected Areas
Biome Protection (National)
Biome Protection (Global)
Species Protection Index
Protected Area Representativeness Index
Species Habitat Index
Climate and EnergyCO2 Emissions—Total
CO2 Emissions—Power
Methane Emissions
N2O Emissions
Black Carbon Emissions
Air PollutionSO2 Emissions
NOX Emissions
Water ResourcesWastewater Treatment
AgricultureSustainable Nitrogen Management
Table 2. Results of descriptive analysis of the 2018 EPI data.
VariableLow Level Mid-Level High Level
RangeProbabilityRangeProbabilityRangeProbability
Sustainable Development Goals Index (SDGI)≤56.7 25.19%56.8–71.248.31%>71.226.49%
Household Solid Fuelse.g., 27.1827.78%27.19–65.9325.00%>65.9347.21%
PM2.5 Exposuree.g., 17.2461.65%17.25–53.4330.00%>53.438.35%
PM2.5 Exceedancee.g., 15.3464.43%15.35–51.828.89%>51.86.68%
Drinking Watere.g., 34.935.00%35.0–73.9247.77%>73.9217.23%
Sanitizatione.g., 34.4335.55%34.44–72.2340.55%>72.2323.89%
Lead Exposuree.g., 24.6418.34%24.65–51.5433.33%>51.5448.33%
Marine Protected Arease.g., 33.898.16%33.9–75.6227.09%>75.6264.74%
Biome Protection (National)e.g., 36.223.34%36.3–72.7222.23%>72.7254.43%
Biome Protection (Global)e.g., 55.835.01%-->55.864.99%
Species Protection Indexe.g., 40.0419.42%40.05–75.5923.26%>75.5957.32%
Protected Area Representiveness Indexe.g., 30.0936.11%30.1–6235.55%>6228.34%
Species Habitat Indexe.g., 46.059.71%46.06–81.8129.66%>81.8160.63%
CO2 Emissions (Total)e.g., 37.0721.67%37.08–64.6251.66%>64.6226.67%
CO2 Emissions (Power)e.g., 22.7211.02%22.73–59.8246.16%>59.8242.82%
Methane Emissionse.g., 21.3821.12%21.39–52.42 46.66%e.g., 52.4232.33%
N2O Emissionse.g., 30.6627.78%30.67–62.2852.77%>62.2819.45%
Black Carbon Emissionse.g., 29.9518.90%29.96–63.2746.10%>63.2735.00%
SO2 Emissionse.g., 29.7823.89%29.79–59.1243.88%>59.1232.22%
NOX Emissionse.g., 30.1919.45%30.2–61.3439.44%>61.3441.11%
Wastewater Treatmente.g., 26.3225.56%26.33–72.5930.56%>72.5943.88%
Sustainable Nitrogen Managemente.g., 19.8327.23%19.84–40.7548.33%>40.7524.45%
Table 3. Results of predictive analysis of the best-case scenario.
Variable/NodeLow Level Mid-Level High Level
BaseBest-CaseBaseBest-CaseBaseBest-Case
Household Solid Fuels27.78%28.21%25.00%25.54%47.21%46.35%
PM2.5 Exposure64.43%63.49%30.00%30.86%8.35%5.65%
PM2.5 Exceedance64.43%66.35%28.89%29.13%6.68%4.52%
Drinking Water35.00%4.50%47.77%45.31%17.23%50.19%
Sanitization35.55%4.85%40.55%25.54%23.89%69.61%
Lead Exposure18.34%54.57%33.33%36.31%48.33%9.13%
Marine Protected Areas8.16%7.19%27.09%26.31%64.74%66.50%
Biome Protection (National)23.34%19.28%22.23%21.87%54.43%58.85%
Biome Protection (Global)35.01%30.68%--64.99%69.32%
Species Protection Index19.42%16.20%75.59%22.25%57.32%61.55%
Protected Area Representiveness Index36.11%32.80%35.55%36.96%28.34%30.24%
Species Habitat Index9.71%9.89%29.66%30.11%60.63%60.00%
CO2 Emissions (Total)21.67%23.13%51.66%53.59%26.67%23.28%
CO2 Emissions (Power)11.02%11.08%46.16%47.60%42.82%41.33%
Methane Emissions21.12%26.66%46.66%49.61%32.33%23.73%
N2O Emissions27.78%36.90%52.77%52.64%19.45%10.46%
Black Carbon Emissions18.90%22.27%46.10%50.73%35.00%27.00%
SO2 Emissions23.89%31.17%43.88%38.32%32.22%30.51%
NOX Emissions19.45%26.79%39.44%34.73%41.11%38.48%
Wastewater Treatment25.56%5.70%30.56%31.94%43.88%62.36%
Sustainable Nitrogen Management27.23%29.50%48.33%35.76%24.45%34.74%
Table 4. Results of predictive analysis of the worst-case scenario.
Variable/NodeLow Level Mid-Level High Level
Worst-CaseBase Worst-CaseBaseWorst-CaseBase
Household Solid Fuels26.22%27.78%23.14%25.00%50.63%47.21%
PM2.5 Exposure54.54%61.65%27.69%30.00%17.77%8.35%
PM2.5 Exceedance57.00%64.43%28.78%28.89%14.22%6.68%
Drinking Water84.04%35.00%15.16%47.77%0.80%17.23%
Sanitization84.24%35.55%14.65%40.55%1.11%23.89%
Lead Exposure0.70%18.34%10.36%33.33%88.93%48.33%
Marine Protected Areas9.87%8.16%28.48%27.09%61.64%64.74%
Biome Protection (National)30.52%23.34%22.86%22.23%46.61%54.43%
Biome Protection (Global)42.68%35.01%--57.32%64.99%
Species Protection Index25.11%19.42%25.05%75.59%49.84%57.32%
Protected Area Representiveness Index41.96%36.11%33.06%35.55%35.55%28.34%
Species Habitat Index9.40%9.71%28.86%29.66%61.74%60.63%
CO2 Emissions (Total)19.09%21.67%48.23%51.66%32.68%26.67%
CO2 Emissions (Power)10.93%11.02%43.61%46.16%45.46%42.82%
Methane Emissions11.30%21.12%41.43%46.66%47.26%32.33%
N2O Emissions11.62%27.78%53.00%52.77%35.38%19.45%
Black Carbon Emissions12.93%18.90%37.91%46.10%49.16%35.00%
SO2 Emissions11.01%23.89%53.74%43.88%35.26%32.22%
NOX Emissions6.47%19.45%47.77%39.44%45.76%41.11%
Wastewater Treatment60.72%25.56%28.11%30.56%11.17%43.88%
Sustainable Nitrogen Management23.20%27.23%70.57%48.33%6.23%24.45%
Table 5. Comparison of worst- and best-case scenarios.
Variable/NodeLow Level Mid-Level High Level
Worst-CaseBest-Case Worst-CaseBest-CaseWorst-CaseBest-Case
Household Solid Fuels26.22%28.21%23.14%25.54%50.63%46.35%
PM2.5 Exposure54.54%63.49%27.69%30.86%17.77%5.65%
PM2.5 Exceedance57.00%66.35%28.78%29.13%14.22%4.52%
Drinking Water84.04%4.50%15.16%45.31%0.80%50.19%
Sanitization84.24%4.85%14.65%25.54%1.11%69.61%
Lead Exposure0.70%54.57%10.36%36.31%88.93%9.13%
Marine Protected Areas9.87%7.19%28.48%26.31%61.64%66.50%
Biome Protection (National)30.52%19.28%22.86%21.87%46.61%58.85%
Biome Protection (Global)42.68%30.68%--57.32%69.32%
Species Protection Index25.11%16.20%25.05%22.25%49.84%61.55%
Protected Area Representiveness Index41.96%32.80%33.06%36.96%35.55%30.24%
Species Habitat Index9.40%9.89%28.86%30.11%61.74%60.00%
CO2 Emissions (Total)19.09%23.13%48.23%53.59%32.68%23.28%
CO2 Emissions (Power)10.93%11.08%43.61%47.60%45.46%41.33%
Methane Emissions11.30%26.66%41.43%49.61%47.26%23.73%
N2O Emissions11.62%36.90%53.00%52.64%35.38%10.46%
Black Carbon Emissions12.93%22.27%37.91%50.73%49.16%27.00%
SO2 Emissions11.01%31.17%53.74%38.32%35.26%30.51%
NOX Emissions6.47%26.79%47.77%34.73%45.76%38.48%
Wastewater Treatment60.72%5.70%28.11%31.94%11.17%62.36%
Sustainable Nitrogen Management23.20%29.50%70.57%35.76%6.23%34.74%

