Article

Clustering Algorithms and Validation Indices for a Wide mmWave Spectrum †

by
Bogdan Antonescu
,
Miead Tehrani Moayyed
and
Stefano Basagni
*
Institute for the Wireless Internet of Things, Northeastern University, Boston, MA 02115, USA
*
Author to whom correspondence should be addressed.
This paper is an extended version of our paper published in the proceedings of Wireless Days 2019 and of our paper published in the proceedings of Wireless Telecommunications Symposium 2019 with investigations of the application of clustering techniques to a wide range of frequencies in the mmWave spectrum.
Information 2019, 10(9), 287; https://doi.org/10.3390/info10090287
Submission received: 16 August 2019 / Accepted: 10 September 2019 / Published: 19 September 2019
(This article belongs to the Special Issue Emerging Topics in Wireless Communications for Future Smart Cities)

Abstract

:
Radio channel propagation models for the millimeter wave (mmWave) spectrum are extremely important for planning future 5G wireless communication systems. Transmitted radio signals are received as clusters of multipath rays. Identifying these clusters provides better spatial and temporal characteristics of the mmWave channel. This paper deals with the clustering process and its validation across a wide range of frequencies in the mmWave spectrum below 100 GHz. By way of simulations, we show that in outdoor communication scenarios clustering of received rays is influenced by the frequency of the transmitted signal. This demonstrates the sparse characteristic of the mmWave spectrum (i.e., we obtain a lower number of rays at the receiver for the same urban scenario). We use the well-known k-means clustering algorithm to group arriving rays at the receiver. The accuracy of this partitioning is studied with both cluster validity indices (CVIs) and score fusion techniques. Finally, we analyze how the clustering solution changes with narrower-beam antennas, and we provide a comparison of the cluster characteristics for different types of antennas.

1. Introduction

5G wireless technologies are a promising solution for many of the problems of current wireless networks, and especially of those concerning high-speed data transfers and ubiquitous connectivity requiring very low latency responses. Among these technologies, spectrum extension through the use of millimeter-wave (mmWave) band (30–300 GHz) with multiple GHz of unused bandwidth is one that has been receiving increasing attention [1,2]. Unfortunately, mmWave transmissions suffer from high propagation loss, sensitivity to blockage, atmospheric attenuation and diffraction loss, which brings in new unprecedented challenges to the implementation of communication systems at these high frequency bands. Tackling them requires well-thought radio channel propagation models that are obtained through extensive measurements (using steerable antennas and channel sounders), or via software ray-tracing simulations.
In this paper, we are concerned with two important tasks that help generate better radio channel models. First, we emphasize the role of clustering algorithms in grouping the incoming rays at the receiver site. Second, equally important, is the validation of their results. Clustering is paramount for fast processing of the received rays, and thus for extracting channel parameters in an efficient manner when the volume of data generated through simulations is huge. We use the well-known k-means clustering algorithm, in which we replace the usual Euclidean distance metric with the multipath component distance (MCD). Thus, a multi-dimensional space is defined by the channel parameters of the multipath components (MPCs). This space—based on the Time-of-Arrival (ToA), azimuth and elevation of the Angle-of-Arrival (AoA) and Angle-of-Departure (AoD)—is fed into the clustering algorithms, to provide the partitioning of all MPCs. Our analysis quantifies the goodness of the clustering algorithms through the use of five cluster validity indices (CVIs) and three score fusion techniques. The results show that, by using only CVIs we sometimes fail to find the optimal clustering number K because the indices might capture only specific aspects of a clustering solution. Therefore, we combine the five CVIs in an ensemble that becomes a better predictor of clustering quality than any CVI taken separately.
As an application of the two major tasks (clustering and validation) mentioned above, in the second part of our study, we increase the frequency of the transmitted signal, to cover other useful bands in the mmWave spectrum (e.g., 38, 60 and 73 GHz), and we verify how the clustering solution changes. Since directivity is extremely important to offset the large path loss and shadowing loss of the higher frequency mmWave signals, we replace the initial antenna with another one with smaller beamwidth, but higher gain, and we check if our clustering solution changes noticeably.
The results of our paper show that while higher frequencies (60 and 73 GHz) generate a sparser environment at the receiver, the number of clusters does not vary by much for many receivers in our outdoor scenario. Nevertheless, there are exceptions related either to the receiver being at the edge of the cell, or being much closer to the transmitter, at the entrance on a street with tall buildings (on both sides) that create a tunneling effect. Therefore, the longer delays experienced by some MPCs or the multitude of rays due to more reflections and scattering increase the number of clusters in some spots.
In our study, the clustering solution for each receiver is found not only for different frequencies of the transmitted signal but also for different half-power beamwidth (HPBW) antennas. In this context, we show that the most representative MPCs (i.e., the cluster heads) discovered for the lowest mmWave frequency (28 GHz) transmissions have larger times-of-arrival (ToA) and a wider range of angles-of-arrival (AoA), while the antenna beamwidth does not affect much these statistics.
Finally, we analyze the root-mean-square (RMS) delay spread (DS), as an important indicator of the radio channel quality. It helps evaluate the time dispersive properties of the channel and gives an estimation of the maximum data rate for transmissions. Thus, we provide the distribution of the RMS DS values based on the values calculated for the cluster heads (CHs) identified in the clustering process. Our results show that the delay spread of the narrower antenna is smaller at both ends of the studied spectrum (28 and 73 GHz). We also report a smaller overall RMS delay spread for both antennas for the case of transmissions at 73 GHz. These results demonstrate the importance of directive antennas with higher gain that allow for higher data rates in the channel.
The rest of the paper is organized as follows. Section 2 represents a brief primer on clustering techniques and the validation of their results. It also introduces the setup of our simulations. Section 3 describes in detail the results obtained in our study. Section 4 concludes the paper and opens the path for more research in this area.

2. Clustering Concepts and Simulation Environment

In this section, we provide a brief introduction of the clustering algorithms and validation techniques that we use in our paper. Then, we describe the ray-tracer simulation set-up and the block diagram of the MATLAB environment that coordinates the generation of the transmitter (Tx) and receiver (Rx) points used in the simulation and the processing of the channel parameters estimated by the ray-tracer.

2.1. Clustering for Channel Modeling

mmWave transmissions are reflected and scattered due to various obstacles in the path between transmitter and receiver, thus creating many rays or multipath components (MPCs) at the Rx location. The goal is to capture all these MPCs that experience different delays, angles-of-arrival and attenuation, and to group them in clusters, in order to generate more accurate channel propagation models. As an example, Gustafson et al. [3] argued that modeled root-mean-square (RMS) delay spread (responsible for the time dispersive properties of the channel) can produce wrong estimates if some of the clusters are missed.
A short definition of a cluster is a group of rays/MPCs with similar temporal and angular profile. Our professional ray-tracer tool estimates not only temporal characteristics (e.g., excess time delay) but also spatial information (e.g., directions of departure and arrival) for all received rays. Therefore, knowing the Time-of-Arrival (ToA), Angle-of-Arrival (AoA) and Angle-of-Departure (AoD) values, we can infer how sparse the channel is. Visual inspection [4] can be applied to identify clusters in the channel impulse response (CIR) if there is a time separation between clusters that allows the partitioning of the CIR in different bins [5]. The delay axis is divided into bins with size comparable to the inverse of the transmission bandwidth, with the assumption that MPCs arrive in each bin. While this is possible for certain simulations with a small number of received rays, it is not a preferred method for a larger number of MPCs for which clustering algorithms are recommended.
In our paper, we consider well-known center-based clustering algorithms that group the input data around few centroids [6]. k-means [7] and its variation (k-power-means) are applied in many studies [8,9,10,11]. k-means allocates the MPCs with similar temporal and spatial features into K clusters using an a priori guess about this number. The algorithm calculates the distance from each MPC to the chosen centroids, and assigns the ray to the cluster with the closest centroid:
D = l = 1 L d ( x l , c x l ) .
In the above equation, d ( · ) is the distance function between any two points in the parameter space while x l is the parameter of the lth MPC and c x l is the parameter of the cluster centroid closest to the lth MPC. Through an iterative process, the algorithm finds the optimum location of the centroids and minimizes the distance between the MPC and its centroid. This concept of distance can be applied to all channel parameters (e.g., ToA, AoA, and AoD) estimated by the ray-tracer. Nevertheless, there is an improvement if we use the delay and angular domains jointly [12], instead of performing a sequential search. By doing that, the distance in Equation (1) is replaced with the multipath component distance (MCD), and the result is a hyper-sphere with a radius given by:
M C D i j = | | M C D A o A , i j | | 2 + | | M C D A o D , i j | | 2 + M C D τ , i j 2
where i and j are any two estimated MPCs. The clustering algorithm works as follows. All rays are first sorted based on their delays. The MCD values between the ray with the shortest delay and all the other rays are calculated. The rays that have an MCD value smaller than a certain threshold are grouped in the same cluster with the ray that has the shortest delay. The procedure repeats for all remaining rays until they are assigned to a cluster. In the end, each cluster is defined by the delays and angular characteristics of the ray with the shortest delay in that cluster.

2.2. Cluster Validity Indices

Clustering is an unsupervised pattern classification method. It partitions elements in a dataset into clusters such that elements with similar values for various parameters are part of the same cluster. In our simulations, the MPCs that arrive at the receiver exhibit different values for their radio channel parameters. They have various power levels and they come with different delays (ToA) from multiple directions (AoA and AoD). The next step after clustering all these MPCs using the k-means algorithm with MCD metric is to validate the partitioning. There are few reasons for knowing how accurate the number of clusters is. An optimal clustering algorithm does not exist. In other words, different algorithms produce different partitions and no algorithm is considered best for all input datasets. In addition, the initialization stage for many clustering algorithms requires a guess about the possible number of clusters K, which is difficult to estimate a priori. Therefore, the common approach is to run the clustering algorithm several times with different K values. Then, the resulted partitions are evaluated, to determine which one best represents the input data. k-means is a good representative for this category of algorithms.
The techniques used for cluster validation fall in three major categories based on the information available during the validation process. The external ones validate the outcome of the clustering process by comparing it with a known partitioning, in a controlled environment. The internal methods have access only to the clustered data, thus they measure the compactness and separation of the clusters. Our paper falls in this category. The third technique, relative validation, compares clustering solutions obtained with the same clustering algorithm running with different parameters or with different subsets of the input data.
The validation indices used in our paper are Calinski–Harabasz [13], Davies–Bouldin [14], generalized Dunn [15,16], Xie–Benie [17] and PBM [18]. We described their formulas and the way they measure the cluster size and the cluster separation in our previous paper [19].

2.3. Using Multiple CVIs to Compare Clustering Solutions

CVIs are used as validation tools for the results of many clustering algorithms because they quantify various properties of the solution (e.g., compactness and separation between clusters). The optimal number of clusters K for a specific algorithm is the one for which the CVI experiences its min or max value, as described in [19]. Unfortunately, the CVIs capture only specific features of the clustering solution, based on the fact that their formulas measure only cluster compactness and separation. For that reason, a cluster with an elongated shape might not be compact enough. As such, no CVI should be assumed a priori better than others. Starting from this assumption, Kryszczuk and Hurley [20] proposed to merge multiple CVIs in an ensemble, to generate a score for a better prediction of the clustering quality. In this paper, we use these score fusion-based techniques, to find the optimal K value. The combined scores S F x are computed using M normalized CVIs, and are based on the arithmetic, geometric and harmonic means (Equation (3)):
S F a = 1 M i = 1 M ν i ; S F g = i = 1 M ν i 1 M ; S F h = M i = 1 M 1 ν i 1
According to Kryszczuk and Hurley [20], the best normalization method is the min-max. We use this method to normalize all our CVIs (i.e., to produce values in the range [0, 1]). Xie–Beni and Davies–Bouldin CVIs are the only ones in our set that select the optimal K with their min value, thus we have to subtract their normalized value from 1. By doing that, Table 1 captures the normalized and biased sets of the CVIs where each CVI column points to the optimal K number through its max value. At the same time, the three S F x columns combine the CVI values on each row of the table while their arithmetic mean (in the last column) represents the final ensemble predictor.

2.4. Simulation Setup

This section describes the ray-tracer simulation set-up and the block diagram of the MATLAB environment.
We used an urban scenario (Rosslyn, VA) available with our ray-tracing tool (Wireless InSite by Remcom), to simulate 28 GHz transmissions between a fixed transmitter unit and a receiver unit placed at different locations. The input to this professional electromagnetic simulation tool can be site-specific data for any scenario. The tool takes into consideration the effects of buildings, materials, terrain and even weather, and generates rays for mmWave transmissions with very high angle resolution (0.2°). Then, it evaluates the signal propagation characteristics using all these factors. The result consists in very accurate channel parameters obtained in a much shorter time compared with what would be required to measure them with dedicated hardware (e.g., channel sounders and horn antennas). Finally, the estimated channel parameters are fed to the clustering algorithm.
For the considered urban scenario, we placed the Tx (base station) on a light/traffic pole (with a height of 8 m) in the north part of Figure 1 (the green dot). The Rx unit was installed in a vehicle at approximately 1.5 m above ground, and moved to any location shown as a red dot in the same picture. There are two types of transmissions, namely Line-of-Sight (LOS) and Non-Line-of-Sight (NLOS). The former was simulated in the north–south direction by moving the vehicle at different locations on a main street, at a distance of maximum 150 m from the transmitter. The NLOS reception mode was achieved through reflections and scattering, and was simulated on a side street oriented in the east–west direction, as shown in Figure 1. In this case, we moved the vehicle at distances of 70–150 m from Tx. The focus of our simulations was primarily on the more challenging NLOS scenario.
Two horn antenna models with different half-power beamwidth (HPBW) and gains ( 7 /25 dBi and 22 /15 dBi) were considered as part of the ray-tracer setup. The same antennas (either 7 or 22 ) were placed at both Tx and Rx locations in one experiment. The transmitted signal never exceeded a maximum power of 24 dBm. For each path from the transmitter to the receiver, the ray-tracer was set to follow a certain number of reflections (6) and diffractions (1), to limit the computational effort of the ray-tracer’s internal engine. In all our previous studies, we considered two beam alignment methods. The no beam alignment (Figure 1) means that the Tx and Rx antennas are only oriented with the street direction. The beam alignment procedure implies that we detect (at each Rx location) the direction of the strongest reception path, and we align the bore-sight of the Rx antenna with this direction. This procedure increases the processing effort in the MATLAB environment, thus, for shortening the simulation time, we applied only the no beam alignment technique.
The simulations required a pair of Tx–Rx points. Since the Tx point was fixed, one task for MATLAB was to generate the random Rx point used by the ray-tracer at each Tx–Rx separation distance. The result of each simulation is represented by numerous estimated channel parameters. For each random Rx, we saved the values of the received power, excess delay, angle-of-arrival and angle-of-departure of all MPCs that arrived at that location. If L MPCs are received, each channel parameter is an array with L values. The goal of the clustering algorithm (applied to each parameter) is to find the distribution of the received power over time, the delay of the received rays in comparison to the LOS path, and the mapping of the preferred ray arrival directions within each cluster. The alternative is a multidimensional space (e.g., the MCD metric [12]) that we use in this paper to find a correlation among these parameters.
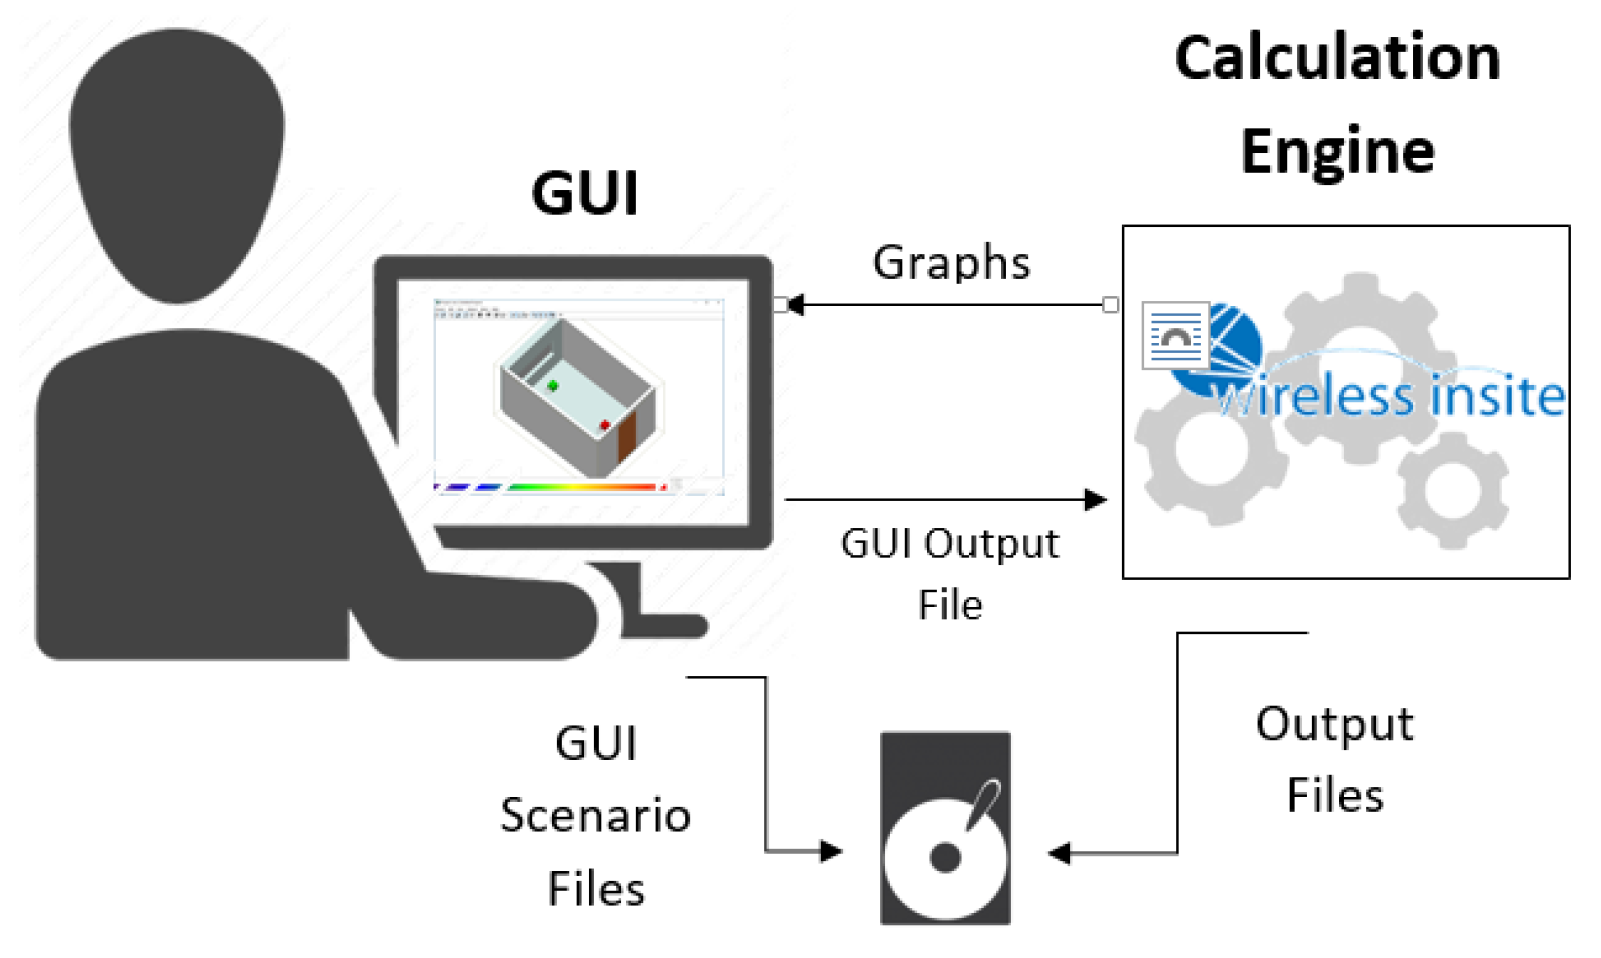
To build efficient ray-tracer simulations for our urban scenario, using multiple Tx–Rx pairs, we propose the MATLAB environment shown in Figure 2. MATLAB coordinates the entire simulation process. First, it generates the coordinates of the Tx and Rx points. Second, it provides these points one by one, as inputs to the calculation engine of the ray-tracer tool. Third, it receives the simulation results (i.e., the estimated channel parameters), and it processes them by implementing the clustering algorithms and the validation techniques described in this paper.

3. Simulation Results

This section provides the results of our simulations. First, we introduce the clustering algorithm results for the 28 GHz communications and the clustering validation process that proves why this partitioning is the correct one. Then, we show how the frequency of the transmitted signal influences the numbers of MPCs and clusters at each receiver. We also study the influence of the antenna beamwidth to the above-mentioned channel characteristics by selecting a more directive antenna with higher gain. Finally, we provide cluster statistics for both types of antennas and for all four mmWave frequencies used in our study.

3.1. Clustering Algorithm Results

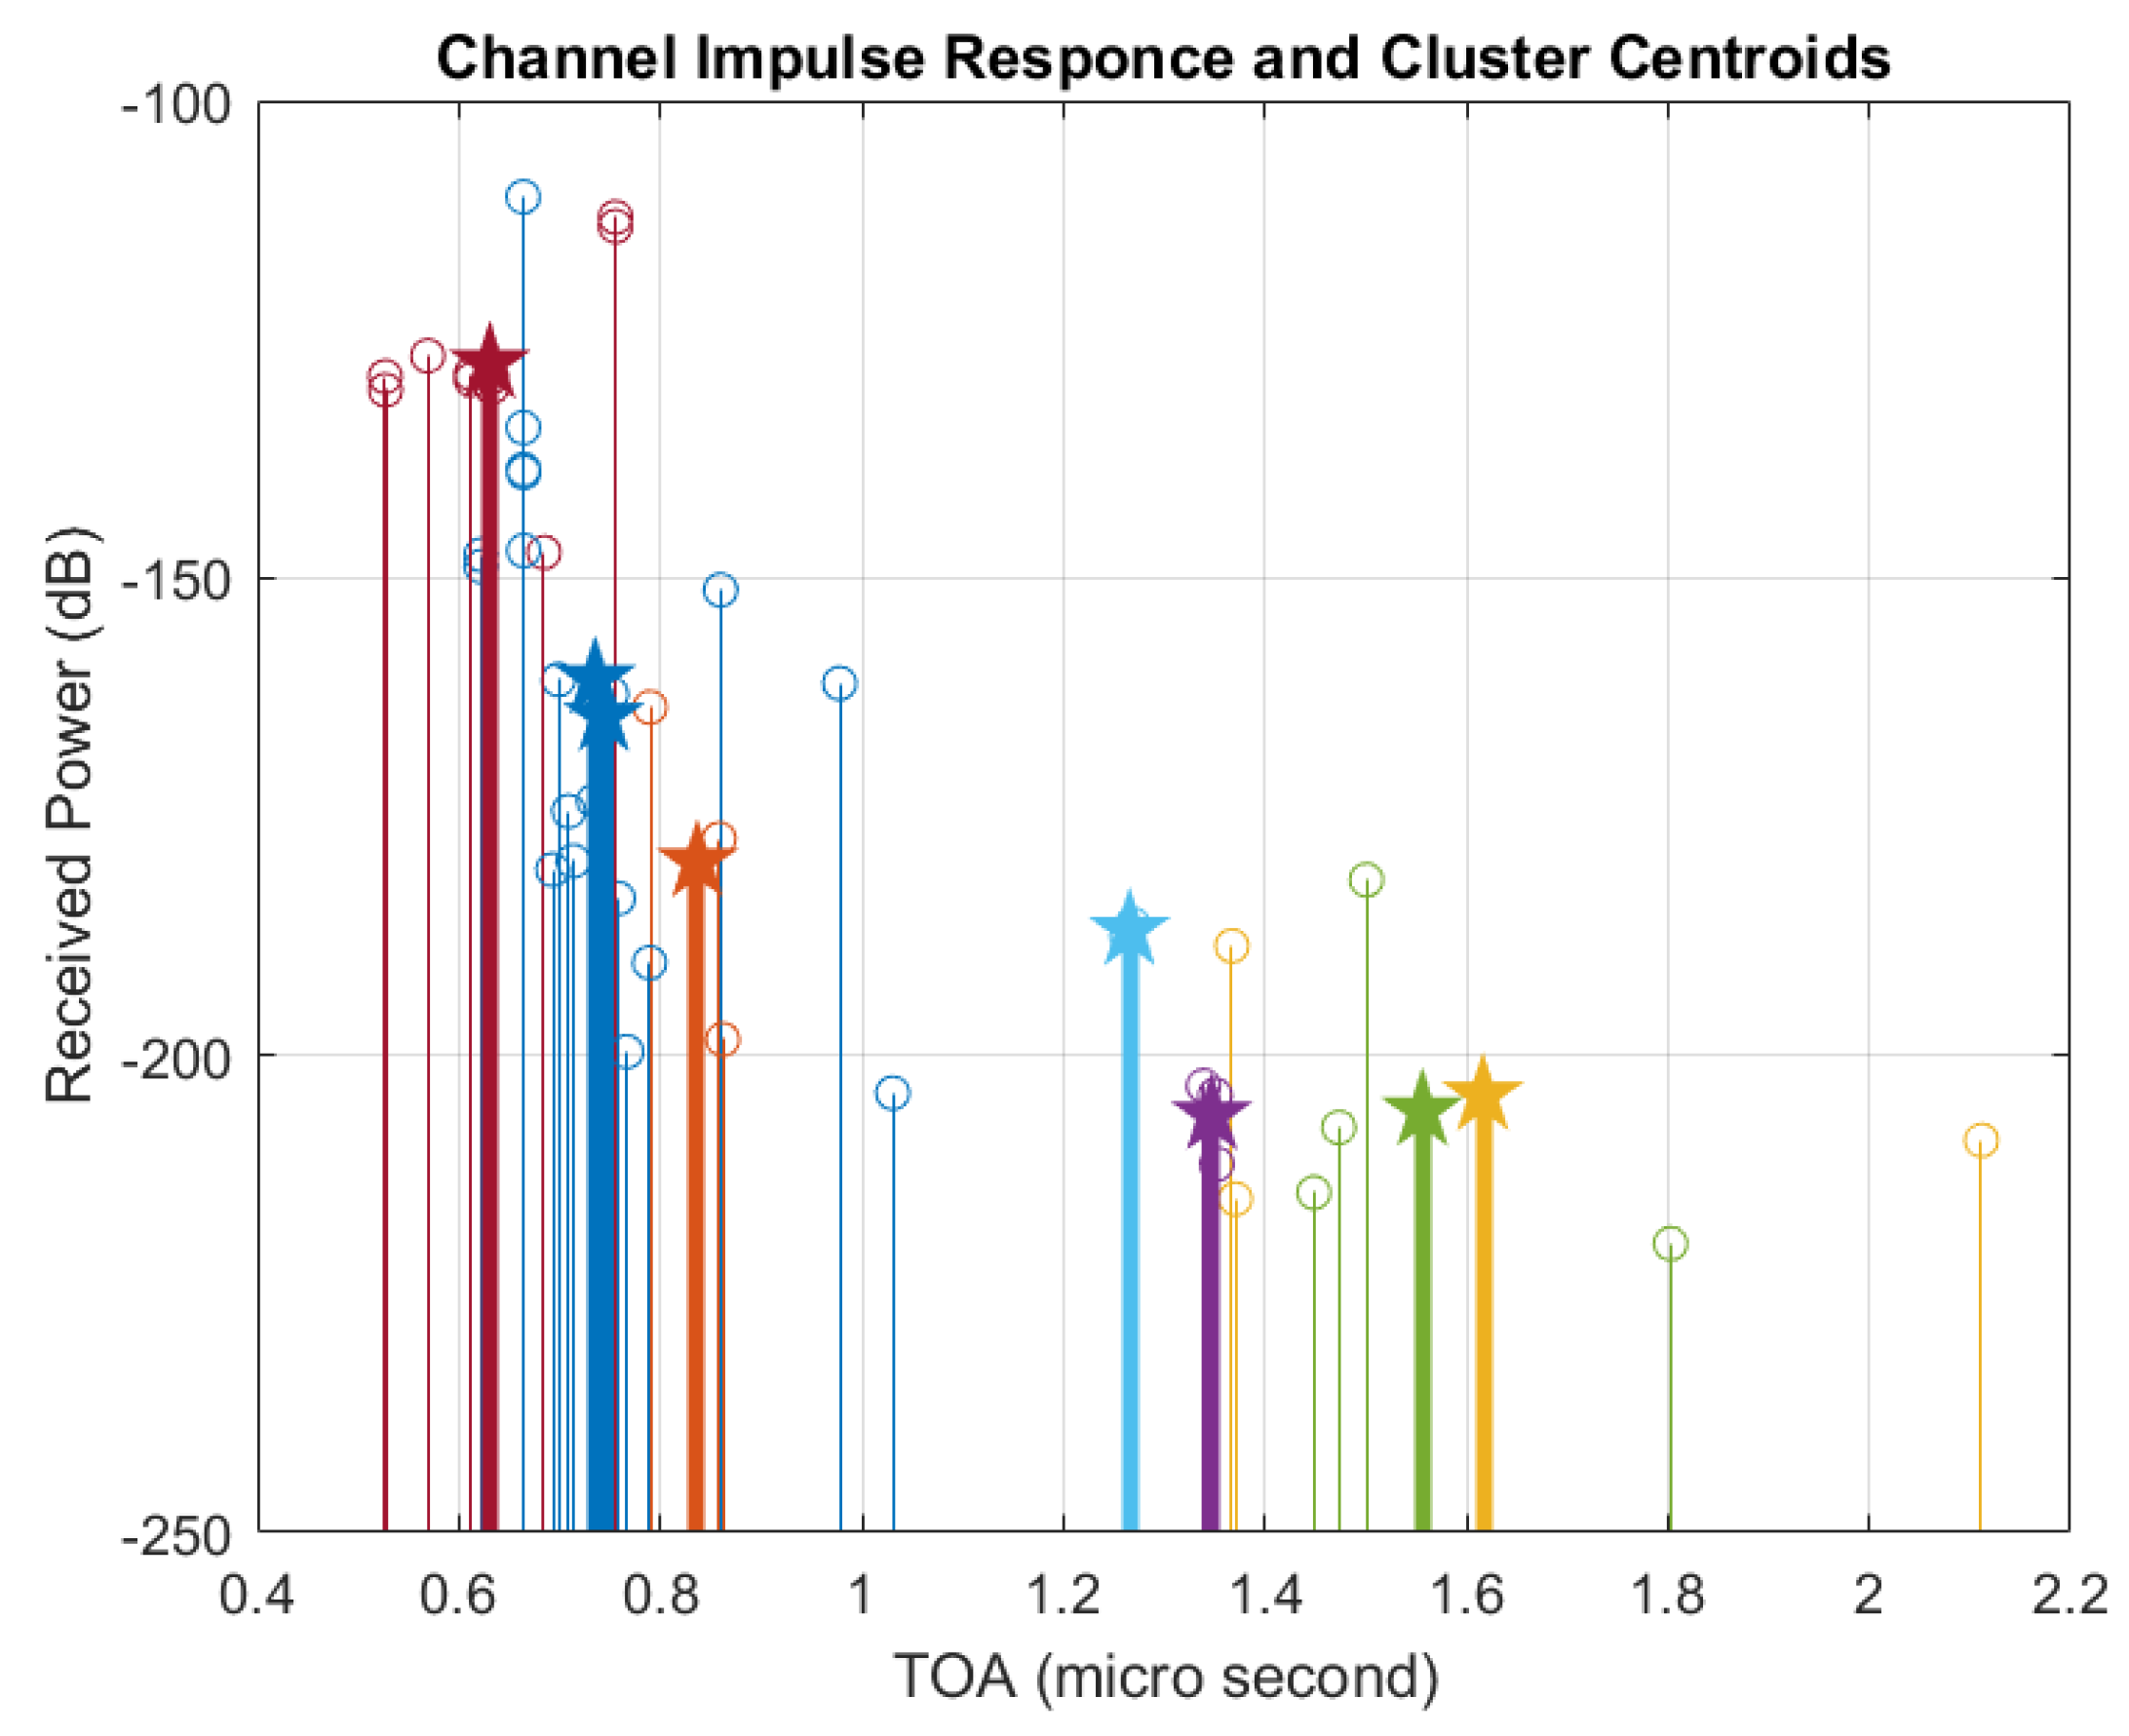
We simulated the NLOS scenario described in the previous section, and we obtained 44 MPCs at receiver point (Rx#9) on the side street shown in Figure 1. Each of these MPCs was characterized by a power level, angle-of-arrival (AoA), angle-of-departure (AoD), and a specific excess delay (ToA). The relationship between the received power levels of various MPCs and their ToA (for a one-time channel realization) is depicted (Figure 3) by the real part of the complex impulse response (CIR). After clustering the 44 MPCs, we clearly mark the average power value and ToA of each cluster.
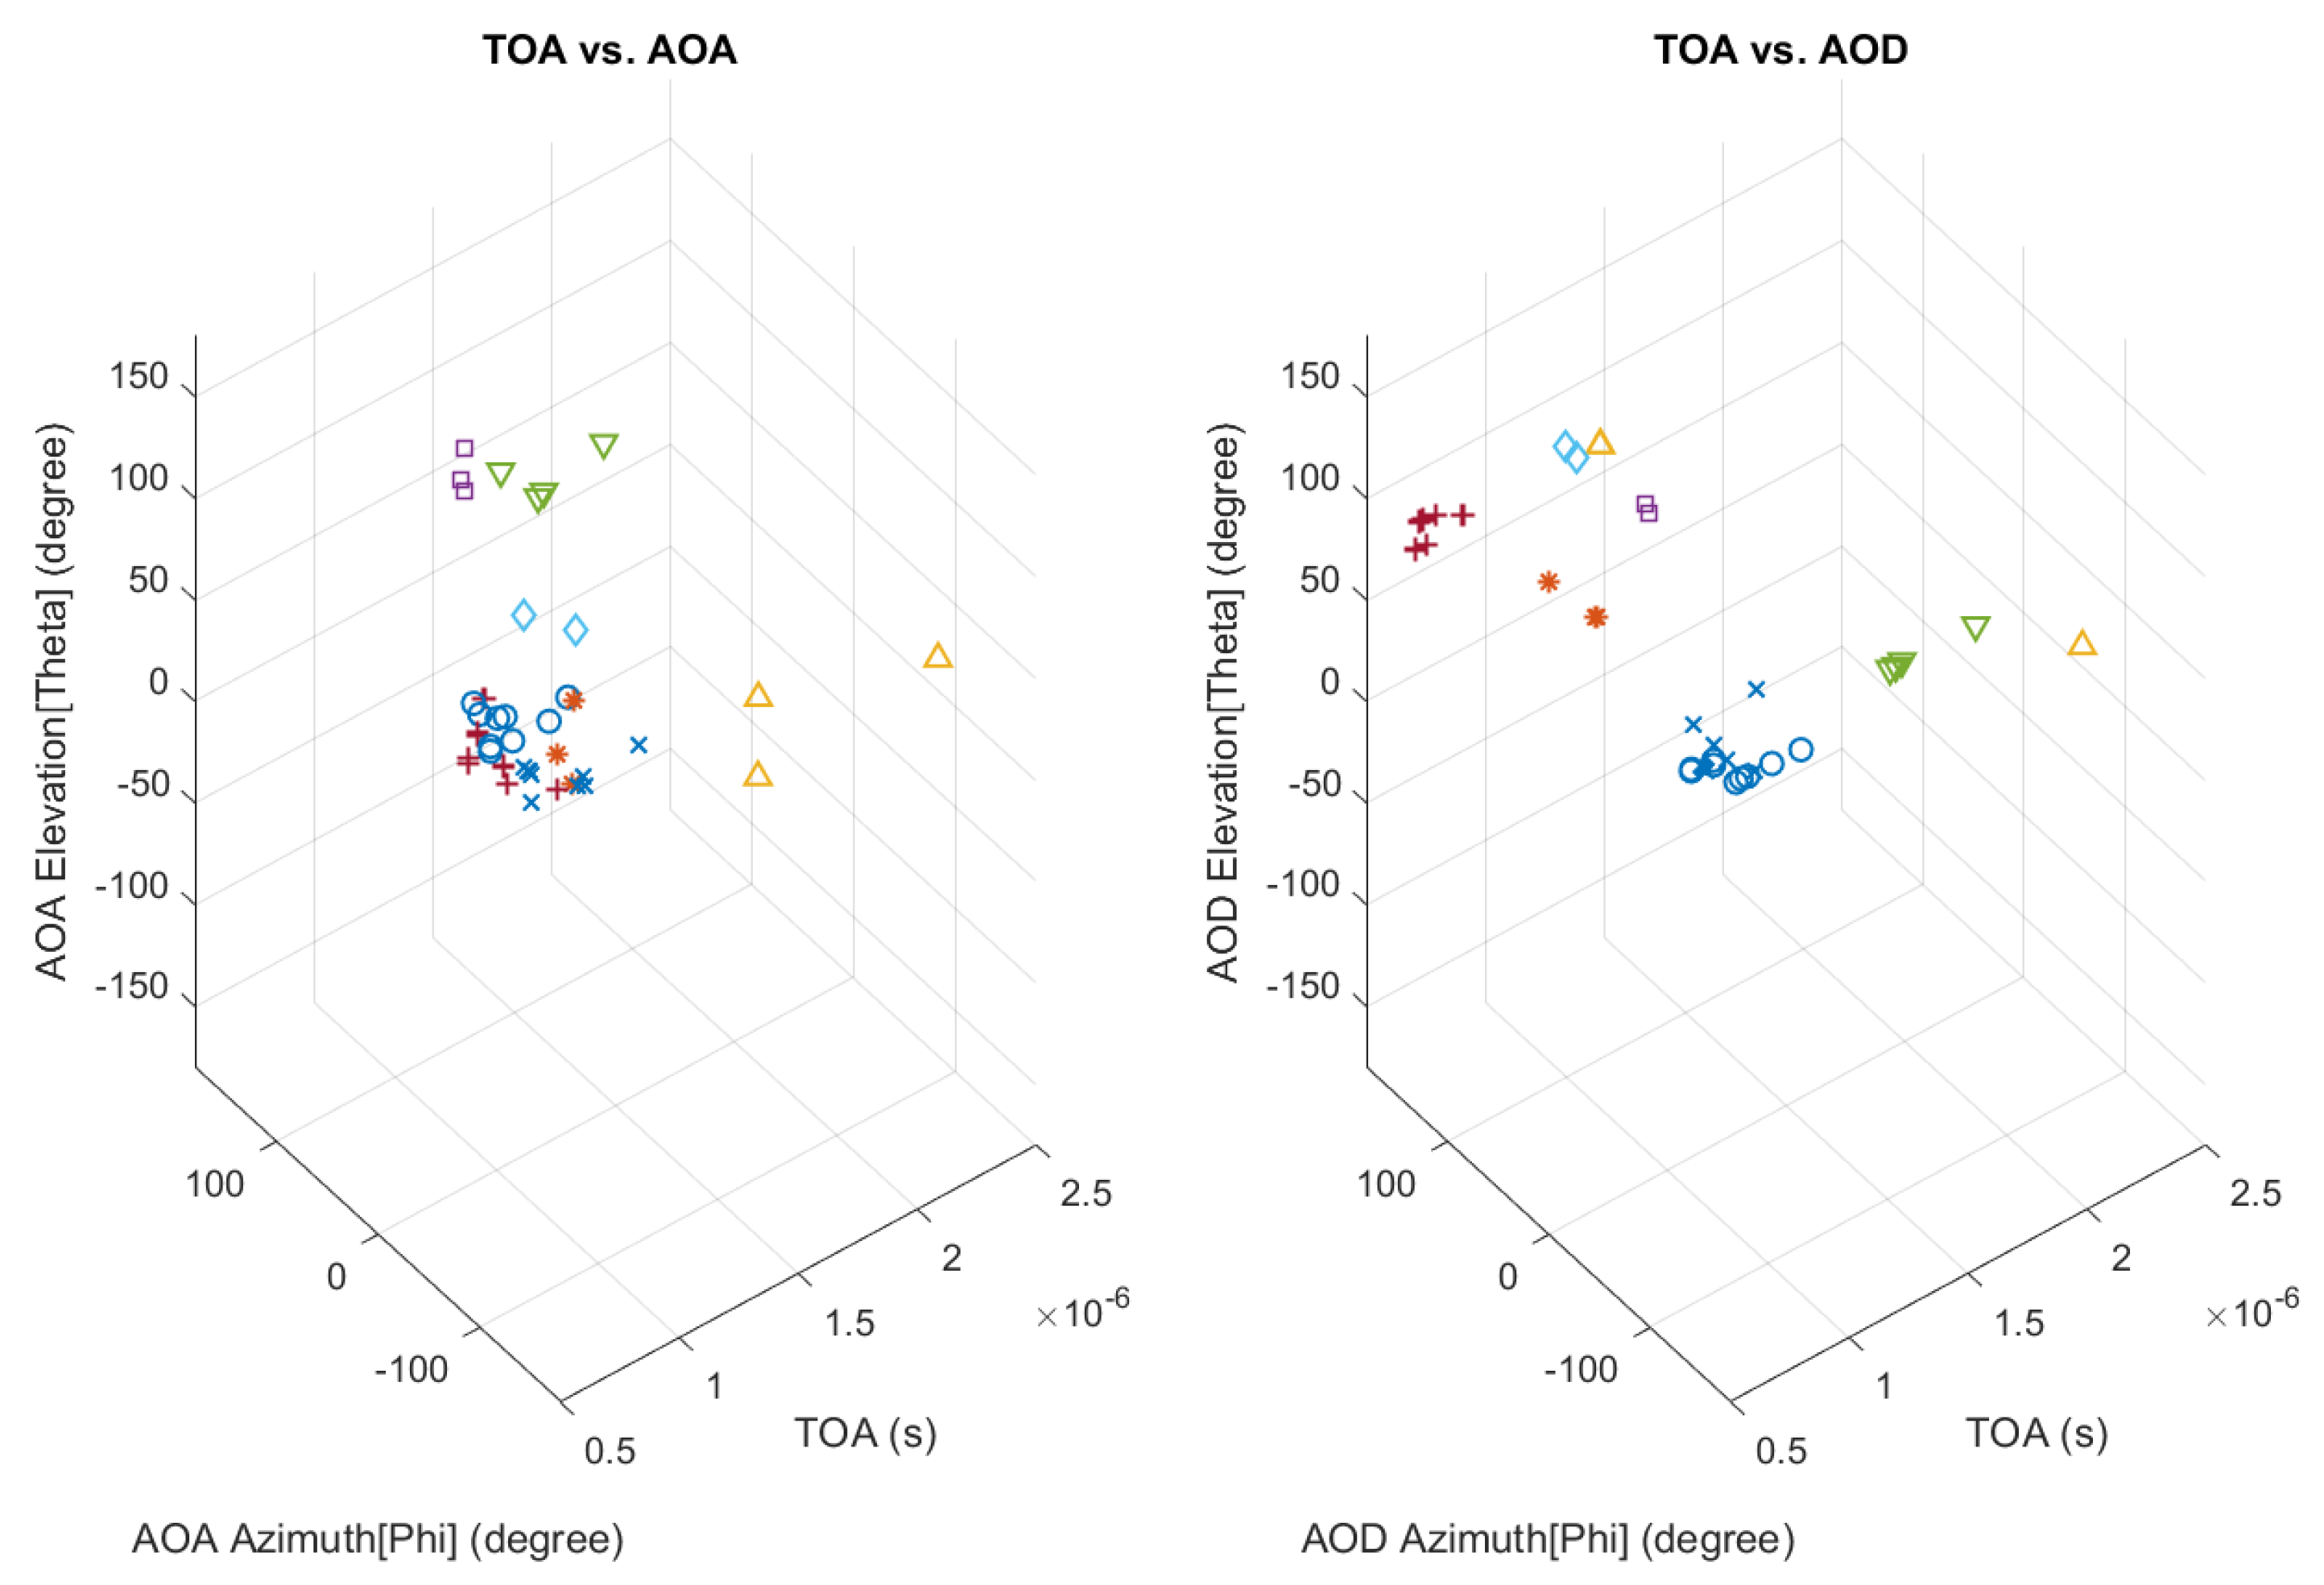
Once the number of MPCs becomes large enough, a simple visual inspection is impossible for clustering purpose. Therefore, we used the k-means algorithm with MCD metric. The MPCs were grouped in different clusters based on their delays and angles-of-arrival and departure, and the 3D results are shown in Figure 4. There is an advantage to capturing all five parameters of the MPCs (azimuth and elevation for AoA and AoD, and excess delay). A better clustering solution is possible because we can correlate radio channel parameters in both time and space.

3.2. Clustering Validation Using CVIs and Score Fusion Results

The clustering algorithm produces a partitioning for each input K. The next step is to find the optimal number of clusters K, by applying the CVIs mentioned in Section 2.2. Based on Section 2.3, this is a difficult task because some CVIs might not be able to find the preferred solution. Nevertheless, if we combine few CVIs in a fusion classifier, we have a better chance to find K. This section shows how the clustering validation works, and gives the results of the score fusion techniques described by Equations (3).
The CVI plots presented here are the result of considering various K inputs for the clustering algorithm. They show how efficient the five CVIs are in the validation process, based on the range of values assigned to input K. Our analysis uses receiver Rx#9 (Figure 1), at approximately 150 m from the Tx/base station location. The clustering algorithm requires an initial guess for K. Having only 44 MPCs at this receiver, we consider maximum 15 clusters. Therefore, the k-means clustering algorithm uses K in the range [2, 15].
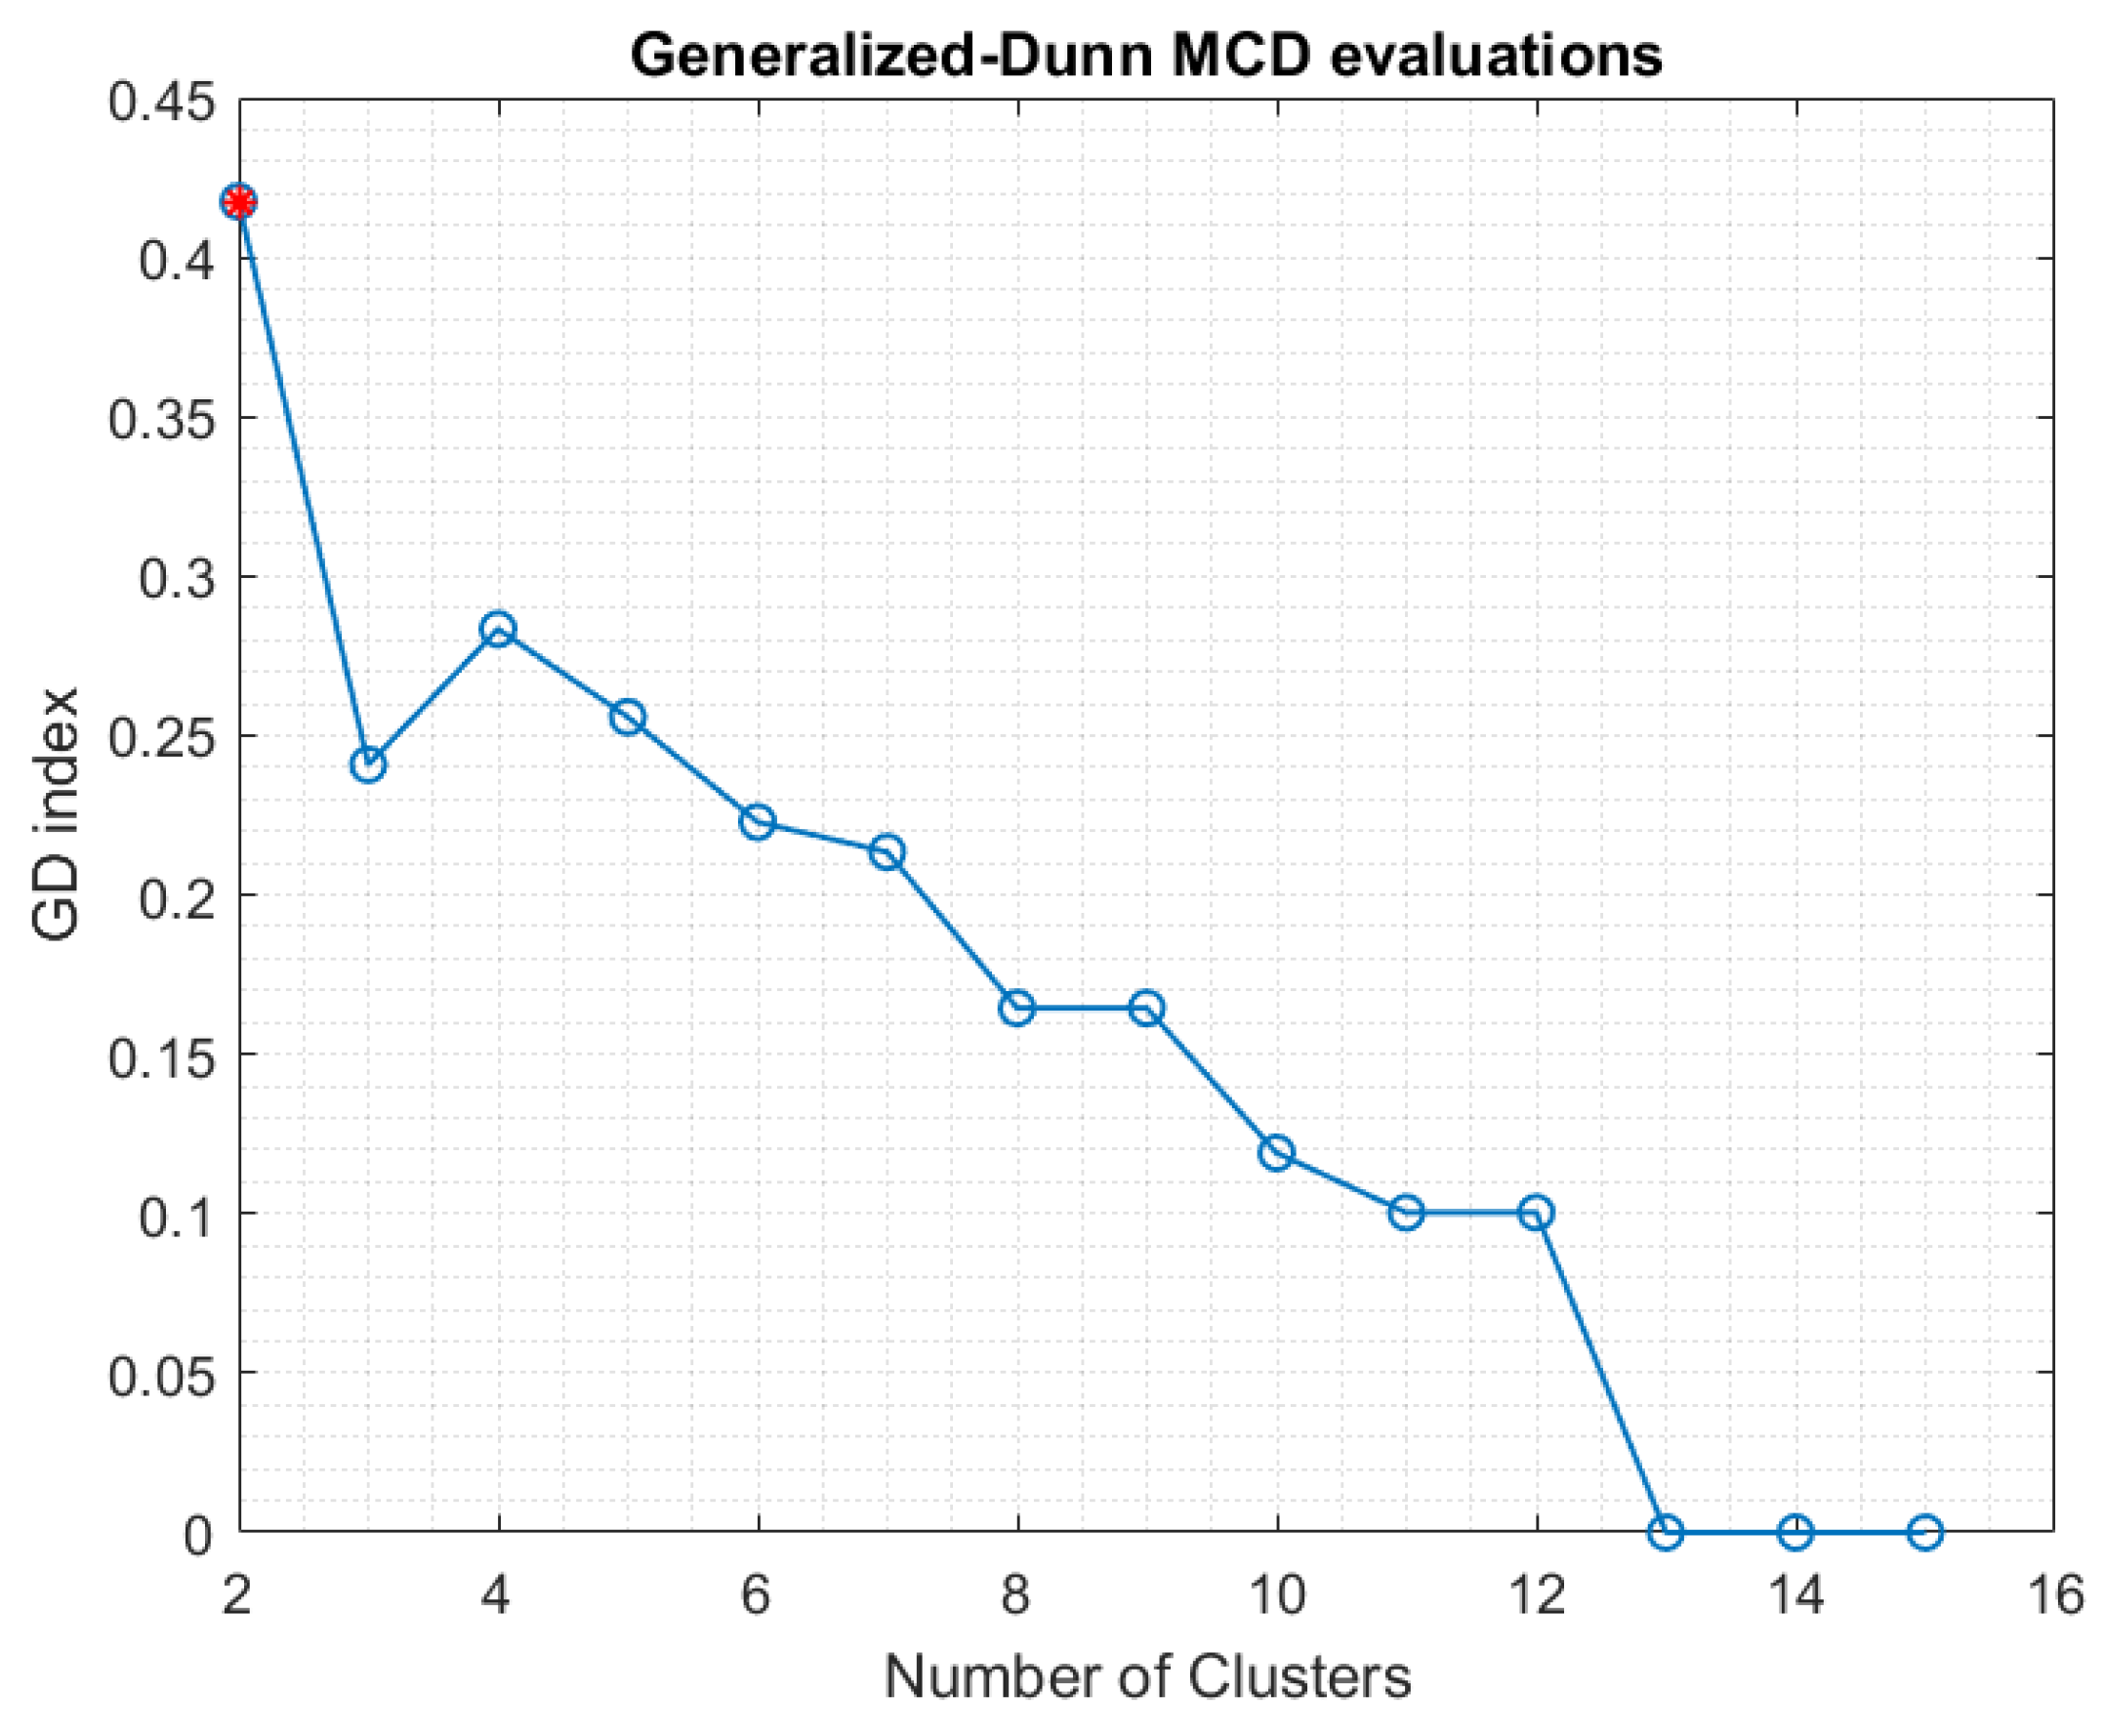
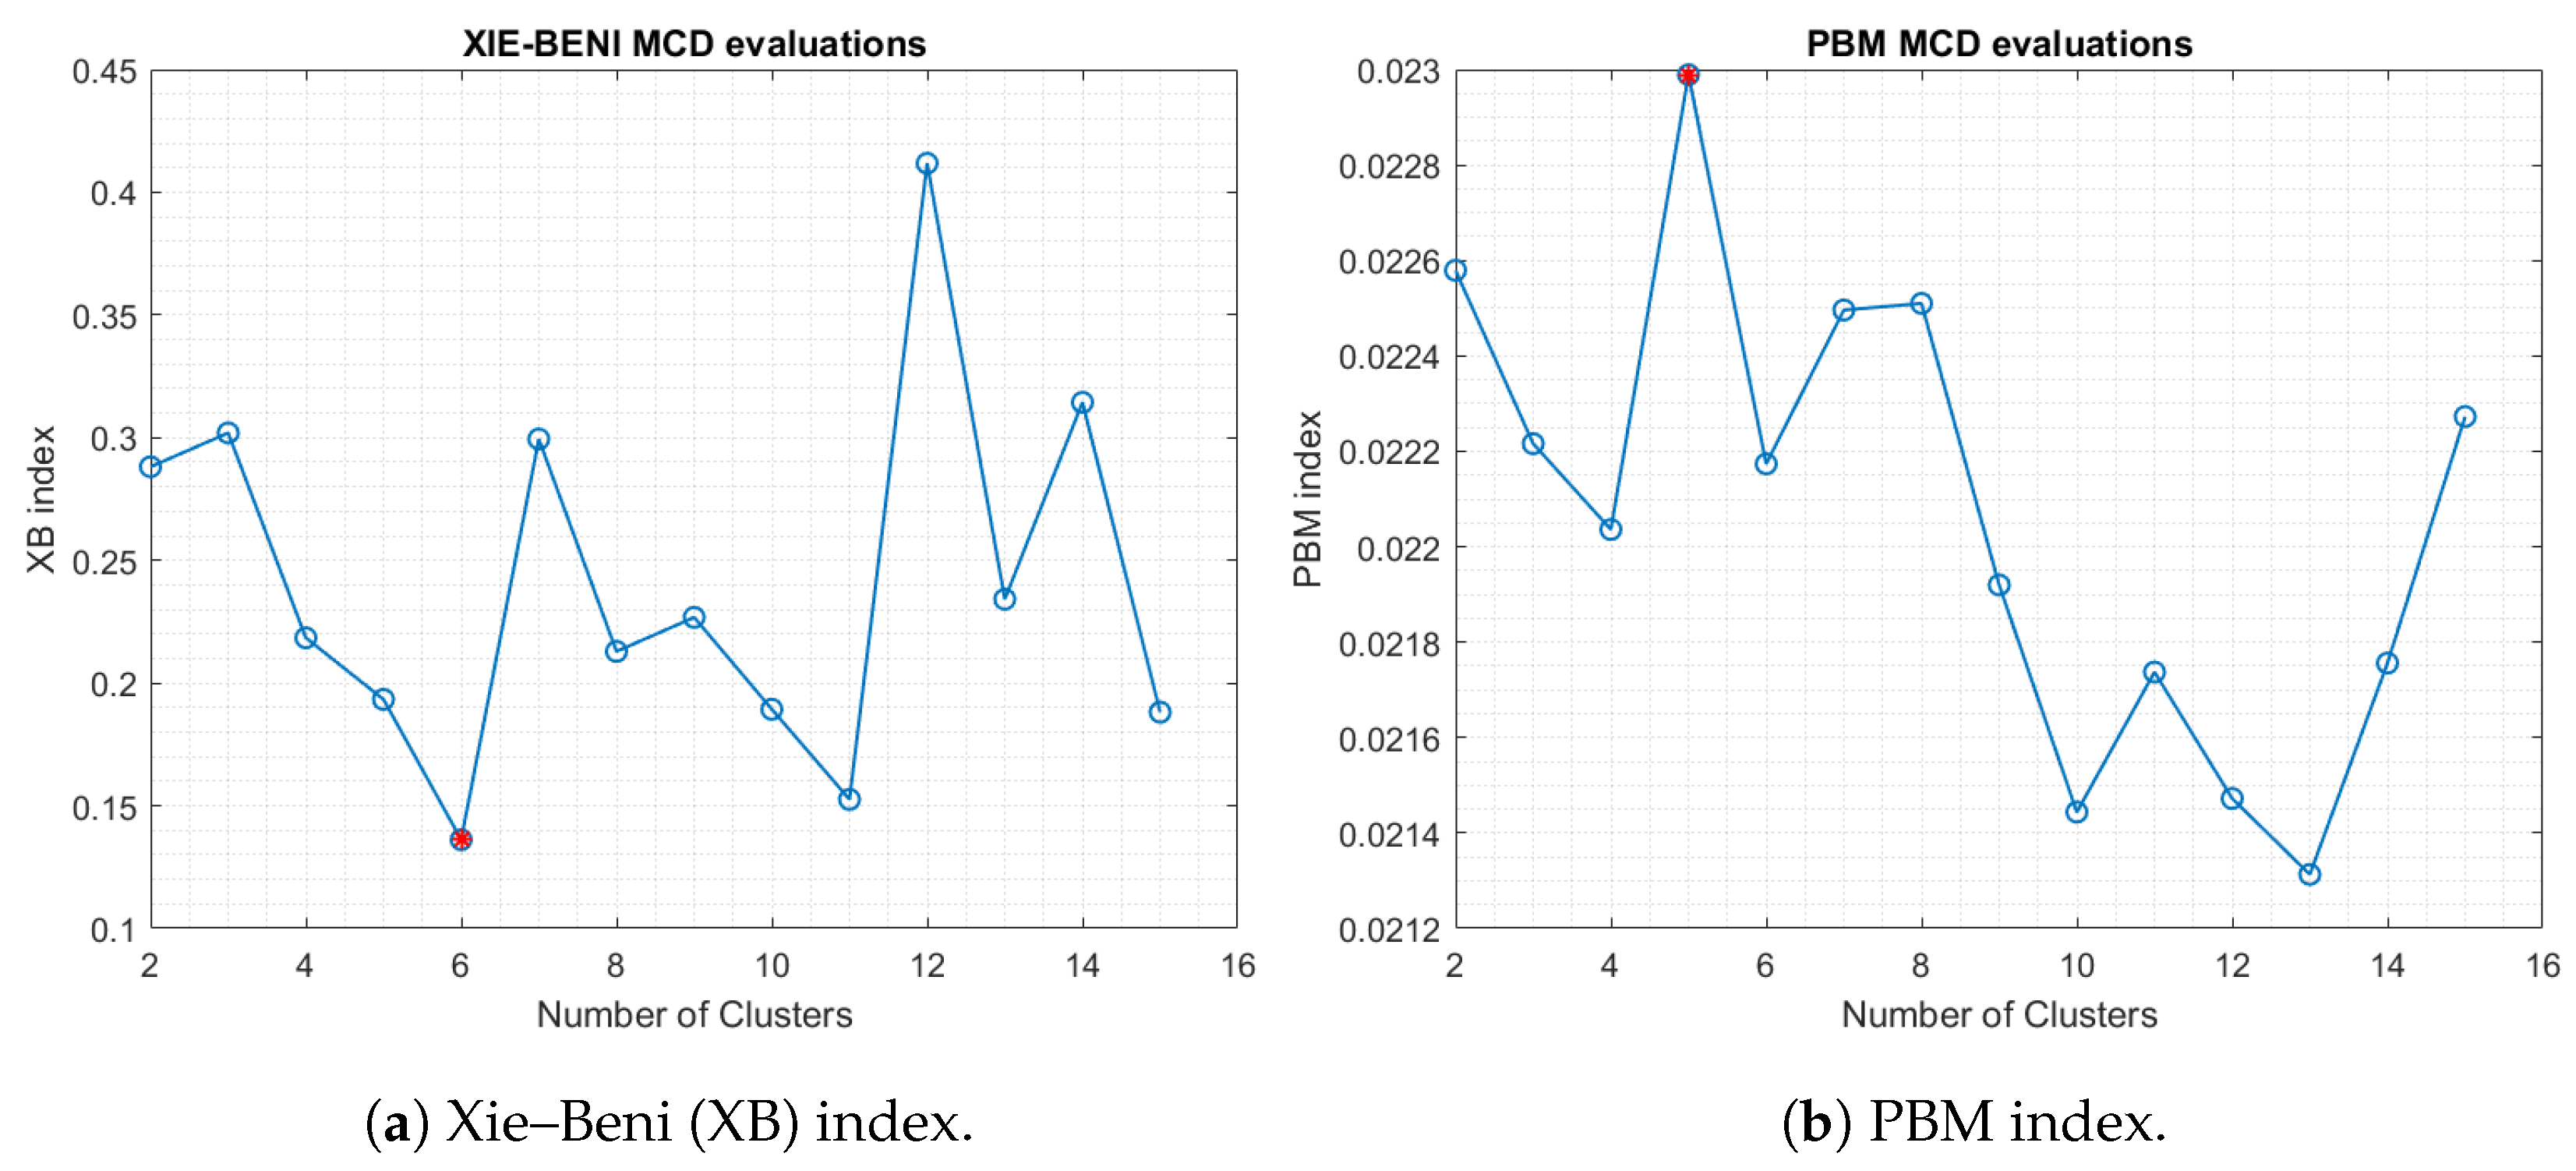
As stated, not all CVIs are able to find the optimal number of clusters K for a given data input. According to the CVIs descriptions in [19], the CH index identifies the optimal value K when the index reaches its maximum value. In Figure 5a, this cannot be the case because a value of 15 clusters is not practical. The same problem is experienced with the DB index in Figure 5b. We cannot have only two clusters. The plot for the GD index (Figure 6) is yet another bad outcome because it reports the same small number of clusters. However, XB (Figure 7a) and PBM (Figure 7b) indices report credible values. XB points to K = 6 while PBM index chooses K = 5 .
To this end, we found that some CVIs report an unrealistic number of clusters while a couple of CVIs succeeded to find potential values for the K number. Section 2.3 introduces a theory about a better ensemble predictor for this task. To check that, we normalized and biased the CVI values calculated for Rx#9 location, and we used these values in Equation (3) (see Table 1). Examining this table, we see that not all CVIs have their maximum value on the same row. As a consequence, we could not predict the K value using only CVIs. Thus, we resorted to score fusion methods. The solution becomes visible because at least two scores ( S F g and S F h ) agree with each other. In one last step, we also took the arithmetic mean of the three S F x scores. This result, shown in the last column of Table 1, identifies K = 8 , which is the same with the values predicted by the geometric ( S F g ) and harmonic ( S F h ) mean-based scores. Using K = 8 , we ran the k-means clustering algorithm with MCD metric, and we obtained the grouping of the 44 MPCs around the K centroids (Figure 4).
We applied the above procedure and analysis to the other 13 receivers placed on the same street with Rx#9. The optimal K clustering values for all these locations are shown in Table 2. As we can see, the row for Rx#9 captures the numbers of clusters predicted by CVIs in Figure 5, Figure 6 and Figure 7 and by S F x scores in Table 1. For almost all the other receivers, the three score fusion factors reported on each row and their average value agree on the same optimal K value.

3.3. The Effect of Increased Frequency in the mmWave Spectrum

In this section we study the effect of increased mmWave frequency on the number of MPCs and clusters perceived by the receivers placed on the street used in the NLOS scenario. Besides 28 GHz, other frequencies of interest for many outdoor and indoor applications are in the 38, 60 (V-band), 70 and 80 (E-band) and 90 GHz (W-band) bands. Our study addressed only 38, 60 and 73 GHz bands. The 60 GHz frequency band with its huge 7 GHz bandwidth is provisioned for unlicensed operation and mostly used for indoor scenarios (e.g., IEEE 802.11ad) because the transmitted signals experience a higher attenuation due to oxygen absorption. Nevertheless, communications in this band are not severely hampered in the 200 m small-cell range of interest to us. One example of using the 60 GHz band for outdoor communications are the BridgeWave BW64 systems [21] for point-to-point (building-to-building) links in places where the installation of fiber optic cable is not feasible or very expensive. The other two frequency bands 38 and 73 GHz also enjoy large transmission bandwidths of 4 GHz and 5 GHz, respectively, with much lower attenuation comparing with the 60 GHz. The rain attenuation can be severe for the E-band transmissions, but again, not a problem for the small cells that we consider.
We ran the same type of simulations for the three frequency bands (38, 60 and 73 GHz) mentioned above, as we did for the 28 GHz case. We expected to obtain fewer and fewer MPCs for each Rx location on that street, as we moved higher in frequency (above 28 GHz), due to an attenuation model well documented in many research papers [2,22]. Our simulation results confirm this fact (Table 3a). If we correlate the results in this table with Figure 1, we notice how the buildings on both sides at the entrance on the street act as a tunnel, allowing for more reflections and scattering while also guiding the bounced rays on this path. All obstacles and buildings on that portion of the street generate many MPCs that are detected in larger number by the receivers placed in the first half of the street. This is in contrast with the location of the Rx#9 receiver where we start having larger gaps between the buildings on one side of street, thus allowing many of the reflected MPCs to escape detection. This behavior is maintained across all four studied frequency bands, the only comment being that the number of MPCs at 73 GHz is approximately half of the one at 28 GHz. Hence, the hard requirement for the transmissions at higher mmWave frequencies is to use more directive antennas with higher gain, in order to offset the loss in the received power budget due to less and more attenuated MPCs.
In our scenario, especially at the entrance on that street, the sparsity of the mmWave spectrum with increased frequency did not necessarily translate into a smaller number of clusters when we applied the k-means algorithm (Table 3b). Even though we have fewer MPCs, the ray-tracer reports that they suffer now a larger angular/spatial dispersion (e.g., larger RMS angular spread for the azimuth of the AoA). Equally important is that these higher-frequency MPCs arrive at some receivers on that street with increased RMS delay spreads and with much smaller power. This spatial and temporal dispersion, captured by the MCD metric of the clustering algorithm, explains why we experience more clusters at some receivers, as we increase the frequency of the transmitted signal. Tables similar to Table 1 and Table 2 are produced for all the other three frequencies in our study, but the final target is to estimate the optimal number of clusters K. Thus, for space limitation, we summarize in Table 3b only these values for all four frequencies.

3.4. The Effect of Antenna Beamwidth

We repeated our NLOS simulations using a more directive 7 HPBW antenna that has a higher 25 dBi gain comparing with the 22 /15 dBi horn antenna used in all previous tests. The reception of the incoming rays was still done with the no beam alignment method, meaning that we were not trying to align the bore of the Rx antenna with the best/strongest incoming MPC. Clustering the 28 GHz MPCs when the 7 HPBW antennas were used would produce a table similar with Table 1 (for receiver Rx#9). We choose to show only the number of clusters for all 14 receivers on that street for the 28 GHz case (Table 4).
We continued the analysis by simulating the communications at the other three higher frequencies (38, 60 and 73 GHz). We collect the total number of MPCs received with the narrower 7 antennas and the results of the clustering process for all four frequencies in Table 5. From the reported data in Table 5a, we notice few things. There is a tendency to capture fewer MPCs with the narrower antennas for each frequency case. Second, these numbers are smaller for almost all receivers, as we move higher in frequency. Third, there are some areas on the street where the difference in the number of received MPCs between the two antennas are staggering (i.e., 15– 22 % ). The reason is the smaller opening of the 7 horn antenna that cannot capture as many incoming rays as the 22 one. Even though the gain of the more directive antenna is bigger, the fact that we do not implement an alignment procedure and we simply let it aligned with the street, makes the 7 antenna lose many more rays (at the receiver) than the 22 one. This gap (15– 22 % ) in the number of captured MPCs is more visible for receivers Rx#5, Rx#6, Rx#7 that are placed in an area where there is a big open space between the buildings on one side of the street. In those locations, the MPCs “escape” the tunneling effect of the tall buildings that are close to each other at the entrance on that street, thus only the wider 22 beam antennas are able to capture more rays. The gap is also larger for the 28 GHz case because there are more reflected rays at this frequency comparing with the higher frequencies, thus the narrower antenna misses more of them. As we increase the frequency of the transmitted signal, this discrepancy becomes smaller since there are fewer reflected rays due to signal absorption by buildings and other obstacles; hence, the 7 antenna misses fewer and fewer of these rays.
Checking the number of clusters (Table 5b vs. Table 3b), we can say that their number was mostly constant. In approximately 55% of the simulations for all four frequencies and all 14 receiver locations on that street, the number of clusters is the same for the two antennas. Nevertheless, there are some notable situations when the number of clusters for the 7 antenna drop. One example is for the locations at the entrance on the street where the tall buildings absorb more of the higher frequency signals (i.e., 60 and 73 GHz), thus leaving the narrower antennas with not a great variety of reflections to be detected. In other situations, the smaller spread of the azimuth of the angle-of-arrival shows that rays come grouped tighter in space, thus fewer clusters are detected. Lastly, there are only a few locations where the 7 antenna produces more clusters because the mean time-of-arrival (reported by the ray-tracer) is longer; thus, the MPCs are so much spaced in time that the clustering algorithm groups them in more clusters, even though the numbers of incoming rays is not necessarily larger. This happens mostly at the end of the street (i.e., the edge of the cell) and at the entrance on that street where the tight alignment of the buildings creates many more reflections (MPCs) that arrive more and more delayed at the receiver.

3.5. Cluster Characteristics

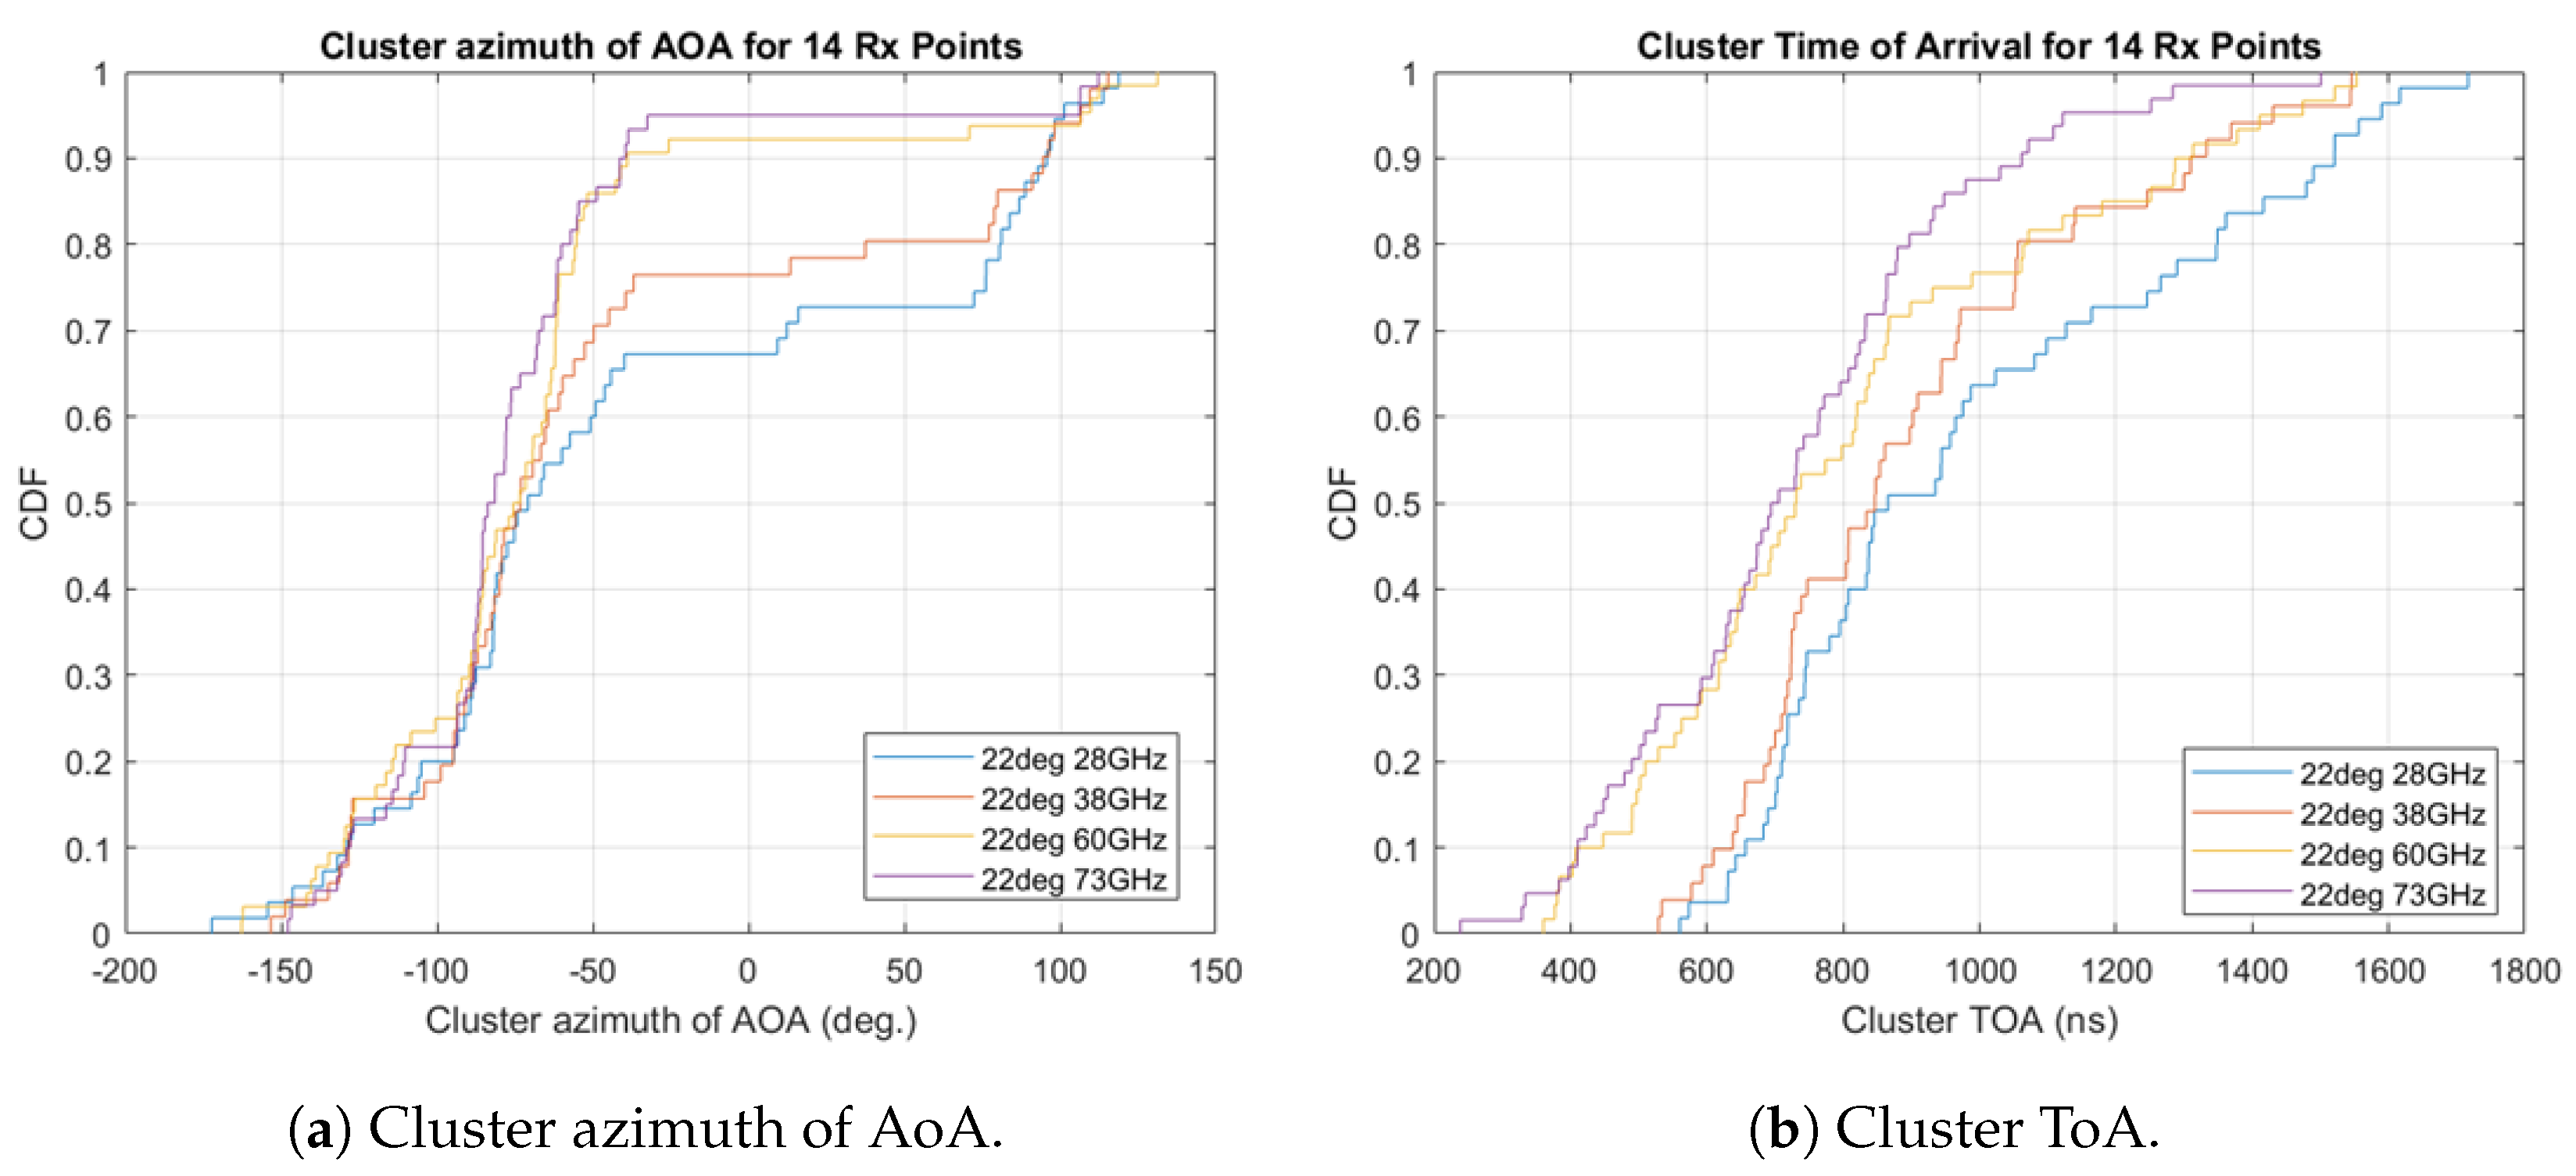
We investigated some other cluster characteristics, besides the number of MPCs and the number of clusters. We were particularly interested in the distribution of the clusters in time and space for all four frequencies in our study, and for all receivers placed on the street chosen in our urban small-cell scenario. For that reason, we considered only the characteristics of the cluster head (CH), which is the most representative MPC in each cluster and the one that defines the entire cluster. We used the wider-beam 22 HPBW antenna for all 14 locations, and we analyzed the distribution of the azimuth of the AoA since the elevation component was proven in our previous studies [19,23] to not variate much. From the cumulative distribution function (CDF) of the azimuth of the AoA (Figure 8a), we can notice that approximately 90% of the cluster heads are coming from similar directions when signals are transmitted with the higher mmWave frequencies (60 and 73 GHz). This is in comparison with the lower frequencies (28 and 38 GHz) when only 65–75% of CHs exhibit this behavior because they bounce to many other directions, as a result of being more resilient to the signal absorption of the building walls.
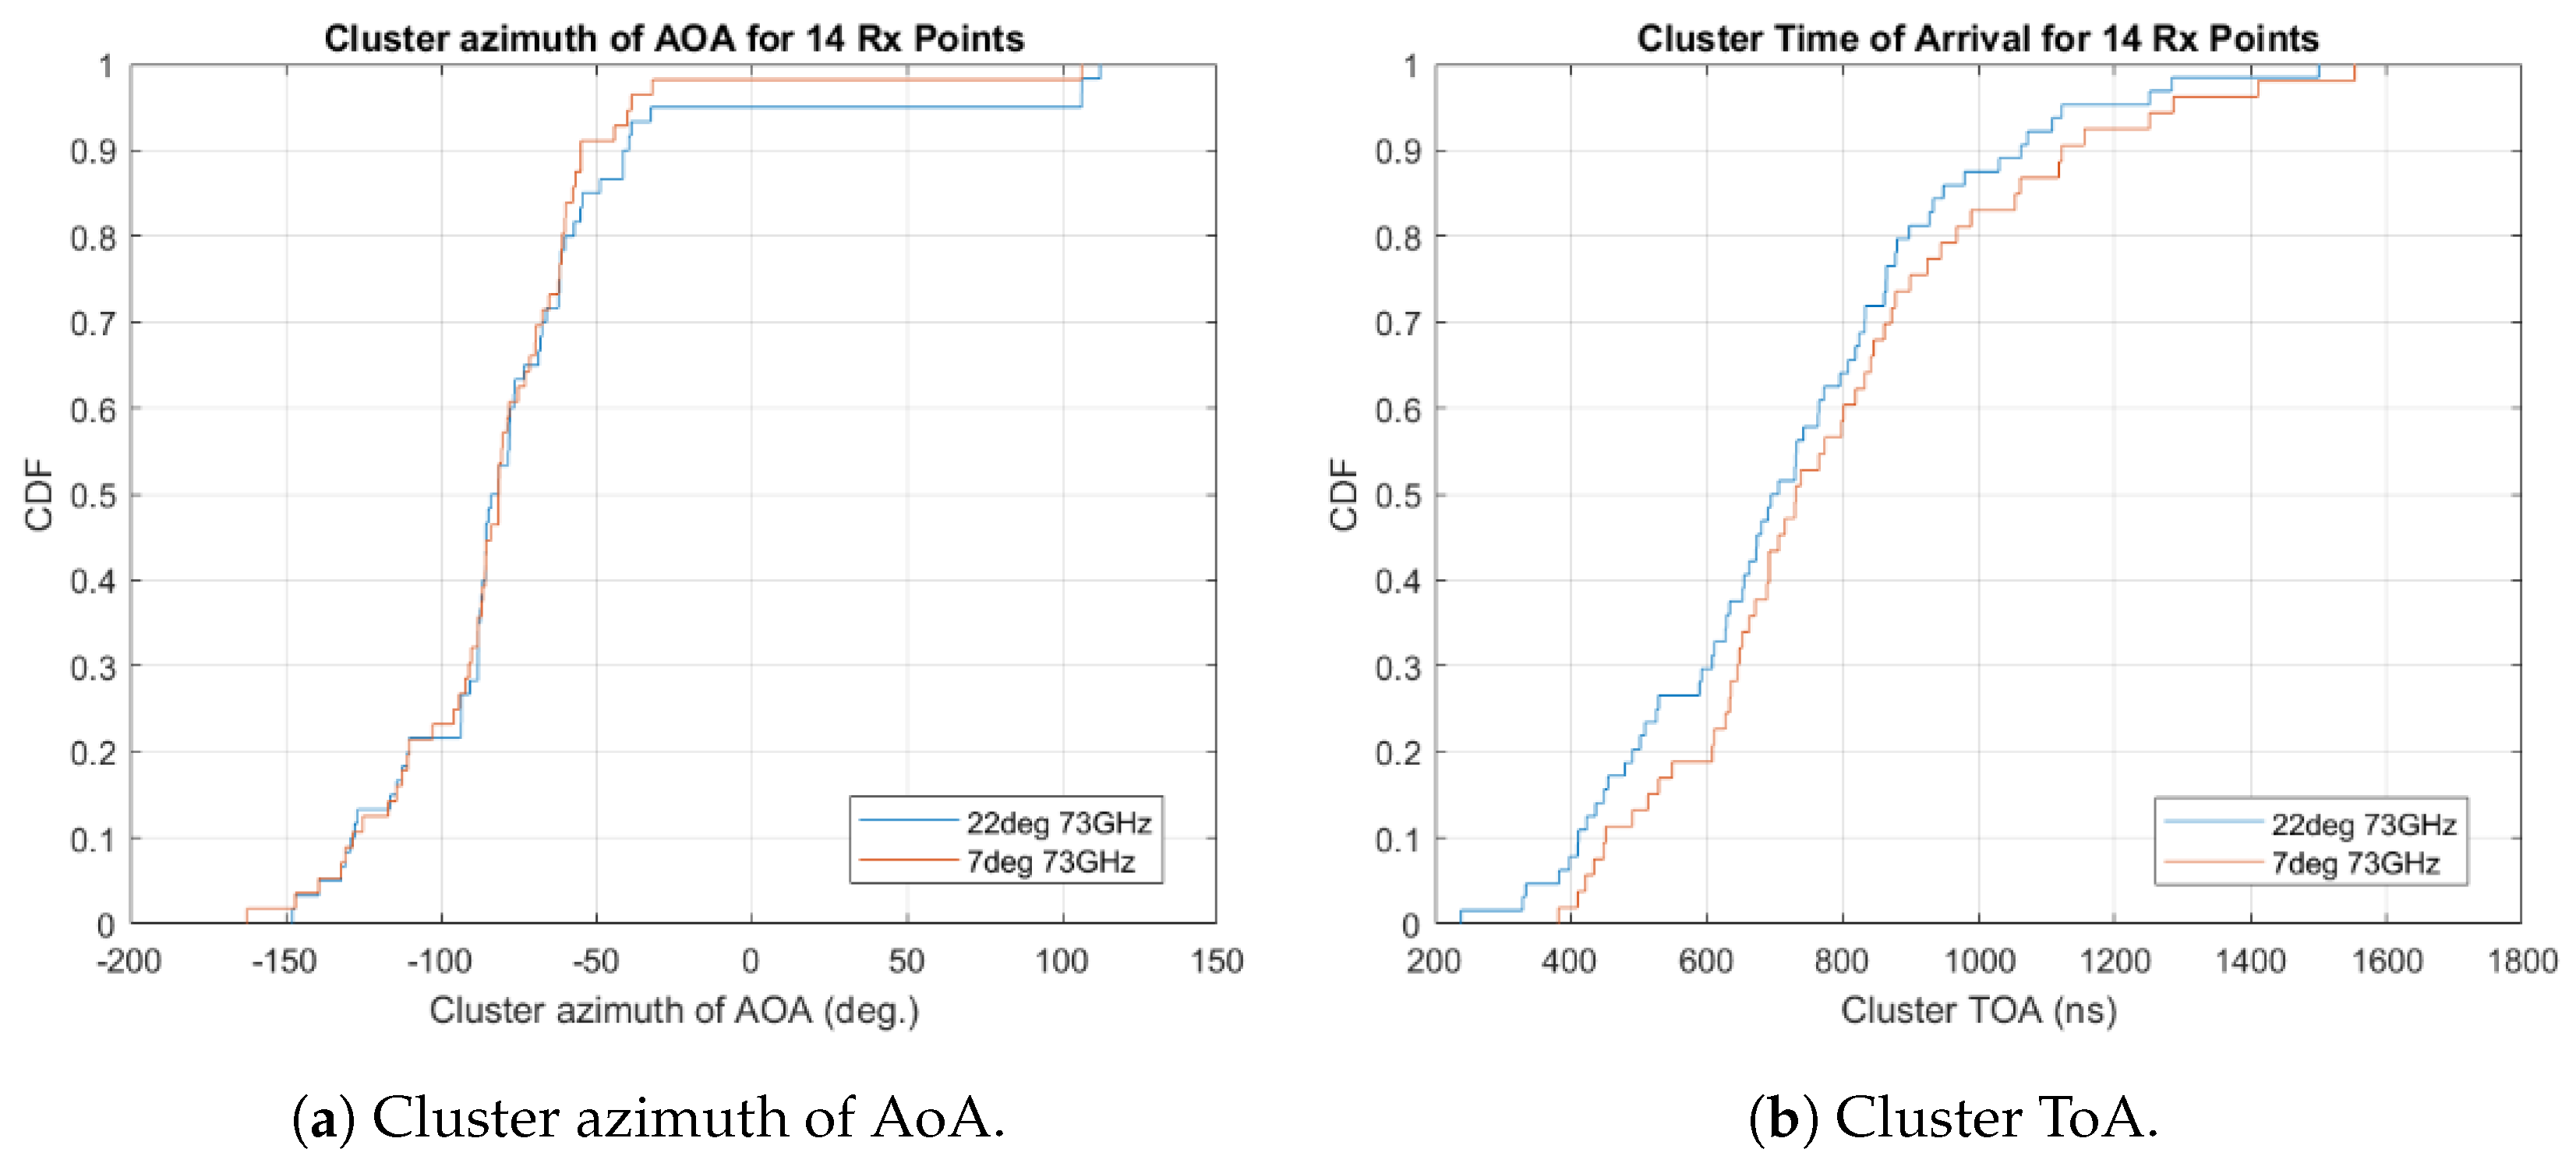
Figure 8b also confirms this trend by the fact that 95% of the higher frequency CHs also have a ToA smaller than 1200 ns, whereas only 70% of the CHs at 28 GHz are below this delay value. This means that the rest of the CHs at 28 GHz spend even more time being reflected and scattered by the obstacles and buildings on this street, until they finally arrive to the receivers. As another test for the 28 GHz, we compare the behavior of the two types of antennas ( 22 vs. 7 HPBW). We realize that, for the same frequency (28 GHz), the AoA and ToA of the cluster heads (Figure 9) are very close in value.
We continued by analyzing the same two distributions of the clusters’ AoA and ToA for the other end of the mmWave spectrum studied in this paper, namely the 73 GHz band (Figure 10). Comparing Figure 10a and Figure 9a, almost all cluster heads are received (for both antennas) from preferred directions; this fact is initially confirmed in Figure 8a when we check the distribution of CHs for the wider-beam antenna, at all four frequencies of our study. Figure 10b shows that delays for both antennas are close in value, and they are also smaller for the higher 73 GHz frequency. Approximately 95% of the CHs arrive within 1200 ns, comparing with 1600 ns at 28 GHz. The reason is the increased propagation attenuation and building walls absorption that destroy many of the MPCs on their way to the receiver, at the higher frequency.
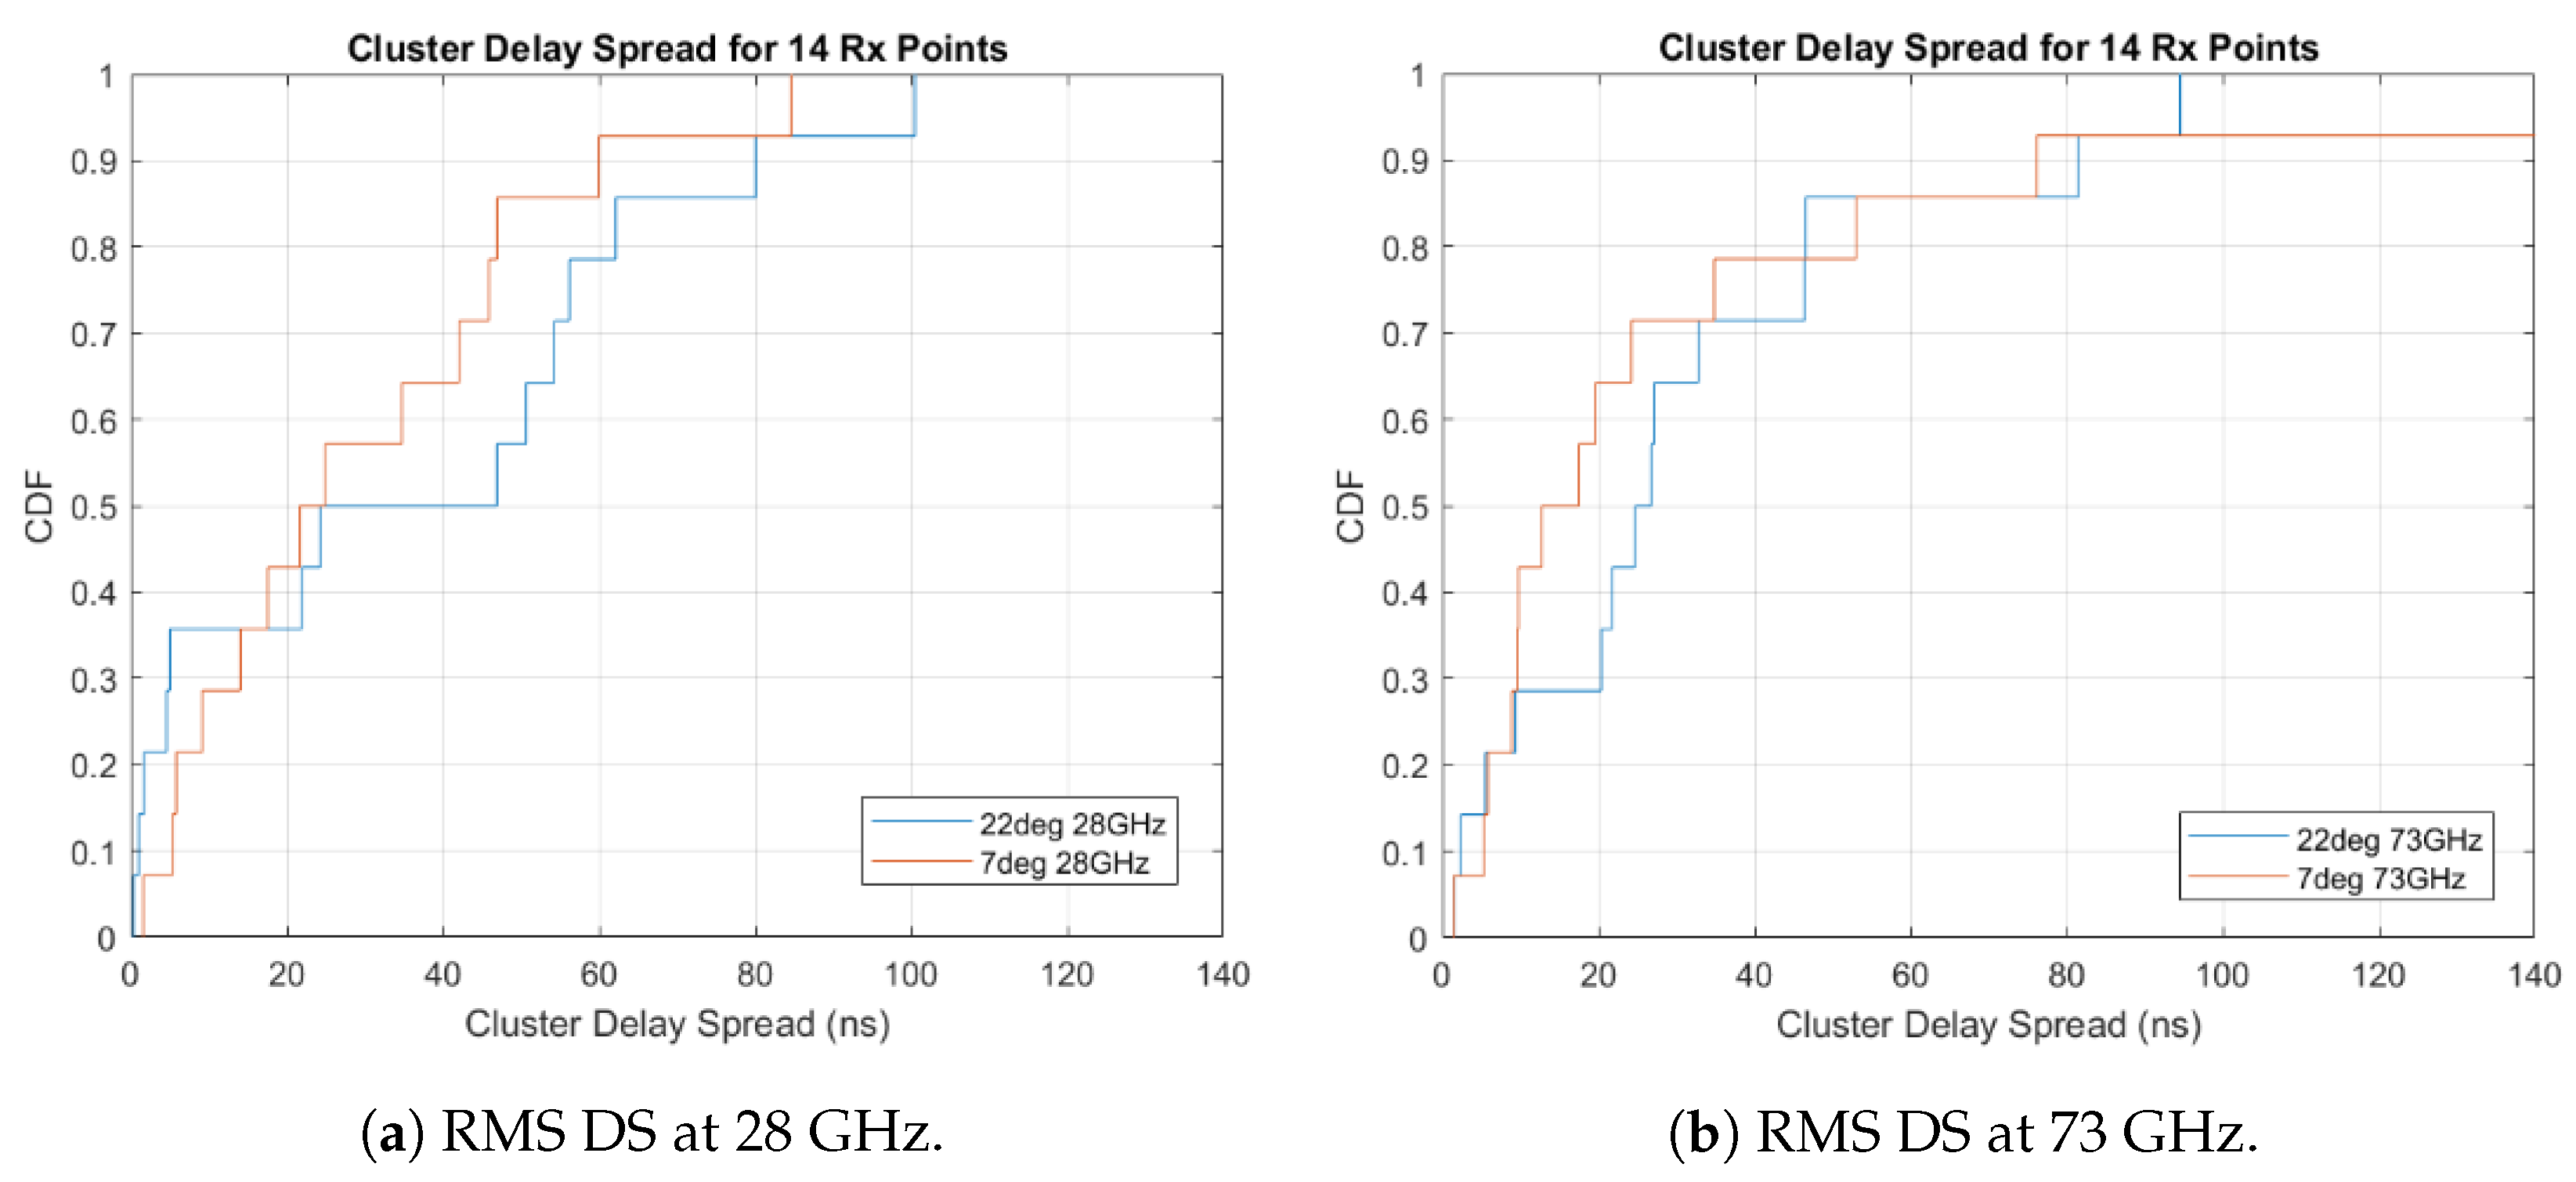
Finally, we checked and compared the RMS delay spread for the two ends of the spectrum, 28 and 73 GHz (Figure 11). As expected, the delay spread of the narrower 7 HPBW antenna is smaller at both frequencies (see the light brown curve in both graphs). We also notice a smaller RMS delay spread for both antennas at 73 GHz. Approximately 70% of the cluster heads have RMS delay spreads less than 25 ns for the 7 antenna and less than 35 ns for the wider 22 antenna (Figure 11b). This is in contrast with the 28 GHz case (Figure 11a) where 70% of the CHs have RMS delay spreads that are slightly bigger (i.e., 45 ns or less for the 7 antenna and 55 ns or less for the 22 antenna). This proves that even, with similar ToA values for both frequencies 28 and 73 GHz (Figure 9b and Figure 10b), the cluster heads arrive in a tighter temporal formation for the narrower antennas. These results highlight the importance of the directive antennas with higher gain that are required in mmWave transmissions, to reduce the values of RMS delay spread.

4. Conclusions

This paper is concerned with clustering-enabled wireless channel modeling for a wide range of frequencies in the mmWave spectrum below 100 GHz. We start from the widely accepted fact that transmitted radio signals are received as clusters of multipath rays. Therefore, the assumption is that these clusters, correctly identified, provide a better spatial and temporal characterization of the mmWave channel. Using a professional software ray-tracer tool (Wireless InSite by Remcom), we consider a Non-Line-of-Sight urban outdoor scenario, and we show how the clustering process of the MPCs at the receiver is influenced by the frequency of the emitted signal. Since directive transmissions are mandatory for mmWave signals to combat fading and propagation loss, we analyze the antenna beamwidth as yet another clustering factor. We also provide cluster statistics for both types of antennas and for all four mmWave frequencies used in our study. As future research, we plan to emphasize the importance of diffuse scattering for creating an MPC-rich environment at the receiver, which could help generate a more thorough clustering solution.

Author Contributions

Authors B.A. and M.T.M. contributed equally to the research and findings of this paper. Author S.B. supervised the writing and organization of the work.

Funding

This work was supported in part by MathWorks under Research Grant “Cross-layer Approach to 5G: Models and Protocols.” Stefano Basagni was also supported in part by the NSF grant CNS 1925601 “CCRI: Grand: Colosseum: Opening and Expanding the World’s Largest Wireless Network Emulator to the Wireless Networking Community.”

Acknowledgments

The authors wish to thank Mike McLernon, Darel Linebarger and Paul Costa of MathWorks for their continued support and guidance on this work.

Conflicts of Interest

The authors declare no conflict of interest.

Abbreviations

The following abbreviations are used in this manuscript:
CDFCumulative Distribution Function
CIRChannel Impulse Response
CVICluster Validity Index
AoAAngle-of-Arrival
AoDAngle-of-Departure
HPBWHalf-Power Beamwidth
LOSLine-of-Sight
mmWaveMillimeter Wave
MPCMultipath Component
NLOSNon-Line-of-Sight
RMSRoot Mean Square
RxReceiver
ToATime-of-Arrival
TxTransmitter

References

  1. Niu, Y.; Li, Y.; Jin, D.; Su, L.; Vasilakos, A.V. A Survey of Millimeter Wave Communications (mmWave) for 5G: Opportunities and Challenges. Wirel. Networks 2015, 21, 2657–2676. [Google Scholar] [CrossRef]
  2. Rappaport, T.S.; Sun, S.; Mayzus, R.; Zhao, H.; Azar, Y.; Wang, K.; Wong, G.N.; Schulz, J.K.; Samimi, M.K.; Gutierrez, F. Millimeter Wave Mobile Communications for 5G Cellular: It Will Work! IEEE Access 2013, 1, 335–349. [Google Scholar] [CrossRef]
  3. Gustafson, C.; Bolin, D.; Tufvesson, F. Modeling the Cluster Decay in mm-Wave Channels. In Proceedings of the EuCAP 2014, Hague, The Netherlands, 6–11 April 2014; pp. 804–808. [Google Scholar]
  4. Shutin, D. Cluster Analysis of Wireless Channel Impulse Responses. In Proceedings of the International Zurich Seminar on Communications, Zurich, Switzerland, 18–20 February 2004; pp. 124–127. [Google Scholar]
  5. Samimi, M.K.; Rappaport, T.S. 3-D Statistical Channel Model for Millimeter-Wave Outdoor Mobile Broadband Communications. In Proceedings of the IEEE ICC 2015, London, UK, 8–12 June 2015; pp. 2430–2436. [Google Scholar]
  6. Hamerly, G.; Elkan, C. Alternatives to the k-Means Algorithm that Find Better Clusterings. In Proceedings of the CIKM 2002, McLean, VA, USA, 4–9 November 2002; pp. 600–607. [Google Scholar]
  7. Hastie, T.; Tibshirani, R.; Friedman, J.H. The Elements of Statistical Learning: Data Mining, Inference, and Prediction, 2nd ed.; Springer: Berlin/Heidelberg, Germany, 2016. [Google Scholar]
  8. Martinez-Ingles, M.T.; Gaillot, D.P.; Pascual-Garcia, J.; Molina Garcia-Pardo, J.M.; Lienard, M.; Rodríguez, J.V.; Juan-Llacer, L. Impact of Clustering at mmW Band Frequencies. In Proceedings of the IEEE International Symposium on Antennas and Propagation & USNC/URSI National Radio Science Meeting, Vancouver, BC, Canada, 19–24 July 2015; pp. 1009–1010. [Google Scholar]
  9. Gustafson, C.; Haneda, K.; Wyne, S.; Tufvesson, F. On mm-Wave Multipath Clustering and Channel Modeling. IEEE Trans. Antennas Propag. 2014, 62, 1445–1455. [Google Scholar] [CrossRef]
  10. Czink, N.; Cera, P.; Salo, J.; Bonek, E.; Nuutinen, J.P.; Ylitalo, J. A Framework for Automatic Clustering of Parametric MIMO Channel Data Including Path Powers. In Proceedings of the IEEE VTC Fall 2006, Montreal, QC, Canada, 25–28 September 2006; pp. 1–5. [Google Scholar]
  11. Czink, N.; Tian, R.; Wyne, S.; Tufvesson, F.; Nuutinen, J.P.; Ylitalo, J.; Bonek, E.; Molisch, A.F. Tracking Time-Variant Cluster Parameters in MIMO Channel Measurements. In Proceedings of the CHINACOM 2007, Shanghai, China, 22–24 August 2007; pp. 1147–1151. [Google Scholar]
  12. Czink, N.; Cera, P.; Salo, J.; Bonek, E.; Nuutinen, J.P.; Ylitalo, J. Improving clustering performance using multipath component distance. Electron. Lett. 2006, 42, 33–45. [Google Scholar] [CrossRef]
  13. Caliński, T.; Harabasz, J. A Dendrite Method for Cluster Analysis. Commun. Stat. 1974, 3, 1–27. [Google Scholar]
  14. Davies, D.L.; Bouldin, D.W. A Cluster Separation Measure. IEEE Trans. Pattern Anal. Mach. Intell. 1979, PAMI-1, 224–227. [Google Scholar] [CrossRef]
  15. Bezdek, J.C.; Pal, N.R. Some new indexes of cluster validity. IEEE Trans. Syst. Man Cybern. 1998, 28, 301–315. [Google Scholar] [CrossRef] [PubMed]
  16. Dunn, J.C. A fuzzy relative of the ISODATA process and its use in detecting compact well-separated clusters. J. Cybern. 1973, 3, 32–57. [Google Scholar] [CrossRef]
  17. Xie, X.L.; Beni, G. A validity measure for fuzzy clustering. IEEE Trans. Pattern Anal. Mach. Intell. 1991, 13, 841–847. [Google Scholar] [CrossRef]
  18. Pakhira, M.K.; Bandyopadhyay, S.; Maulik, U. Validity index for crisp and fuzzy clusters. Pattern Recognit. 2004, 37, 487–501. [Google Scholar] [CrossRef]
  19. Tehrani Moayyed, M.; Antonescu, B.; Basagni, S. Clustering Validation for mmWave Multipath Components in Outdoor Transmissions. In Proceedings of the WD 2019, Manchester, UK, 24–26 April 2019; pp. 1–8. [Google Scholar]
  20. Kryszczuk, K.; Hurley, P. Estimation of the Number of Clusters Using Multiple Clustering Validity Indices. In Proceedings of the 9th International Workshop on Multiple Classifier Systems, LNCS, Cairo, Egypt, 7–9 April 2010; Volume 5997, pp. 114–123. [Google Scholar]
  21. BridgeWave Unveils BW64 60 GHz Wireless Backhaul Solutions. Available online: https://bridgewave.com/bridgewave-unveils-bw64-60-ghz-wireless-backhaul-solutions/ (accessed on 3 April 2015).
  22. Rangan, S.; Rappaport, T.S.; Erkip, E. Millimeter-Wave Cellular Wireless Networks: Potentials and Challenges. Proc. IEEE 2014, 102, 366–385. [Google Scholar] [CrossRef] [Green Version]
  23. Tehrani Moayyed, M.; Antonescu, B.; Basagni, S. Clustering Algorithms and Validation Indices for mmWave Radio Multipath Propagation. In Proceedings of the WTS2019, Manchester, UK, 24–26 April 2019; pp. 1–7. [Google Scholar]
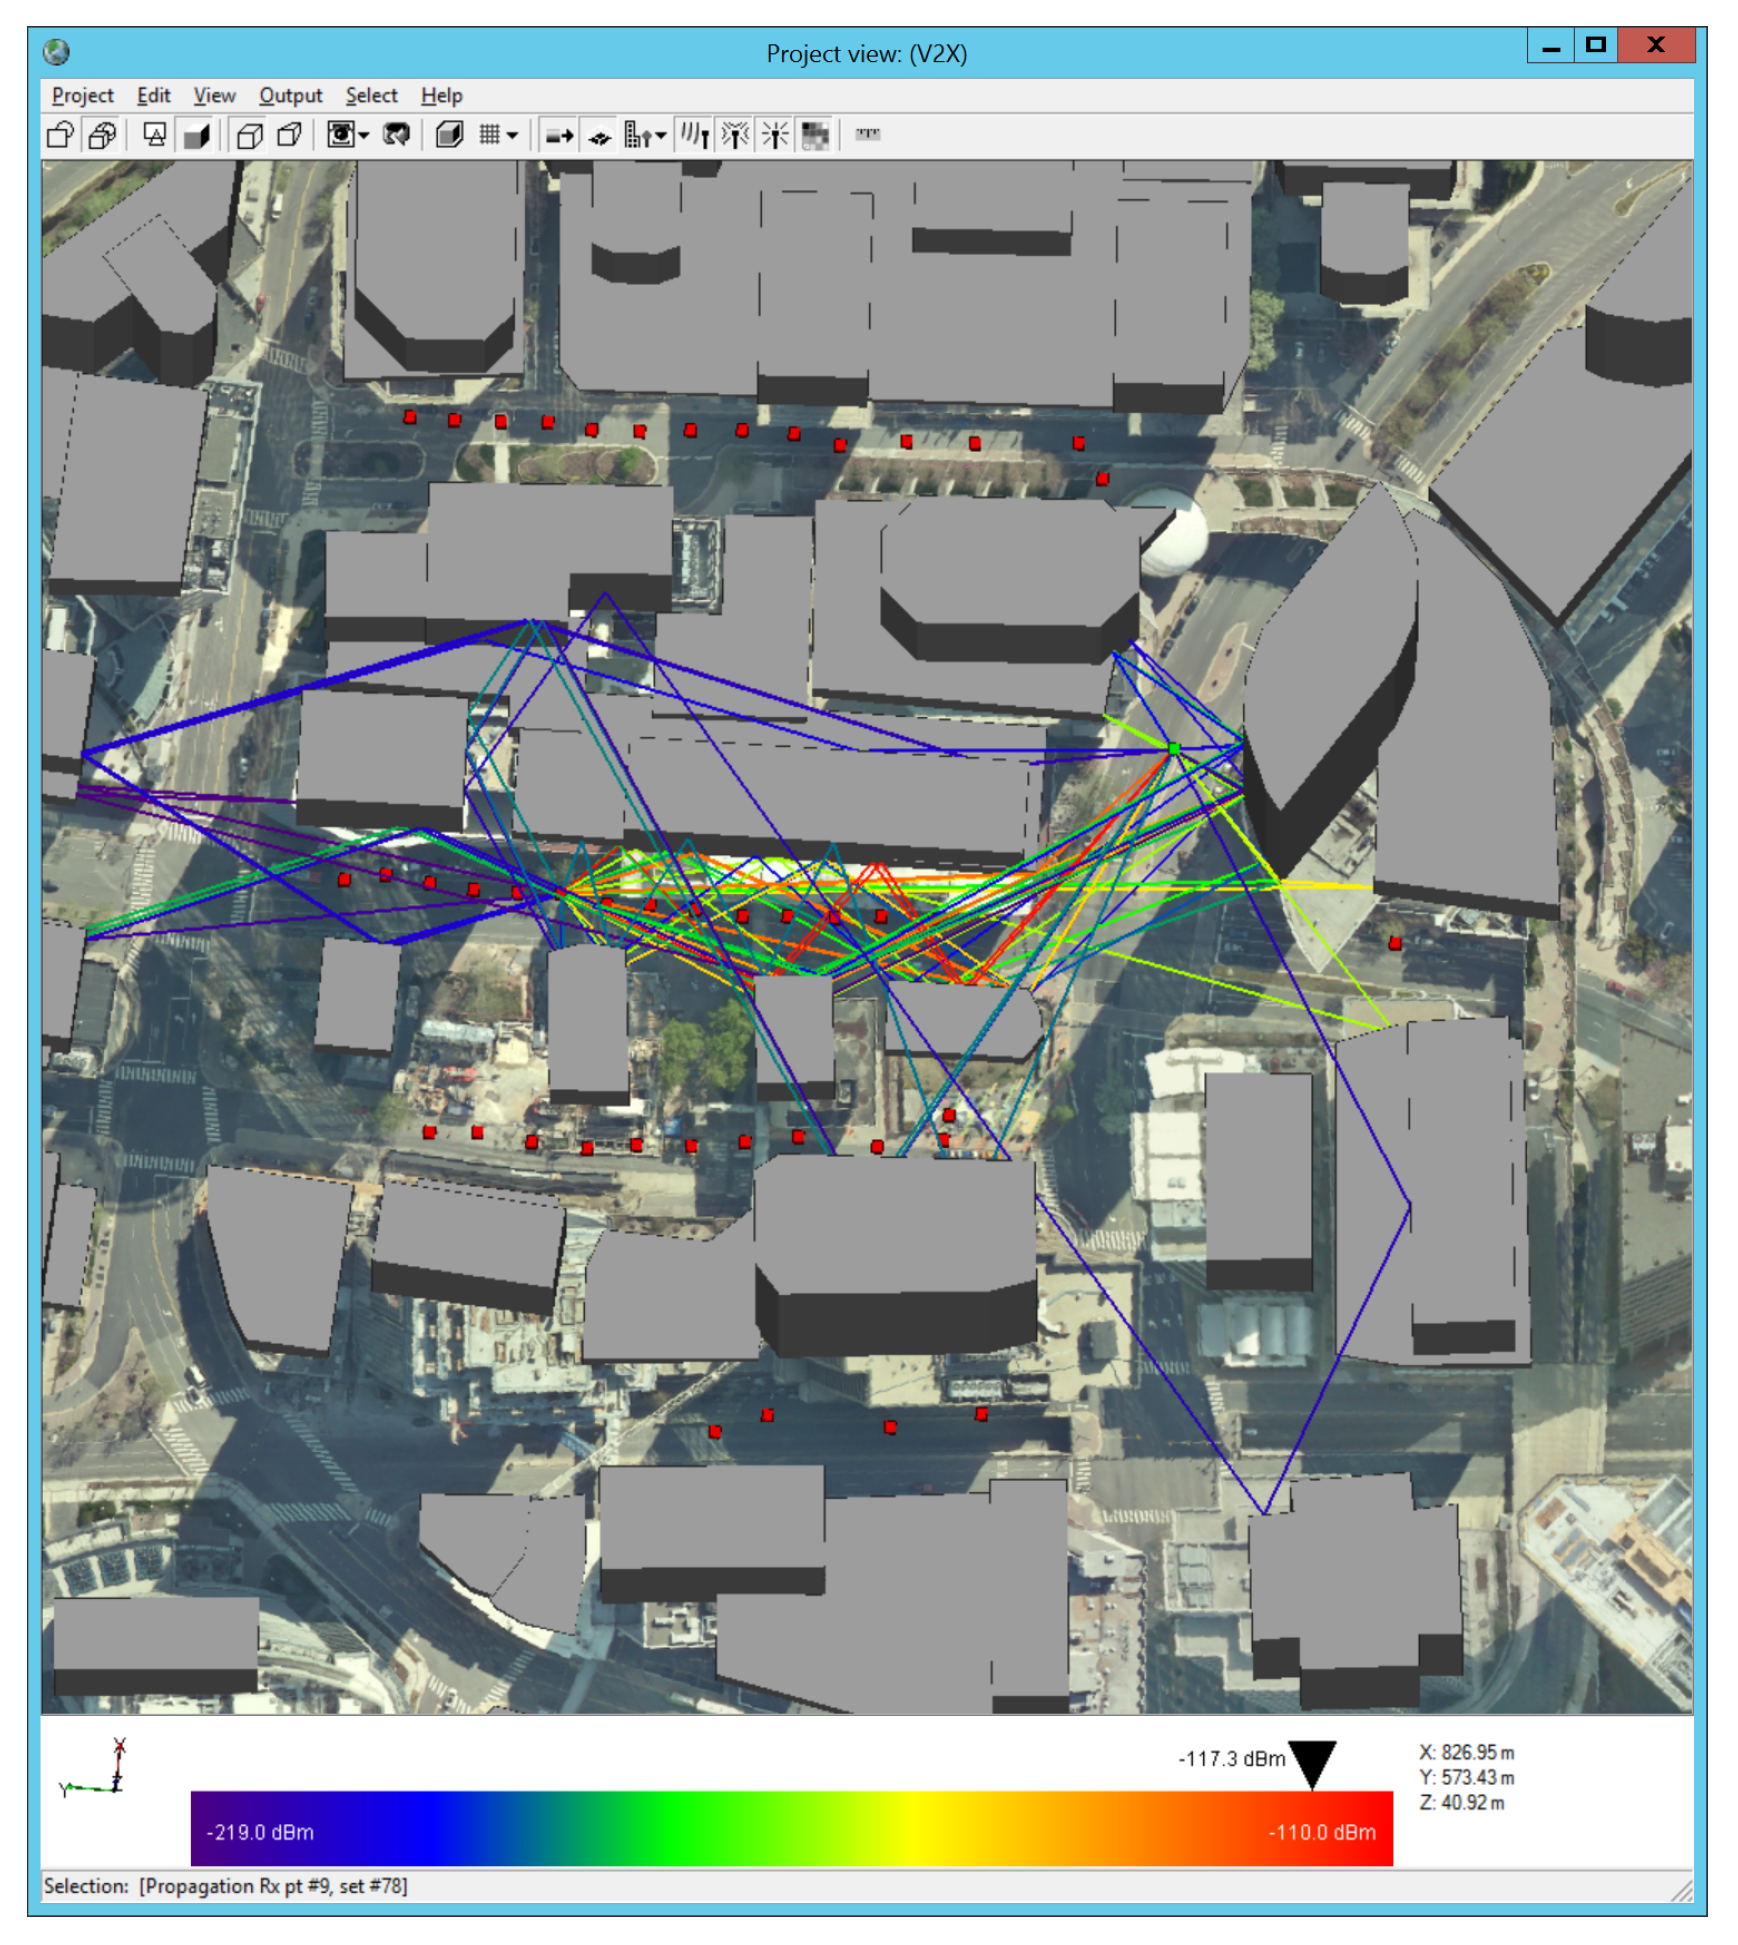
Figure 1. The 44 MPCs received at Rx#9 location.
Information 10 00287 g001
Figure 2. MATLAB environment for controlling Wireless InSite simulations.
Information 10 00287 g002
Figure 3. Clustered CIR—average received power and ToA for each cluster.
Information 10 00287 g003
Figure 4. Clustering with k-means algorithm—ToA vs. AoA and AoD.
Information 10 00287 g004
Figure 5. CH and DB indices applied to clustering results for Rx#9 location.
Information 10 00287 g005
Figure 6. GD index applied to clustering results for Rx#9 location.
Information 10 00287 g006
Figure 7. XB and PBM indices applied to clustering results for Rx#9 location.
Information 10 00287 g007
Figure 8. CDF of the cluster AoA and ToA for all four mmWave frequencies and all 14 receivers.
Information 10 00287 g008
Figure 9. CDF of the cluster AoA and ToA for 22° and 7° HPBW antennas at 28 GHz.
Information 10 00287 g009
Figure 10. CDF of the cluster AoA and ToA for 22° and 7° HPBW antennas at 73 GHz.
Information 10 00287 g010
Figure 11. CDF of the RMS delay spread for 22° and 7° HPBW antennas at 28 GHz and 73 GHz.
Information 10 00287 g011
Table 1. Normalized and Biased CVIs and SF Values for Rx#9 location.
KCHXBPBMDBGD SF a SF g SF h M SF
20.0000.4490.7551.0001.0000.6410.0000.0000.214
30.1660.3990.5390.9110.5770.5180.4510.3780.449
40.1000.7020.4310.7720.6790.5370.4370.3030.426
50.1330.7931.0000.7240.6130.6530.5420.3910.529
60.2131.0000.5130.6760.5340.5870.5240.4540.522
70.3580.4080.7060.5170.5110.5000.4860.4740.487
80.5400.7220.7140.5180.3940.5780.5640.5490.563
90.6310.6710.3620.3580.3940.4830.4640.4480.465
100.6910.8070.0780.3680.2850.4460.3400.2300.339
110.8190.9400.2530.2970.2400.5100.4250.3630.433
120.8100.0000.0950.0510.2400.2390.0000.0000.080
130.8440.6440.0000.1480.0000.3270.0000.0000.109
140.8720.3530.2640.0000.0000.2980.0000.0000.099
151.0000.8110.5720.1470.0000.5060.0000.0000.169
Table 2. Optimal value K for each CVI and SF method—14 Rx locations 28 GHz/ 22 HPBW antennas.
RxCHXBPBMDBGD SF a SF g SF h M SF
1592224444
2463224444
32232222222
419183223333
521172223333
618183225555
718184224444
81863223444
91565225888
101944224454
111563223333
121553223333
131784224444
1414714323444
Table 3. Numbers of MPCs and clusters vs. frequency of transmitted signal for 22 HPBW antennas.
(a) Number of MPCs for All 14 Rx Locations(b) Optimal K Value for All 14 Rx Locations
Number of MPCsOptimal Number of Clusters K
Rx28 GHz38 GHz60 GHz73 GHzRx28 GHz38 GHz60 GHz73 GHz
1112965953145148
28572484024476
37465433432272
45646333243339
56452373353534
66353353165444
75441302774444
85743323084333
94435282498362
1059533330104322
1144392626113333
1244392726123324
1351423027134435
1441332321144534
Table 4. Optimal value K for each CVI and SF method—14 Rx locations 28 GHz/ 7 HPBW antennas.
RxCHXBPBMDBGD SF a SF g SF h M SF
13065225555
2464224444
32192222222
415143223333
516164224555
617155225545
714144234444
816123224444
91263222444
101853223333
11653223333
121343223333
1314714224444
14117112211565
Table 5. Numbers of MPCs and clusters vs. frequency of transmitted signal for 7 HPBW antennas.
(a) Number of MPCs for All 14 Rx Locations(b) Optimal K Value for All 14 Rx Locations
Number of MPCsOptimal Number of Clusters K
Rx28 GHz38 GHz60 GHz73 GHzRx28 GHz38 GHz60 GHz73 GHz
110089605015557
27664443424475
36455373232466
44740332843336
55445343155544
65443353165245
74236272574543
84739312984333
93731242394722
1053483027103222
1140362624113333
1238352826123324
1341373030134333
1433302421145453