Interactions and Sentiment in Personal Finance Forums: An Exploratory Analysis


Abstract
1. Introduction
- Is participation in online personal finance forums uniform?
- Do some participants take a lead and possibly exert a higher influence on others?
- Are major participants inclusive? Or are other participants put off by their dominance?
- What sentiments are exhibited on posts?
- We propose some measures of dominance phenomena, borrowing them from the field of industrial economics.
- We find that dominance phenomena are present, which answers RQ1 negatively: the participation is quite far from being uniform, with a small fraction of posters submitting most papers, and the most frequent poster contributing even more than a third of the total number of posts, allowing us to answer positively to RQ2 (see Section 3).
- We find that direct interaction (in the form of a reply to the latest post) involves a small minority of posters, which adds to the negative answer to RQ1 (Section 4).
- We find that self-replies, consisting in a poster submitting a sequence of posts and therefore unduly reducing the possibilities for others to interact, make up a significant portion of the thread, which allows us to answer RQ3 (Section 4).
- We find that rejoinders, which may represent aggressive behaviour, are themselves a significant portion of the overall number of posts, providing us with further support to answer RQ3 (Section 4).
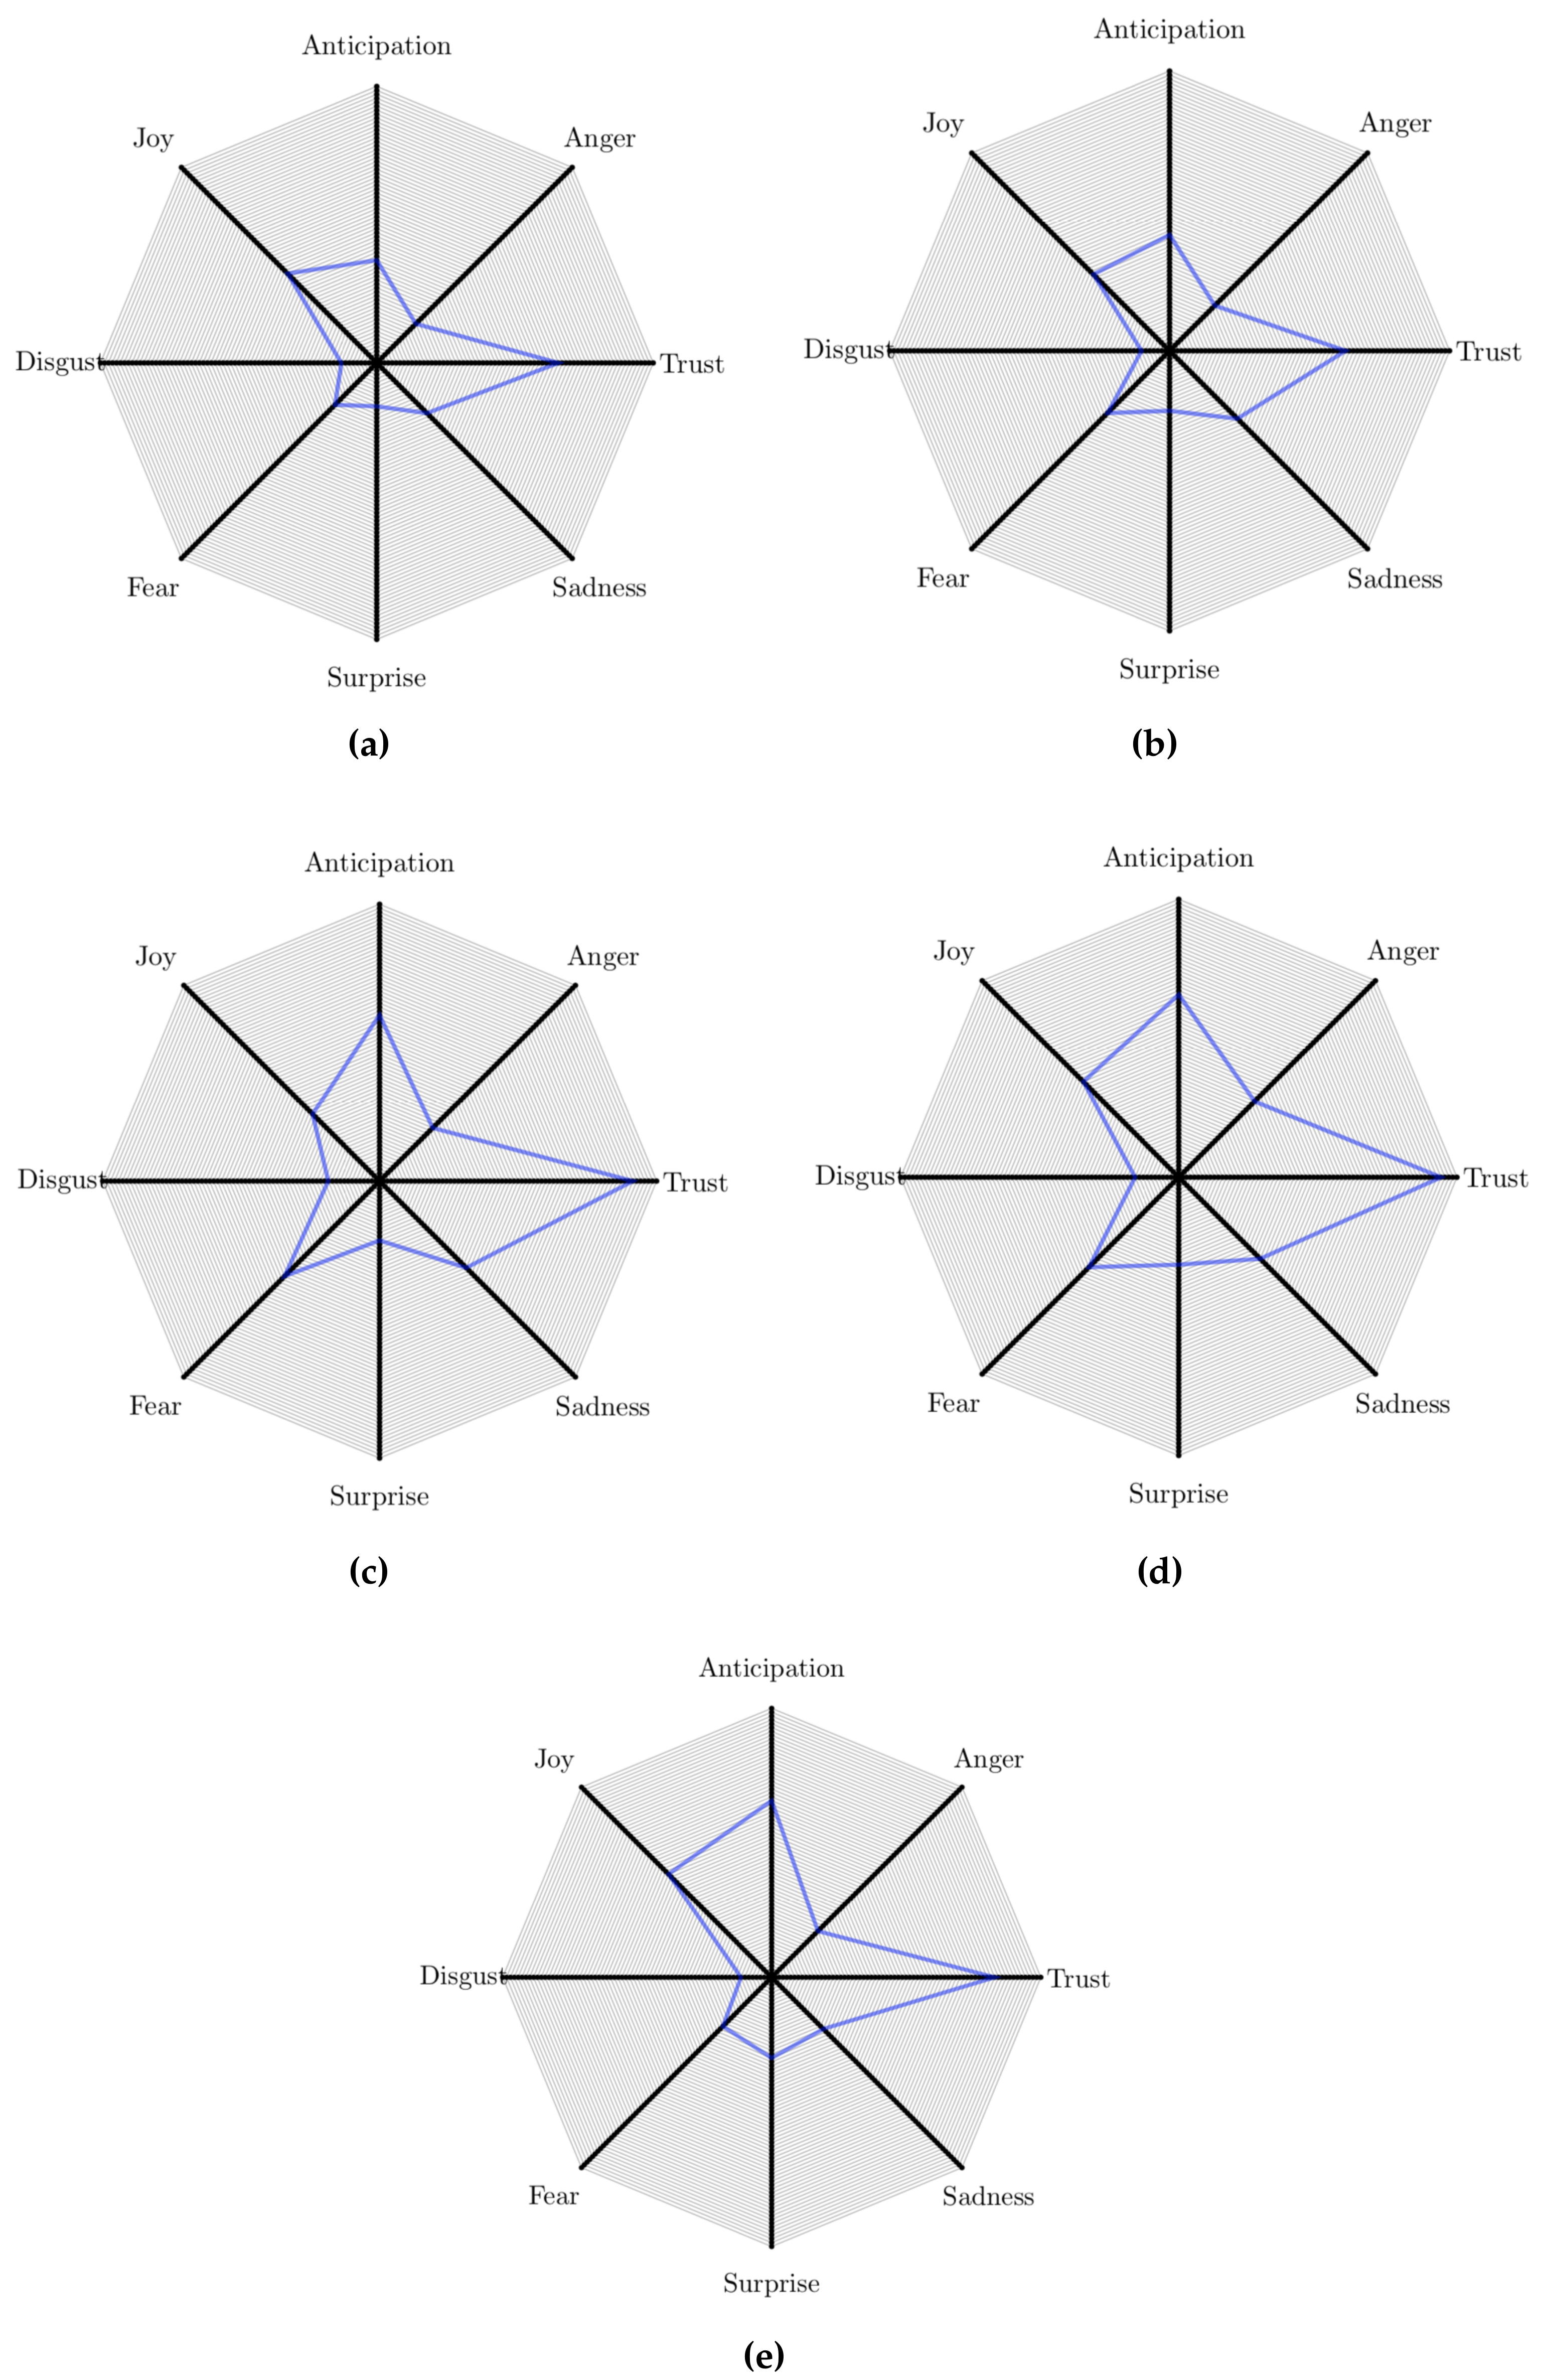
- We find that trust is the most present emotion in the language of the posts, but anticipation and anger are strongly present as well, allowing us to answer RQ4 (Section 5).
2. Datasets
- Should US wealth be redistributed?, whose aim is to examine if redistributing the wealth of the richest people in the US to the poorest people would make any difference at all [14].
- The problem with being budget minded is other people, which examines the strain on the relations within a family, in the work environment, or with friends, when you are budget-minded and they are not [15].
- Health Care and the alternative point of view, where a lot of topics are discussed concerning the adoption of health insurance [16].
- Indexed Universal Life Insurance, where the value of life insurance policies is debated [17].
- First Real Job...No Idea How to Save, where advice is given and sought regarding saving money and plan one’s financial future at the beginning of one’s working life [18].
3. Dominance in a Thread
4. Interaction Dynamics
- the nodes of the network represent the posters;
- an edge is drawn between node i and node j if poster i replies to a post submitted by poster j (i.e., poster i comes immediately after poster j in the sequence of posts);
- the weight of the edge between node i and node j is the number of times poster i replies to a post submitted by poster j.
5. Sentiment Analysis
6. Discussion
6.1. Theoretical Contributions
6.2. Implications for Practice
7. Conclusions
Funding
Conflicts of Interest
Abbreviations
| HHI | Hirschman–Herfindahl Index |
| Concentration ratio |
References
- Hallam, J. The Social Media Manifesto; Springer: New York, NY, USA, 2012. [Google Scholar]
- Cheung, C.M.; Lee, M.K.; Rabjohn, N. The impact of electronic word-of-mouth: The adoption of online opinions in online customer communities. Internet Res. 2008, 18, 229–247. [Google Scholar] [CrossRef]
- Wang, Y.; Yu, C. Social interaction-based consumer decision-making model in social commerce: The role of word of mouth and observational learning. Int. J. Inf. Manag. 2017, 37, 179–189. [Google Scholar] [CrossRef]
- Doh, S.J.; Hwang, J.S. How consumers evaluate eWOM (electronic word-of-mouth) messages. Cyberpsychol. Behav. 2009, 12, 193–197. [Google Scholar] [CrossRef] [PubMed]
- Ahmad, S.N.; Laroche, M. Analyzing electronic word of mouth: A social commerce construct. Int. J. Inf. Manag. 2017, 37, 202–213. [Google Scholar] [CrossRef]
- Tang, C.; Mehl, M.R.; Eastlick, M.A.; He, W.; Card, N.A. A longitudinal exploration of the relations between electronic word-of-mouth indicators and firms’ profitability: Findings from the banking industry. Int. J. Inf. Manag. 2016, 36, 1124–1132. [Google Scholar] [CrossRef]
- Tumarkin, R.; Whitelaw, R.F. News or Noise? Internet Postings and Stock Prices. Financ. Anal. J. 2001, 57, 41–51. [Google Scholar] [CrossRef]
- Xing, F.Z.; Cambria, E.; Welsch, R.E. Natural language based financial forecasting: A survey. Artif. Intell. Rev. 2018, 50, 49–73. [Google Scholar] [CrossRef]
- Chiu, C.M.; Huang, H.Y.; Cheng, H.L.; Sun, P.C. Understanding online community citizenship behaviors through social support and social identity. Int. J. Inf. Manag. 2015, 35, 504–519. [Google Scholar] [CrossRef]
- Kuo, Y.F.; Feng, L.H. Relationships among community interaction characteristics, perceived benefits, community commitment, and oppositional brand loyalty in online brand communities. Int. J. Inf. Manag. 2013, 33, 948–962. [Google Scholar] [CrossRef]
- Xing, F.Z.; Cambria, E.; Welsch, R.E. Intelligent asset allocation via market sentiment views. IEEE Comput. Intell. Mag. 2018, 13, 25–34. [Google Scholar] [CrossRef]
- Malandri, L.; Xing, F.Z.; Orsenigo, C.; Vercellis, C.; Cambria, E. Public mood–driven asset allocation: The importance of financial sentiment in portfolio management. Cogn. Comput. 2018, 10, 1167–1176. [Google Scholar] [CrossRef]
- SavingAdvice Website. Available online: https://www.savingadvice.com/forums/ (accessed on 28 December 2018).
- Should US Wealth Be Redistributed? Available online: https://www.savingadvice.com/forums/forum/financial-chit-chat/personal-finance/4905-should-us-wealth-be-redistributed (accessed on 28 December 2018).
- The Problem With Being Budget Minded Is Other People. Available online: https://www.savingadvice.com/forums/forum/financial-chit-chat/personal-finance/8056- (accessed on 28 December 2018).
- Health Care and the Alternative Point of View. Available online: https://www.savingadvice.com/forums/forum/financial-chit-chat/personal-finance/42558- (accessed on 28 December 2018).
- Indexed Universal Life Insurance. Available online: https://www.savingadvice.com/forums/forum/financial-chit-chat/personal-finance/55109- (accessed on 28 December 2018).
- First Real Job...No Idea How to Save. Available online: https://www.savingadvice.com/forums/forum/financial-chit-chat/personal-finance/53153- (accessed on 28 December 2018).
- Bodrunova, S.S.; Blekanov, I.S. Power laws in ad hoc conflictual discussions on Twitter. In Proceedings of the International Conference on Digital Transformation and Global Society, St. Petersburg, Russia, 30 May—2 June 2018; pp. 67–82. [Google Scholar]
- Read, C.B. Zipf’s Law. In Encyclopedia of Statistical Sciences; Wiley: New York, NY, USA, 2004. [Google Scholar]
- Zipf, G.K. Human Behavior and the Principle of Least Effort: An Introduction to Human Ecology; Ravenio Books: Cambridge, MA, USA, 2016. [Google Scholar]
- Blank, A.; Solomon, S. Power laws in cities population, financial markets and internet sites (scaling in systems with a variable number of components). Phys. A Stat. Mech. Appl. 2000, 287, 279–288. [Google Scholar] [CrossRef]
- Adamic, L.A.; Huberman, B.A. Power-law distribution of the world wide web. Science 2000, 287, 2115. [Google Scholar] [CrossRef]
- Axtell, R.L. Zipf distribution of US firm sizes. Science 2001, 293, 1818–1820. [Google Scholar] [CrossRef] [PubMed]
- Naldi, M.; Salaris, C. Rank-size distribution of teletraffic and customers over a wide area network. Trans. Emerg. Telecommun. Technol. 2006, 17, 415–421. [Google Scholar] [CrossRef]
- Rhoades, S.A. The Herfindahl-Hirschman Index. Fed. Res. Bull. 1993, 79, 188. [Google Scholar]
- Naldi, M. Concentration indices and Zipf’s law. Econ. Lett. 2003, 78, 329–334. [Google Scholar] [CrossRef]
- Naldi, M.; Flamini, M. Censoring and Distortion in the Hirschman–Herfindahl Index Computation. Econ. Papers J. Appl. Econ. Policy 2017, 36, 401–415. [Google Scholar] [CrossRef]
- Pavic, I.; Galetic, F.; Piplica, D. Similarities and Differences between the CR and HHI as an Indicator of Market Concentration and Market Power. Br. J. Econ. Manag. Trade 2016, 13, 1–8. [Google Scholar] [CrossRef]
- Naldi, M.; Flamini, M. Correlation and Concordance between the CR 4 Index and the Herfindahl-Hirschman Index. SSRN Working Paper Series 2014. Available online: https://ssrn.com/abstract=2502764 (accessed on 9 July 2019).
- The U.S. Department of Justice and the Federal Trade Commission. Horizontal Merger Guidelines. 19 August 2010. Available online: https://www.justice.gov/atr/horizontal-merger-guidelines-08192010 (accessed on 9 July 2019).
- Naldi, M.; Flamini, M. The CR4 Index and the Interval Estimation of the Herfindahl-Hirschman Index: An Empirical Comparison. 2014. Available online: https://ssrn.com/abstract=2448656 (accessed on 9 July 2019).
- Cowley, S.J. Of timing, turn-taking, and conversations. J. Psycholinguist. Res. 1998, 27, 541–571. [Google Scholar] [CrossRef]
- Levinson, S.C.; Torreira, F. Timing in turn-taking and its implications for processing models of language. Front. Psychol. 2015, 6, 731. [Google Scholar] [CrossRef] [PubMed]
- Cambria, E. Affective computing and sentiment analysis. IEEE Intell. Syst. 2016, 31, 102–107. [Google Scholar] [CrossRef]
- Kwartler, T. Text Mining in Practice with R; John Wiley & Sons: New York, NY, USA, 2017. [Google Scholar]
- Majumder, N.; Poria, S.; Hazarika, D.; Mihalcea, R.; Gelbukh, A.; Cambria, E. Dialoguernn: An attentive rnn for emotion detection in conversations. arXiv 2018, arXiv:1811.00405. [Google Scholar]
- Mohammad, S.M.; Turney, P.D. Crowdsourcing a word–emotion association lexicon. Comput. Intell. 2013, 29, 436–465. [Google Scholar] [CrossRef]
- Mohammad, S.M.; Turney, P.D. Emotions evoked by common words and phrases: Using Mechanical Turk to create an emotion lexicon. In Proceedings of the NAACL HLT 2010 Workshop on Computational Approaches to Analysis and Generation of Emotion in Text, Los Angeles, CA, USA, 5 June 2010; pp. 26–34. [Google Scholar]
- Naldi, M. A review of sentiment computation methods with R packages. arXiv 2019, arXiv:1901.08319. [Google Scholar]
- Plutchik, R. Emotions: A general psychoevolutionary theory. Approaches Emot. 1984, 1984, 197–219. [Google Scholar]


| Thread | No. of Posts | No. of Posters | Avg No. of Posts |
|---|---|---|---|
| Wealth Redistribution | 248 | 31 | 8.00 |
| Budget-Minded | 259 | 64 | 4.05 |
| Healthcare | 217 | 22 | 9.86 |
| Life Insurance | 192 | 19 | 10.11 |
| First Real Job | 190 | 24 | 7.92 |
| Thread | Zipf Exponent | HHI | |
|---|---|---|---|
| Wealth Redistribution | 1.336 | 0.1277 | 60.08% |
| Budget-Minded | 0.981 | 0.0592 | 37.07% |
| Healthcare | 1.490 | 0.1556 | 68.20% |
| Life Insurance | 1.504 | 0.1446 | 70.31% |
| First Real Job | 1.444 | 0.2008 | 71.58% |
| Thread | Most Frequent Poster |
|---|---|
| Wealth Redistribution | 27.82% |
| Budget-Minded | 18.92% |
| Healthcare | 29.95% |
| Life Insurance | 20.83% |
| First Real Job | 36.84% |
| Thread | Sparsity [%] |
|---|---|
| Wealth Redistribution | 89.49 |
| Budget-Minded | 95.31 |
| Healthcare | 83.68 |
| Life Insurance | 81.16 |
| First Real Job | 87.84 |
| Thread | No. of Self-Replies | No. of Rejoinders |
|---|---|---|
| Wealth Redistribution | 38 (15.3%) | 64 (25.8%) |
| Budget-Minded | 11 (4.2%) | 35 (13.5%) |
| Healthcare | 32 (14.7%) | 55 (25.3%) |
| Life Insurance | 39 (20.3%) | 41 (21.4%) |
| First Real Job | 23 (12.1%) | 51 (26.8%) |
© 2019 by the author. Licensee MDPI, Basel, Switzerland. This article is an open access article distributed under the terms and conditions of the Creative Commons Attribution (CC BY) license (http://creativecommons.org/licenses/by/4.0/).
Share and Cite
Naldi, M. Interactions and Sentiment in Personal Finance Forums: An Exploratory Analysis. Information 2019, 10, 237. https://doi.org/10.3390/info10070237
Naldi M. Interactions and Sentiment in Personal Finance Forums: An Exploratory Analysis. Information. 2019; 10(7):237. https://doi.org/10.3390/info10070237
Chicago/Turabian StyleNaldi, Maurizio. 2019. "Interactions and Sentiment in Personal Finance Forums: An Exploratory Analysis" Information 10, no. 7: 237. https://doi.org/10.3390/info10070237
APA StyleNaldi, M. (2019). Interactions and Sentiment in Personal Finance Forums: An Exploratory Analysis. Information, 10(7), 237. https://doi.org/10.3390/info10070237