Performance Comparing and Analysis for Slot Allocation Model

Abstract
1. Introduction
2. Related Work of Difficulty in Slot Allocation
3. Proposed Slot Displacement Models
3.1. Difficulty Index and Difficulty of Displacement
3.2. Standardized Priority
3.3. Comprehensive Displacement Cost
3.4. Displacement Model for all Flights
4. LIP for Slot Displacement Models
| Algorithm 1. Iterative linear integer programming algorithms based on data-splitting. |
| Priority calculation For i = 1:7
|
5. Testing and Results
- (1)
- Whether there is opportunity to reduce implementation difficulty while not to increase too much displacement.
- (2)
- With our algorithm, is it possible for high priority movement to have a lower probability of being displaced?
- (3)
- Can priority be considered as the cost of displacing the unit time to ensure that the high priority movement has a low probability of being displaced (HPLA)?
- (4)
- What are the differences in performance indicators when priority is fed into a computer program in priority order or in the order of morning to night (final slot-table presentation) when priority is considered as the cost of displacing the unit time?
5.1. Performances Compare with Different Weight Factors of Evaluation Objectives
5.2. Analysis of the Correlation between Average Displacement and Average Difficulty
6. Discussion and Conclusions
Author Contributions
Funding
Conflicts of Interest
References
- Wu, W.; Zhang, H.; Wei, W. Optimal design of hub-and-spoke networks with access to regional hub airports: A case for the Chinese regional airport system. Transp. A Transp. Sci. 2018, 14, 330–345. [Google Scholar] [CrossRef]
- Zografos, K.G.; Madasz, M.A.; Salourasx, Y. A decision support system for total airport operations management and planning. J. Adv. Transp. 2013, 47, 170–189. [Google Scholar] [CrossRef]
- Jacquillat, A.; Odoni, A.R. An Integrated Scheduling and Operations Approach to Airport Congestion Mitigation. Oper. Res. 2015, 63, 1390–1410. [Google Scholar] [CrossRef]
- Zografos, K.G.; Salouras, Y.; Madas, M.A. Dealing with the efficient allocation of scarce resources at congested airports. Transp. Res. Part C Emerg. Technol. 2012, 21, 244–256. [Google Scholar] [CrossRef]
- Zografos, K.G.; Madas, M.A.; Androutsopoulos, K.N. Increasing airport capacity utilisation through optimum slot scheduling: Review of current developments and identification of future needs. J. Sched. 2017, 20, 3–24. [Google Scholar] [CrossRef]
- Basso, L.J.; Zhang, A.M. Pricing vs. slot policies when airport profits matter. Transp. Res. B Methodol. 2010, 44, 381–391. [Google Scholar] [CrossRef]
- Verhoef, E.T. Congestion pricing, slot sales and slot trading in aviation. Transp. Res. B Methodol. 2010, 44, 320–329. [Google Scholar] [CrossRef]
- Zhang, A.M.; Zhang, Y.M. Airport capacity and congestion pricing with both aeronautical and commercial operations. Transp. Res. B Methodol. 2010, 44, 404–413. [Google Scholar] [CrossRef]
- Czerny, A.I.; Zhang, A.M. Airport congestion pricing and passenger types. Transp. Res. B Methodol. 2011, 45, 595–604. [Google Scholar] [CrossRef]
- Le, L.; Donohue, G.; Hoffman, K.; Chen, C.H. Optimum airport capacity utilization under congestion management: A case study of New York LaGuardia airport. Transp. Plan Technol. 2008, 31, 93–112. [Google Scholar] [CrossRef]
- Vaze, V.; Barnhart, C. Modeling Airline Frequency Competition for Airport Congestion Mitigation. Transp. Sci. 2012, 46, 512–535. [Google Scholar] [CrossRef]
- Grunewald, E. Incentive-based Slot Allocation for Airports. Transp. Res. Procedia 2016, 14, 3761–3770. [Google Scholar] [CrossRef]
- Jacquillat, A.; Odoni, A.R. Congestion Mitigation at John F. Kennedy International Airport in New York City: Potential of Schedule Coordination. Transp. Res. Rec. 2013, 2400, 28–36. [Google Scholar] [CrossRef]
- Pyrgiotis, N.; Odoni, A. On the Impact of Scheduling Limits: A Case Study at Newark Liberty International Airport. Transp. Sci. 2016, 50, 150–165. [Google Scholar] [CrossRef]
- Ribeiro, N.A.; Jacquillat, A.; Antunes, A.P.; Odoni, A.R.; Pita, J.P. An optimization approach for airport slot allocation under IATA guidelines. Transp. Res. B Methodol. 2018, 112, 132–156. [Google Scholar] [CrossRef]
- Zografos, K.G.; Androutsopoulos, K.N.; Madas, M.A. Minding the gap: Optimizing airport schedule displacement and acceptability. Transp. Res. Part A Policy Pract. 2018, 114, 203–221. [Google Scholar] [CrossRef]
- Jacquillat, A.; Odoni, A.R. Endogenous control of service rates in stochastic and dynamic queuing models of airport congestion. Transp. Res. Part E Logist. Transp. Rev. 2015, 73, 133–151. [Google Scholar] [CrossRef][Green Version]
- Jacquillat, A.; Odoni, A.R. A roadmap toward airport demand and capacity management. Transp. Res. Part A Policy Pract. 2018, 114, 168–185. [Google Scholar] [CrossRef]
- Benlic, U. Heuristic search for allocation of slots at network level. Transp. Res. Part C Emerg. Technol. 2018, 86, 488–509. [Google Scholar] [CrossRef]
- Li, X.; Chen, X.; Li, D.; Wei, D. Classification and characteristics of flights taking off and landing waveforms. Flight Dyn. 2016, 34, 90–94. [Google Scholar]
- Sun, C.L.; Su, X. Analysis & Optimization of Beijing Capital Airport’s flight waves. China Civ. Aviat. 2013, 30–31. [Google Scholar]
- Hu, M.; Yi, T.; Ren, Y. Optimization of airport slot based on improved Hungarian algorithm. Appl. Res. Comput. 2019, 1–7. [Google Scholar]
- Huang, J.; Wang, J. A comparison of indirect connectivity in Chinese airport hubs: 2010 vs. 2015. J. Air Transp. Manag. 2017, 65, 29–39. [Google Scholar] [CrossRef]
- Corolli, L.; Lulli, G.; Ntaimo, L. The time slot allocation problem under uncertain capacity. Transp. Res. Part C Emerg. Technol. 2014, 46, 16–29. [Google Scholar] [CrossRef]
- Debbage, K.G. Airport runway slots: Limits to growth. Ann. Tour. Res. 2002, 29, 933–951. [Google Scholar] [CrossRef]
- Picard, P.M.; Tampieri, A.; Wan, X. Airport capacity and inefficiency in slot allocation. Int. J. Ind. Organ. 2019, 62, 330–357. [Google Scholar] [CrossRef]
- Ahmadbeygi, S.; Cohn, A.; Guan, Y.; Belobaba, P. Analysis of the potential for delay propagation in passenger airline networks. J. Air Transp. Manag. 2008, 14, 221–236. [Google Scholar] [CrossRef]
- Gillen, D.; Jacquillat, A.; Odoni, A.R. Airport demand management: The operations research and economics perspectives and potential synergies. Transp. Res. Part A Policy Pract. 2016, 94, 495–513. [Google Scholar] [CrossRef]
- Levine, M.E. Airport congestion: When theory meets reality. Yale J. Reg. 2009, 26, 37. [Google Scholar]
- Zografos, K. A Bi-objective Efficiency-Fairness Model for Scheduling Slots at Congested Airports. Transp. Res. Part C Emerg. Technol. 2019, 102, 336–350. [Google Scholar] [CrossRef]
- Ogryezak, W. Symmetric duality theory for linear goal programming. Optimization 1988, 19, 373–396. [Google Scholar] [CrossRef]
- Brooker, P. Simple Models for Airport Delays During Transition to a Trajectory-Based Air Traffic System. J. Navig. 2009, 62, 555–570. [Google Scholar] [CrossRef]
- Han, F.; Wong, B.L.W.; Gauhrodger, S. Improving future air traffic punctuality: “pinch-and-pull” target windows. Aircr. Eng. Aerosp. Technol. 2010, 82, 207–216. [Google Scholar] [CrossRef]
- Richard, O.; Constans, S.; Fondacci, R. Computing 4D near-optimal trajectories for dynamic air traffic flow management with column generation and branch-and-price. Transp. Plan. Technol. 2011, 34, 389–411. [Google Scholar] [CrossRef]
- Tang, X.M.; Han, Y.X. 4d Trajectory Estimation for Air Traffic Control Automation System Based on Hybrid System Theory. Promet Traffic Transp. 2012, 24, 91–98. [Google Scholar] [CrossRef]
- Cafieri, S.; D’Ambrosio, C. Feasibility pump for aircraft deconfliction with speed regulation. J. Glob. Optim. 2017, 71, 501–515. [Google Scholar] [CrossRef]
- Durand, N.; Allignol, C.; Barnier, N. A Ground Holding Model for Aircraft Deconfliction. In Proceedings of the 29th Digital Avionics Systems Conference, Salt Lake City, UT, USA, 3–7 October 2010. [Google Scholar]
- Han, Y.X.; Huang, X.Q.; Zhang, Y. Traffic system operation optimization incorporating buffer size. Aerosp. Sci. Technol. 2017, 66, 262–273. [Google Scholar] [CrossRef]
- Jackson, M.R.C.; Sharma, V.; Haissig, C.M.; Elgersma, M. Airborne Technology for Distributed Air Traffic Management. Eur. J. Control 2005, 11, 464–477. [Google Scholar] [CrossRef]
- Wang, T.C.; Li, Y.J. Optimal Scheduling and Speed Adjustment in En Route Sector for Arriving Airplanes. J. Aircr. 2011, 48, 673–682. [Google Scholar] [CrossRef]
- Rey, D.; Rapine, C.; Fondacci, R.; El Faouzi, N.E. Minimization of Potential Air Conflicts Through Speed Regulation. Transp. Res. Rec. 2012, 2300, 59–67. [Google Scholar] [CrossRef]
- Rosenow, J.; Fricke, H.; Luchkova, T.; Schultz, M. Impact of optimised trajectories on air traffic flow management. Aeronaut. J. 2019, 123, 157–173. [Google Scholar] [CrossRef]
- Haraldsdottir, A.; Scharl, J.; Berge, M.E.; Coats, M.L.; King, J. Performance analysis of arrival management with 3D paths and speed control. In Proceedings of the 2007 IEEE/AIAA 26th Digital Avionics Systems Conference, Dallas, TX, USA, 21–25 October 2007. [Google Scholar]
- Rezaee, A.; Izadpanah, S. An Optimized, Mathematical-Based Flight Performance Planning. In Proceedings of the 2009 International Conference on Computer Technology and Development, Kota Kinabalu, Malaysia, 13–15 November 2009. [Google Scholar] [CrossRef]
- Koesters, D. Airport scheduling performance—An approach to evaluate the airport scheduling process by using scheduled delays as quality criterion. In Proceedings of the Air Transport Research Society (ATRS) Annual World Conference, Berkeley, CA, USA, 21–23 June 2007. [Google Scholar]
- Swaroop, P.; Zou, B.; Ball, M.O.; Hansen, M. Do more US airports need slot controls? A welfare based approach to determine slot levels. Transp. Res. Part B Methodol. 2012, 46, 1239–1259. [Google Scholar] [CrossRef]
- Jacquillat, A.; Vaze, V. Interairline Equity in Airport Scheduling Interventions. Transp. Sci. 2018, 52, 941–964. [Google Scholar] [CrossRef]
- Castelli, L.; Pellegrini, P.; Pesenti, R. Airport slot allocation in Europe: Economic efficiency and fairness. Int. J. Revenue Manag. 2011, 6, 28–44. [Google Scholar] [CrossRef]
- Ranieri, A.; Alsina, N.; Castelli, L.; Bolic, T.; Herranz, R. Airport slot allocation: Performance of the current system and options for reform. In Proceedings of the 3rd SESAR Innovation Days, Stockholm, Sweden, 26–28 November 2013. [Google Scholar]


| historic series of slots | [1501,2000] |
| “change to historic” series of slots | [1001,1500] |
| new entrant slots | [501,1000] |
| remaining slots | [1,500] |
| i | 1 | 2 | 3 | 4 | … | M | ||
|---|---|---|---|---|---|---|---|---|
| 1 | 1 | 0 | 0 | 0 | … | 0 | ||
| 2 | 0 | 0 | 1 | 0 | … | 1 | ||
| 3 | 0 | 0 | 0 | 0 | … | 0 | ||
| … | … | … | … | … | … | … | … | |
| E−1 | 0 | 0 | 0 | 1 | … | 0 | ||
| E | 0 | 1 | 0 | 0 | … | 0 | ||
| Execution batch equals P = | =+++++ +++++ ++++ | (a.0) | ||
| , c, , S | ++++≤ | (a.1) | ||
| ++++≤ | (a.2) | |||
| ++++≤ | (a.24) | |||
| , c, corridor 1 , S | ++++≤ | (b.1) | ||
| ++++≤ | (b.2) | |||
| ++++≤ | (b.24) | |||
| , c, corridor 8 , S | ++++≤ | (b.169) | ||
| ++++≤ | (b.170) | |||
| ++++≤ | (b.216) | |||
| = 1, | ++++ = 1 ++++ = 1 ++++ = 1 | (d.1) | ||
| (d.2) | ||||
| (d.m) |
| Tests | Weights of Disp, Diff, Prio | Total Diff | Average Diff | Total Disp | Average Disp | Capacity | Min (Disp) | Max (Disp) | Order | Figure |
|---|---|---|---|---|---|---|---|---|---|---|
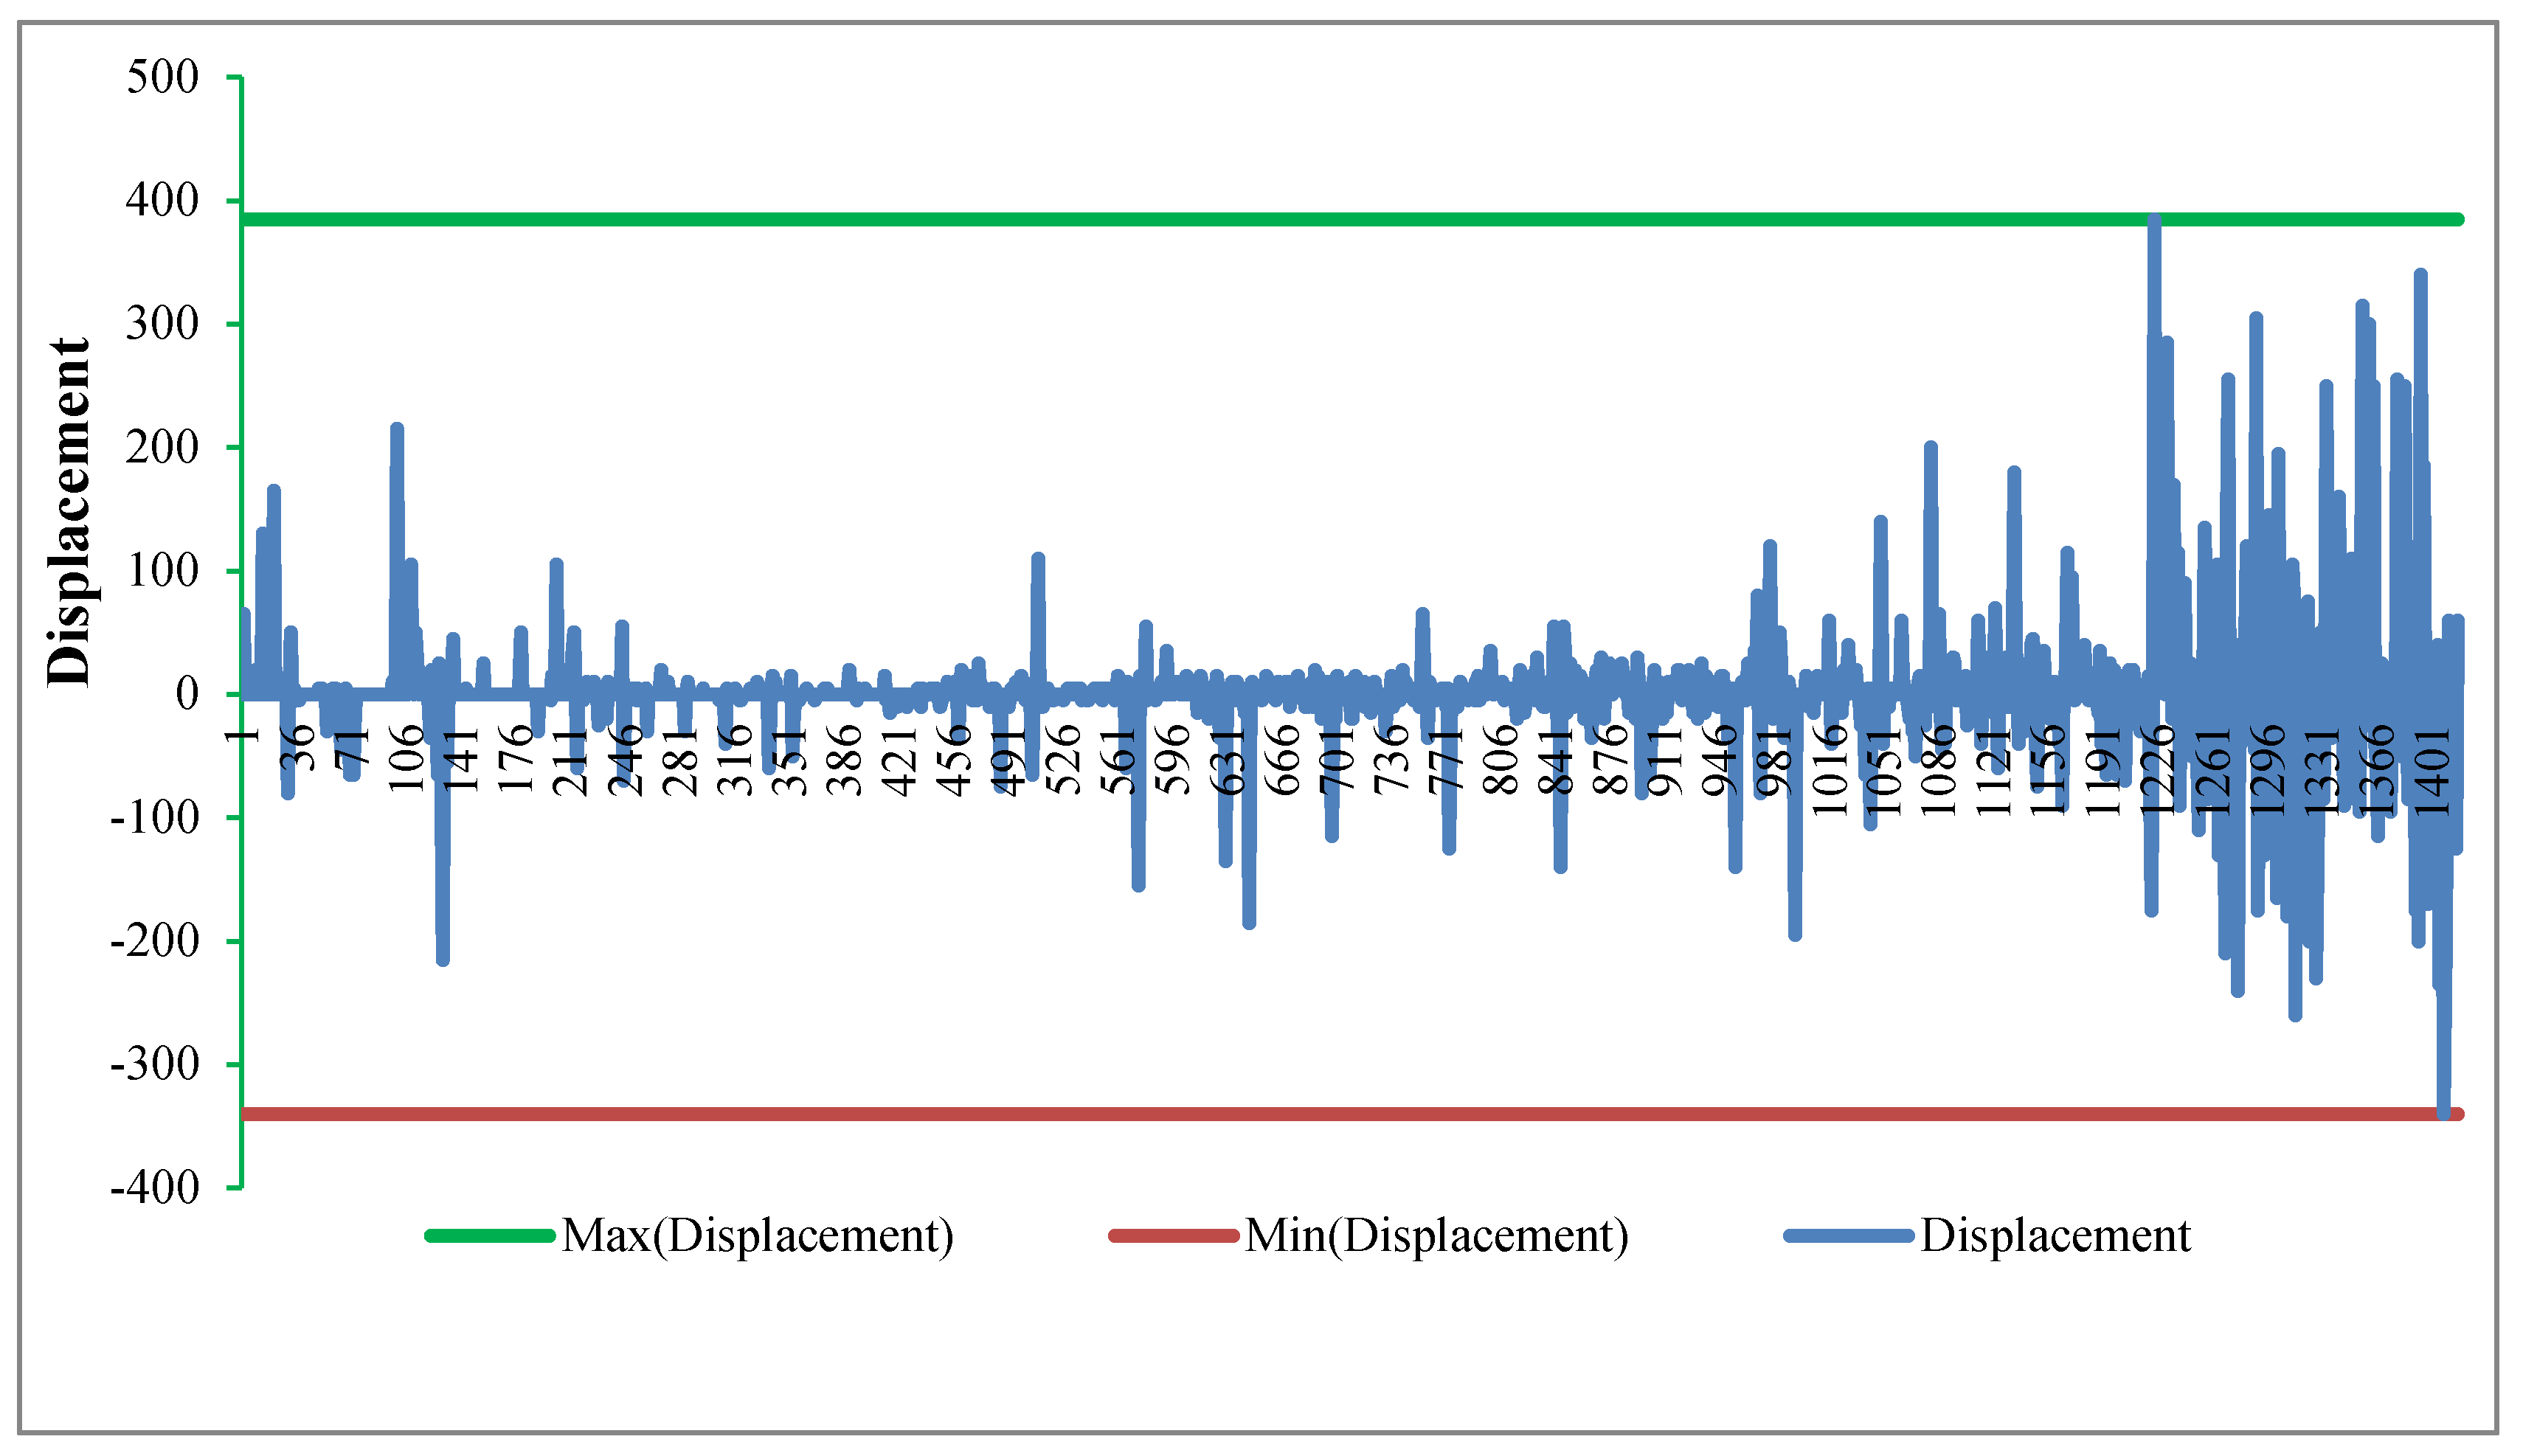
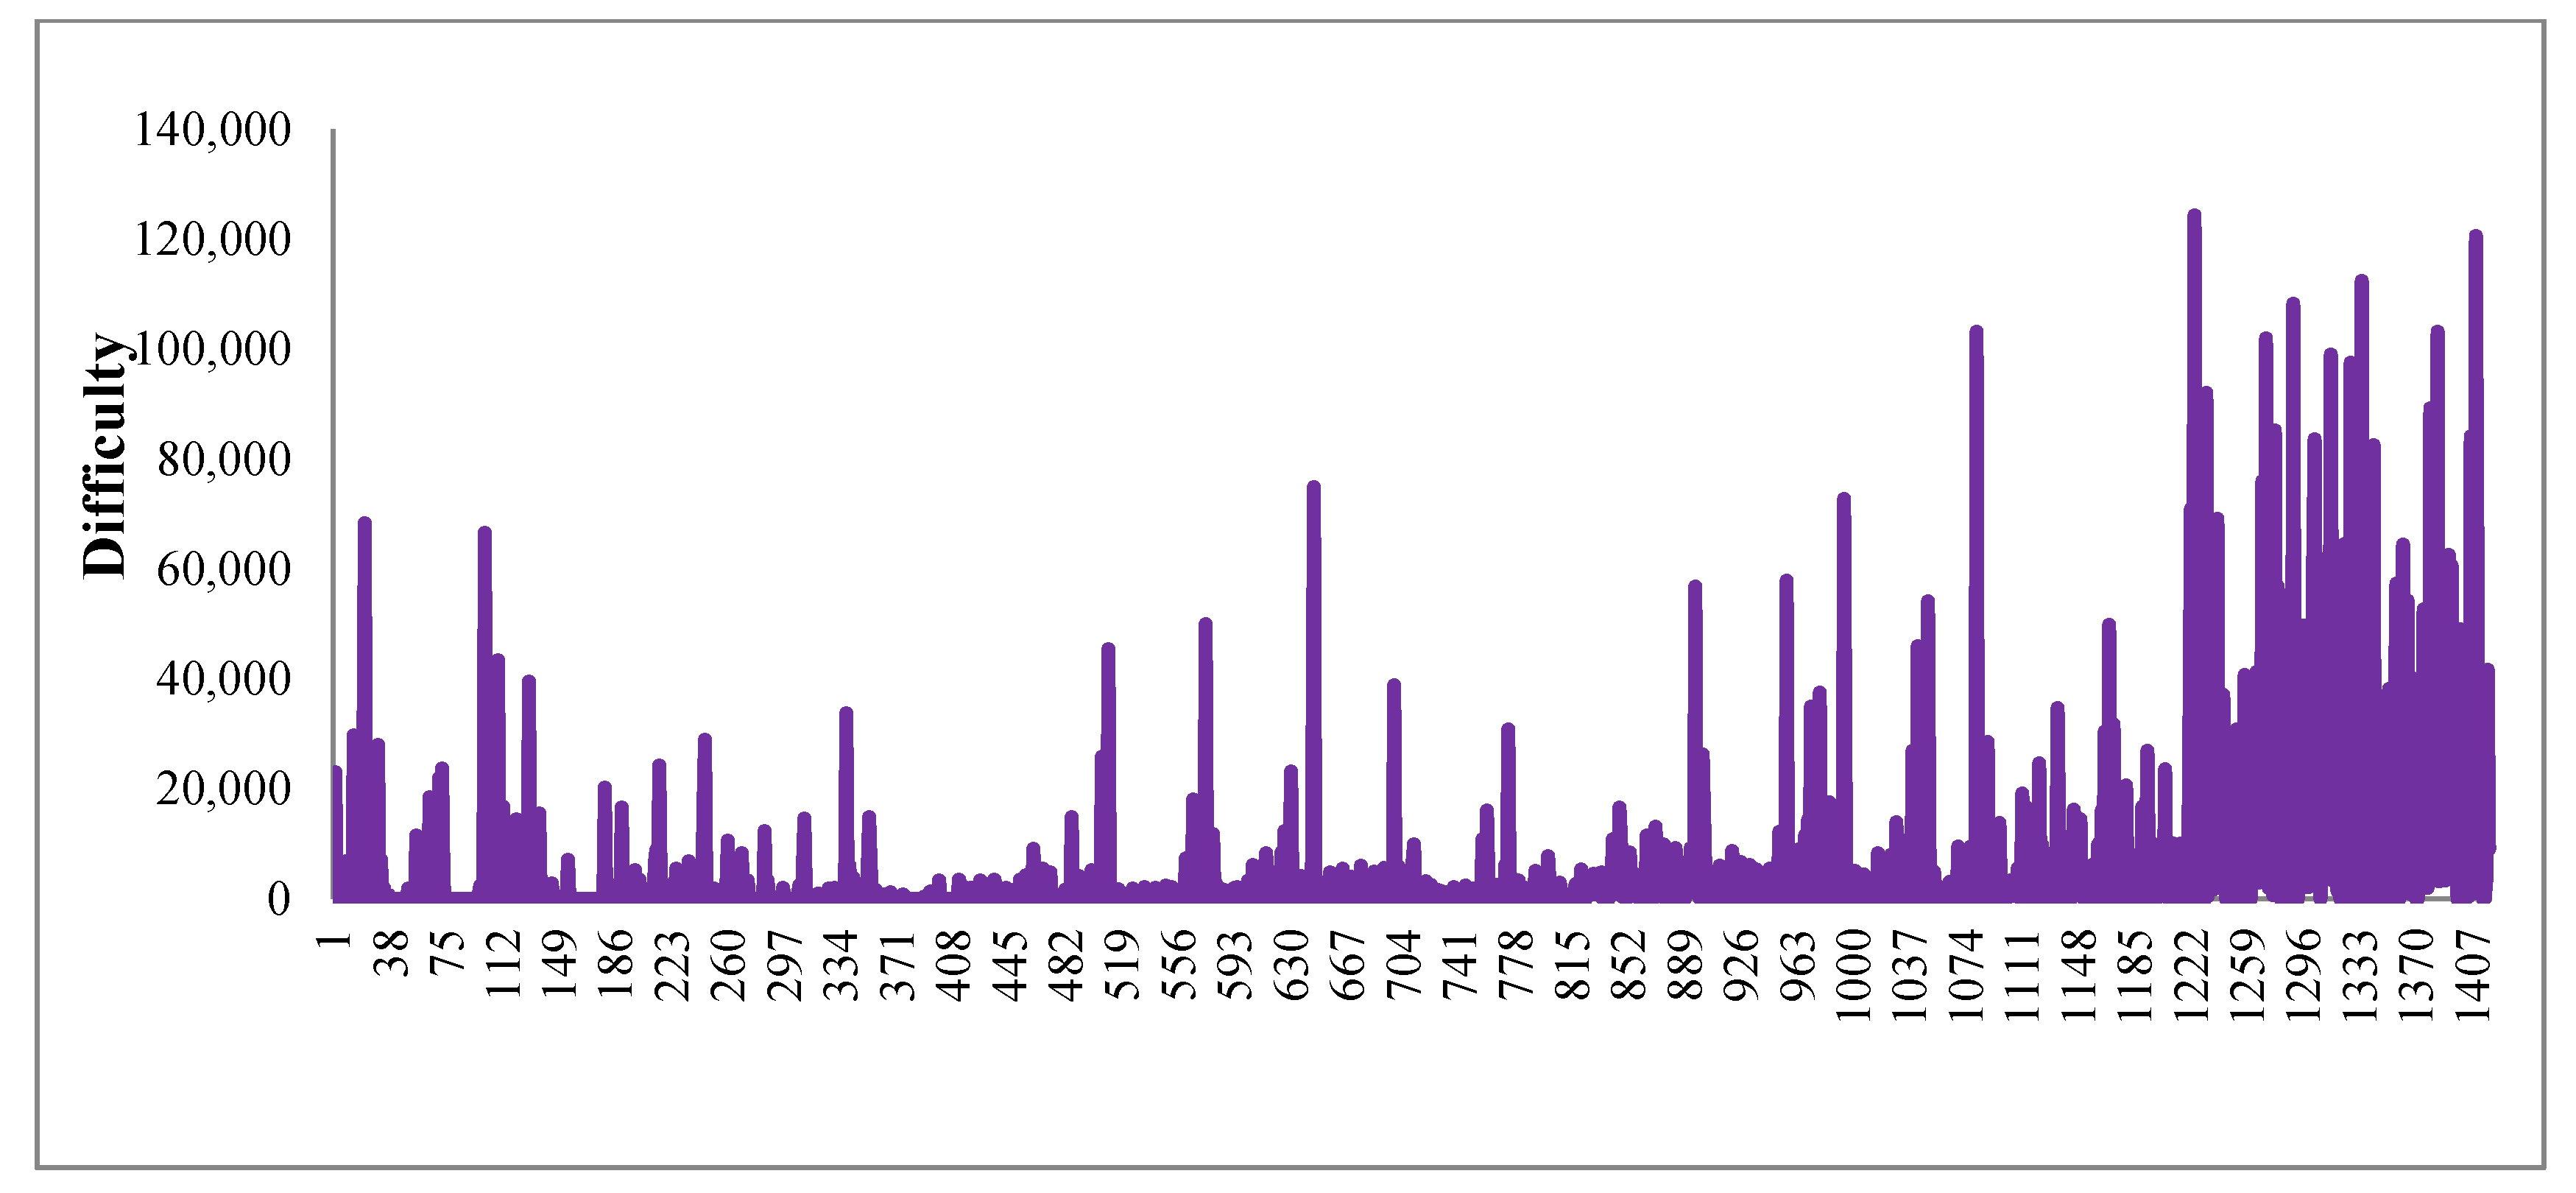
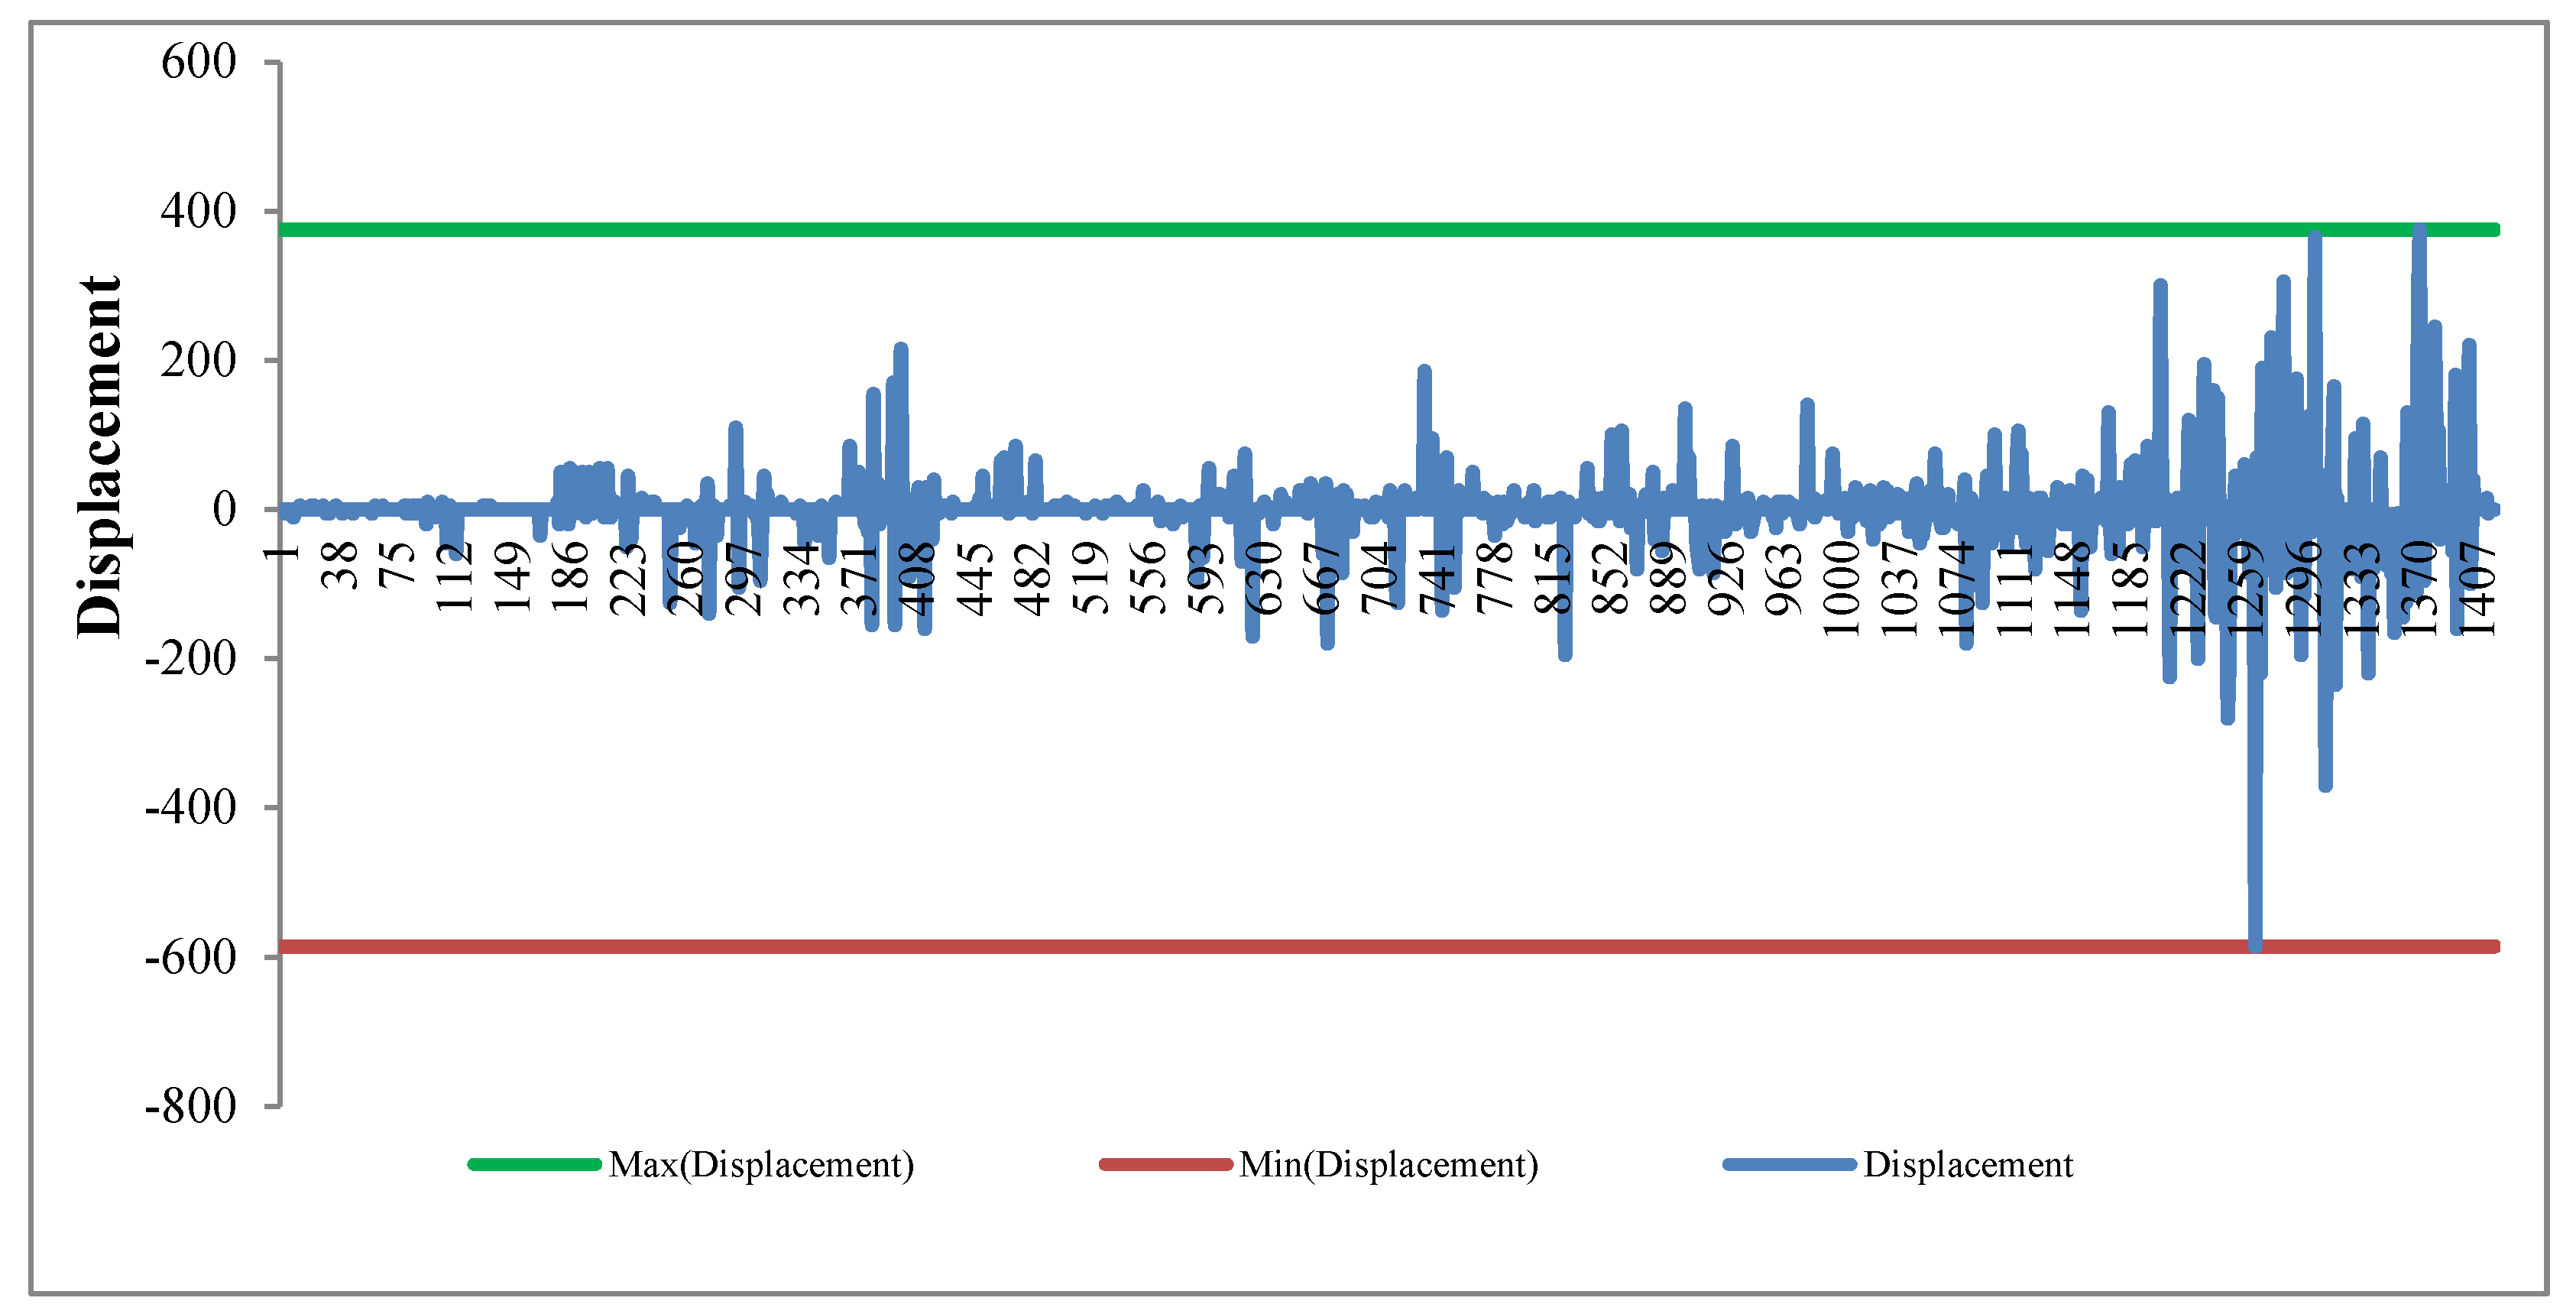
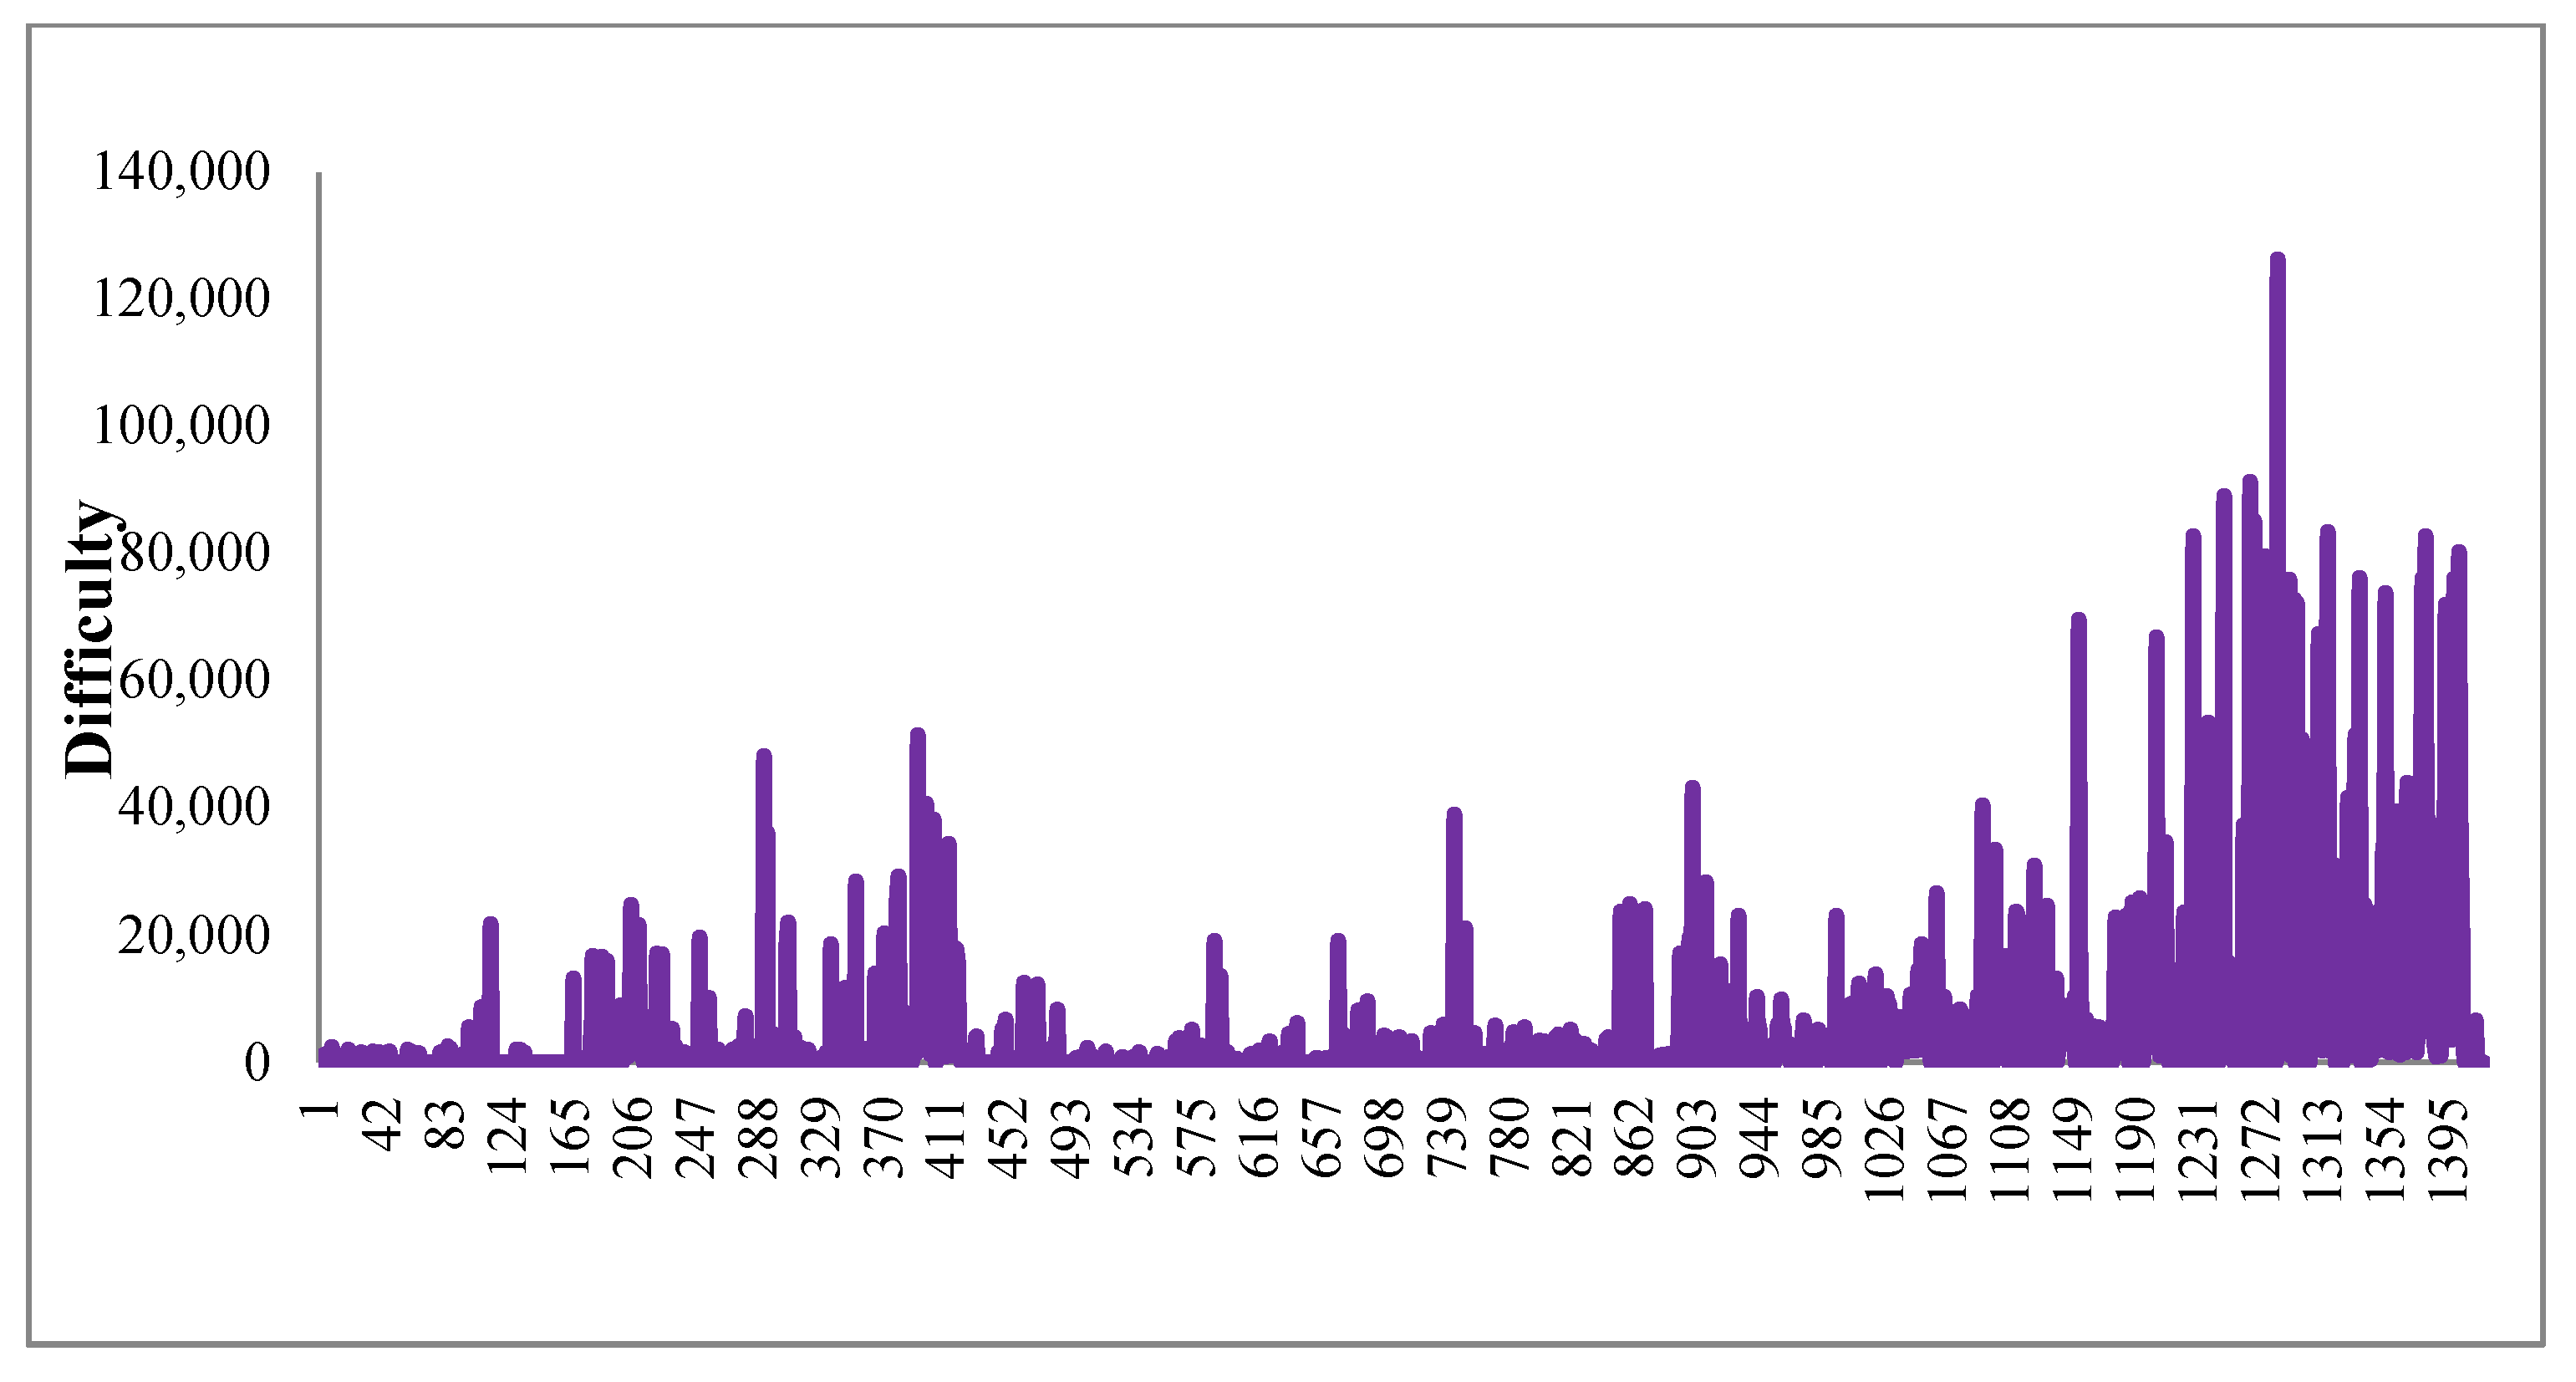
| 1 | 1,0,0 | 8.2E+06 | 5752.40 | 27200 | 19.18 | 88,23,7 | −340 | 385 | SD | 5, 6 |
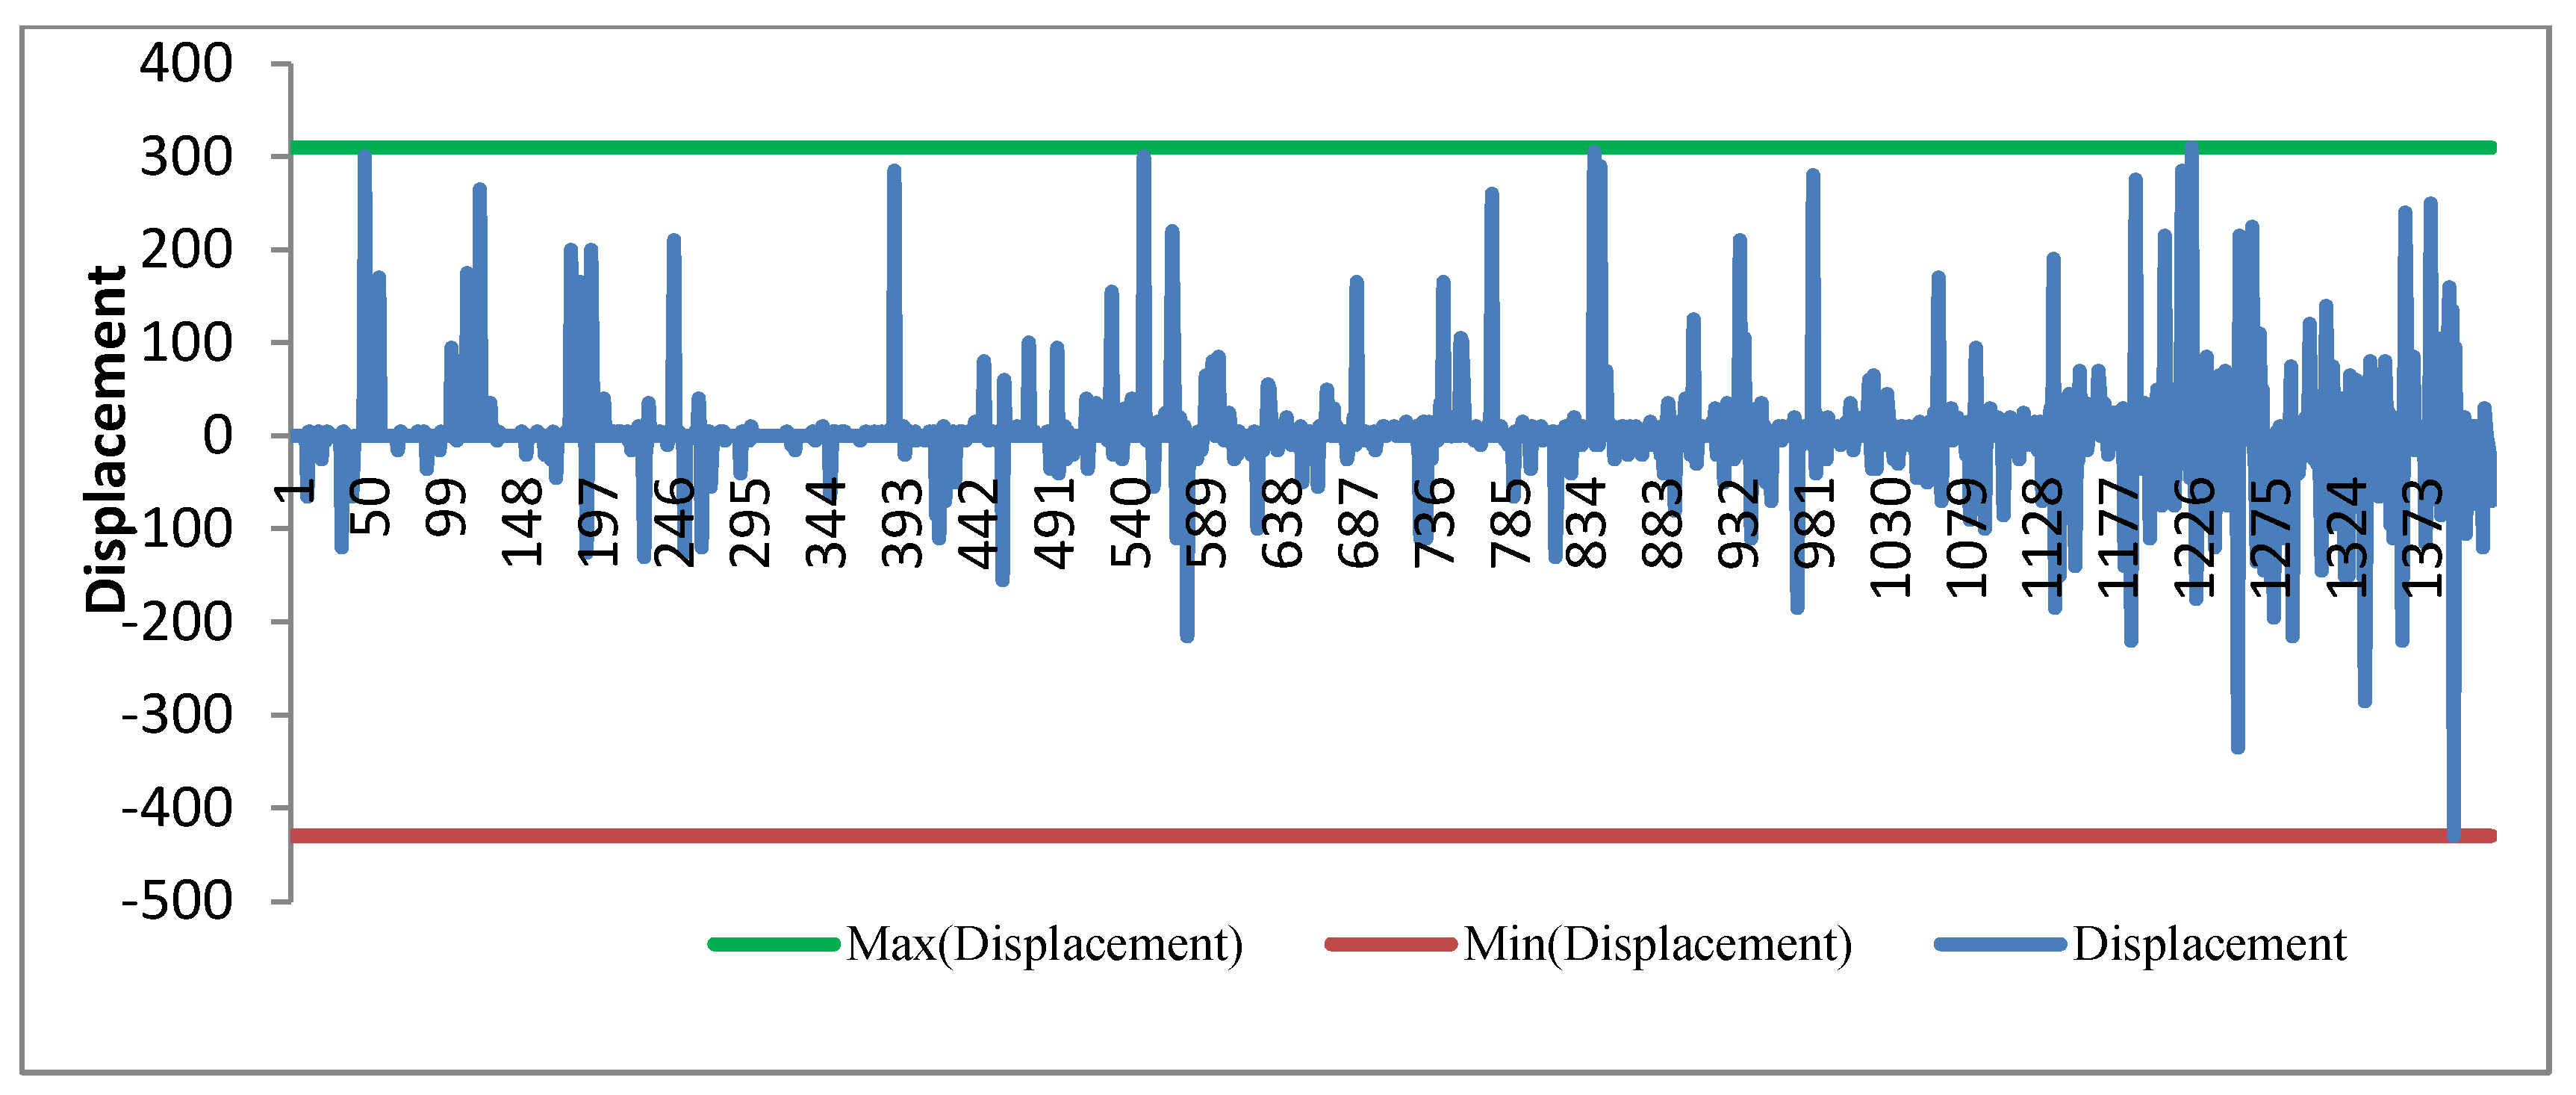
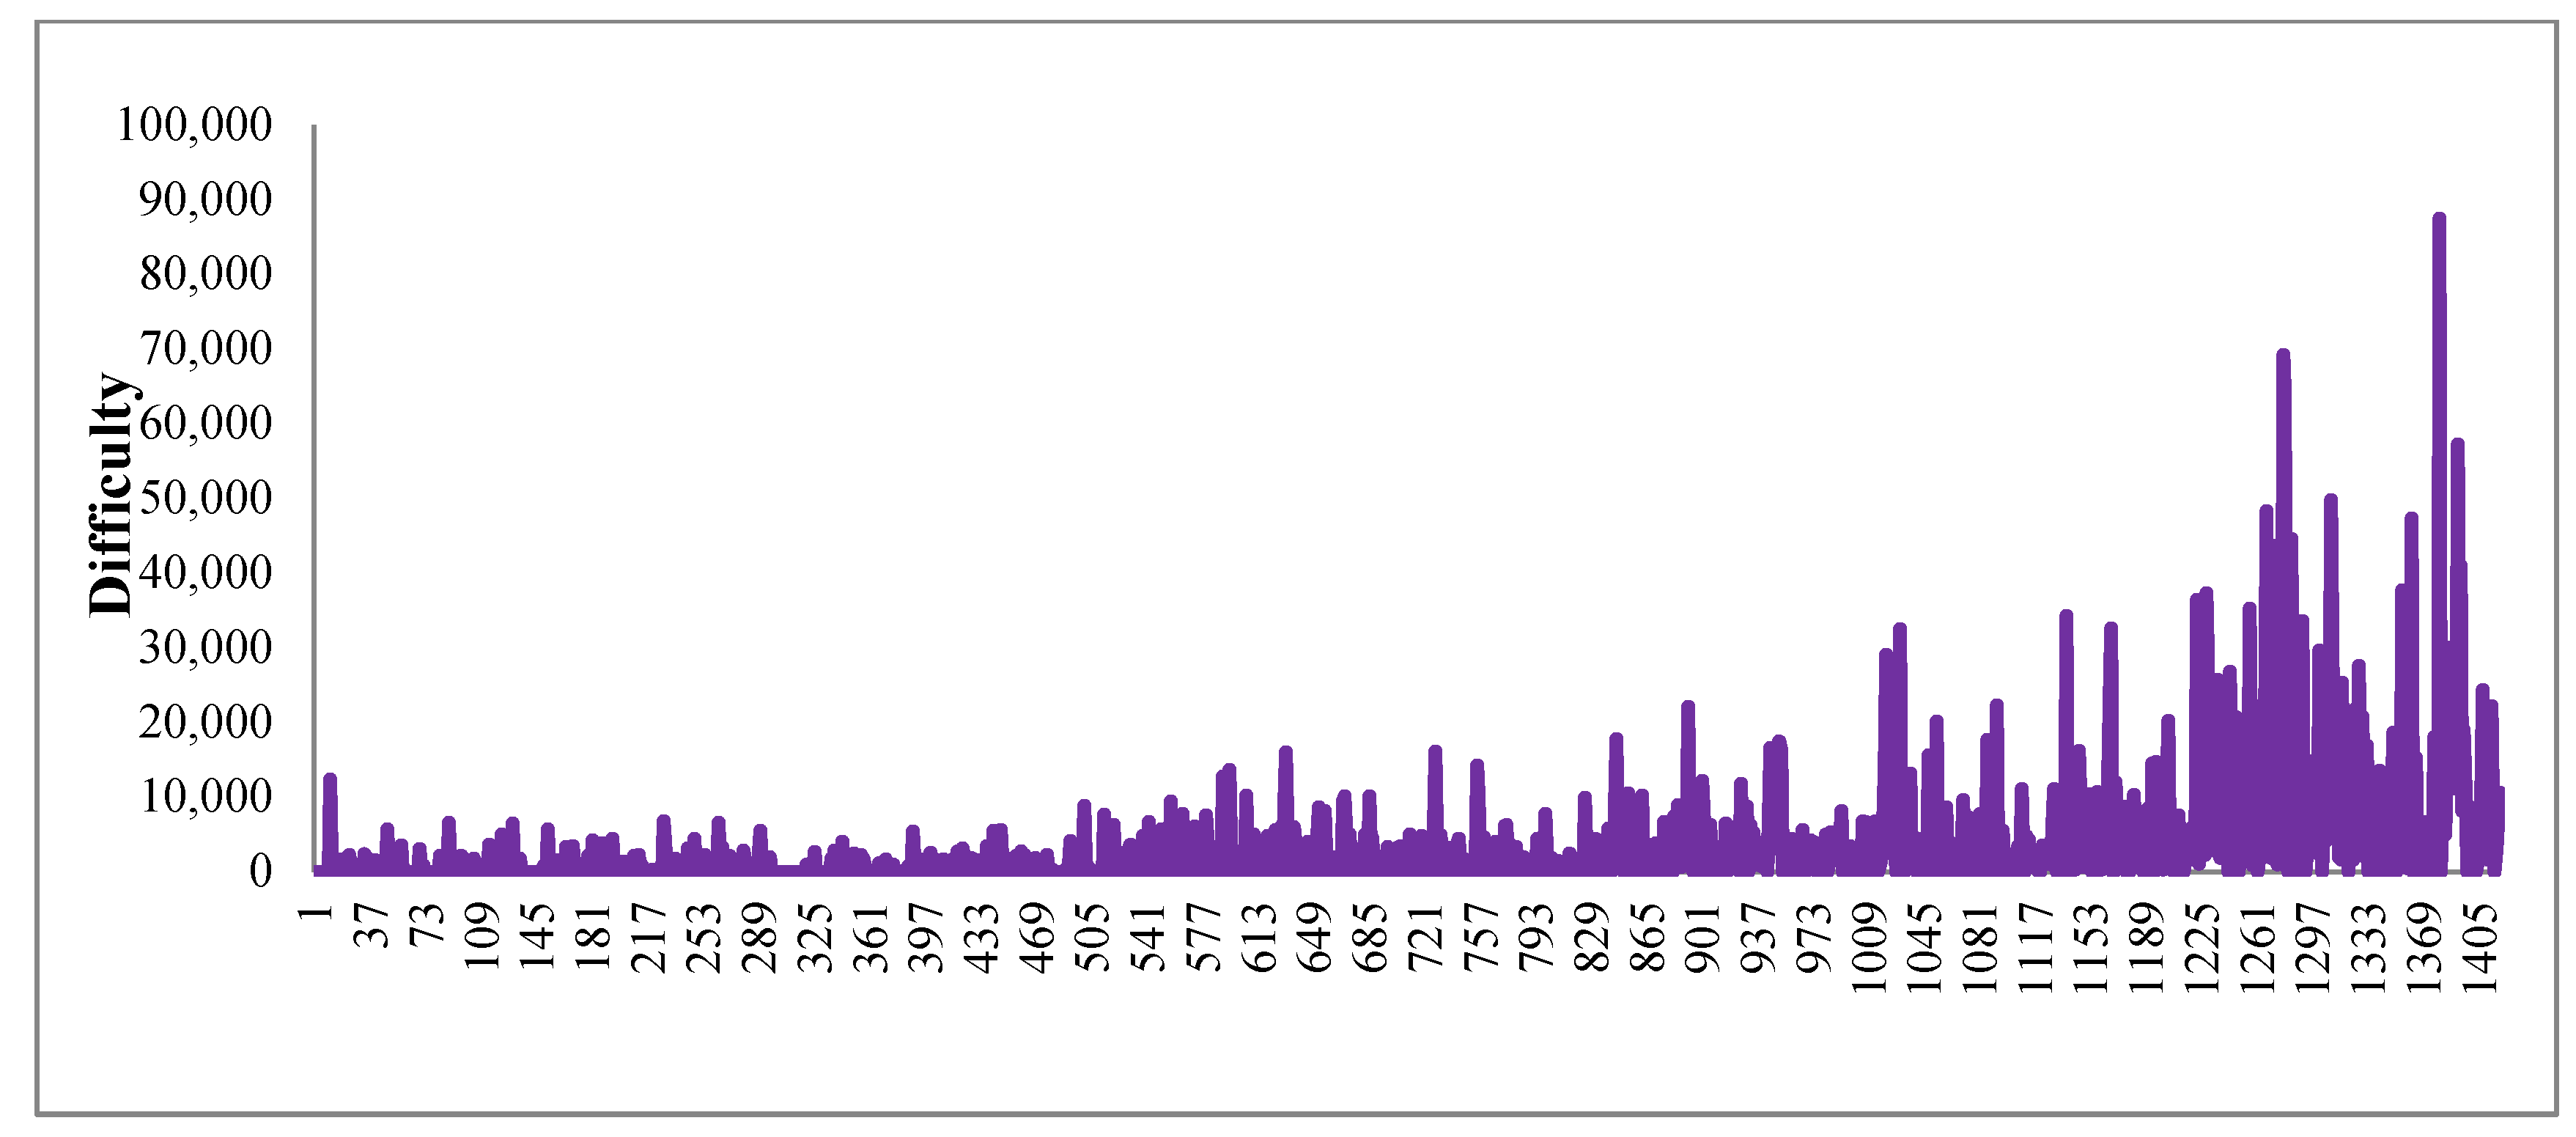
| 2 | 0,1,0 | 4.5E+06 | 3177.89 | 29290 | 20.66 | 88,23,7 | −430 | 310 | SD | 7, 8 |
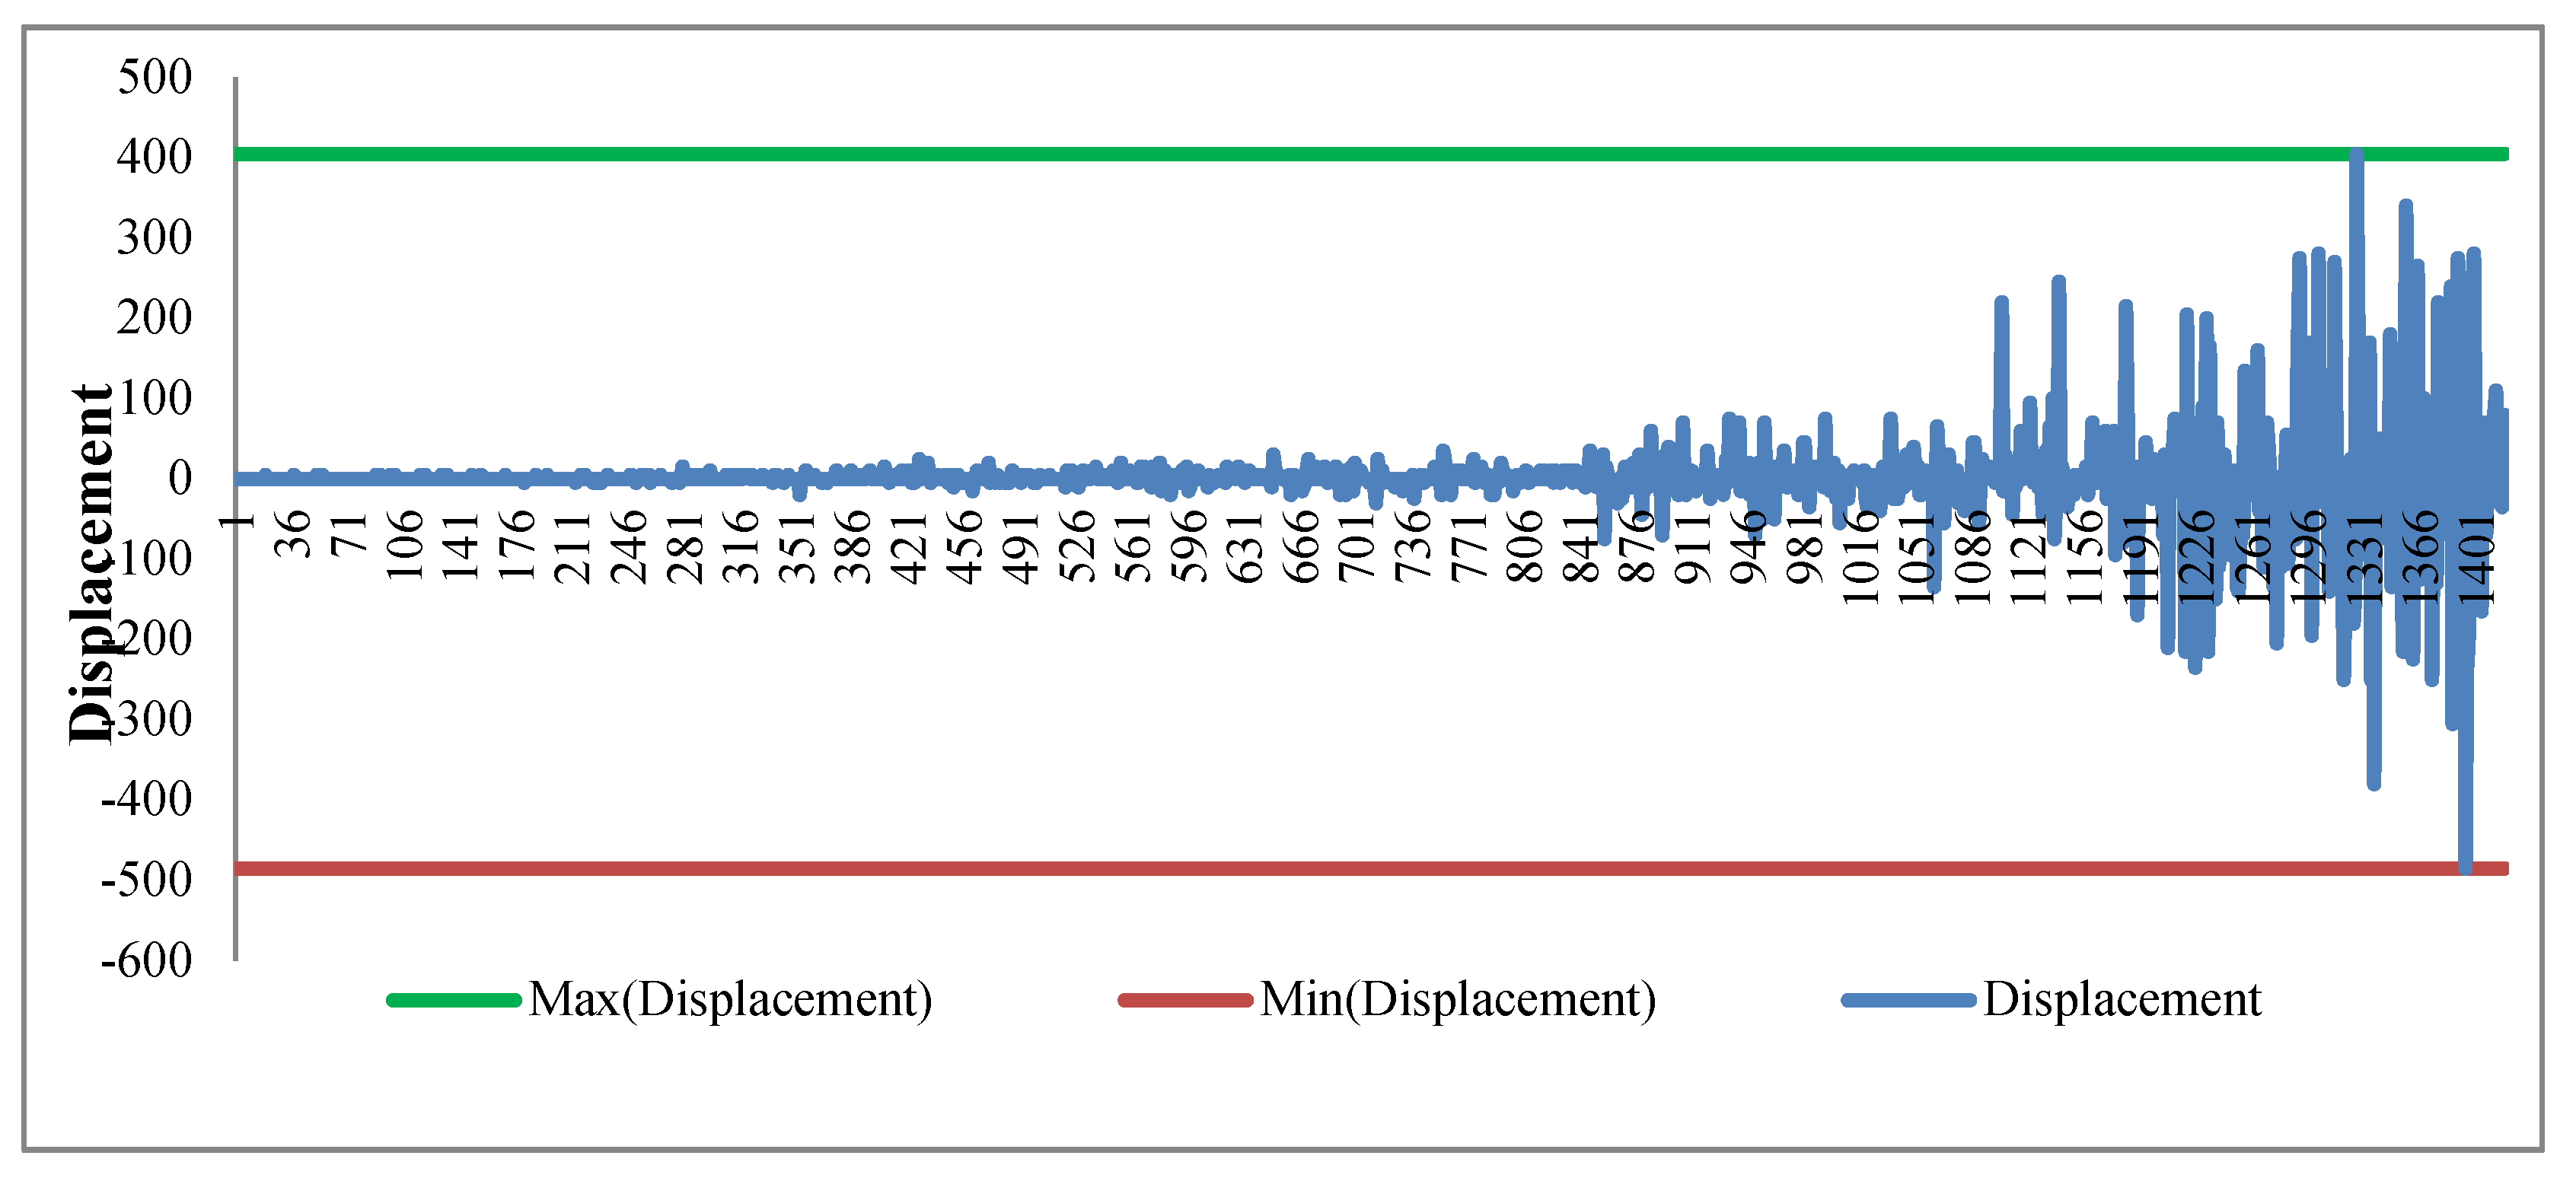
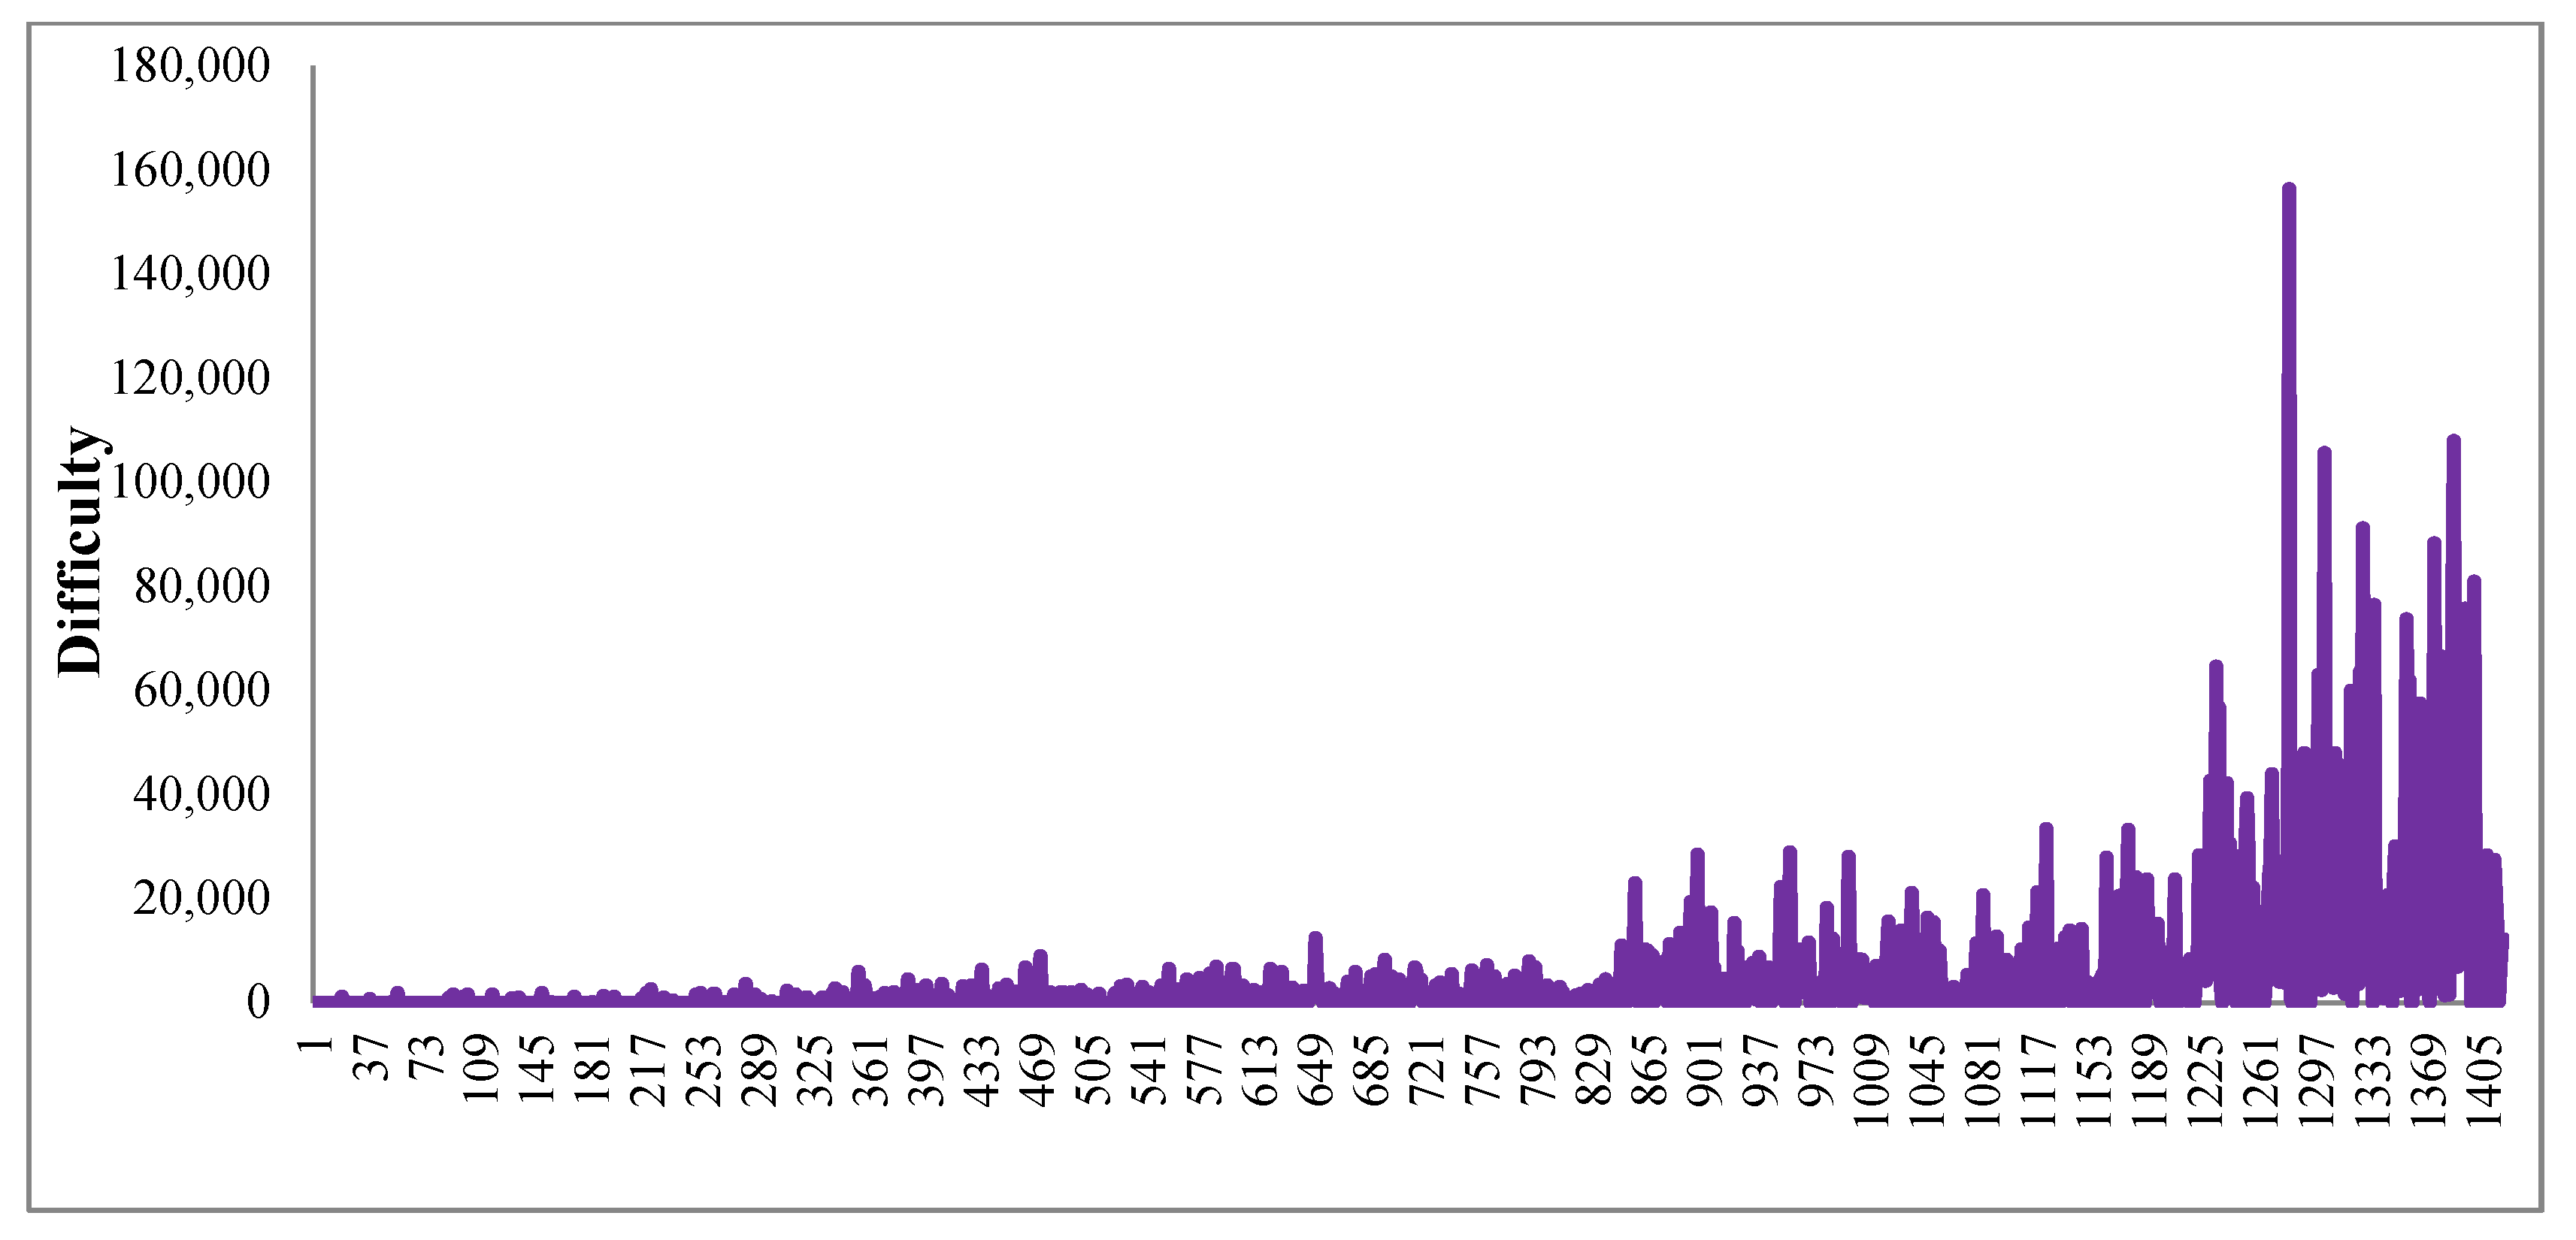
| 3 | 0,0,1 | 6.4E+06 | 4480.08 | 29220 | 20.61 | 88,23,7 | −485 | 405 | SD | 9, 10 |
| 4 | 0,0.9,0.1 | 5.1E+06 | 3582.03 | 30130 | 21.25 | 88,23,7 | −565 | 360 | SD | N |
| 5 | 0,1,1 | 6.4E+06 | 4480.08 | 27015 | 19.05 | 88,23,7 | −485 | 405 | SD | N |
| 6 | 0,0.5,0.5 | 6.6E+06 | 4650.95 | 29045 | 20.48 | 88,23,7 | −485 | 340 | SD | N |
| 7 | 0,1,1 | 9.0E+06 | 6367.90 | 44330 | 31.26 | 78,20,7 | −520 | 460 | SD | N |
| 8 | 0,0.5,0.5 | 7.2E+06 | 5064.14 | 28305 | 19.96 | 88,23,7 | −585 | 375 | not SD | 11–13 |
| 9 | 1,0.1,0.9 | 5.2E+06 | 3670.50 | 29385 | 21.00 | 88,23,7 | −545 | 350 | SD | N |
| 10 | 1,0,0 | 8.3E+06 | 5855.00 | 28170 | 20.00 | 88,23,8 | −270 | 419 | not SD | N |
| 11 | 0.8,0.01,0.09 | 5.0E+06 | 3544.65 | 28440 | 20.06 | 88,23,8 | −510 | 410 | SD | N |
| 12 | 100,0.1,0 | 5.3E+06 | 3707.60 | 28060 | 19.79 | 88,23,8 | −545 | 365 | SD | N |
| The First Set of Tests | Average Displacement X | Average Difficulty Y |
|---|---|---|
| 5 | 19.05 | 4480.08 |
| 1 | 19.18 | 5752.40 |
| 12 | 19.79 | 3707.60 |
| 8 | 19.96 | 5064.14 |
| 10 | 20.00 | 5855.00 |
| 11 | 20.06 | 3544.65 |
| 6 | 20.48 | 4650.95 |
| 3 | 20.61 | 4480.08 |
| 2 | 20.66 | 3177.89 |
| 9 | 21.00 | 3670.50 |
| 4 | 21.25 | 3582.03 |
© 2019 by the authors. Licensee MDPI, Basel, Switzerland. This article is an open access article distributed under the terms and conditions of the Creative Commons Attribution (CC BY) license (http://creativecommons.org/licenses/by/4.0/).
Share and Cite
Ye, Z.; Li, Y.; Bai, J.; Zheng, X. Performance Comparing and Analysis for Slot Allocation Model. Information 2019, 10, 188. https://doi.org/10.3390/info10060188
Ye Z, Li Y, Bai J, Zheng X. Performance Comparing and Analysis for Slot Allocation Model. Information. 2019; 10(6):188. https://doi.org/10.3390/info10060188
Chicago/Turabian StyleYe, ZhiJian, YanWei Li, JingTing Bai, and XinXin Zheng. 2019. "Performance Comparing and Analysis for Slot Allocation Model" Information 10, no. 6: 188. https://doi.org/10.3390/info10060188
APA StyleYe, Z., Li, Y., Bai, J., & Zheng, X. (2019). Performance Comparing and Analysis for Slot Allocation Model. Information, 10(6), 188. https://doi.org/10.3390/info10060188