Article

Dynamic Evolution Model of a Collaborative Innovation Network from the Resource Perspective and an Application Considering Different Government Behaviors

School of Economics and Management, University of Electronic Science and Technology of China, Chengdu 611731, Sichuan, China
*
Author to whom correspondence should be addressed.
Information 2019, 10(4), 138; https://doi.org/10.3390/info10040138
Submission received: 22 February 2019 / Revised: 6 April 2019 / Accepted: 11 April 2019 / Published: 12 April 2019
(This article belongs to the Special Issue Computational Social Science)

Abstract

:
The evolution of a collaborative innovation network depends on the interrelationships among the innovation subjects. Every single small change affects the network topology, which leads to different evolution results. A logical relationship exists between network evolution and innovative behaviors. An accurate understanding of the characteristics of the network structure can help the innovative subjects to adopt appropriate innovative behaviors. This paper summarizes the three characteristics of collaborative innovation networks, knowledge transfer, policy environment, and periodic cooperation, and it establishes a dynamic evolution model for a resource-priority connection mechanism based on innovation resource theory. The network subjects are not randomly testing all of the potential partners, but have a strong tendency to, which is, innovation resource. The evolution process of a collaborative innovation network is simulated with three different government behaviors as experimental objects. The evolution results show that the government should adopt the policy of supporting the enterprises that recently entered the network, which can maintain the innovation vitality of the network and benefit the innovation output. The results of this study also provide a reference for decision-making by the government and enterprises.

1. Introduction

With the continuous improvement of scientific and technological productivity, the highly active external environment is applying pressure on enterprises to make change. Thus, enterprises must innovate to maintain a sustainable competitive advantage [1]. However, changes in knowledge form and the modes of technological innovation prevent enterprises from conducting efficient innovation completely by relying on internal resources. This is a particularly pressing issue for China under the new normal of economic transformation. Most Chinese enterprises remain in the exploration phase of their own reform and their innovation ability is still relatively weak. To obtain external resources, some of them have begun to seek strategic cooperation. For example, in December 2017, three major automobile groups in China—the China FAW Group, the Dongfeng Motor Corporation, and the Changan Automobile Group—signed up to a strategic cooperation agreement. The content of the agreement includes forward-looking common technological innovation as well as full value chain operation. These innovative participants strengthen cooperation and transform the development of the innovation process from a linear mode to a nonlinear mode. A collaborative innovation network gradually takes shape by establishing contacts with enterprises, government agencies, universities, research institutions, and intermediaries [2]. Along with the parallel process of technological innovation, the integration of innovation resources, the collaboration of innovation subjects, and the mainstream mode for international technological innovation have all begun to move towards collaborative innovation [3]. A collaborative innovation network involves benefit-sharing and risk-sharing of innovation activities. This plays a significant role in enhancing the controllability of the research and development (R&D) process and achieving resource complementarity.
Research into the innovation network has been expanding. Zobel [4] and Rijnsoever et al. [5] mainly studied the innovation network from the perspectives of resources and structure. A logical relationship exists between the structure and innovative behaviors. The characteristic structure and the relationship structure determine their coordination ability, innovation ability, and adaptability. These capabilities, in turn, are effective in promoting knowledge sharing and information exchange. Gulati claimed that the strategic network structure restricts the efficiency of the internal resources of enterprises [6]. Gnyawali believed that the network structure enables enterprises to generate different motivations in response to other members’ competitive actions [7]. Enterprises can observe the network characteristics of the possible cooperative technology fields to choose their partner with the best information and technology advantages [8]. An overall innovative network can allow for an individual enterprise to acquire complementary innovation resources as well as to gain a competitive advantage. Such enterprises may then rely on these advantages to form a network structure that is unique to their growth. Therefore, the evolution of a network is a process that is gradually optimized by the internal structure. This process not only depends on the nature, location, and role of enterprises, but also on the interrelationships among the enterprises [9]. Thus, various minor changes can possibly affect the topology of the network, resulting in different evolutions. The growth of enterprises is accompanied by constant changes to their network size, nodes, and density [10,11]. Therefore, behavioral research into innovation subjects and their impact on network evolution could assist enterprises with the analysis of the network environment, and could provide theoretical guidance for the long-term rapid development and strategic layouts. Besides, such research could provide advice to the government agencies regarding innovation policy-making and thus improve the innovation efficiency of networks and enterprises. Based on the above factors, we primarily analyzed the behavioral rules of collaborative innovation network subjects and the dynamic process of network evolution, as well as established an evolution model that is based on the resource-priority connection mechanism. We used the model to forecast the evolution of collaborative innovation networks in relation to three different government behaviors. The simulation results provide a reference for government and enterprise decision-making.
The structure of this paper is as follows. In Section 2, we analyze the characteristics of a collaborative innovation network and the behavioral rules among network subjects. In Section 3, we analyze a typical innovation network that operated in China, with the “One School and One Belt” action plan as an exploratory case. In Section 4, we establish a simulation model of a resource- priority connection mechanism. We then simulate the evolution process of a collaborative innovation network, taking different behaviors of the government as the experimental objects. Finally, we draw conclusions with a brief discussion in Section 5.

2. Literature Review

In this section, we conduct a review of the relevant literatures and emphatically analyze the network characteristics and the behavioral rules among subjects in the following three aspects:
(1)
Research into the collaborative innovation network. A collaborative innovation network is comprised of enterprises and other subjects (universities, research institutes, governments, intermediaries, etc.) [12]. To increase the chance of success in innovation, subjects are increasingly dependent on complementary knowledge from other subjects. The tendency towards cooperation is becoming increasingly apparent. The network innovation model of multi-subject interaction exhibits a nonlinear effect on system superposition through in-depth cooperation and resource integration [13]. Innovation is no longer a separate activity. Instead, it is a holistic activity that is performed by a complex network. However, when compared with a general innovation network, the collaborative innovation network emphasizes knowledge interaction and technology transfer. It focuses more on the role that is played by the government and institutional environments and it emphasizes the synergistic effect and periodic cooperation [14]. Jianyu’s study showed that knowledge transfer and innovation capacity are the dominant factors in the evolution of the Chinese industry–university-research collaborative innovation [15]. Fernandez-Esquinas et al. explored the knowledge transfer mechanism of a collaborative innovation system and then categorized it into five potential dimensions [16]. Rehm et al. analyzed how those small-and-medium-sized enterprises (SMEs) use knowledge management to address the three challenges in establishing partnerships, integrating partner value, and positioning innovation in the formation and operation of a collaborative innovation network [17]. The competitive drive of a collaborative innovation network is reflected in the information that is received and the feedback speed of the subject’s innovation ability [18]. The complementary advantages and resource integration reflect functional collaboration [19]. Both are the major forms of the collaborative network transfer mechanism.
(2)
Research into network evolution. The core of innovation network evolution lies with the complementary resources (funding, technology, and market), member changes, preferential link mechanisms, and periodic cooperation [20]. Changes in the relationships within the main elements of a collaborative innovation network, including enterprises, universities, research institutions, government, and social service systems, inevitably lead to the evolution of network structure. Ivan reported that the cognitive distance, cognitive ability, and communication mechanism of the R&D innovation subject are the main factors in a collaborative network structure. The dynamic cooperation is formed through the selection mechanism of knowledge space [21]. Gay and Dousset also stated that the frequency of the entry and exit for enterprises leads to changes to the network, and that the time and spatial boundaries of network construction change as a result [22]. Correspondingly, changes to network structure can show the evolution process and characteristics. Xia’s research regarding information and communication technology industry showed that, as scale increases, the innovation network has obvious small-world effects and scale-free characteristics [23]. Tatarynowicz determined the different network structure characteristics of industries that are driven or stabilized by technology [24]. With changes in the network, specific characteristics are formed and enterprises show adaptive collaborative behavior. Van’s study found that, as knowledge transfer is a dynamic process, the decisions of an enterprise change according to the new circumstances and knowledge base [25]. This state continues over time, which leads to a continuous interactive iteration between the collaborative innovation behavior and the network structure.
(3)
Research into innovation resources. Current findings suggest that the amount of resources that is required for the innovation process is increasing. As a result of certain constraints, the gap between the resources that are owned by a single entity and those needed to conduct innovative activities increases [26]. Therefore, to ensure success in innovation, the key is to have a basis for innovation profitability, including professional manufacturing capabilities, heterogeneous knowledge, channels, and other innovation resources. The “innovation resource” is a new type of resource that consists of a series of shareable material resources and non-material resources, including human resources, knowledge, and technology [27]. The view on the network and resource is that, while providing information and knowledge resources through enterprise network partners, it can address the problem of resource constraints. The integration of resources can lead to benign resources in the business process and reduce the risk of participation identification and information acquisition. Due to the scarcity of resources, enterprises must cooperate with the external resource controllers to access the required resources [28]. The network contains key resources, and a common language or value system in the network that enables enterprises to improve their ability to exchange, integrate, and acquire innovative resources, such as information and knowledge [29,30]. Ritala and Hurmelinna-Laukkanen’s study showed that, if enterprises collaborate with their competitors, their ability to access external resources improves and their resource boundaries expand. This facilitates the spreading, innovation, and application of knowledge [31]. Enterprises can consider integrating similar and complementary resources through cooperation, thereby jointly achieving value creation [32].
The strategic choice of enterprise depends on its own specific and heterogeneous resources. The literature illustrates that the resources, capabilities, and capital of enterprises influence their willingness and capability to engage in innovation. Knowledge-bound enterprises can reconfigure their existing knowledge or discover new knowledge to implement technological inventions in novel ways. Financially constrained enterprises are more likely to take risks and acquire external resources through open innovation, venture capital, and social strategies [33]. The structural, cognitive, and relational dimensions of social capital promote corporate innovation through the sharing, interaction, and integration of knowledge and information [34]. Therefore, the network participants are not randomly testing all of the potential participants, but they have a strong tendency to innovation resource. This tendency manifests itself in their pursuit for resources, which is a preferential linkage mechanism. Equivalent to the partner selection mechanism, the partner selection criteria include that the partners have high-intensity innovation capabilities.

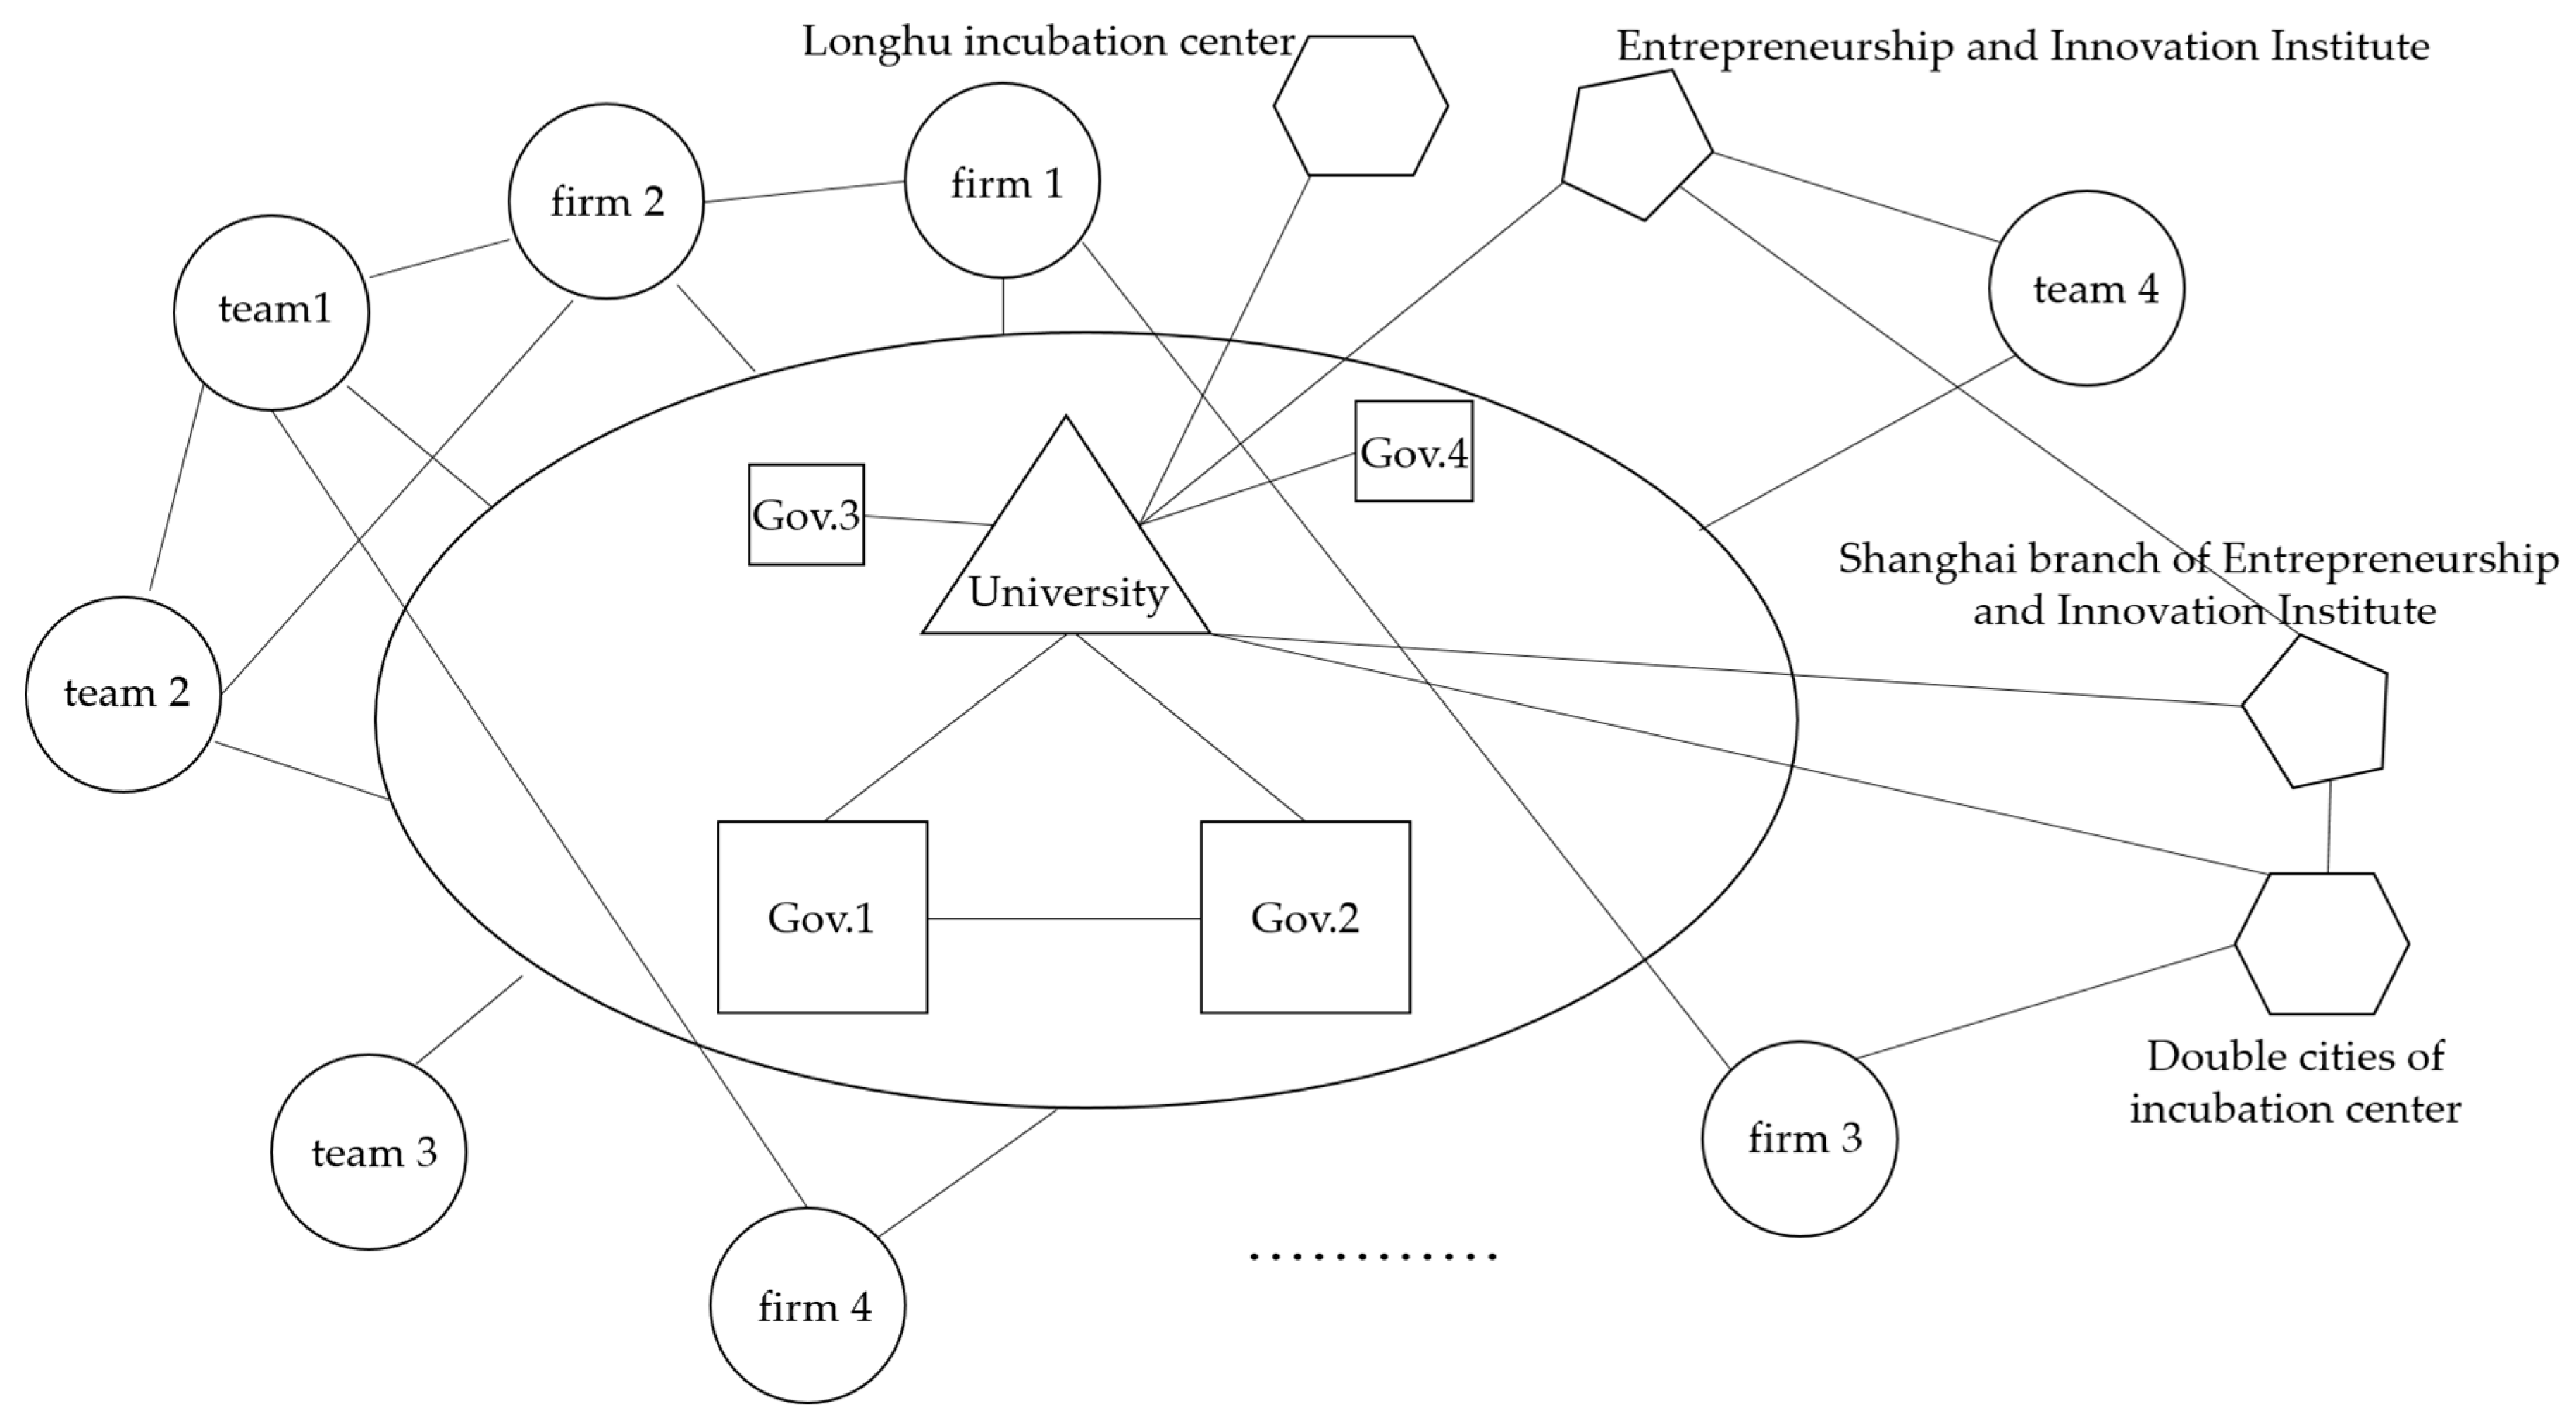
3. Exploratory Case Study

In 2014, China promoted mass entrepreneurship and innovation, indicating that building an innovation-oriented country had become one of China’s strategic objectives [35]. Subsequently, local governments introduced policies to further implement the objective. Practice has proven that, within a slowing economy, the strategic decision contributed to stabilizing growth, preventing risks, and expanding employment. On 5 March 2019, Chinese Premier Li Keqiang delivered the government work report [36]. He reported that, with the deepening of mass entrepreneurship and innovation, an innovation situation with multi-subject collaboration had taken shape, and the innovation capacity and efficiency had further improved. Every day, more than 18,000 new enterprises were set up, and the total number of market subjects exceeded 100 million. Among them, the creation of a large number of innovation networks added to their own strength, such as the Beijing Zhongguancun Electronic Network and the Zhejiang Leather Goods Network. A network model has become a striking characteristic of global economies, such as Silicon Valley in the United States, the steel network in Germany, and the tertiary industry cluster in Italy. The network economy effect has become an essential source in China, and even across the world. Within some innovation networks, universities are integrated with governments, enterprises with universities, enterprises with governments, and internal enterprises with external leading enterprises, which results in positive connections. This sort of integration eventually evolves into a collaborative innovation network. Li Keqiang stated that the next major task is to continue improving the industry–university-research collaborative innovation mechanism and increasing international innovation cooperation. In view of this, we chose the “One School and One Belt” action plan as an exploratory case for study to lay a foundation for the subsequent simulation model. The “One School and One Belt” action plan is representative and it explores the national implementation of an innovation-driven development strategy.
“One School and One Belt” involves the Entrepreneurship and Innovation Demonstration Zone of University of Electronic Science and Technology (Chengdu, China) and the Chengdu High-tech Zone Achievements Transformation Industry Belt, which makes full use of the electronic information that was obtained from the university [37]. The plan will create an entrepreneurial and innovative development belt with “Internet+” as the core, with advantages in the electronic field. The belt integrates education with training and incubation, with the aim of building up a new type of Internet+ innovation network. In September 2015, the Chengdu Municipal Government and the Chengdu High-Tech Zone Government each signed up to the comprehensive strategic cooperation agreement with the university [38]. The three sides jointly established a national independent innovation demonstration zone. An innovation network was gradually built up with the emergence of new enterprises.
The government and the university first established the network. The enterprises in the network are mainly reliant on the incubation of the science and technology resources of university. The enterprises entering the innovation network at the initial stage basically cultivate the university industry, under the support from the government and with the resources of the network. Enterprises seek connections with other enterprises through the collaborative innovation network to fully access external resources. With the clear purpose, they do not take the average degree as the criterion and care little about the number of partners that the object enterprise has. Instead, they just expect to acquire the resources that they need. Based on data collection and in-depth interviews, entrepreneurs and executives generally take the view that the amount of resources is the primary influencing factor in the establishment of cooperation. This is more important to a network structure where the industry is relatively concentrated. When choosing a cooperation object, determining the number of partners of the object usually makes no difference. What matters lies in whether it can provide corresponding resources for its own development.
Three key bases have been presented in the network, namely the Innovation Center, the “Advanced Wireless Communication Co-Creation Space”, and the Cultivating Base, including a total of 12 integrated research teams, 29 alumni enterprises, and 157 scientific research teams in the three bases. In addition, there are incubation bases, innovation institutes, and other subjects in the network. Figure 1 shows the current evolutionary framework. These innovation subjects are interrelated and they constitute a collaborative innovation network. According to the case study, there are in excess of 200 subjects in the innovation network, and synergistic connections are in place among those subjects. Based on interviews and surveys, we drew an evolutionary structure sketch. The collaborative innovation network of Chengdu High-Tech Zone and the University preserves innovation and vitality. Enterprises in the network constantly acquire resources by establishing connections. The link density and the survival rate of new enterprises in the network are high. From this case, resource priority theory is shown to have a direct influence on the direction of network evolution.

4. Model

Scholars have become increasingly aware of the systematicness and complexity of the networks. To determine the characteristics of a cooperative innovation network, they have started using a system dynamics method, complex network theory, and social network analysis methods to further explore the mechanism of innovation networks [39]. In 1999, Barabasi and Albert were the first to propose a classic BA scale-free network model [40]. This made the generation and evolution of complex networks a popular topic. The most important contribution of the BA model is the proposal of two critical evolutionary mechanisms, the growth of the network, and the preferential connection. The fitness model [41] and the local-world evolving network model [42] have been subsequently introduced.

4.1. Model Establishment

The process of network evolution changes as enterprises pursue resources. The state of resources affects the process. Different network structures have different resource transfer methods and efficiencies, so the resource states are also different [43]. In essence, the evolution of the innovation network consists of the dynamic changes to the relationship configuration of its resource, which is the evolution of the resource structure. The existing evolutionary models mostly focus on the node degree of the target, which is an evolutionary method of establishing the degree-priority. However, the complexity of innovation networks occurs because different networks have different characteristics. Besides, the connection is mainly premised on permanent or long-term relationships. This appears to be contradictory to the characteristics of a collaborative innovation network. The connections between the subjects of a collaborative innovation network do not exist for a long time. It is a short-term cooperative form that is established at a certain period of time for the purpose of obtaining common interests and mutual resources. Once the cooperation is over, the connection is dissolved. Subjects can choose to cooperate again at the next appropriate time. This is a periodical cooperation.
Thus, we established an optimal connection mechanism on the basis of innovative resources, distinct from the BA network evolution model and others. In a collaborative innovation network, the resource types and the resource ownership of the network subjects are different, as is their network status. When a new enterprise chooses to enter into cooperation, it needs to preferentially choose an enterprise from the existing network. Therefore, a significant feature of the evolution of collaborative innovation networks is optimal connection. Here, “Optimal” means that the amount of resources is considered. In general, when seeking partners, the enterprise prioritizes those with a large amount of resources to compensate for the resources that are required for its innovation.
Based on the existing research and a real network environment, we established a simulation model following two rules.

4.1.1. Resource-Priority Rule

For enterprise i in the market, where i = 1, 2, …, Nt, Nt is the total number of enterprises owned by the market in period t.
Define a cooperation impetus i with the other non-cooperative enterprise j:
m i j = k = 1 k t N R j k i + k = 1 k t N R j k i / z .
where N R j k i represents the amount of kth resource that enterprise i does not have, but enterprise j has; and, N R j k i denotes the amount of kth resource that both enterprise i and j have. As both of them have different attraction degrees with respect to the enterprise, the second will be discounted, i.e., divided by a number z greater than 1.
According to impetus m i j , which is the probability that enterprise i selects c enterprises that are most willing to cooperate in the market, that is j 1 , , j c , the probability P i j l to cooperate with the lth enterprise j l is defined as
P i j l = ( 1 / c ) ( c l ) .
Except for the c enterprises, the probability that enterprise i is willing to cooperate is 0.
Similarly, there are c enterprises with which enterprise j l is willing to cooperate. Assume that the order of i is listed as m. The probability P j l i that enterprise j l is willing to cooperate with enterprise i is defined as
P j l i = ( 1 / c ) ( c m ) .
If enterprise i is not among the c enterprises with which enterprise j l is most willing to cooperate, then P j l i = 0 .

4.1.2. Resource Growth Rule

The resource growth rule refers to the constant consolidation and optimization of the collaborative innovation network by increasing the network nodes or establishing connection relationships on the basis of the initial network. An increase in network nodes means that new enterprises choose to join the network to acquire more resources and add new resources to the network.
In the market, the absorption capacity of all enterprises is first normalized, and the normalized absorption capacity N b i of all the enterprises is
N b i = b i max { b 1 , , b N t } .
If enterprises i and j cooperate, then enterprise i can absorb the amount q i j k of the kth resource from enterprise j in each period: q i j k = q j k 0 N b i r c , where q j k 0 indicates the amount of the kth resource enterprise j owns in the initial stage of cooperation, and the conversion rate r c = 0.8 / y i j .
If a certain resource k of enterprise i is not absorbed from any cooperative enterprise, then it will grow itself, and the growth result is q i k t : q i k t = q i k t ( 1 + ω s ) , where q i k t refers to the amount of the k′th resource of enterprise i in period t, and the efficiency of learning the resource is ω s .

4.2. Basic Assumptions

A collaborative innovation network is characterized by its complexity and dynamics. Therefore, enterprise innovation faces not only high opportunity costs and potential market risks, but also various other uncertain factors, such as leaders, R&D, organizational form, policy environment, and complementary resources. We regarded the innovation network as a complex adaptive system and established a multi-subject simulation model for innovative network evolution. The network evolution is manifested as the change in the enterprise nodes and the inter-enterprise connection. To facilitate the setting of the simulation model, we neither subdivided the nature of the network connection, nor considered the strength of the network connection. Therefore, in the simulation model, the internode connection defaults to a two-way connection with a unit length and intensity of 1. In this study, Python software was used to simulate the different government behaviors, and their influence on the evolution of collaborative innovation networks was studied.
As the builders of innovation environments, local governments influence the collaboration of enterprises. Lihua stated that the role of local governments is indispensable in cluster upgrading and cluster innovation [44]. Local governments ought to play the roles as public managers, facilitators, as well as intermediaries [45]. They are also required to be proactive in taking participation in cluster innovation activities by formulating innovative policies, optimizing the innovation environment, and addressing any market failures in the innovation process [46,47]. In a government–university collaborative network, such as One School and One Belt, the role of government in the evolution of the innovation network structure cannot be ignored. With government support in finance, policy, and environmental areas, knowledge and information can be interconnected in the innovation network.
The government places its focus of existing research on exploring the role of innovation policy. From this perspective, the government mainly aims to effectively stimulate and drive enterprises toward independent innovation. Stevenson and Lundstrom claimed that government formulated entrepreneurial policy to encourage the creation and growth of new entreprises with the aim of promoting innovation [48]. The government shall first ensure the vitality of the entire innovation network to sustain output. Therefore, not all enterprises will be able to receive support. Here, government behavior is of a particular importance. Selection is concentrated on supporting enterprises with limited resources or those that recently entered into the network. It represents a realistic management proposition, and existing studies demonstrate that less research has been conducted into this problem. We considered different government behaviors as the experimental objects in the resource-priority simulation model.

4.3. Simulation Steps

As each stage of the enterprise requires different networks [49], the government plays an essential role in the early stage of network development. However, during the advanced stage, government involvement gradually declines, while industry associations play a major role [50]. Therefore, we considered the changes to innovation behavior in the initial and mature stages.
Step 1. It is assumed that the initial market is empty and the parameters are set, as follows. Assume the types of resources (including a series of innovative resources such as human resources, information, knowledge, and technology) k 0 = 20 in the initial stage of the innovation network.
As the innovation resources will not be static with the development of science and technology, the types of resources continue to increase, assuming that each period of resources increases by one probability, r s = 0.5 .
It is assumed that the number of enterprises in the initial network n 0 = 30 and the total number of simulations T = 100 . It is assumed that the proportion of the initial period r = 0.3 , according to the theory of technological innovation diffusion curve.
As the newly entered enterprise will have a tendency to connect with the network subject, for nt enterprises that enter the market, each one will have 1–3 resources. The initial ownership of each resource is subject to the mean value μ 0 ( 1 + ω ) t , and the mean and variance of the initial possession of each resource are μ 0 = 1 and σ 2 = 0.2 , respectively.
The initial resource mean value increases with time, ω = 0.2 .
Recently entered enterprises attempt to establish contact with those that are generally rich in resources, but these rich enterprises are not necessarily willing to cooperate with the new ones. Assume that the number of enterprises with which each resource-rich enterprise is willing to cooperate is c = 5 each time. For enterprises, there are two motivations for cooperation: the object has more resources than it does and the object has resources that it does not. The resources that correspond to these two motivations are dissimilar, and the latter should be more significant. Therefore, it is assumed that the discount of the first resource relative to the second resource is z = 2.
At maturity, government support is weaker than during the initial period. Assume that the initial period s 1 = 0.3 , the mature period s 2 = 0.1 , and resource learning efficiency ω s = 0.1 .
The types of government support objects are indicated by f (variable: Policy 1 indicates support for newly entered enterprises, policy 2 indicates support for enterprises with less resources, and policy 3 indicates random support).
Step 2. For a certain period t ( t = 0 , 1 , , T ) , determine the following. If t = 0 , the number of enterprises that are expected to enter the market, ( n t ) is n 0 . Since universities in the early-stage period provide more scientific and technological resources, more enterprises are developing than in the maturity period.
Therefore, if 1 t < T r (initial period), the number of enterprises entering the market ( n t ) is a random number between 6 and 10.
If T r t T (mature period), the number of enterprises that are entering the market ( n t ) is a random number between 1 and 5.
The absorptive capacity of the newly entered enterprises bi is directly proportional to the total amount of resources that are initially owned. To facilitate calculation, it is assumed that the absorptive capacity remains unchanged with time. This hypothesis does not affect the nature of evolution. Add nt enterprises to the market.
Step 3. Establish cooperation using Equations (1)–(3). Subsequently, according to the type f of government support, choose the supporting enterprises. If f = 1 , support ( n t ) enterprises entering the market in the current period. If f = 2 , support enterprises with the lowest 20% of the total resources in the market at that time. If f = 3 , randomly select 20% of the enterprises whose total resources are not in the top 20% to support.
If enterprise i is supported by the government, then the probability P i j l of establishing a cooperative relationship between enterprise i and enterprise j l is defined as P i j l = P j l i = ( P i j l + P j l i + s ) / 2 where s is the government’s support. If 1 t < T r (initial period), s = s 1 . If T r t T (mature period), s = s 2 . If P i j l > 1 , P i j l = 1 .
Based on this probability, whether the two enterprises cooperate is determined. If cooperation occurs, then the cooperation time y i j l is a random number between 2 and 5.
Step 4. Have cooperative enterprises interact using Equation (4).
Step 5. After setting the parameters in Step 1, repeat Steps 2–4 if per cycle t = t + 1, until t = T.

5. Simulation Results and Discussion

According to the network evolution model that is proposed in this paper, simulation experiments were conducted with different government behaviors. The results are described in the following five subsections.

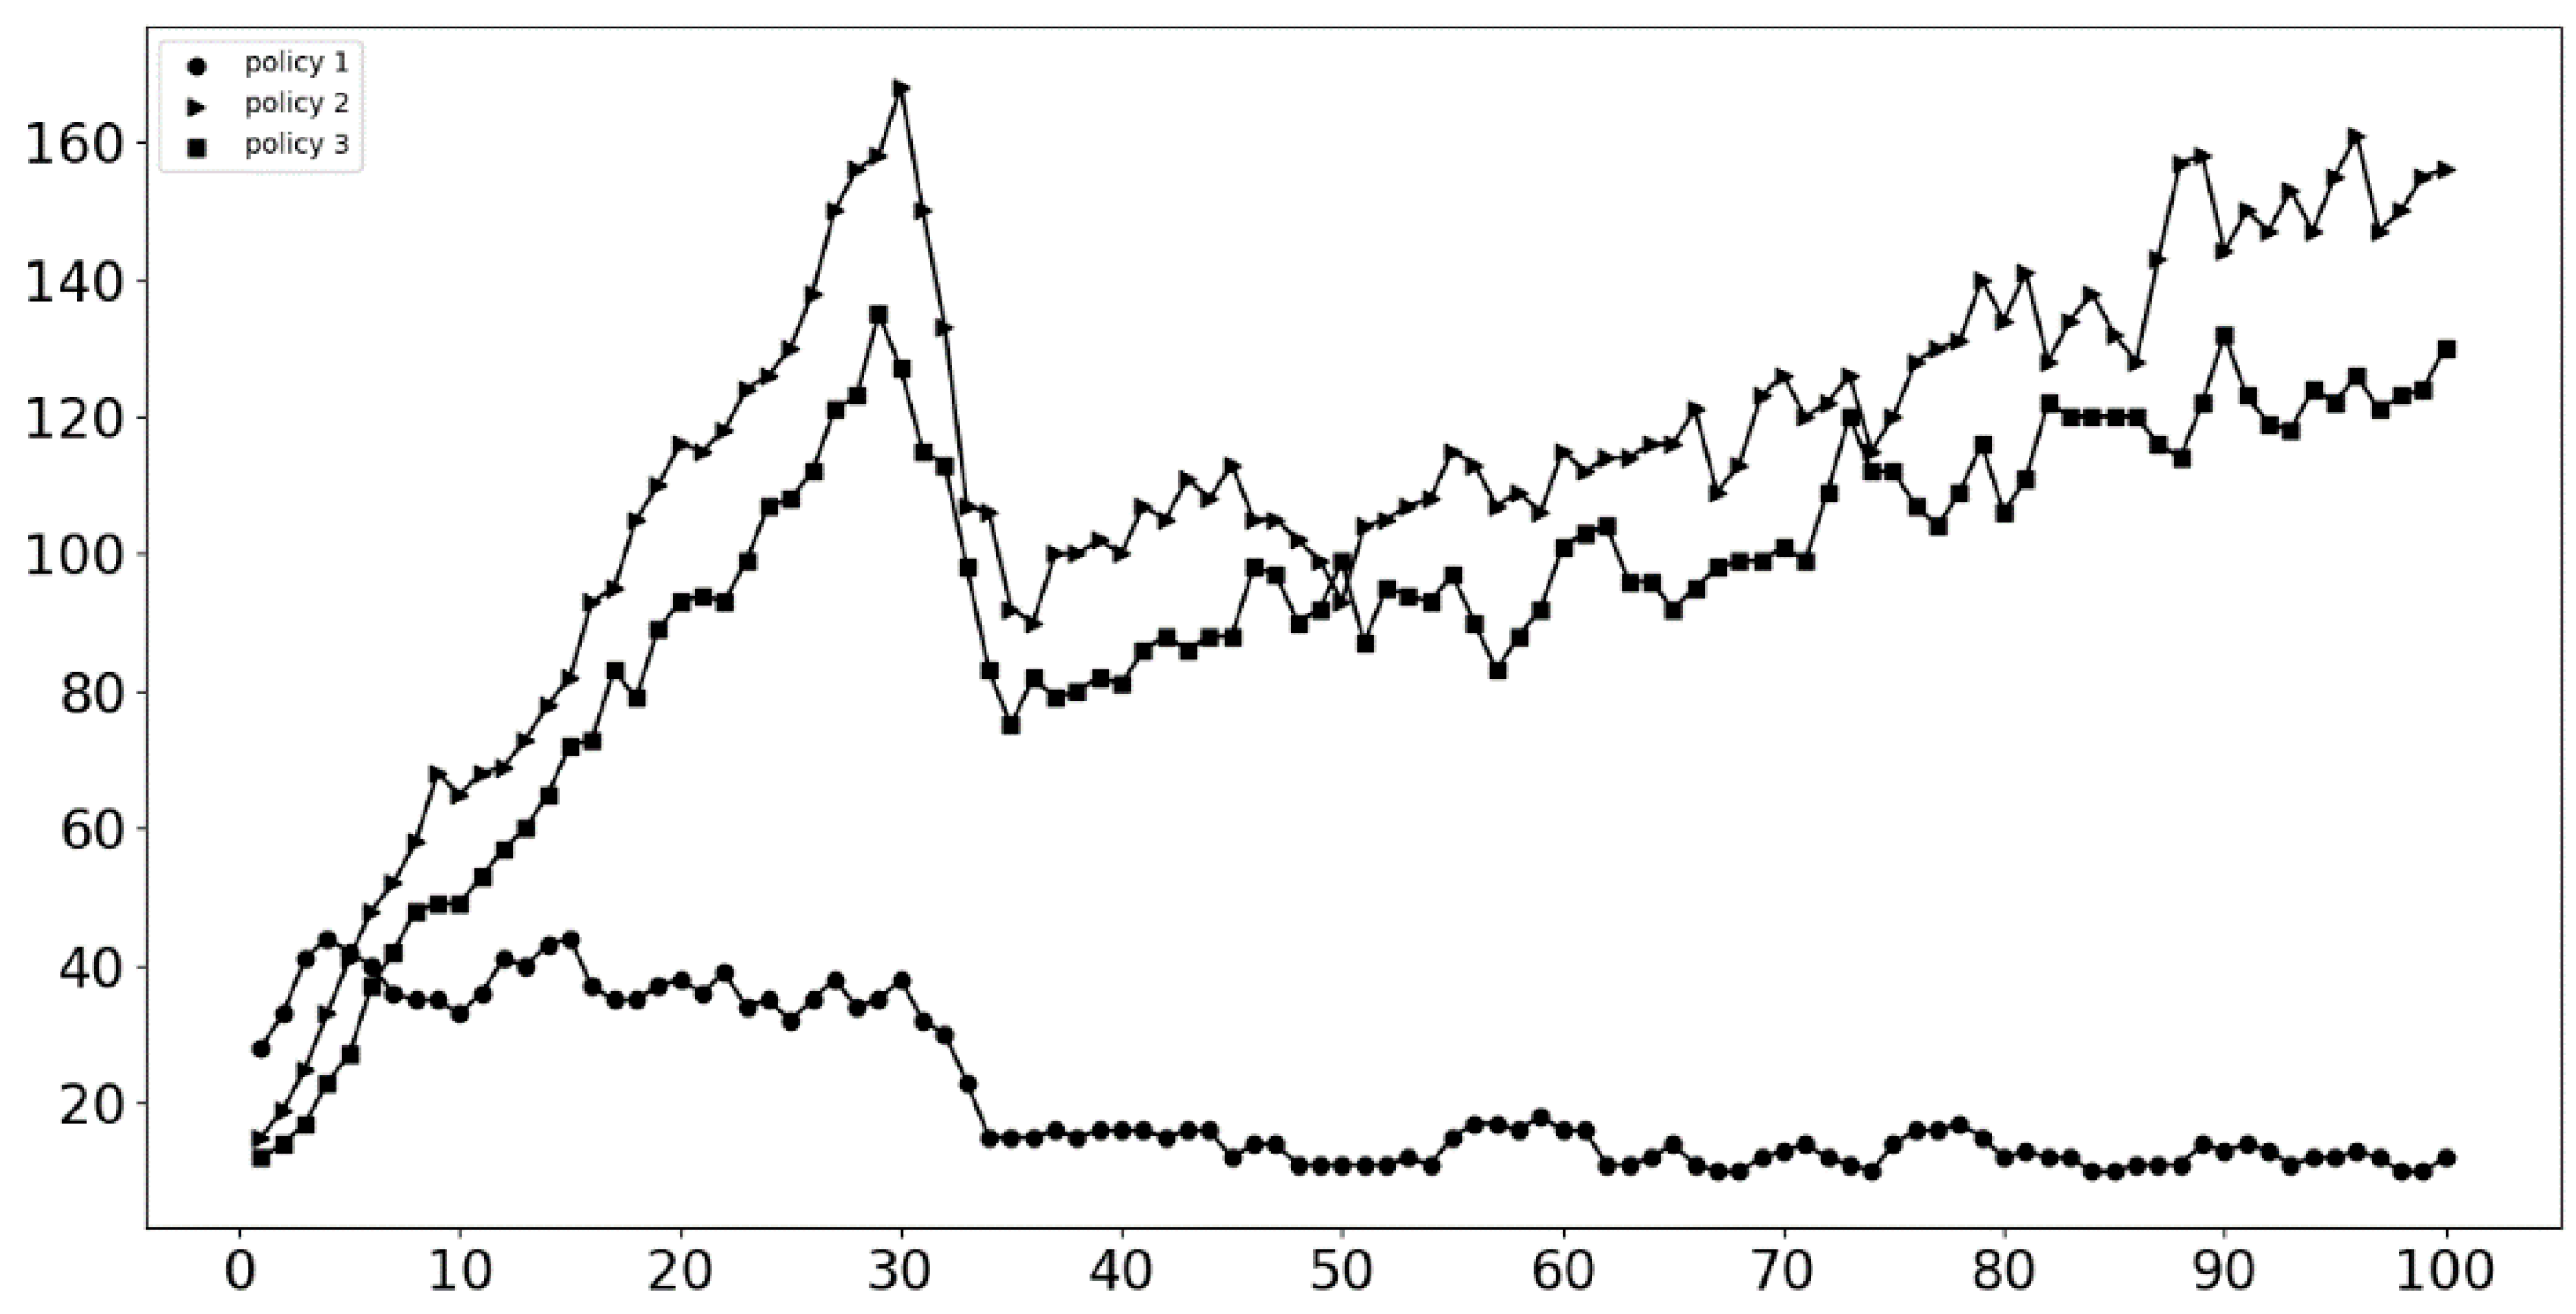
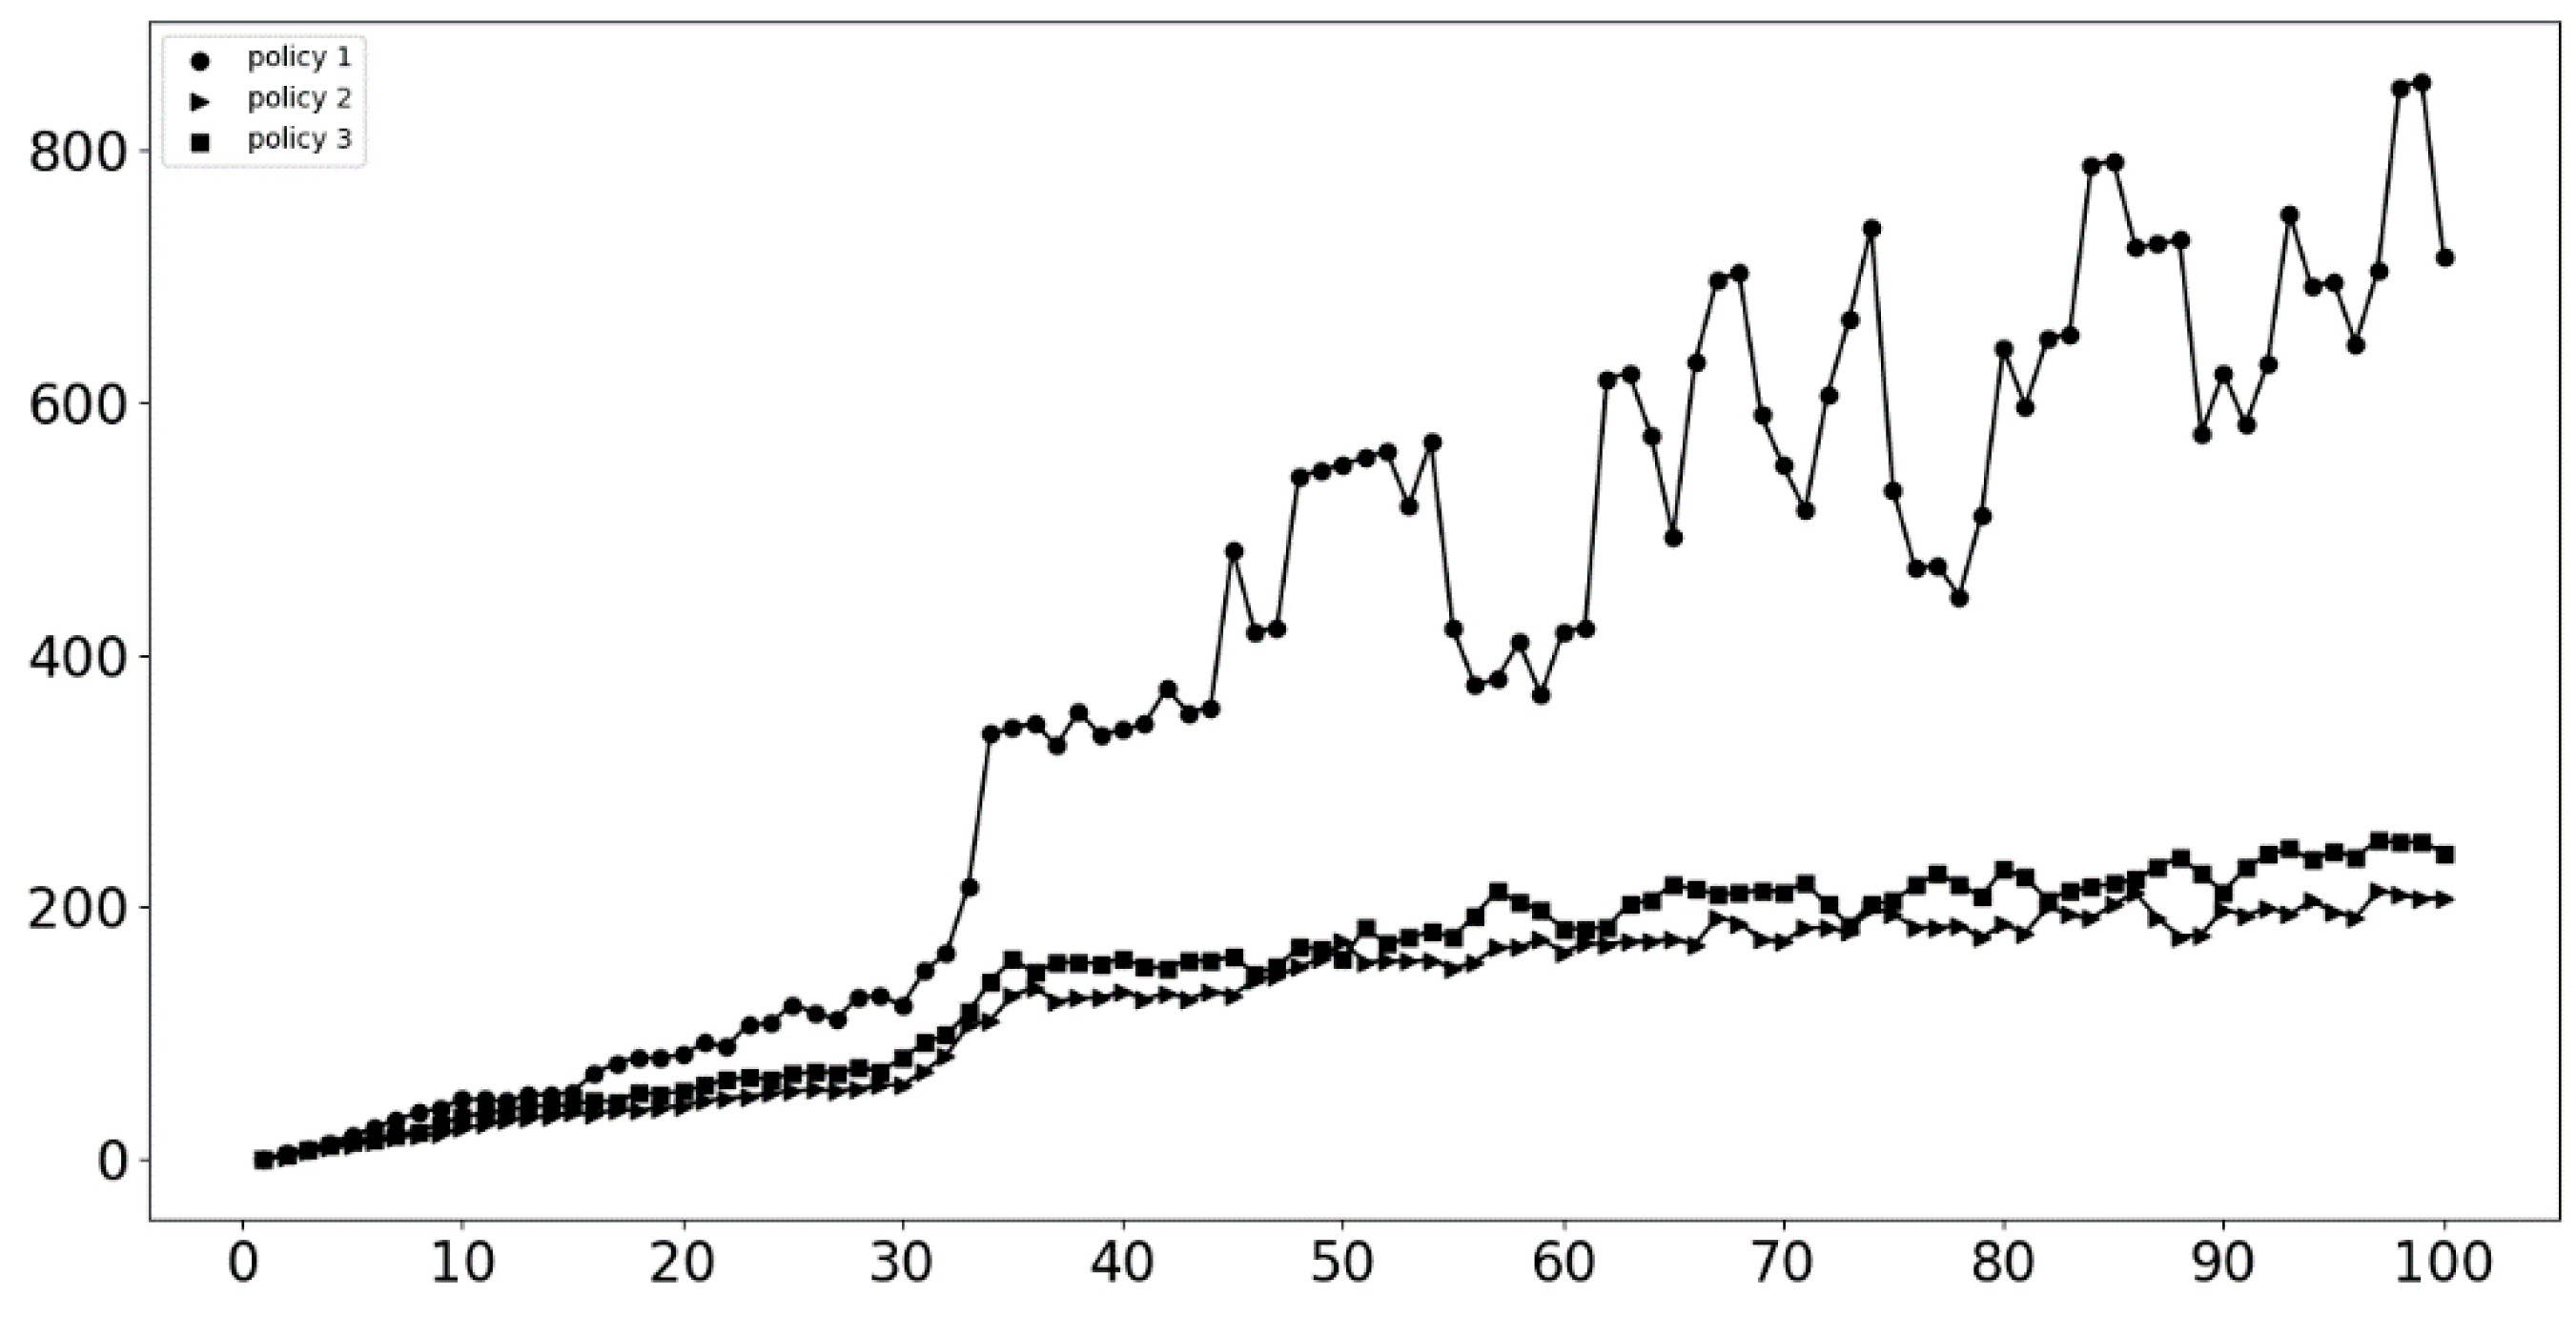
5.1. Changes in the Number of Innovative Network Enterprises

Figure 2 shows the changes to the number of innovative network enterprises. The following can be seen from the simulation results. (1) Under the three policies, the change to the number of enterprises shows some variations between the initial and mature stages. The initial and mature stages of policies 2 and 3 both increase, while the growth rates vary. This illustrates that the change in government support exerts large impact on the initial and mature stages. The rate of enterprises entering the network decreases due to the reduction in support intensity. With the growth of the network, the number of enterprises gradually increases. However, the entry rate of the two policies is consistent, which illustrates that only an insignificant difference exists between them in reality. When the number of enterprises infinitely increases, a large network forms. Oligopolistic enterprises are then inevitably generated due to constant resources, and such an environment is not necessarily conducive to the development of emerging enterprises. (2) Under policy 1, the number of enterprises in the initial stage and the mature stage is broadly consistent. This indicates that, with the continuous entry of enterprises, the scale of the cooperation network remains the same and the enterprises are constantly updated. Enterprises are constant to collaborate periodically to produce innovation. The dynamic network is more beneficial and more conducive in maintaining innovation vitality.

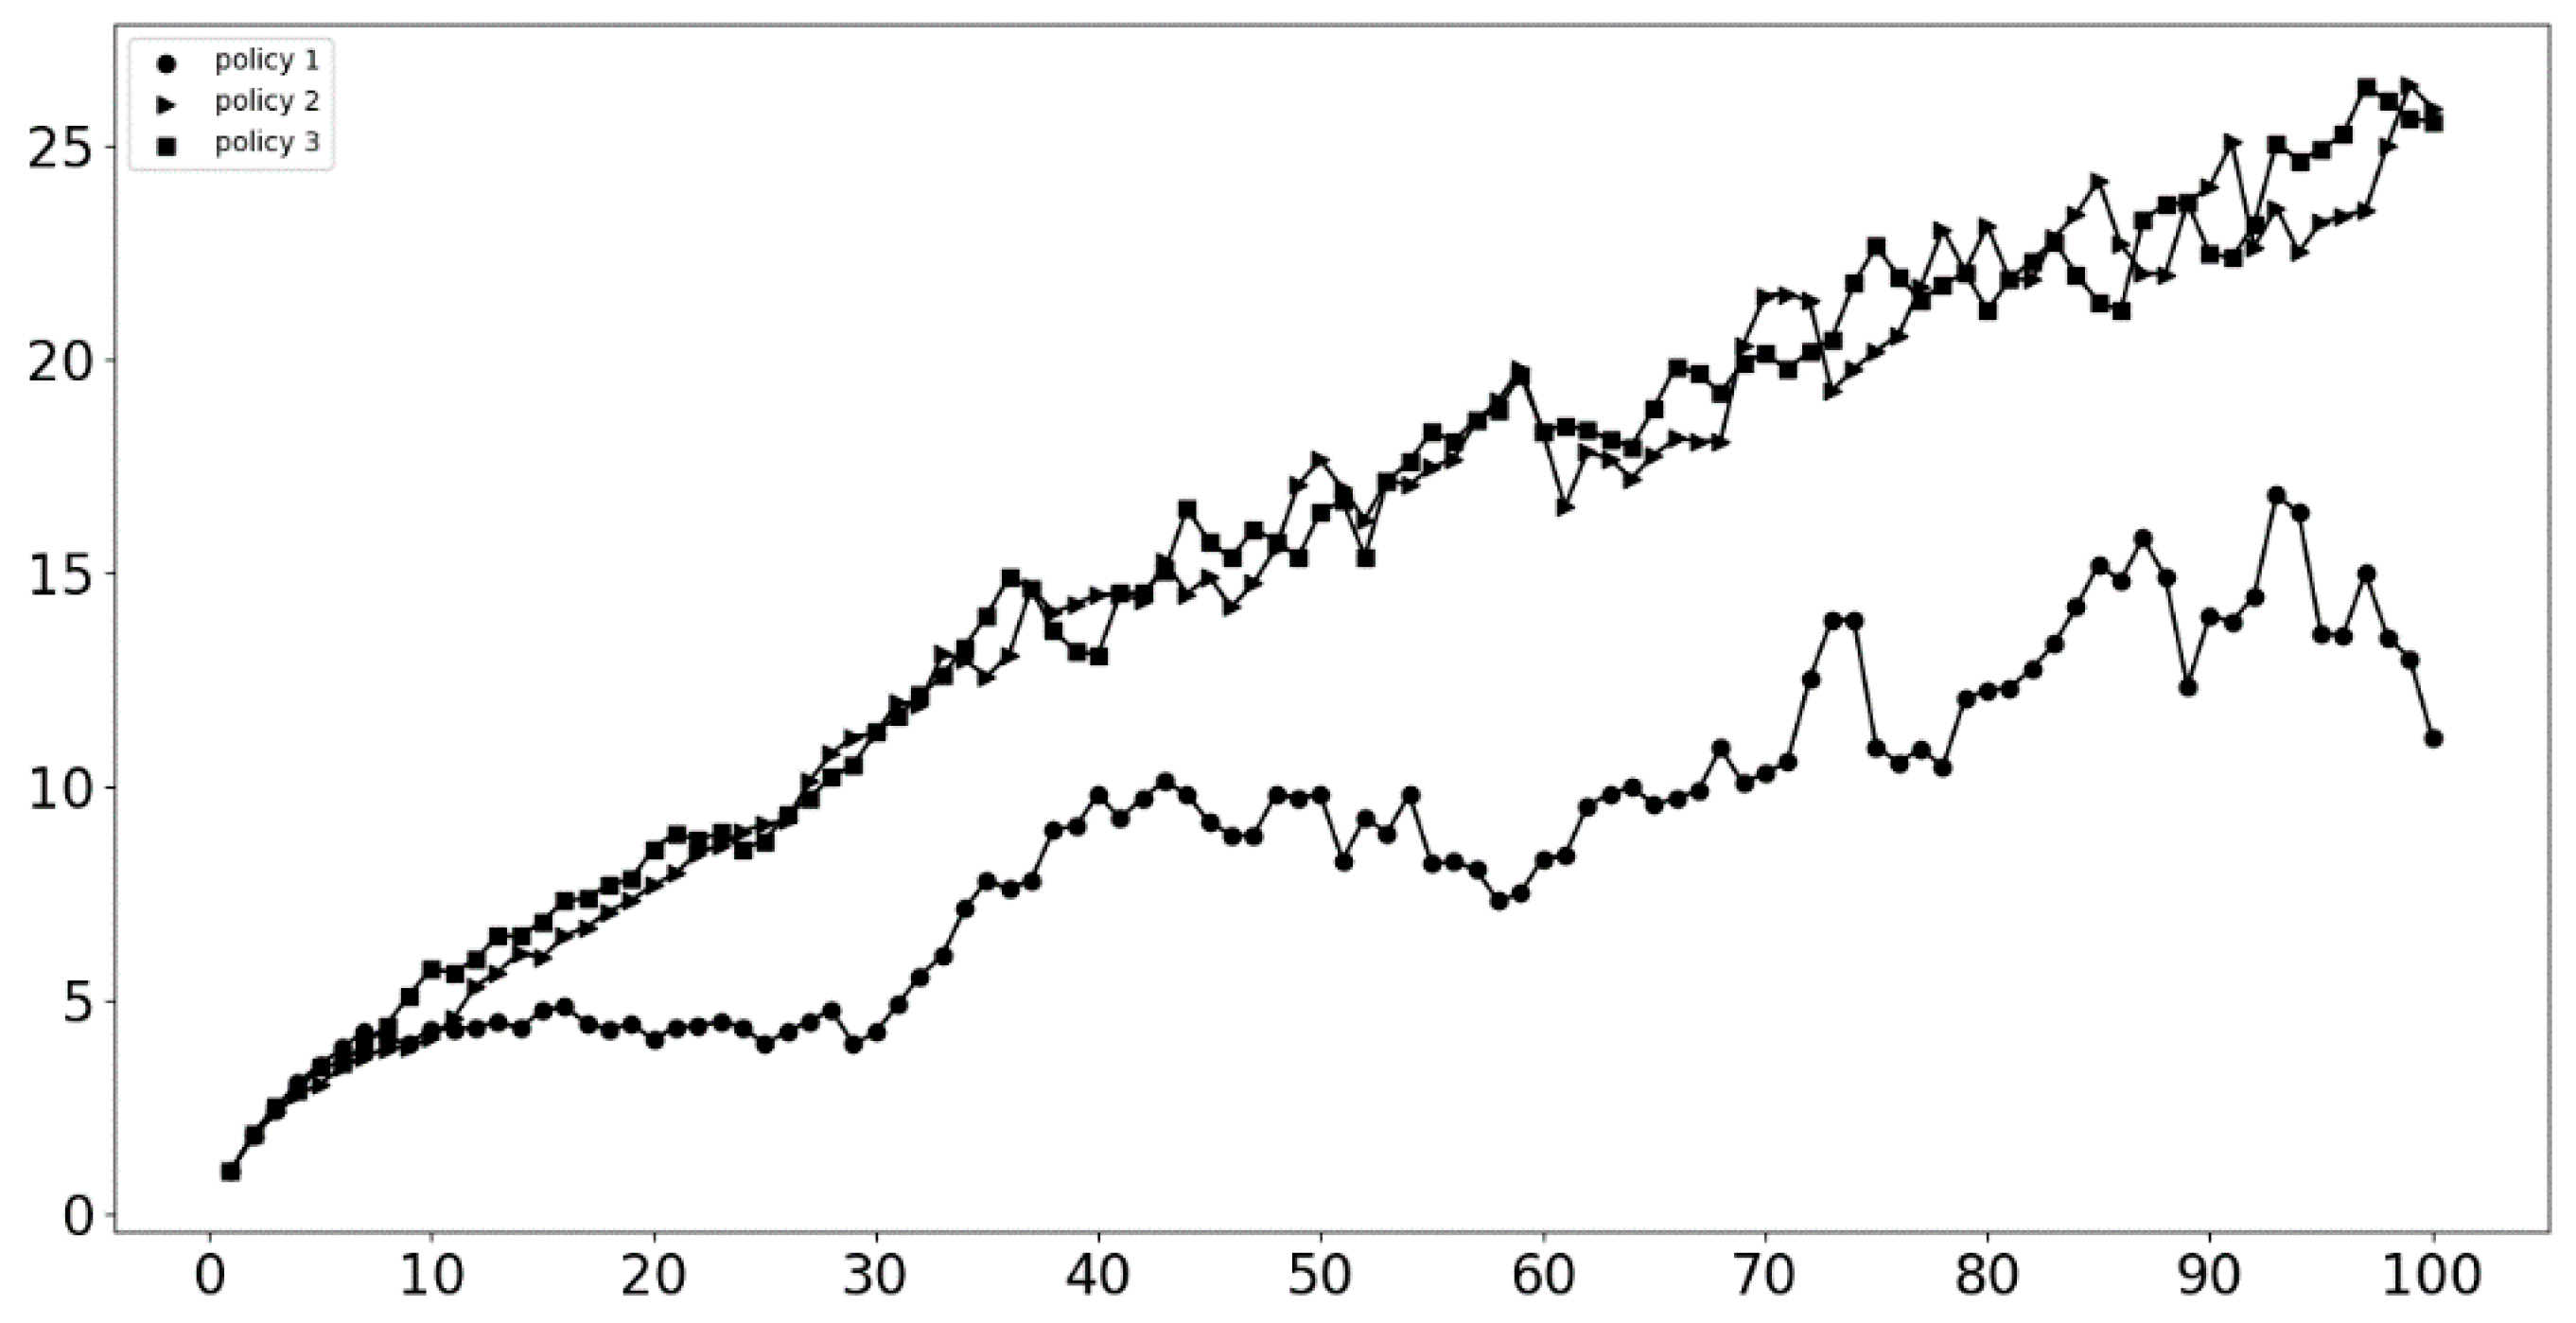
5.2. Innovation Network Average Transformation

Figure 3 shows the innovation network average transformation. The following can be seen from the simulation results: (1) Policies 2 and 3 show a downward trend. Both stabilize at a low value after entering the mature period. This suggests that, after entering the maturity period, the cooperative networks corresponding to these two policies are large in scale, but the cooperation is not dense. There are plenty of enterprises in the network, but there is little cooperation or only some cooperation among several large enterprises. (2) The policy 1 average oscillates, and the peak in the maturity period is higher than that of the other two policies, indicating that new enterprises are constantly entering the cooperative network. When they first enter the network, they will decrease the network average. However, the network resources will facilitate the growth of these enterprises, for which the average network will rise. At the end of the cooperation period, the cooperation discontinues. New enterprises then enter, and so on. With the support of the government, different enterprises innovate through network resources and achieve self-growth. Such an innovative environment is conducive to the advancement of high-tech industries and the development of emerging enterprises.

5.3. Innovation Network Historical Average Transformation

Figure 4 shows the innovation network historical average transformation. The following can be seen from the simulation results. (1) The histories of policies 2 and 3 exhibit a slow growth trend, on average, remaining broadly unchanged after the maturity period. This also indicates that, although the collaborative innovation network is large in scale, the cooperation density between the entities is low. (2) The historical average of policy 1 rapidly grows, especially after the maturity period. After the government’s support is reduced, a large historical average growth occurs. This shows that, under this policy, when government support is reduced, the vitality of network innovation continues to be maintained, and a high cooperation density exists among the subjects. The result of this experiment is similar to the average transformation in Section 5.2.

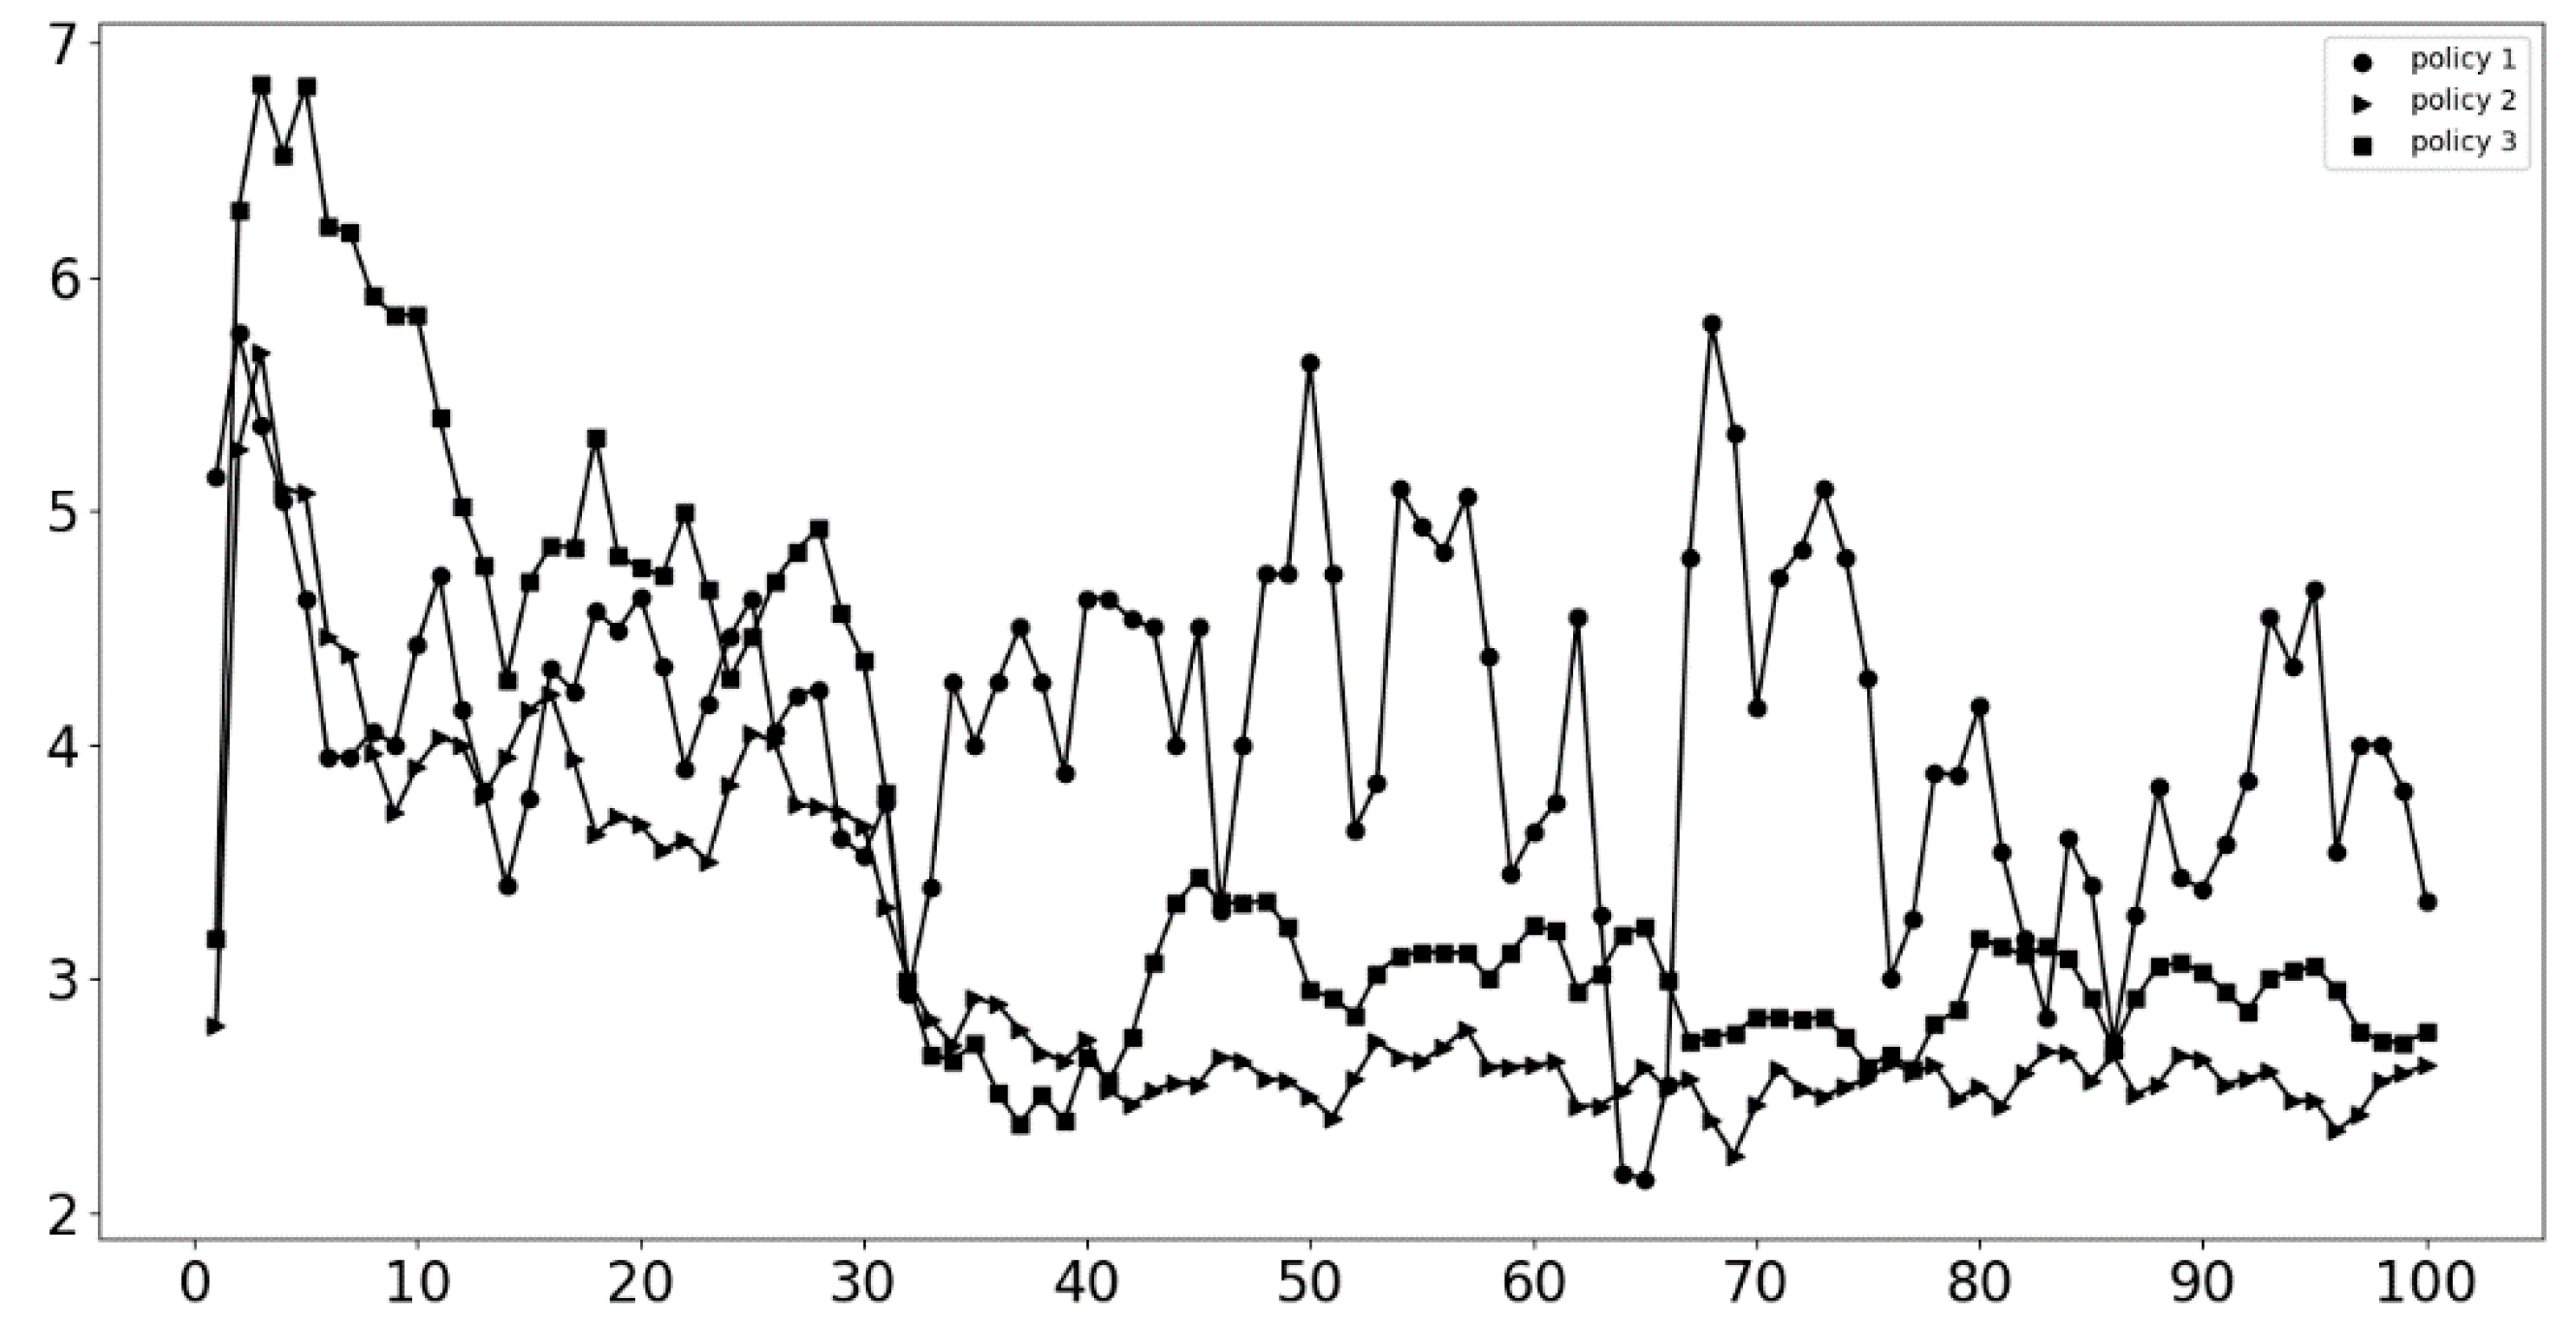
5.4. Innovation Network Average Age Change

Figure 5 shows the change in innovation network average age. The following can be seen from the simulation results: (1) For policies 2 and 3, the life span for the existing enterprises in the network is constantly on the increase, for which they continuously absorb network resources and the ones of new enterprises. Inevitably, this leads to an oligopoly. (2) For policy 1, the average age of enterprises in the network is lower and the growth rate is lower. This illustrates that enterprises in the network are relatively young. This does not indicate a short life span for enterprises. Instead, it signifies that the enterprises do not occupy an important position in the network all the time. This result illustrates that the update speed is faster than that of the other two policies.

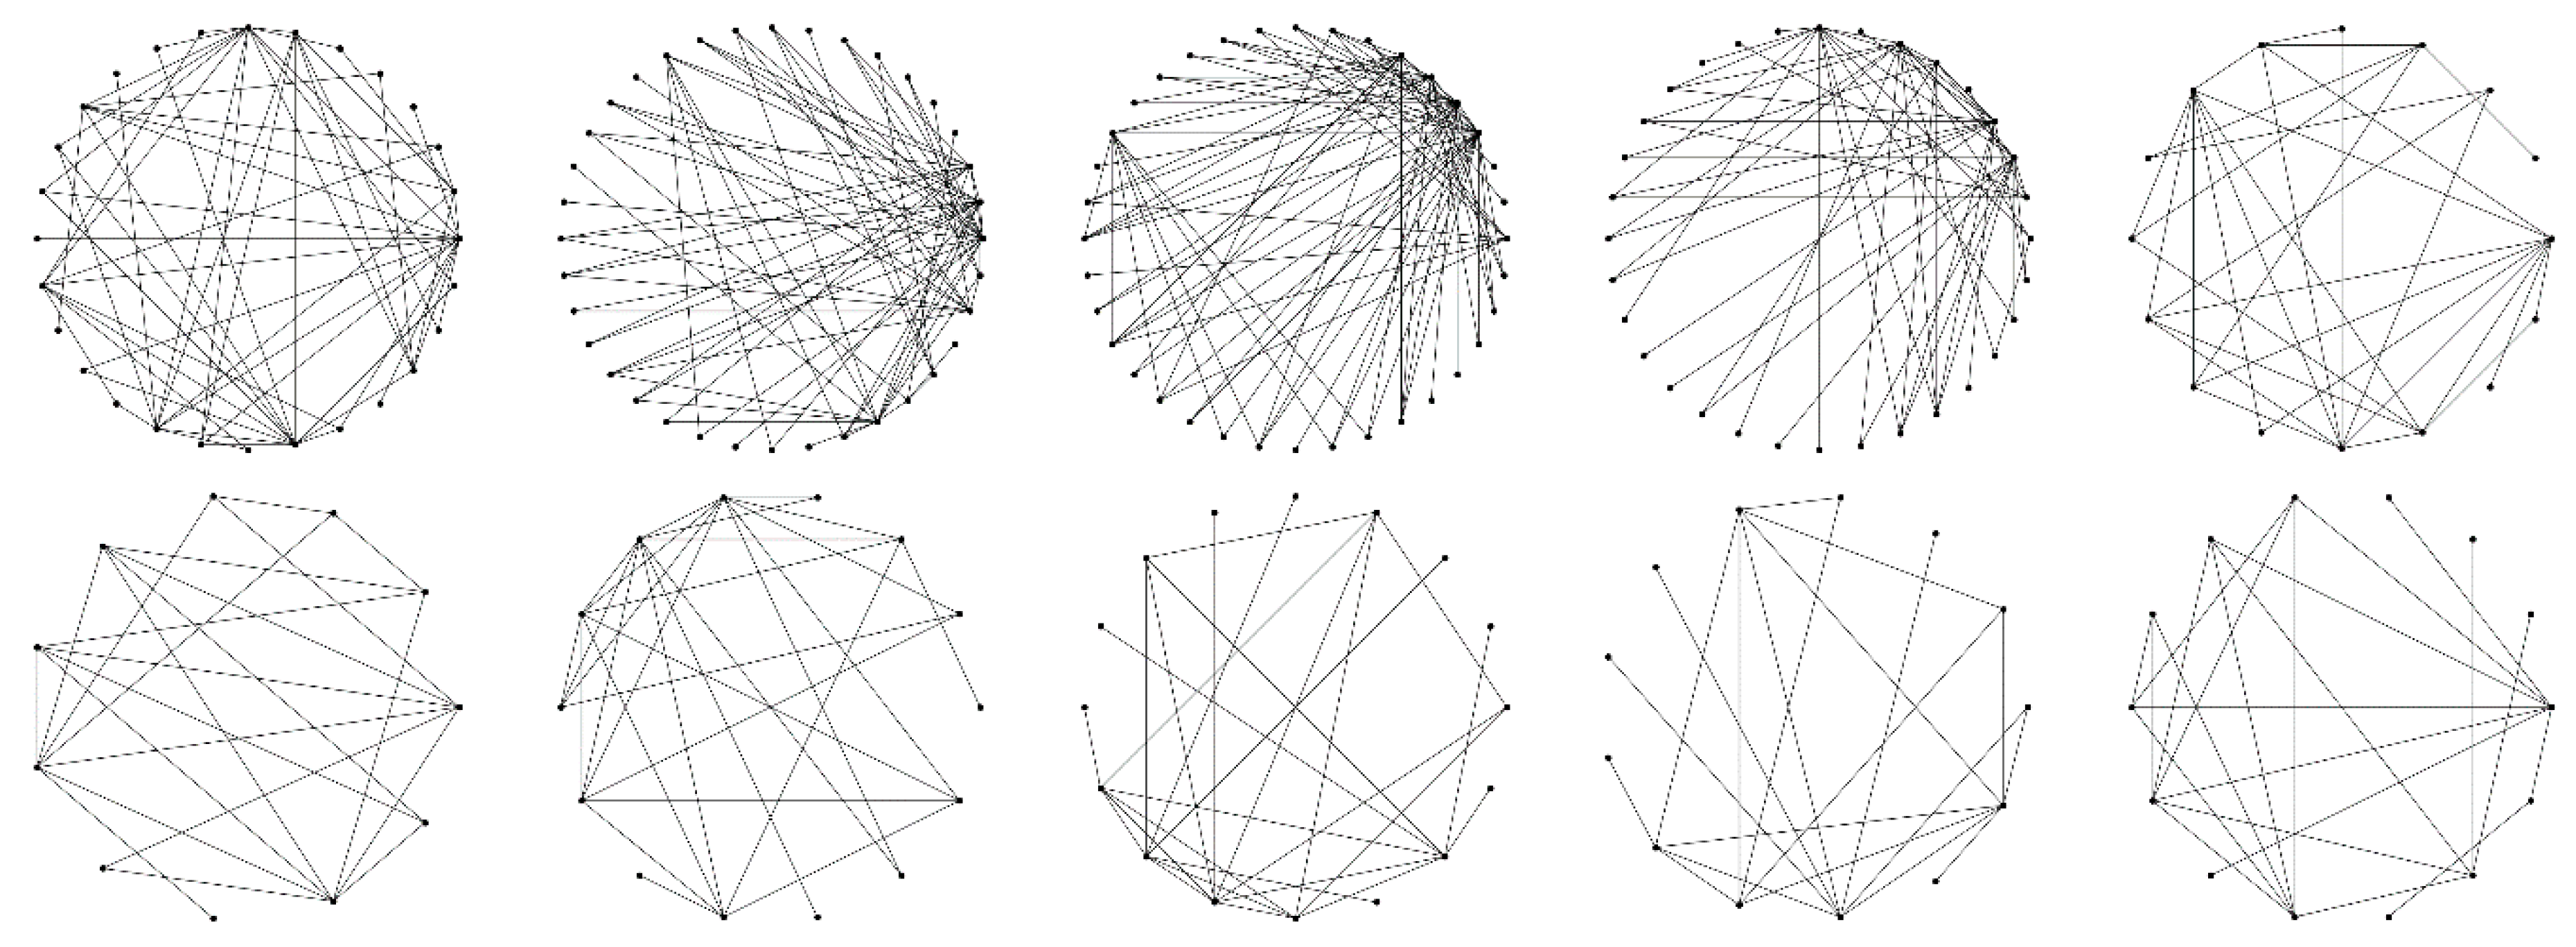
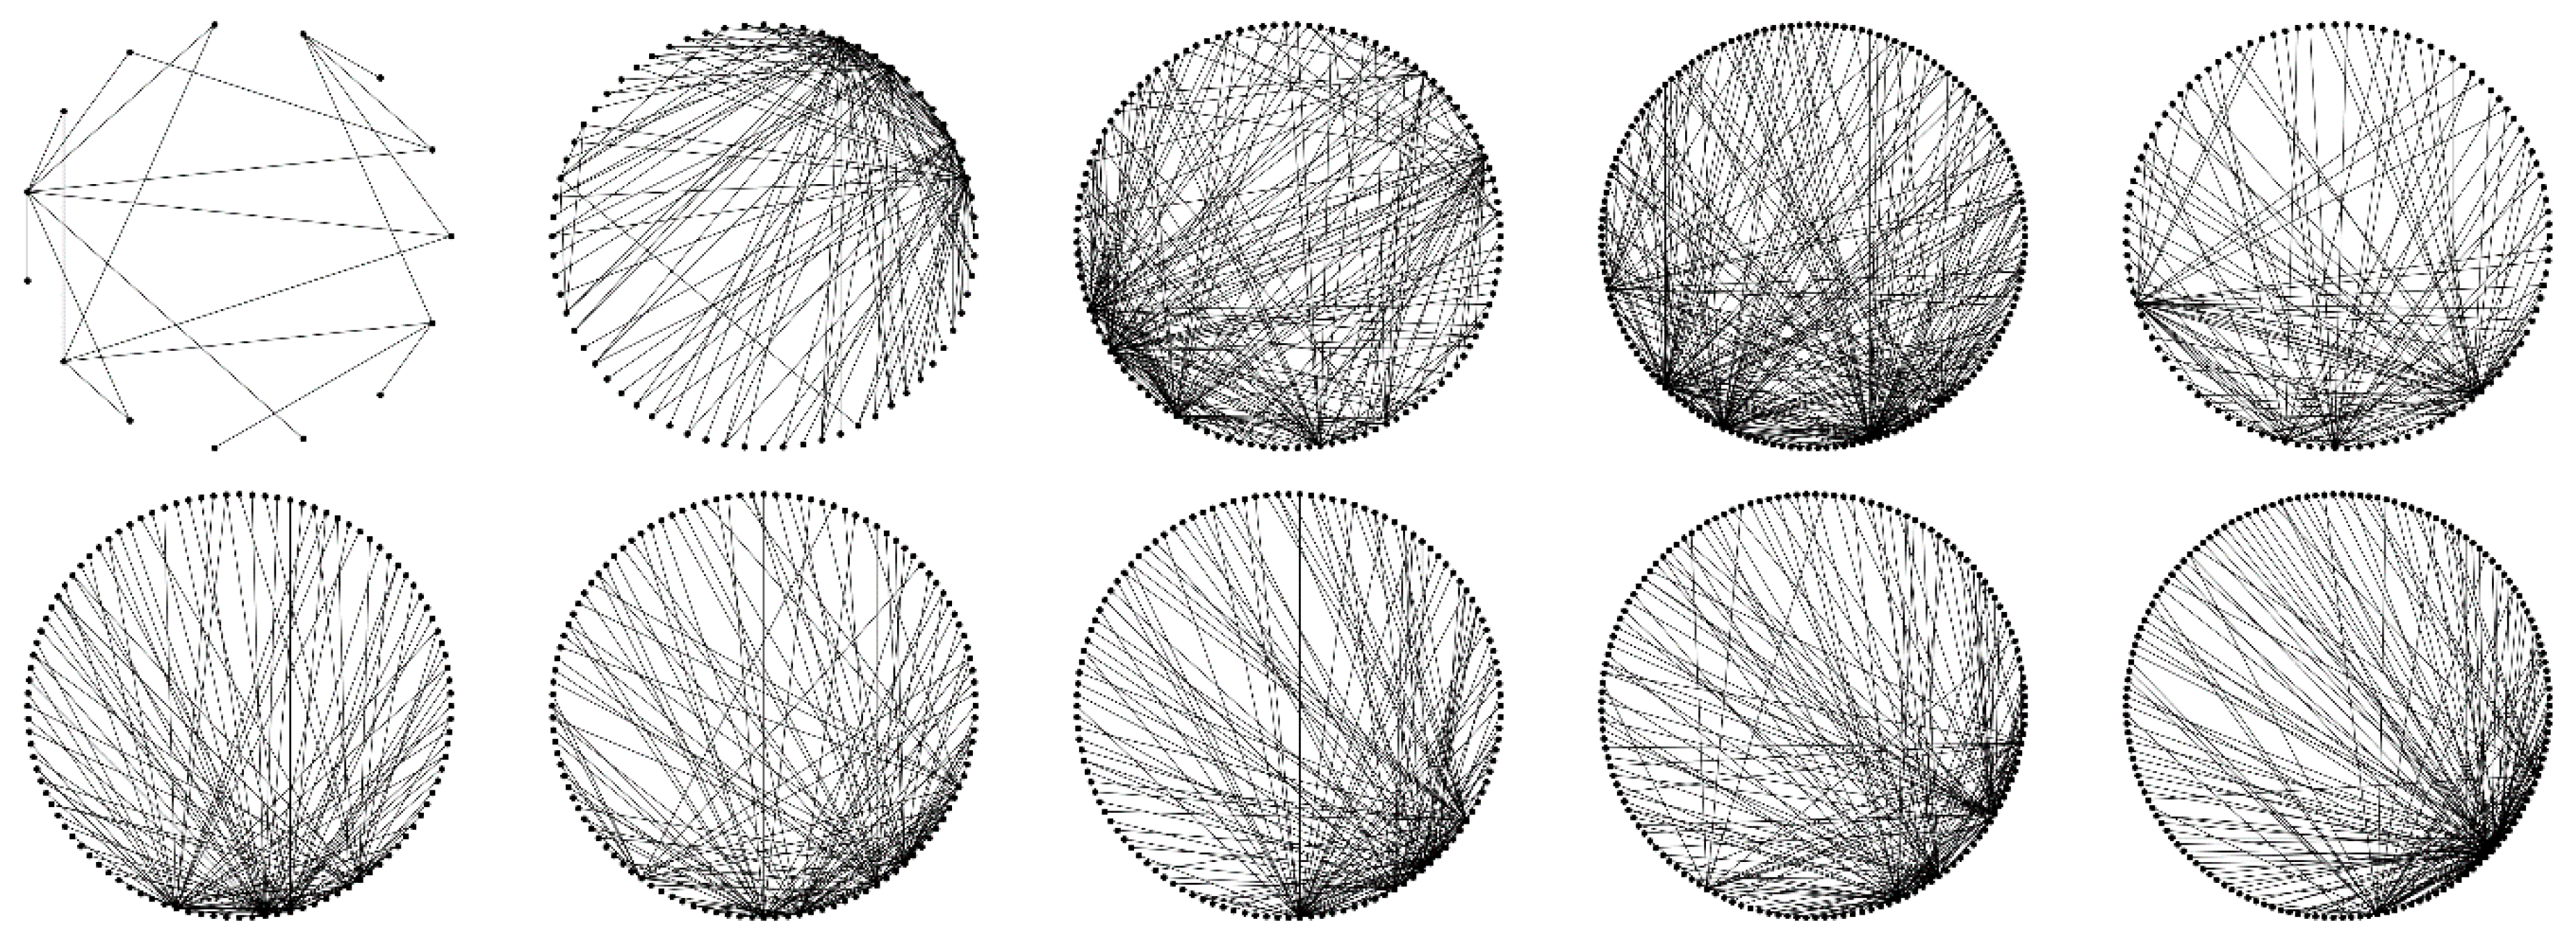
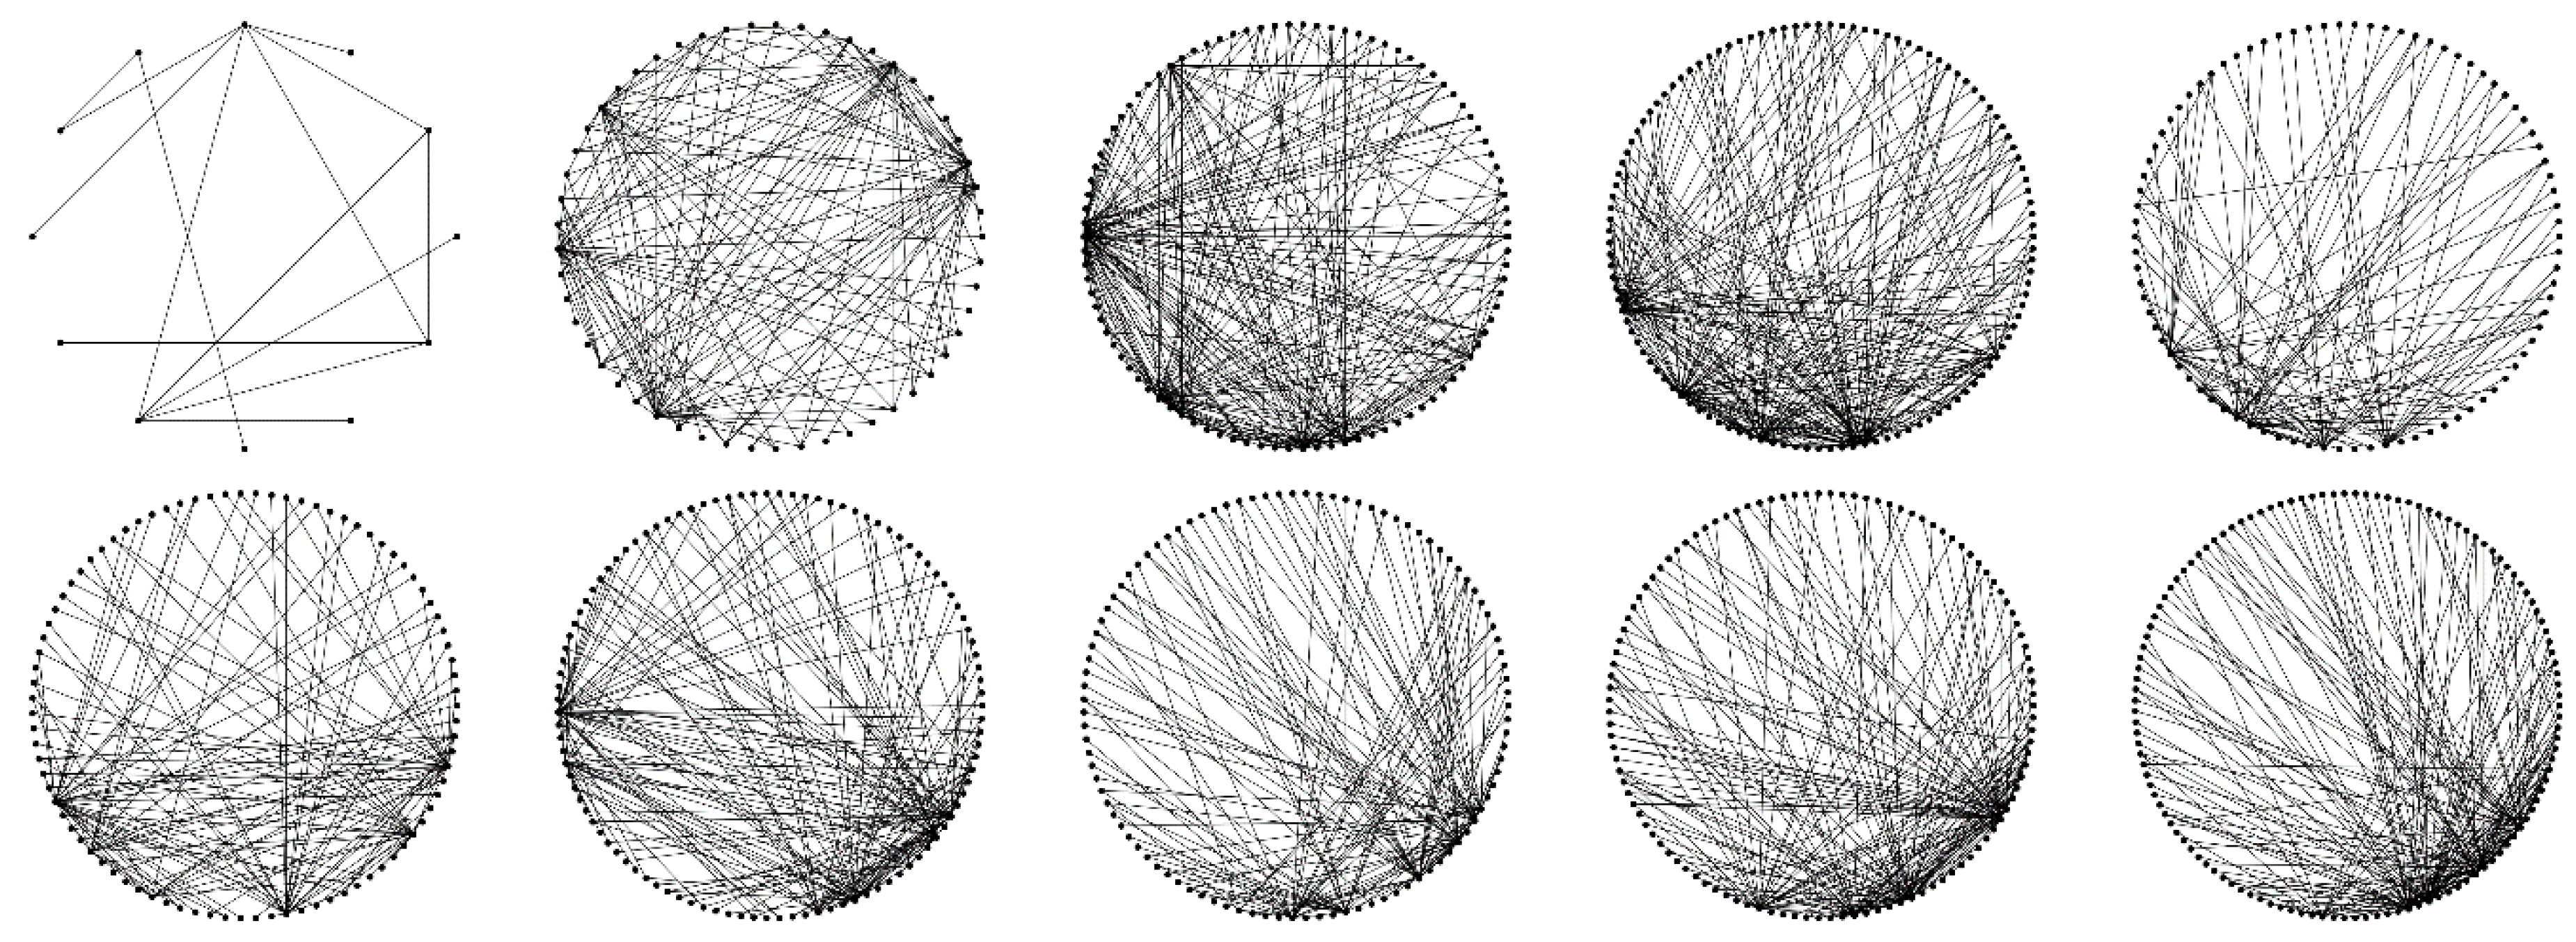
5.5. Evolution of the Innovation Network

We conducted point-to-point experiments with network connections, and the results are presented in 10 periods under the three policies. Figure 6, Figure 7 and Figure 8 each present the connection changes from policies 1 to 3, respectively.
The results of the collaborative innovation network evolution process could demonstrate the following: (1) Under policies 2 and 3, many enterprises exist in the network and the network has a relatively rich link density. However, it is primarily concentrated in several resource-rich enterprises. This environment is not conducive to the development of those small-and-medium-sized enterprises (SMEs), which further illustrates the emergence of oligopolistic enterprises. This state will gradually homogenize the resources in the network. The resources of SMEs will be used, so they gradually lose their value and are eventually eliminated. (2) Under policy 1, the links between various entities in the network are relatively uniform, and a certain proportion of cooperative relationships is preserved for a long time, which is conducive to collaborative innovation within the network. With the continuous entry and exit of enterprises, the innovation vitality within the network is constantly maintained. With the continuous absorption of resources inside and outside the network by the enterprises, the objective of collaborative innovation is achieved.

6. Conclusions

In the process of network evolution, universities integrate with governments, enterprises with universities, enterprises with governments, and internal enterprises with external leading enterprises. Meanwhile, latecomers all gradually merge to build up a collaborative innovation network. We proposed three important characteristics of collaborative innovation networks, including knowledge transfer, policy environment, and periodic cooperation through a literature review. Based on network theory and the network evolution method, a resource-priority simulation model was established based on the analysis of evolution motivation. We chose the “One School and One Belt” action plan as an exploratory case for study, and then examined the resource-priority mechanism and the role of government in the evolution. This model uses resource acquisition as the driving force of network evolution, which aligns with the realistic environment. The government and universities have advantages in innovation resources, management consulting, and policy preference. Therefore, they can attract many new enterprises to join the network and establish close cooperative relations with existing enterprises. Thus, the government and universities in the network become the link between existing enterprises and new enterprises, and they play a decisive role in making strategic decisions to promote the evolution of the network and the development of the industry. Through the simulation model, different behaviors of the government are treated as the experimental objects. The results reveal that these policies have varying influences on the innovation network, as well as on the enterprises themselves. Policy 2 chooses 20% of enterprises that support the minimum amount of resources, and policy 3 randomly selects 20% of enterprises that support the bottom 80% of resources. In this case, these two strategies are relatively consistent, and the difference only lies in the amount of resources for the selected object. Therefore, policies 2 and 3 have relatively similar simulation results. These two policies increase the size of the network, and the number of enterprises grows indefinitely. Although there are some connections in the network, most are concentrated on a few oligarchs. As the average degree of the network gradually decreases, the oligarch enterprises constantly digest and absorb the scarce resources of new enterprises and lead to a monopoly. After the new enterprise’s resources become unavailable, they gradually disappear from the network. Therefore, policies 2 and 3 are not conducive to the development of collaborative innovation networks. For policy 1, the network scale will not significantly increase and it is basically maintained at a certain level. The enterprises in the network are constantly updated, and the network innovation vitality will be preserved in a relatively active state. In policy 1, the historical average of the network grows rapidly. It is especially the case after the maturity period, when government support is reduced and a large historical average growth occurred. This suggests that, under this policy, when the strength of government support declines, the vitality of network innovation continues to be maintained, and a high cooperation density remains among the subjects. Under the support of the government, enterprises can enter the network, fully absorb the network resources, and develop their self-innovation ability. Enterprises, in accordance with the cooperation agreement, continue to join and exit, and they can stick to resource sharing. No monopolistic enterprises occupy the core position of the network for a long time and drain the network resources. Such an environment is more beneficial for industries that need to maintain high-tech aspects. Finally, the collaborative innovation network integrates the knowledge network, the technology network, the resource network, and the service network. The members of the network incrementally change. The relationships among the subjects change as the network position changes. Thus, the network ecology is continuously improving itself and constructing the network, with innovation being maximized.
Besides, the research in this paper provides some management information for government and enterprises. The leading role ought to be acknowledged, in terms of, for example, overall planning, policy support, and supporting services, which the government plays. Government behaviors can assist in reducing the trust cost that is incurred from the heterogeneity of enterprises and the risks of technology spillover, resource loss, and information distortion. By choosing sensible supporting policies and establishing perfect system, the government can eliminate the resistance that is encountered by enterprises at the initial stage to some extent, in order to facilitate the smooth implementation of collaborative innovation activities. As the enterprises own different knowledge absorbing capacity and innovative resources, the government behaviors cannot remain invariable. It should also be differentiated in the initial and mature stages for enterprises. In particular, attention shall be paid to the transformation from the former mode of jurisdiction to the mode of network governance. At this time, the characteristics of the network and the demands from the subjects should be fully considered. As far as a collaborative innovation network is concerned, it signifies the establishment of a sensible collaborative innovation mechanism. The construction of a collaborative innovation mechanism should not only consider the internal conditions for enterprises to produce innovative behaviors, but also combine with the external conditions of innovative activities. When the government selects enterprises to support, it should focus on supporting those that are new to the innovation network. The incumbent companies accept these enterprises, as they potentially have resources that are lacking in the network. The government should choose to support these enterprises so that the network always preserves innovation vitality, fully absorbs the innovation resources of the enterprises outside the network, and enables the whole network to gain a unique competitive advantage. Meanwhile, according to the characteristics of the networks and enterprises, the government ought to consider different supports through single or combined ways, such as R&D subsidies, tax incentives, and government procurement. Enterprises can then, fully and in a timely manner, access network resources, effectively improve their innovation ability, reduce the time that is required to search for partners’ behaviors or learn from their advanced experience, and significantly improve the efficiency of innovation. For enterprises, it is necessary to enhance their consciousness of innovation and reinforce their formal and informal communication with other enterprises by optimizing the knowledge structure and improving the level of knowledge acquisition. It enables the enterprises to absorb more overflow knowledge and thus improve the income of knowledge resources. Under the leadership of the government, enterprises are required to conduct a strategic deployment that is guided by the market and driven by innovation. This requires enterprises to conduct an accurate analysis of the characteristics and resources of the innovation network, select suitable enterprises for collaborative innovation, and achieve self-growth.
Finally, when considering the limitations that are posed by academic and research conditions, our work has the following limitations: the collaborative innovation network is only one type of innovation network. It is assumed that, under government–university cooperation, innovation resources among subjects are transparent. To further promote other innovation networks, the complexity of different networks shall be taken into consideration. The simulation model requires further validation through empirical research.

Author Contributions

Conceptualization: Z.W.; data curation: L.F.; formal analysis: Y.S.; software: L.F.; validation: Y.S.; writing—original draft: Z.W.

Funding

This research was funded by the National Natural Science Foundation of China (71872027 & 71172095) and the National Social Science Fund Project of China (17DA051).

Conflicts of Interest

The authors declare no conflict of interest.

References

  1. Shao, Y.; Zhan, K.; Wu, Y. Breakthrough Technology Innovation:Literature Review and Prospect. Technol. Econ. 2017, 36, 30–37. [Google Scholar]
  2. Xie, X. Empirical study on synergic innovative networks and innovation performance of SMEs. J. Manag. Sci. China 2010, 13, 51–64. [Google Scholar]
  3. Peng, J.; Wu, L. On the model and construction of technology collaborative innovation. R&D Manag. 2000, 5, 12–16. [Google Scholar]
  4. Zobel, A. Benefiting from Open Innovation: A Multidimensional Model of Absorptive Capacity. J. Prod. Innov. Manag. 2017, 34, 269–288. [Google Scholar] [CrossRef]
  5. Rijnsoever, F.J.V.; Berg, J.V.D.; Koch, J. Smart innovation policy: How network position and project composition affect the diversity of an emerging technology. Res. Policy 2015, 44, 1094–1107. [Google Scholar] [CrossRef]
  6. Gulati, R.; Nohria, N.; Zaheer, A. Strategic networks. Strateg. Manag. J. 2000, 21, 203–215. [Google Scholar] [CrossRef]
  7. Gnyawali, D.R.; Madhavan, R. Cooperative networks and competitive dynamics: A structural embeddedness perspective. Acad. Manag. Rev. 2001, 26, 431–445. [Google Scholar] [CrossRef]
  8. Ye, C.; Yu, X.; Li, W. Empirical analysis on evolution and small world effect of Chinese enterprise-enterprise patent cooperation network: From the perspective of open innovation. Information 2013, 4, 398–410. [Google Scholar] [CrossRef]
  9. Cao, L. A Comparison Research on Networks Structure of Industrial Cluster. China Ind. Econ. 2008, 8, 143–152. [Google Scholar]
  10. Powell, W.W.; White, D.R.; Koput, K.W.; Owen-Smith, J. Network dynamics and field evolution: The growth of interorganizational collaboration in the life sciences. Am. J. Sociol. 2005, 110, 1132–1205. [Google Scholar] [CrossRef]
  11. Cantner, U.; Graf, H. The network of innovators in Jena: An application of social network analysis. Res. Policy 2006, 35, 463–480. [Google Scholar] [CrossRef]
  12. Hadjimanolis, A.; Dickson, K. Development of national innovation policy in small developing countries: The case of Cyprus. Res. Policy 2001, 30, 805–817. [Google Scholar] [CrossRef]
  13. Chen, J. Collaborative Innovation and National Research Capacity Building. Stud. Sci. Sci. 2011, 29, 1762–1763. [Google Scholar]
  14. Xie, X.; Zuo, L. Characteristics of Collaborative Innovation Networks and Innovation Performance of Firms: The Mediating Effect of Knowledge Absorptive Capacity. Nankai Bus. Rev. 2013, 16, 47–56. [Google Scholar]
  15. Zhao, J.; Wu, G. Evolution of the Chinese Industry-University-Research Collaborative Innovation System. Complexity 2017, 2017, 4215805. [Google Scholar] [CrossRef]
  16. Fernández-Esquinas, M.; Pinto, H.; Yruela, M.P.; Pereira, T.S. Tracing the flows of knowledge transfer: Latent dimensions and determinants of university–industry interactions in peripheral innovation systems. Technol. Forecast. Soc. Chang. 2016, 113, 266–279. [Google Scholar] [CrossRef]
  17. Rehm, S.V.; Goel, L.; Junglas, I. Information management for innovation networks—An empirical study on the “who, what and how” in networked innovation. Int. J. Inf. Manag. 2016, 36, 348–359. [Google Scholar] [CrossRef]
  18. Ozkaya, H.E.; Droge, C.; Hult, G.T.M.; Calantone, R.; Ozkaya, E. Market orientation, knowledge competence, and innovation. Int. J. Res. Mark. 2015, 32, 309–318. [Google Scholar] [CrossRef]
  19. Chung, H.F.L. Market orientation, guanxi, and business performance. Ind. Mark. Manag. 2011, 40, 522–533. [Google Scholar] [CrossRef]
  20. Dyer, J.H.; Nobeoka, K. Creating and managing a high-performance knowledge-sharing network: The Toyota case. Strateg. Manag. J. 2000, 21, 345–367. [Google Scholar] [CrossRef]
  21. Savin, I.; Egbetokun, A. Emergence of innovation networks from R&D cooperation with endogenous absorptive capacity. J. Econ. Dyn. Control 2016, 64, 82–103. [Google Scholar]
  22. Gay, B.; Dousset, B. Innovation and network structural dynamics: Study of the alliance network of a major sector of the biotechnology industry. Res. Policy 2005, 34, 1457–1475. [Google Scholar] [CrossRef]
  23. Gao, X.; Chen, K. The complex network analysis of the structure evolution of collaborative innovation networks. Sci. Res. Manag. 2015, 36, 28–36. [Google Scholar]
  24. Tatarynowicz, A.; Sytch, M.; Gulati, R. Environmental demands and the emergence of social structure: Technological dynamism and interorganizational network forms. Adm. Sci. Q. 2016, 61, 52–86. [Google Scholar] [CrossRef]
  25. Van Burg, E.; Berends, H.; Van Raaij, E.M. Framing and interorganizational knowledge transfer: A process study of collaborative innovation in the aircraft industry. J. Manag. Stud. 2014, 51, 349–378. [Google Scholar] [CrossRef]
  26. Li, W. Relationship between innovation and market structure in industrial evolution—A Chinese interpretation of Schumpeterrian hypothesis. Sci. Res. Manag. 2009, 30, 39–47. [Google Scholar]
  27. Zhang, Y.; Li, C. Research on the Innovation Network Structural Impact on Innovation Resource Utilization. Sci. Manag. 2010, 1, 17. [Google Scholar]
  28. Miotti, L.; Sachwald, F. Co-operative R&D: Why and with whom? An integrated framework of analysis. Res. Policy 2003, 32, 1481–1499. [Google Scholar]
  29. Pfeffer, J.; Gerald, R.S. The External Control of Organizations: A Resource Dependence Perspective; Stanford University Press: Stanford, CA, USA, 2003. [Google Scholar]
  30. Chen, J.; Wu, B. The impact of open-ness on the acquisition of external key resources by enterprises with open innovation. Sci. Res. Manag. 2012, 33, 10–22. [Google Scholar]
  31. Ritala, P.; Hurmelinna-Laukkanen, P. Incremental and radical innovation in coopetition—The role of absorptive capacity and appropriability. J. Prod. Innov. Manag. 2013, 30, 154–169. [Google Scholar] [CrossRef]
  32. Cai, L.; Liu, Q. The Empirical Research on the Relationship between Shared Resources and Innovation Performance of Technology-Based Firm in Entrepreneurial Cluster. J. Ind. Eng. Eng. Manag. 2008, 22, 19–23. [Google Scholar]
  33. Brondoni, S.M. Innovation and Imitation: Corporate Strategies for Global Competition. Symph. Emerg. Issues Manag. 2012, 10–24. [Google Scholar] [CrossRef]
  34. Cheng, C.C.J.; Chen, J.S. Breakthrough innovation: The roles of dynamic innovation capabilities and open innovation activities. J. Bus. Ind. Mark. 2013, 28, 444–454. [Google Scholar] [CrossRef]
  35. Li Keqiang: Speech at the 8th Summer Davos Forum. Available online: http://www.gov.cn/guowuyuan/2014-09/11/content_2748703.htm (accessed on 11 April 2019).
  36. Government Working Report. Available online: http://www.gov.cn/premier/2019-03/16/content_5374314.htm (accessed on 11 April 2019).
  37. Promote “Internet + Innovation and Entrepreneurship” with the “One School, One Belt” Strategy. Available online: https://news.uestc.edu.cn/?n=UestcNews.Front.Document.ArticlePage&Id=50603 (accessed on 11 April 2019).
  38. Electronic Science and Technology University and Chengdu High-tech Zone Signed a Contract to Jointly Build a National Independent Innovation Demonstration Zone and a “One School, One Belt” Plan. Available online: https://news.uestc.edu.cn/?n=UestcNews.Front.Document.ArticlePage&Id=51408 (accessed on 11 April 2019).
  39. Fang, W.; Wang, L. Collaborative innovation network:Current situation and future trend. Sci. Res. Manag. 2018, 39, 30–41. [Google Scholar]
  40. Barabási, A.L.; Albert, R.; Jeong, H. Mean-field theory for scale-free random networks. Phys. A Stat. Mech. Its Appl. 1999, 272, 173–187. [Google Scholar] [CrossRef]
  41. Albert, R.; Barabási, A.L. Statistical mechanics of complex networks. Rev. Mod. Phys. 2002, 74, 47. [Google Scholar] [CrossRef]
  42. Li, X.; Chen, G. A local-world evolving network model. Phys. A Stat. Mech. Its Appl. 2003, 328, 274–286. [Google Scholar] [CrossRef]
  43. Fu, R. Anaiysis of the Stability of Resource-Based Business Networking. J. Manag. China 2005, 2, 173–187. [Google Scholar]
  44. Wei, L.H. Analysis of Local Government Behavior in the Process of Industrial Cluster Upgrade—Based on the Perspective of Local Governance. Theory Mon. 2010, 7, 74–77. [Google Scholar]
  45. Brenner, T.; Schlump, C. Policy measures and their effects in the different phases of the cluster life cycle. Reg. Stud. 2011, 45, 1363–1386. [Google Scholar] [CrossRef]
  46. Depret, M.H.; Hamdouch, A. Multiscalar Clusters and Networks as the Foundations of Innovation Dynamics in the Biopharmaceutical Industry. Soc. Sci. Electron. Publ. 2010, 33, 227–268. [Google Scholar] [CrossRef]
  47. Sotarauta, M. Policy learning and the ‘cluster-flavoured innovation policy’ in Finland. Environ. Plan. C Gov. Policy 2012, 30, 780–795. [Google Scholar] [CrossRef]
  48. Stevenson, L.; Anders, L. Patterns and trends in entrepreneurship/SME. In Policy and Practice in Ten Economies; Elanders Gotab: Vällingby, Sweden, 2001; Volume 3. [Google Scholar]
  49. Hite, J.M.; Hesterly, W.S. The evolution of firm networks: From emergence to early growth of the firm. Strateg. Manag. J. 2001, 22, 275–286. [Google Scholar] [CrossRef]
  50. Yi, J.; Meng, W.-D. The phasic study on the evolvement of the region innovation network. Sci. Res. Manag. 2005, 5, 3. [Google Scholar]
Figure 1. The current evolutionary sketch of “One School and One Belt.”
Information 10 00138 g001
Figure 2. Change in the number of innovative network enterprises.
Information 10 00138 g002
Figure 3. Innovation network average transformation.
Information 10 00138 g003
Figure 4. Innovation network historical average transformation.
Information 10 00138 g004
Figure 5. Innovative network average age transformation.
Information 10 00138 g005
Figure 6. Innovation network evolution map of Policy 1.
Information 10 00138 g006
Figure 7. Innovation network evolution map of Policy 2.
Information 10 00138 g007
Figure 8. Innovation network evolution map of Policy 3.
Information 10 00138 g008

