Article

Es-Tacotron2: Multi-Task Tacotron 2 with Pre-Trained Estimated Network for Reducing the Over-Smoothness Problem

School of Computer Science and Engineering, Central South University, Changsha 410083, China
*
Author to whom correspondence should be addressed.
Information 2019, 10(4), 131; https://doi.org/10.3390/info10040131
Submission received: 27 January 2019 / Revised: 6 April 2019 / Accepted: 8 April 2019 / Published: 9 April 2019
(This article belongs to the Section Artificial Intelligence)

Abstract

:
Text-to-speech synthesis is a computational technique for producing synthetic, human-like speech by a computer. In recent years, speech synthesis techniques have developed, and have been employed in many applications, such as automatic translation applications and car navigation systems. End-to-end text-to-speech synthesis has gained considerable research interest, because compared to traditional models the end-to-end model is easier to design and more robust. Tacotron 2 is an integrated state-of-the-art end-to-end speech synthesis system that can directly predict closed-to-natural human speech from raw text. However, there remains a gap between synthesized speech and natural speech. Suffering from an over-smoothness problem, Tacotron 2 produced ’averaged’ speech, making the synthesized speech sounds unnatural and inflexible. In this work, we first propose an estimated network (Es-Network), which captures general features from a raw mel spectrogram in an unsupervised manner. Then, we design Es-Tacotron2 by employing the Es-Network to calculate the estimated mel spectrogram residual, and setting it as an additional prediction task of Tacotron 2, to allow the model focus more on predicting the individual features of mel spectrogram. The experience shows that compared to the original Tacotron 2 model, Es-Tacotron2 can produce more variable decoder output and synthesize more natural and expressive speech.

Graphical Abstract

1. Introduction

Speech synthesis is the process of transposing input text into corresponding speech, and it is also known as text-to-speech (TTS). Traditional speech synthesis methods, such as statistical parametric speech synthesis (SPSS), are composed of several independent components, such that the overall system is difficult to adjust and requires extensive domain expertise knowledge to design [1].
In recent years, end-to-end TTS based on artificial neural networks has demonstrated considerable power in producing natural and emotional speech. Compared to SPSS, end-to-end TTS is easier to design, and furthermore allows for rich conditioning that makes synthesized speech more controllable. Tacotron 2 [2] is a state-of-the-art end-to-end speech synthesis model, which can generate speech directly from graphemes or phonemes. The system is consists of a recurrent sequence-to-sequence mel spectrogram prediction network, followed by a modified WaveNet acting as a vocoder to synthesize time-domain waveforms from those spectrograms. However, the gap between the synthesized speech of produced by such models and real speech is clear, in that the over-smoothness makes synthesis speech unnatural and inflexible.
Over-smoothness is a common problem in neural networks. The main reason for this problem is that neural networks are statistical in natural when learning an averaged speech distribution from a training database. In other words, the network generates a speech that contains more general features rather than individual features. The absence of individual features leads to the disappearance of the detailed structure of speech [3]. Besides, another factor leading to the over-smoothness problem is that the lower value of individual features compared to general features of speech mean that they cannot have sufficient influence to network, especially when using nonlinearity activation function.
Some speech parameter generation algorithms [4,5] consider the global variance (GV) [6] to enhance the details of over-smoothed spectra for HMM-based speech synthesis, to alleviate the over-smoothness problem. Such methods work by maximizing the likelihood estimation of the global variance, which can be thought of as introducing an additional global constraint to the model. The speech synthesized by these models is dissimilar from averaged result, and tends to preserve more of the characteristics of the speech. However, these methods also produce redundant distortion in the predicted spectrogram, making the generated speech noisy.
Generative adversarial networks (GANs) [7] provides another efficient way for solving the over-smoothness problem. Such approaches [8,9,10] convert speech processing into an image processing problem, as they view an over-smoothed spectrogram as a low-resolution image, and apply GANs as a post-filter to upsample the spectrogram to obtain a high-resolution spectrogram. However, GANs is unstable, and suffer from the mode collapse problem.
In this study, we propose a new neural network, called an estimated network (Es-Network), to reduce the over-smoothness problem. The Es-Network is composed of a group of estimated vectors, which are employed to capture general features of target speech corpus. These estimated vectors are optimized by minimizing reconstruction loss between the estimated speech and the original speech. Owning to the insufficiency capability of the vectors, they need to preserve most of the loss-related information (i.e., general features of speech) to minimize the reconstruction loss as far as possible. We calculate the estimated residual of the mel spectrogram, and set the residual as an additional learning task of Tacotron 2, to achieve a greater focus on learning of individual features. Compared to original Tacotron 2, we find the model with the estimated residual task can produce higher quality speech.
The present work makes the following two contributions:
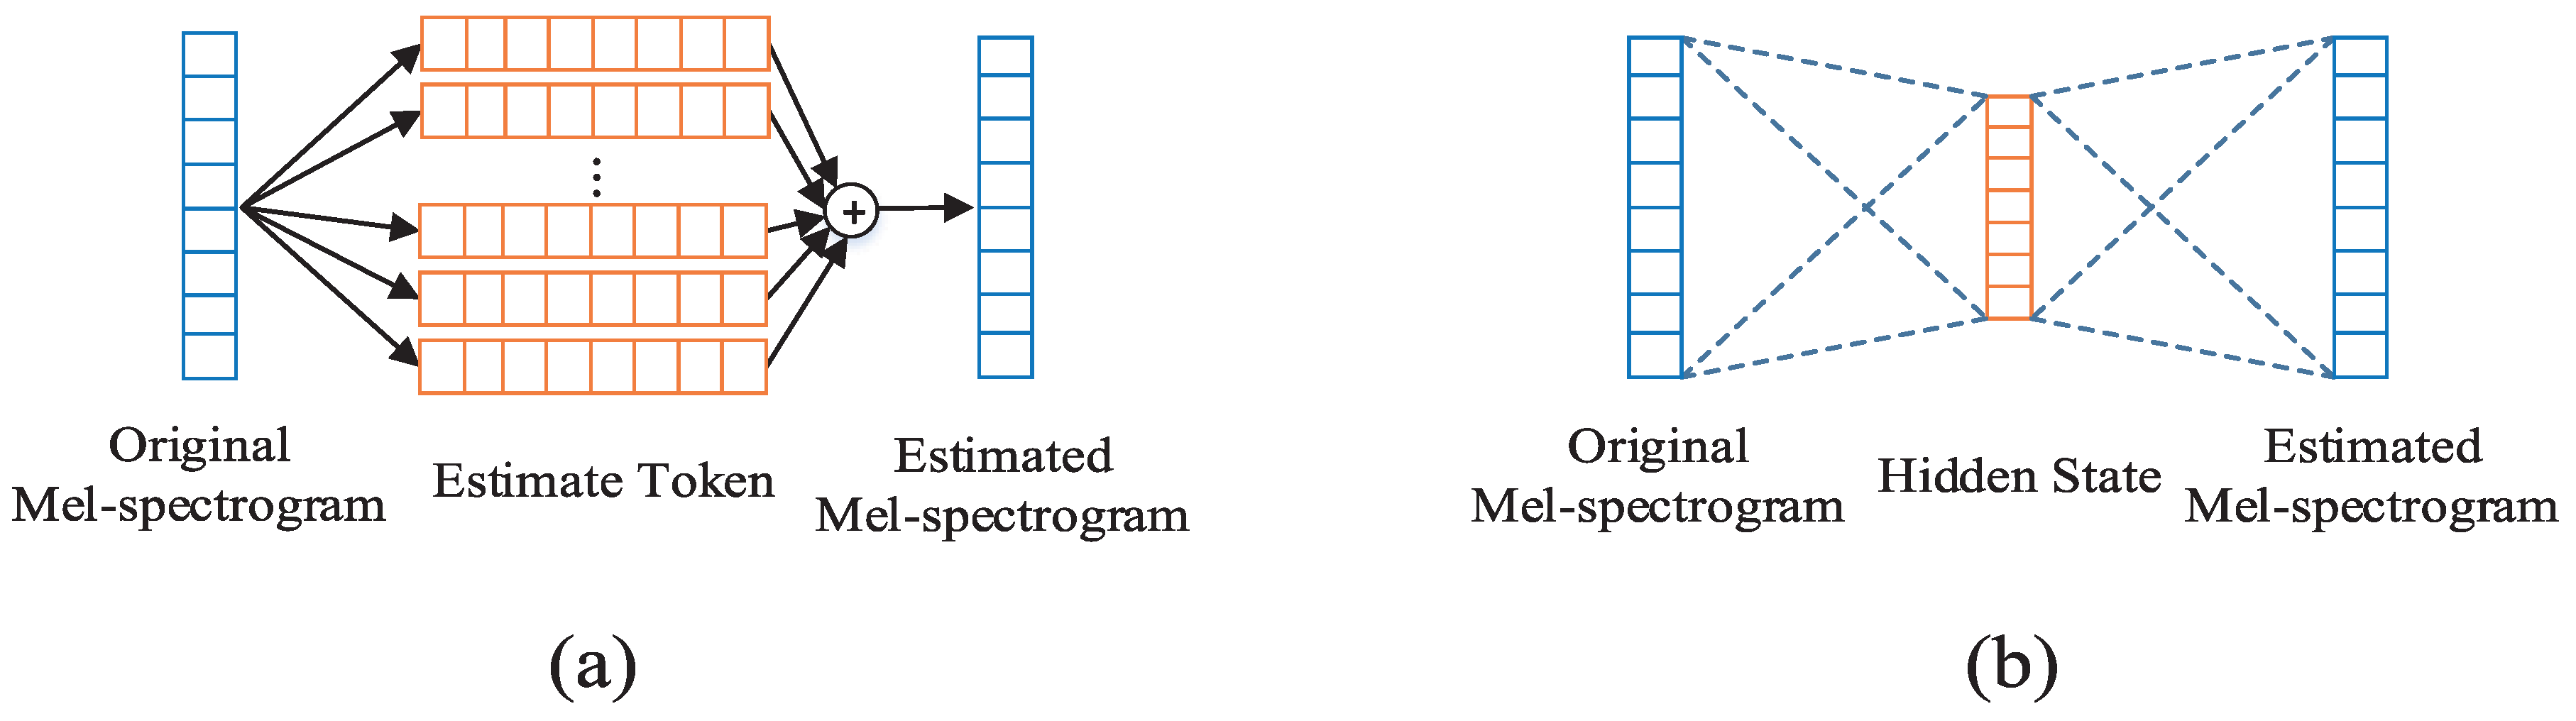
  • We propose the Es-Network, which is an unsupervised network that learns the general speech features from some target speech. Then, we describe the importance of learning individual features in speech synthesis.
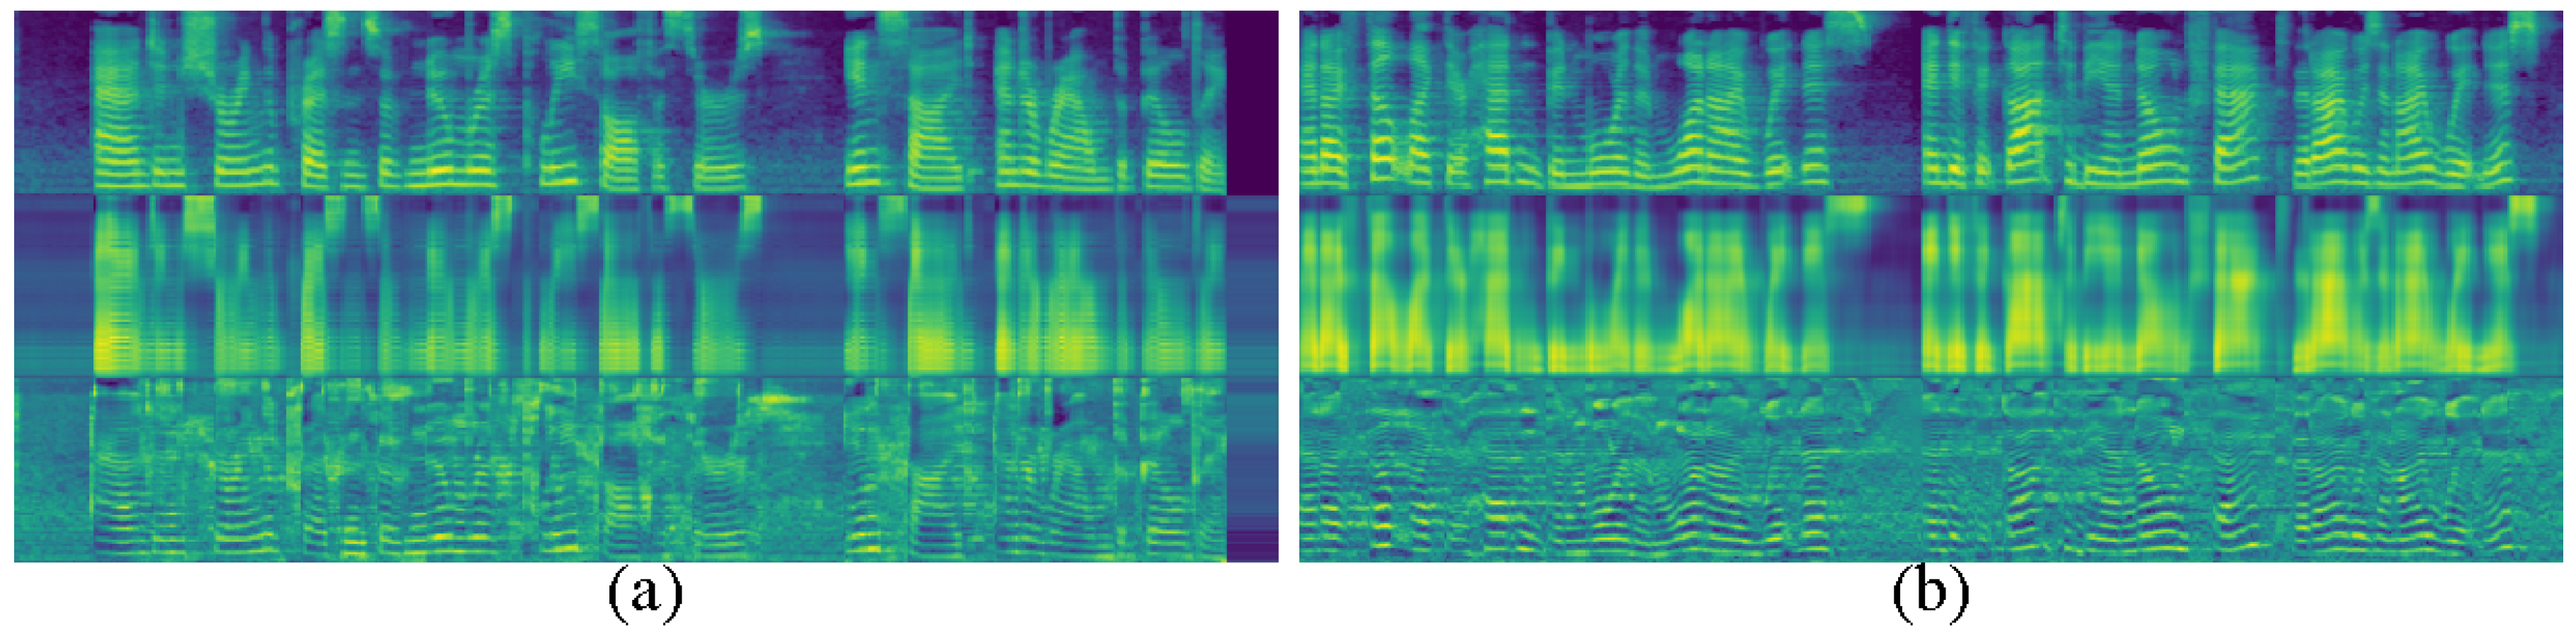
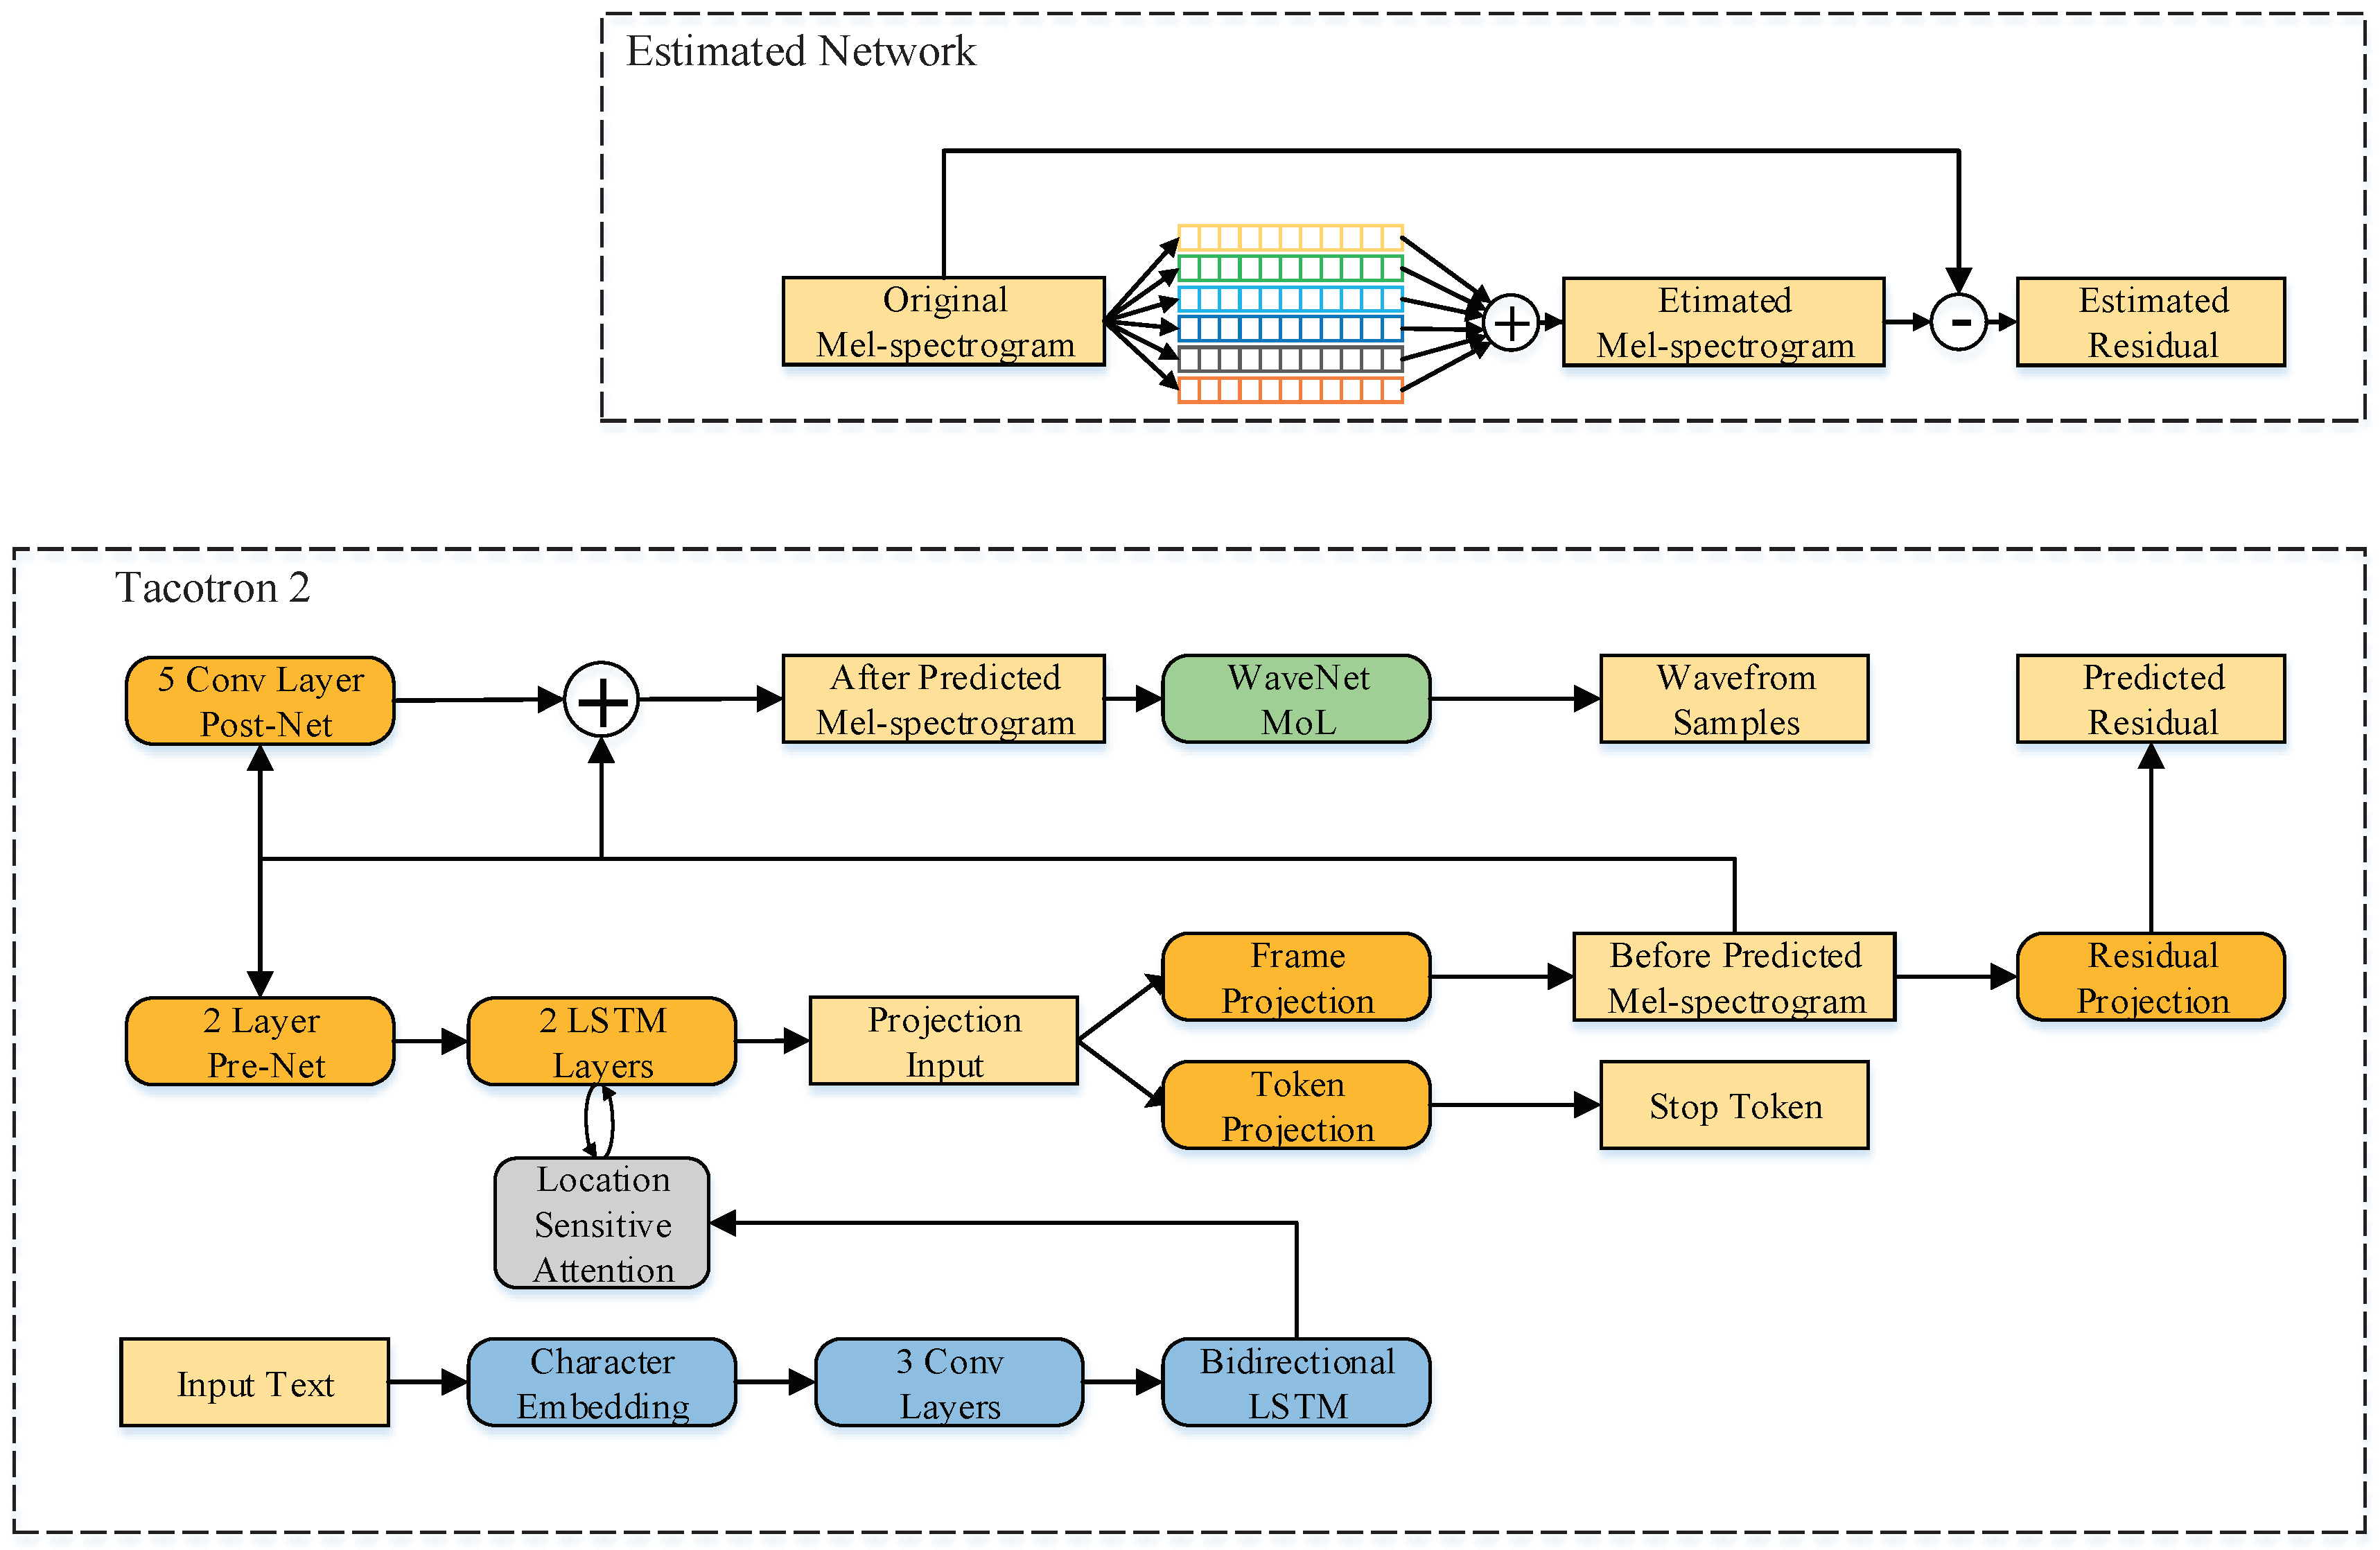
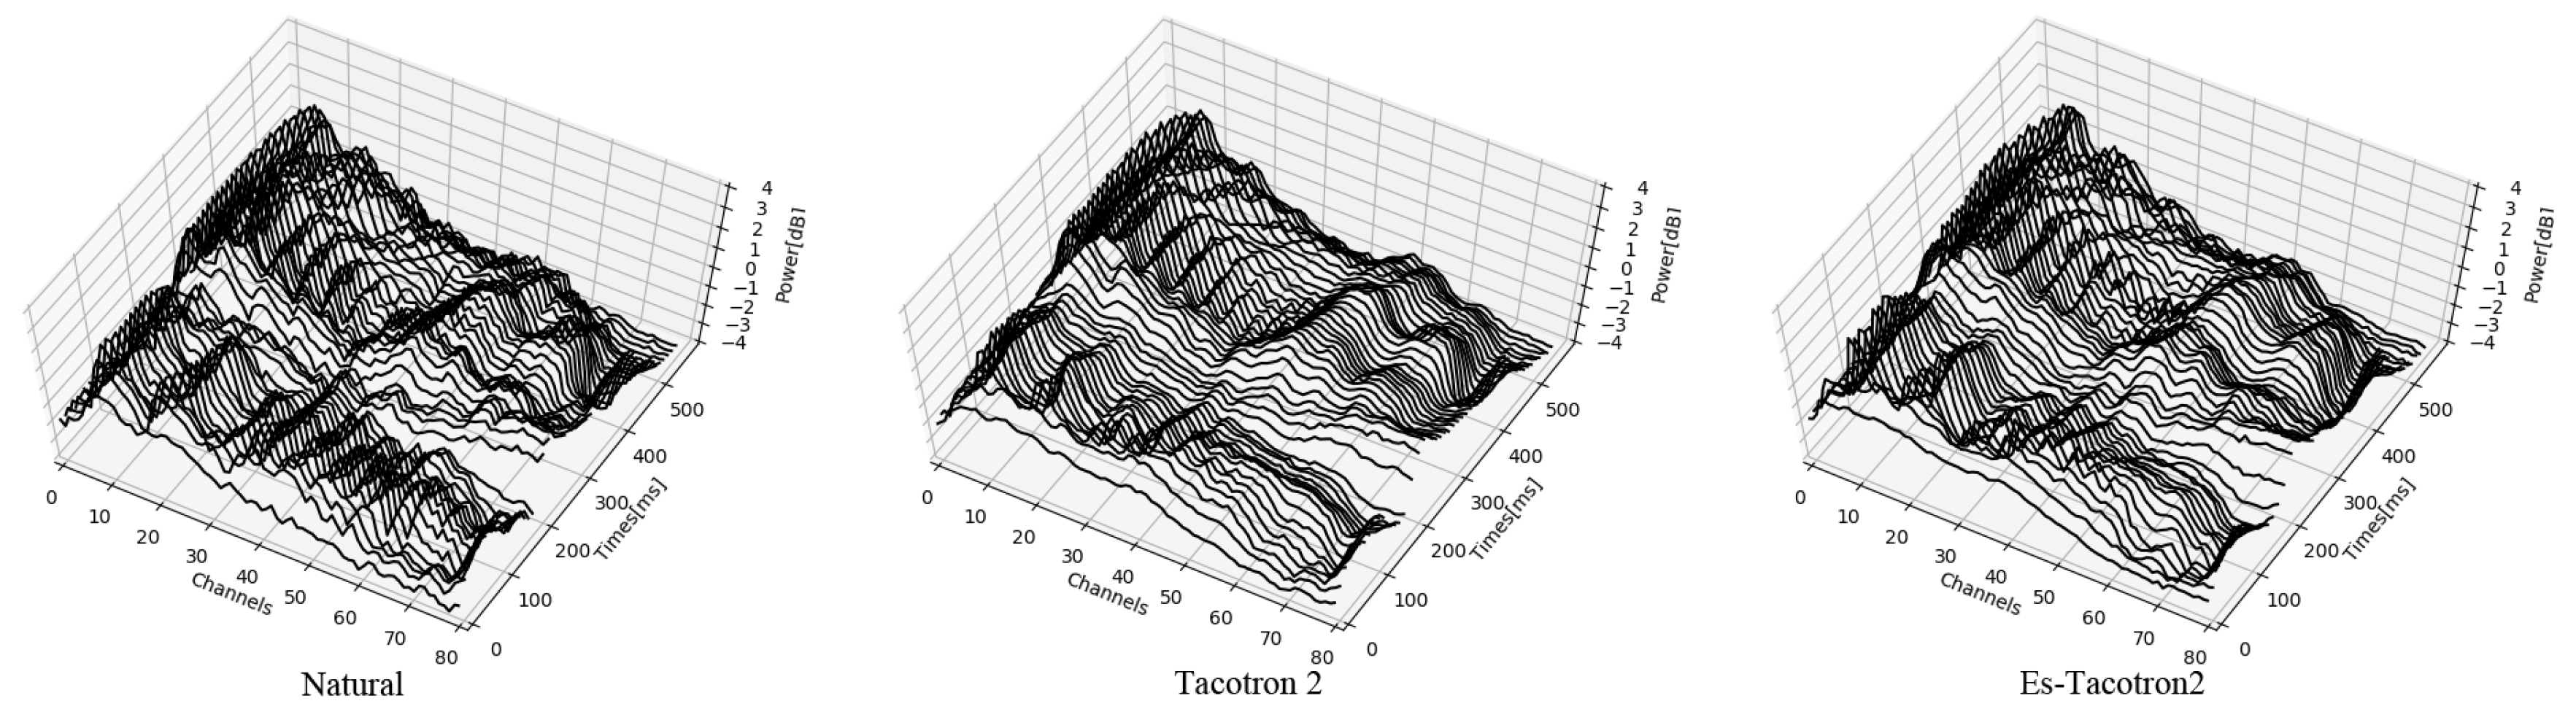
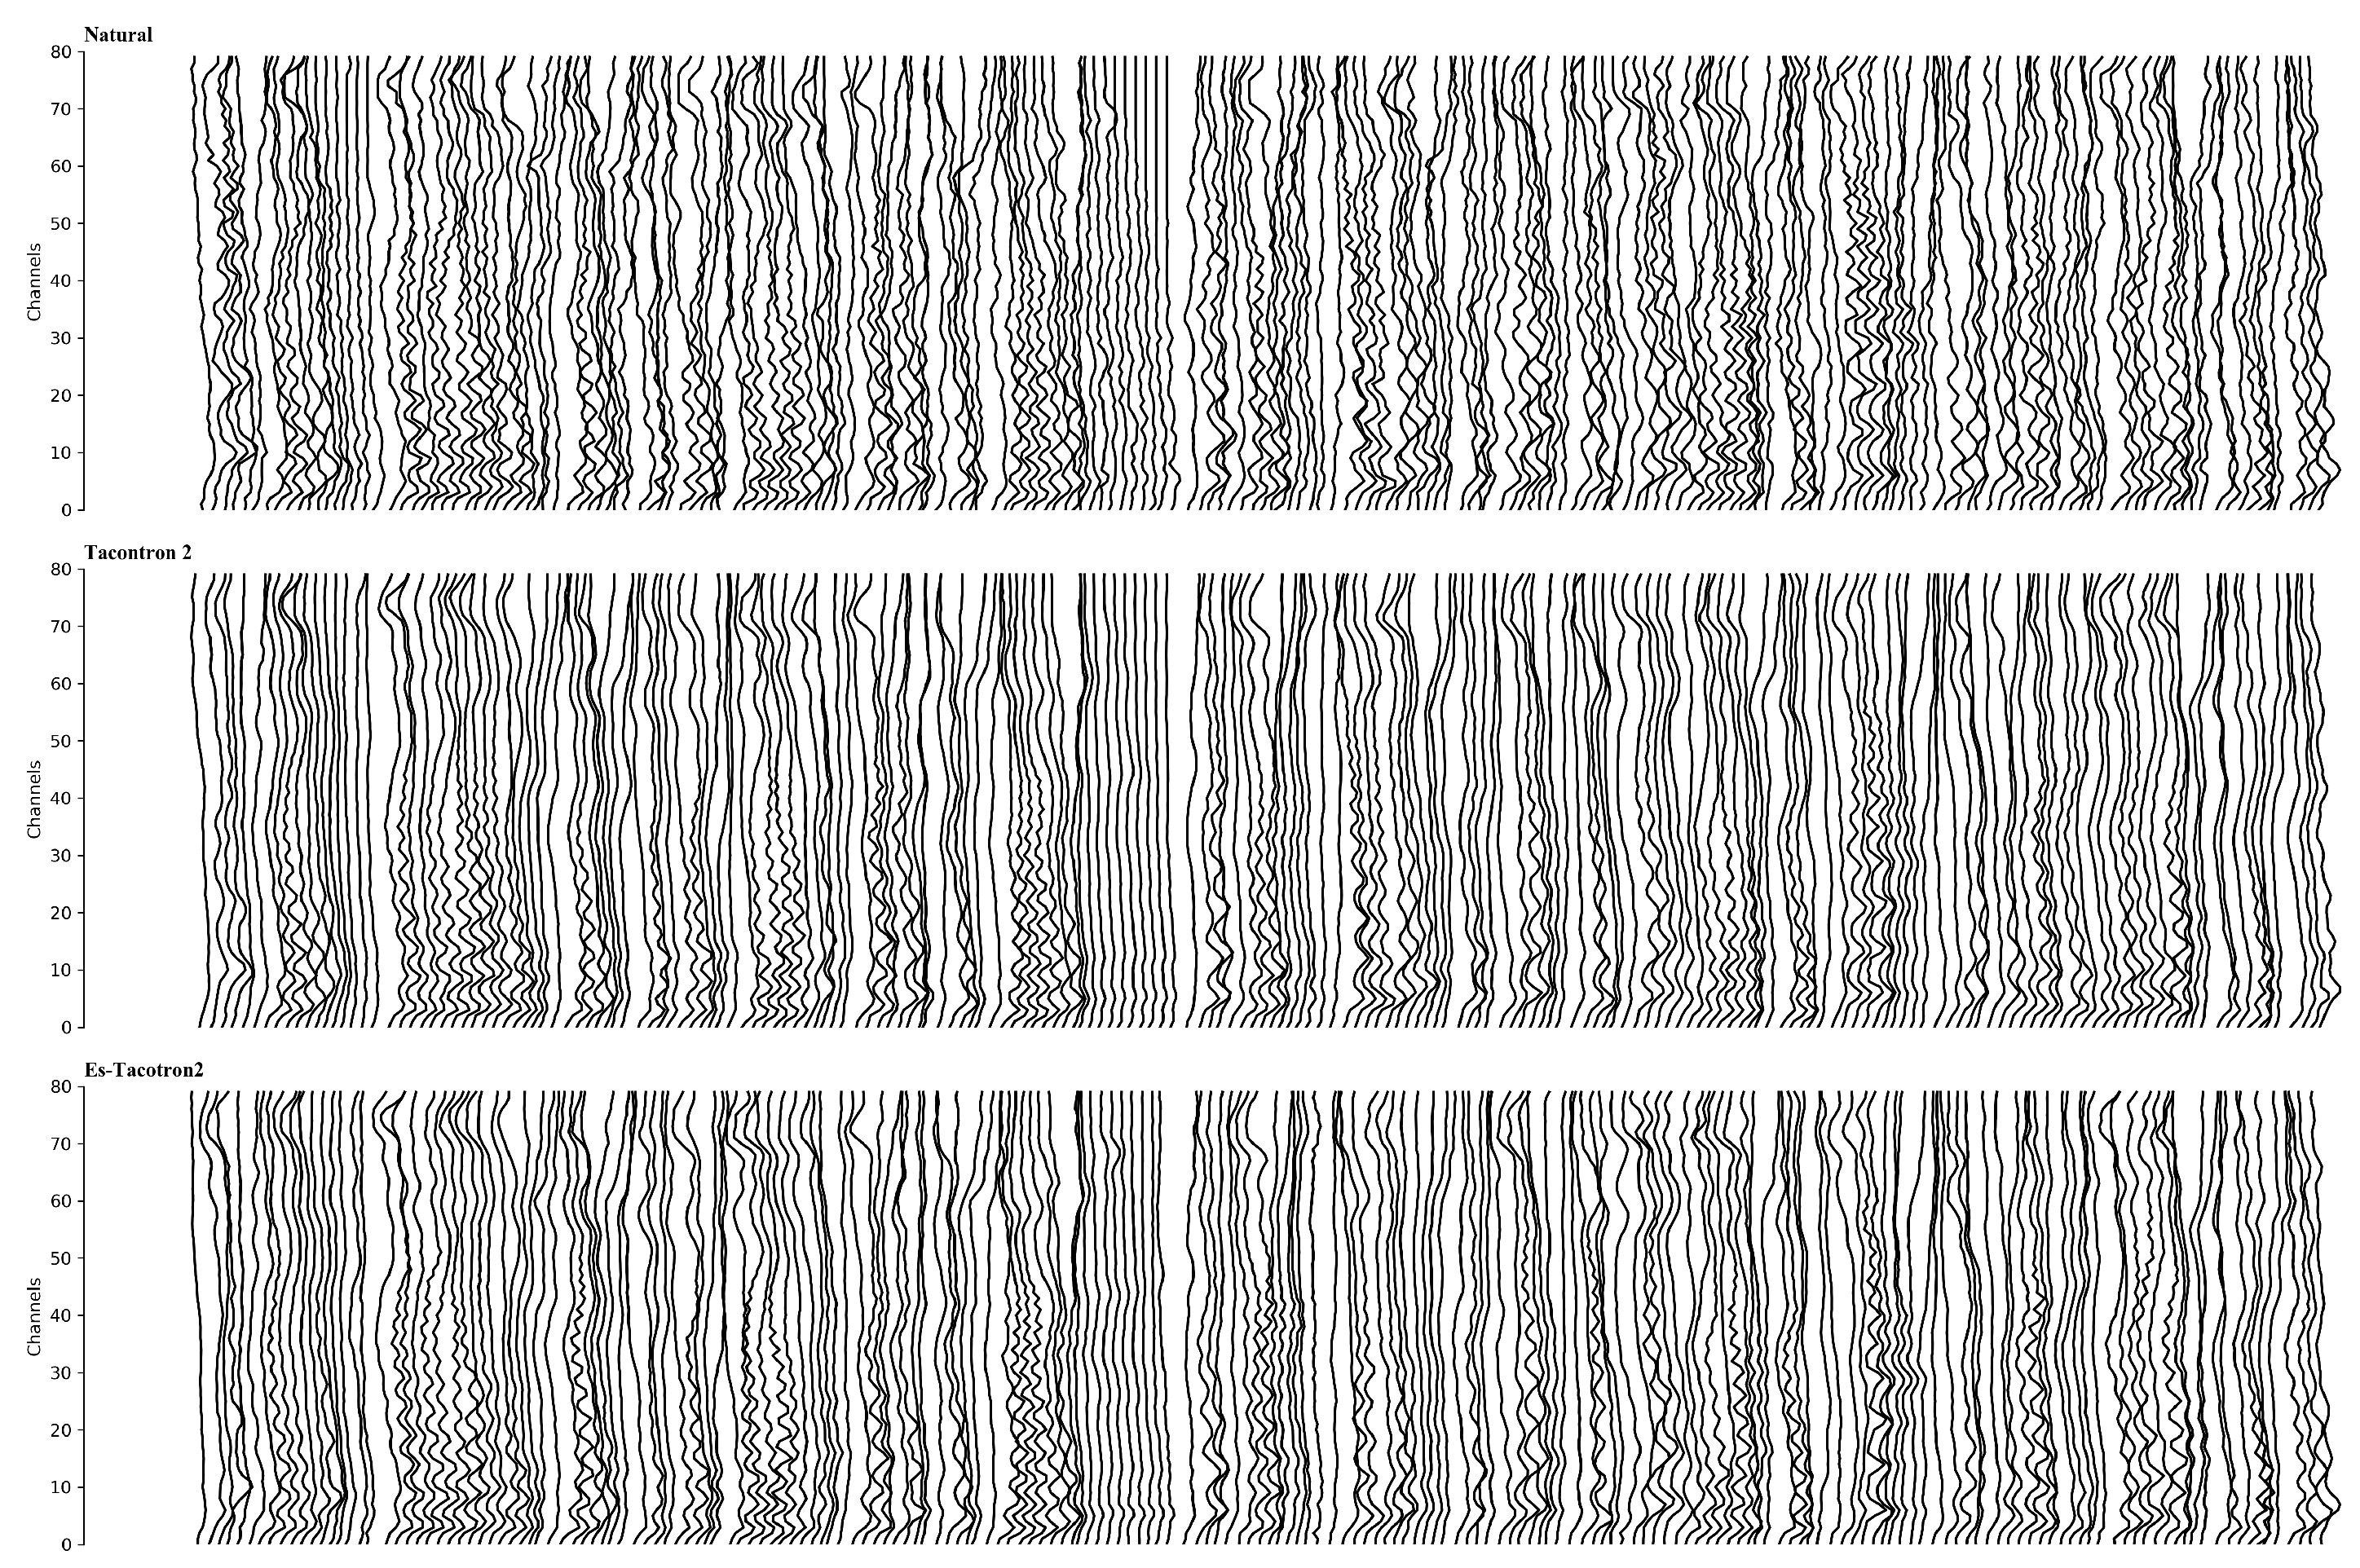
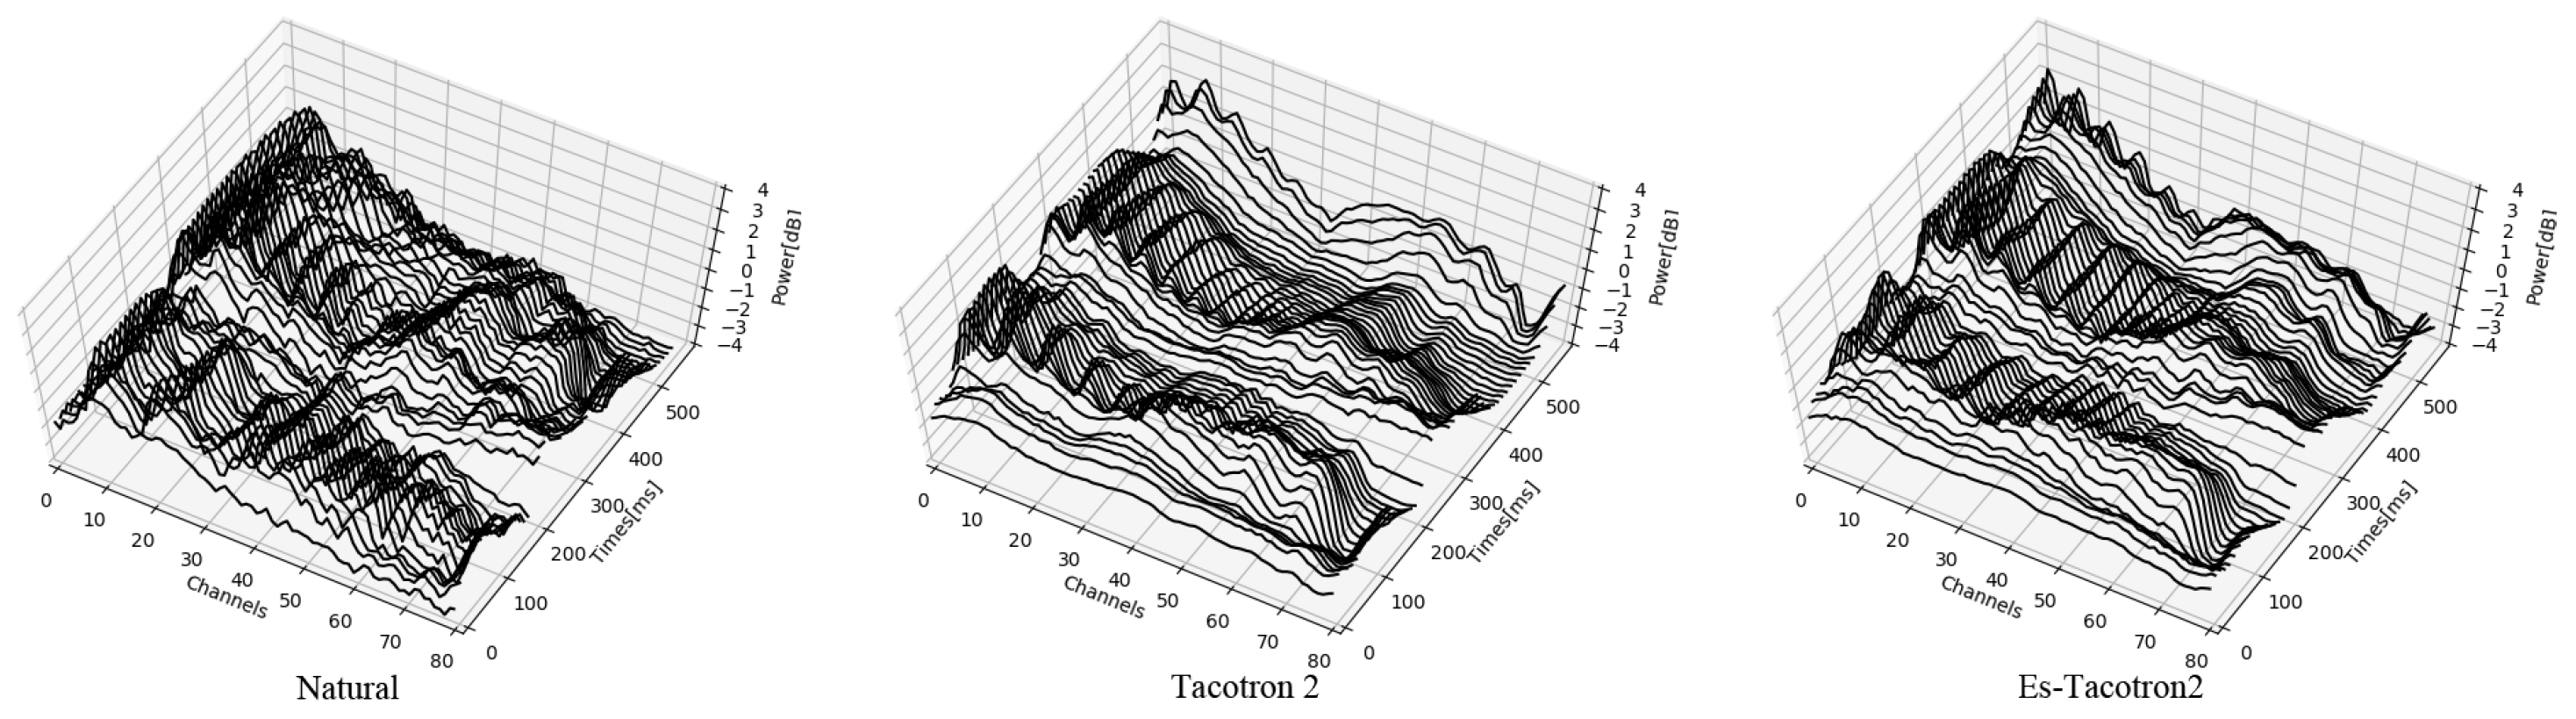
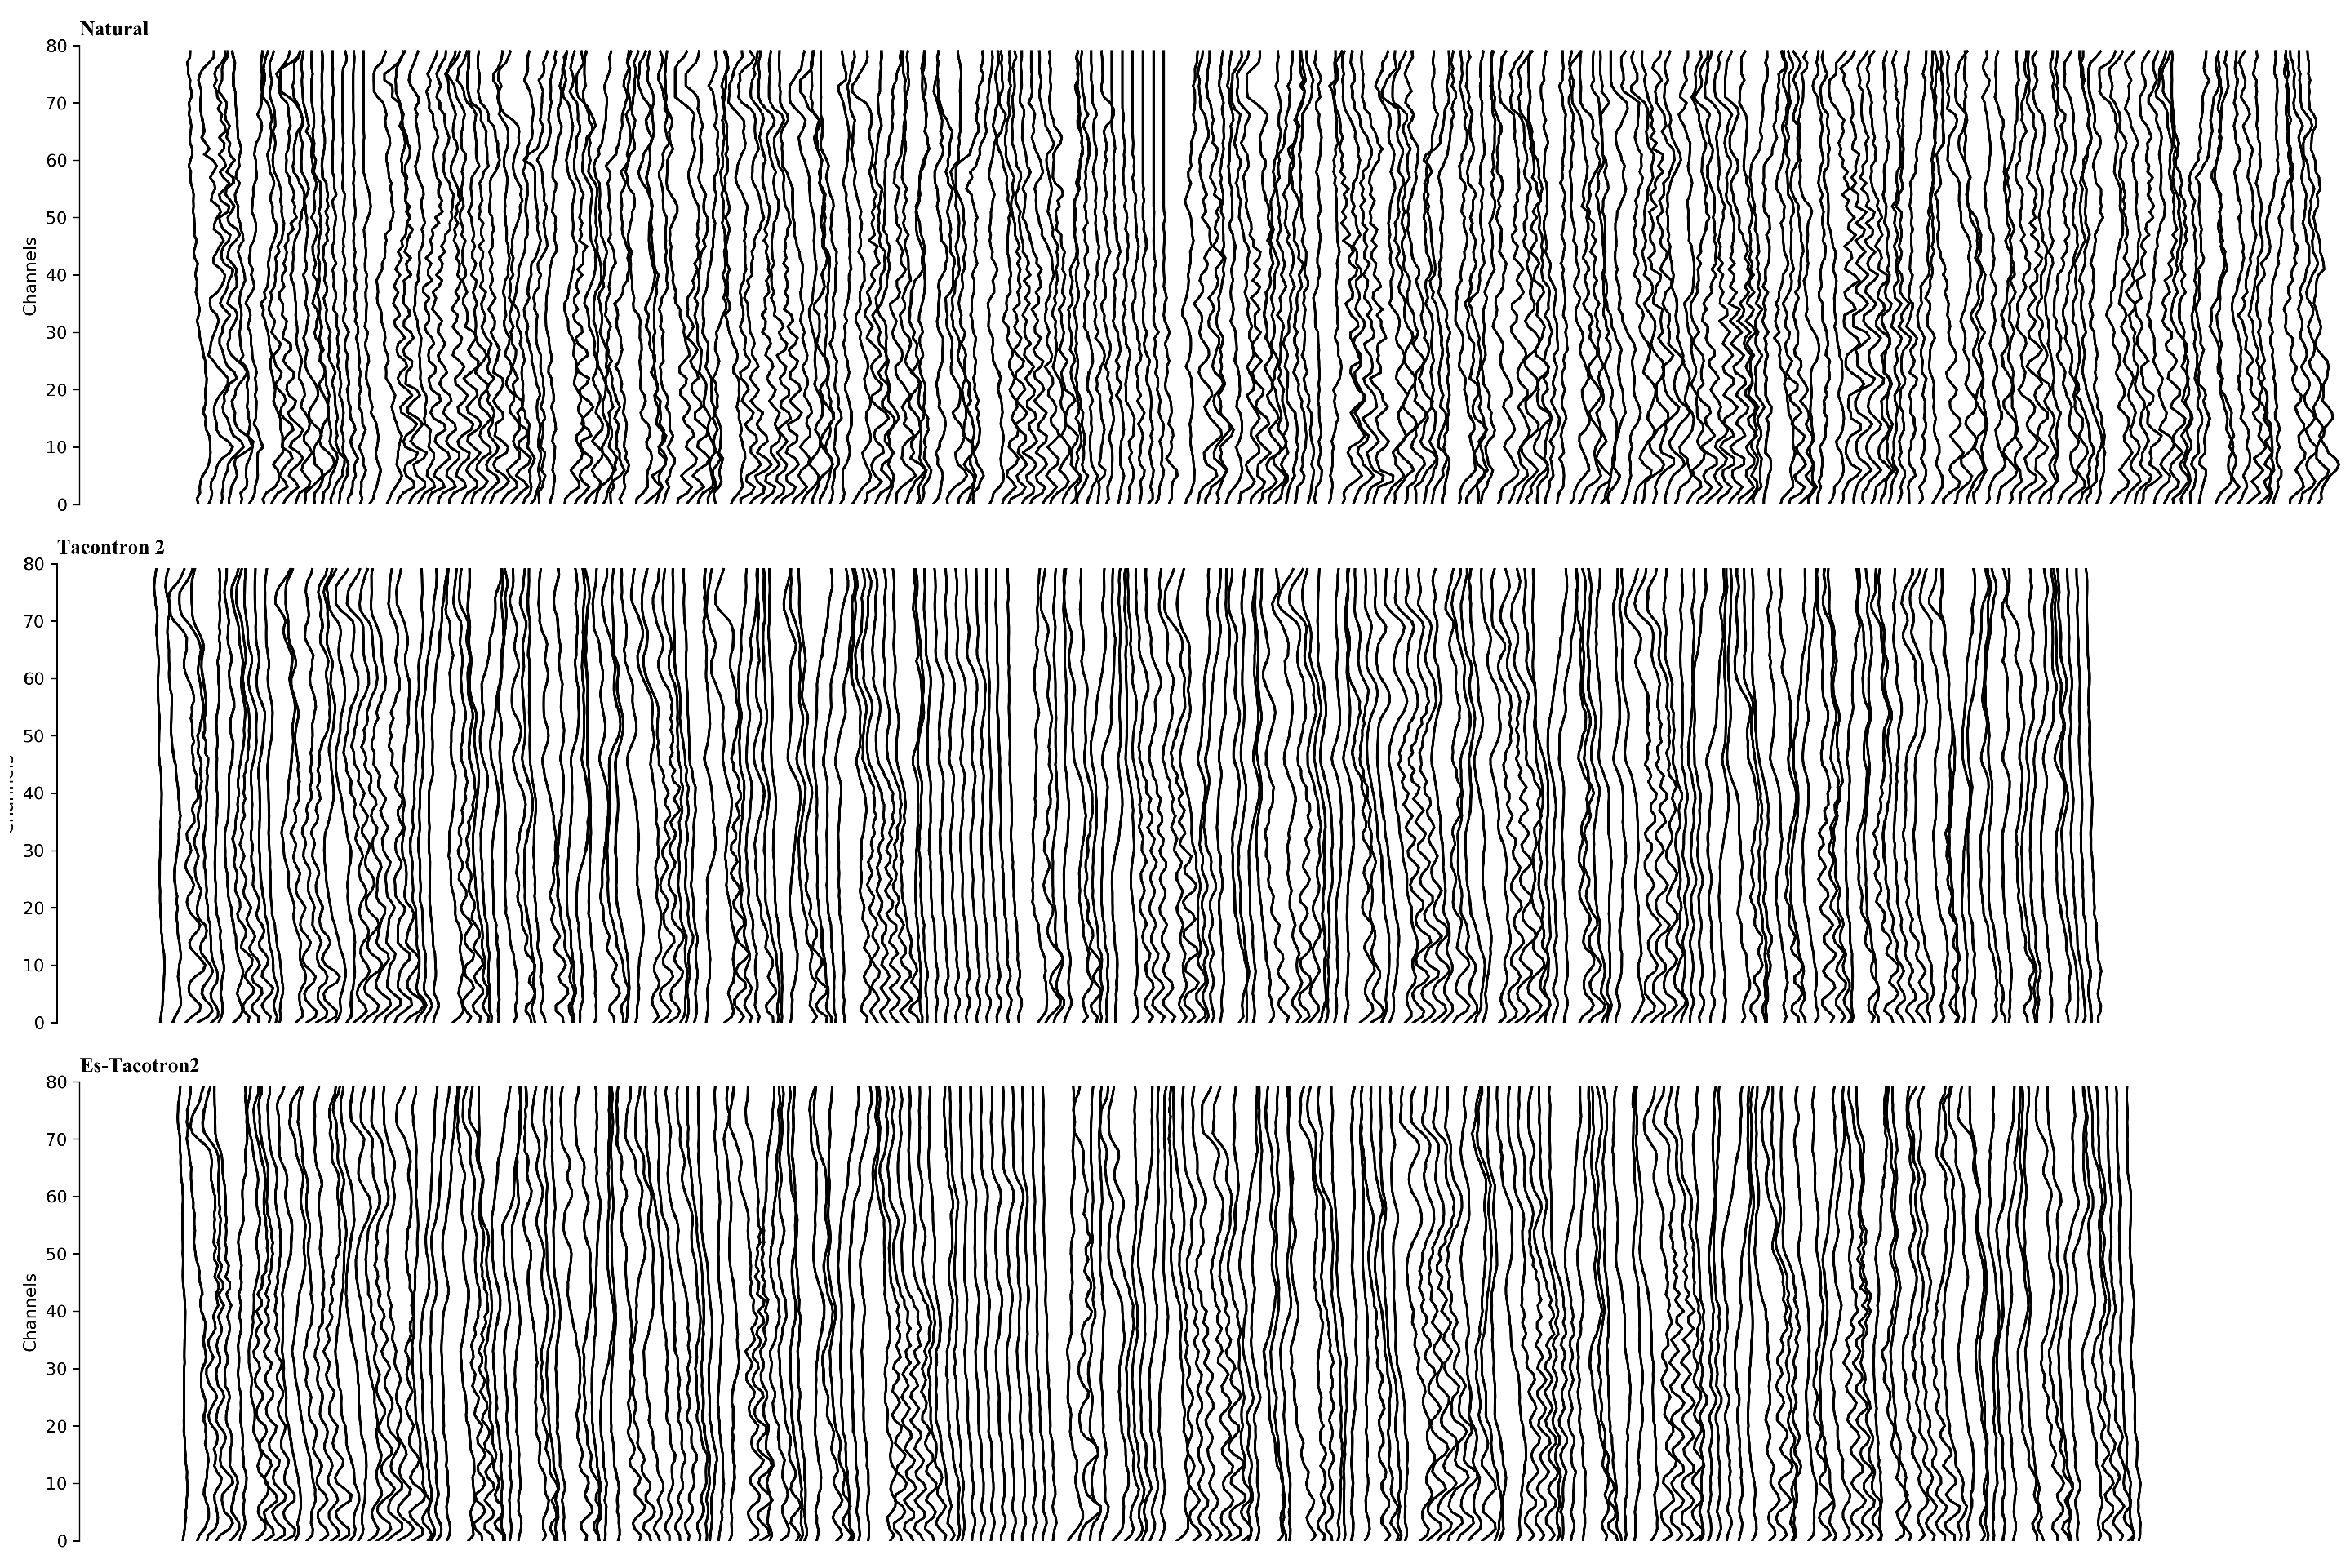
  • We propose a model called Es-Tacotron2, which combines the Es-Network with Tacotron 2, and set the learning of the estimated residual of the mel spectrogram as the third task of Tacotron 2. Compared with original Tacotron 2, the synthesized speech of Es-Tacotron2 contains more details, and it achieved 67.5% preference in a mean opinion score (MOS) test.
The rest of this paper is organized as follows. In Section 2, we discuss the related work. The proposed network for extracting the general features of mel spectrogram and the architecture of Es-Tacotron2 is detailed in Section 3. In Section 4 we present objective evaluation and subjective evaluation in comparison with baselines. Then, we discuss the effect of different heads number to Es-Network. Finally, we conclude this work in Section 5.

2. Related Work

2.1. End-to-End Speech Synthesis

There are some approaches to the text-to-speech pipeline based on neural networks. The first is WaveNet [11], which is an auto-regressive model with dilated, causal convolutions layers for audio generation. DeepVoice 1&2&3 [12,13,14] achieved faster than real-time synthesis speedups with many stacked QNN(Quasi-recurrent network) [15] layers. Char2Wav [16] is a more end-to-end approach, which employs a standard seq2seq attention encoder-decoder architecture to evaluate the vocoder features and a neural vocoder SampleRNN to compute the final synthesized signal. However, these three models are not entirely end-to-end, because each of the components in each model must to be trained independently. Tacotron [1] is an integrated end-to-end generative TTS model, which takes a character as input and outputs the corresponding frame-level sentences of a spectrogram. Tacotron 2 [2] extends the Tacotron by taking a modified WaveNet as a vocoder, which takes mel spectrograms as the conditioning input.

2.2. Multi-Task Learning

Multi-task learning (MLT) [17] has been successfully employed in many applications of machine learning, from natural language processing to computer vision, etc. We can view multi-task learning as a machine learning strategy that aims at improving the model generalization ability and performance, by jointly learning with multiple tasks and sharing representations between related tasks. By sharing representations, other related tasks can contribute to the main task, providing supplementary information that enables models to generalize more effectively on the main task. There are two most commonly adopted approaches to performing multi-task learning are hard or soft parameter sharing of hidden layers.
Hard parameter sharing is applied by sharing the hidden layers between all tasks while maintaining several task-specific output layers, where the task-relevant parameters are optimized by the gradient from corresponding task loss, while task-irrelevant parameters are optimized by the gradient from all task losses. On the other hand, in soft parameter sharing, in soft parameters task has its own model with its own parameters. The distance between the parameters of the model is regularized, with the purpose to encouraging the parameters to be similar.
Multi-task learning is applied successfully in TTS field and acquires great achievement like [18].

2.3. Attention Mechanism

Attention is simply represented by a vector, often being the output of a dense layer using softmax function. The attention mechanism is always applied through a sequence-to-sequence (seq-to-seq) model, which allows the encoder to search all the information in original text sentence, and then generate a suitable spectrogram frame according to the current word being worked on and the context.
Most previous networks based on an encoder-decoders structure [19] employ an attention mechanism that can convert a sequence into another sequence of different lengths. The input text sentence read by the encoder transforms the input sequence of the vector x = [ x 1 , x 2 , , x n ] into a hidden representations sequence of vector h = [ h 1 , h 2 , , h n ] , which is more suitable for the attention mechanism. The most common approach is to employ an RNN, such that:
h t = f ( x t , h t 1 )
The decoder, which is a sequence-to-sequence model, generates the output sequence of a vector y = [ y 1 , y 2 , , y m ] conditioned on h. At each timestep t, the attention mechanism selects the hidden representations using the softmax similarity scores. Let q t denote the query of the output sequence at the t-th timestep, and π t { 1 , 2 , . . . , N } be a categorical latent variable that represents the selection among hidden representations according to the conditional distribution p ( π t | x , q t ) . The context vector derived from the input defined as:
c t = n = 1 N α t ( n ) h n
where α t ( n ) = p ( π t = n | h , q t ) . In most attention mechanism, p ( π t | h , q t ) is calculated as:
e t , i = v T tanh ( W y t + V h i + b )
α t ( n ) = exp ( e t , n ) / m = 1 N exp ( e t , m )

3. Proposed Method

3.1. Estimated Network

In this section, we first proposed an estimated network (Es-Network), and then we discussed the motivation of Es-Network and why it works.
Most statistical speech synthesis models are optimized by minimizing the objection function with training corpus. The losses are expressed by the discrepancy between the predicted speech and the actual speech. In most cases, these models can be optimized using the loss gradient, and learn the distribution of the training set. However, the training corpus contains many <sentence, speech> pairs, and can exhibit different speech styles for the same word in different sentences. This means there is no absolute strong relationship between <sentence, speech> pairs. This situation is easy for a human to deal with, yet presents difficulties for machines. This is because generative models are essentially multi-classification models, and these one-to-many training pairs will confuse a model and result in it dropping information on the details of speech. Models learn a roughly average distribution from these <sentence, speech> pairs, and the miss of detail information leads to an over-smoothness problem.
Despite it being inevitable that models are trained on such a corpus, we fortunately found a way to make a model focus more on learning the ’individual features’ (e.g., the speech content) of speech rather than ’general features’ (e.g., noise), to reduce the effect of the over-smoothness problem. Considering raw speech to consist of general and individual features, the general features contain general information shared by most speech in training corpus, while in contrast the individual features contain specific information. During training, the general features are more ’attractive’ to models, which leads to individual feature learning being ignored. We found that the absence of the individual features of speech results in a decrease in quality of predicted speech. Therefore, we want models to focus more on learning individual features.
To resolve the problem, we employed a group of randomly initialized learnable prototype vectors [ q ^ 1 , q ^ 2 , . . . , q ^ n ] , called estimated tokens, to estimate the query vector q t , where n is the heads number of estimated tokens and the dimensions of each estimated token q ^ i are the same as q t . To abstract the general features from raw speech, similar to most attention mechanisms, we compute estimated outputs q ^ t by calculating the weighted sum of these estimated tokens:
q ^ t = i = 1 n e t , i q ^ i
where the weight e t , i of each annotation q ^ i is computed by:
e t , i = v T tanh ( W q t + V q ^ i + b )
Unlike in the vector quantization (VQ) [20] method, we do not employ one closet vector to represent q t , but using the weighted sum of these estimated tokens to estimate q t . These estimated tokens are optimizing by minimizing estimated loss L e s , which represents the discrepancy between query vector q t and estimated output q ^ t to second-order:
L e s = ( q t q ^ t ) 2
In TTS, the query vector q t P s p consists of a frame of the target spectrogram of the target spectrogram y = [ q 1 , q 2 , . . . , q t ] at time t. Every vector in the set of estimated outputs q ^ t P e s ( q ^ 1 , q ^ 2 , . . . , q ^ n ) is correlated with all the others, making these vectors similar to each others. The limitation of the head numbers of estimated tokens restricts the capability of estimated network. Therefore, the estimated tokens prefer to preserve general rather than individual features to minimize estimated loss L e s . Thus, we can employ Es-Network to abstract general features from raw speech.
We also tried an auto-encoder-based network to abstract general features. The structure of the token-based estimated network and the Auto-Encoder based estimated network are illustrated in Figure 1, and a comparison of the results of these two networks is presented in Figure 2.
As can be observed from the results, the auto-encoder-based estimated network has a stronger capability than the token-based estimated network, in that the estimated output q ^ t of auto-encoder-based network contained more details than the that of the token-based network. However, this is undesirable for abstracting precise mel spectrograms residual, and so we adopted token-based estimated network in this work.

3.2. Multi-Task Tacotron 2 with Pre-Trained Estimated Network

In this section, we describe the multi-task Es-Tacotron2 and discuss why Es-Tacotron2 can synthesize more natural speech than the original Tacotron 2. The architecture of Es-Tacotron2 model is illustrated in Figure 3.
The Original Tacotron 2 takes a character sequence as input, and outputs the corresponding speech. The model consists of two components: (1) a recurrent sequence-to-sequence feature prediction network with attention mechanism, which predicts mel spectrogram frame sequences from an input character sequence; and (2) a modified version of WaveNet that synthesizes time-domain waveform samples conditioned on predicted mel spectrogram frame sequence.
There are two prediction tasks for the feature prediction network. The first and main task is to predict the mel spectrogram from the given input character sequence, and the second is to calculate the ’stop token’, which allows the model dynamically determine the timestep at which to terminate the generation. From Figure 3, we can observe that the two tasks share the same ’projection input’ representation, which is the concatenation of the output of long short-term memory(LSTM) layer with the attention context vector, to conduct different task.
However, because Tacotron 2 is a statistical model, and it is difficult for main task to capture the individual features, the miss of the individual features will degrade the quality of speech synthesized by WaveNet, and lead to an over-smoothness problem. Therefore, the task of predicting individual features is essential for Tacotron 2, such that the model pays more attention to individual features learning. To resolve this problem, we set the residual prediction of the mel spectrogram as a third task of Tacotron 2, to assist with the model generating.
The network is composed of an encoder and a decoder with attention mechanism. The input characters sequence is represented by a learned 512-dimensional character embedding, which is passed through a stack of 3 convolutional layers, followed by batch normalization and ReLU activations. Then, the output of the final convolutional layer is passed into a bi-directional LSTM layer containing 512 units to generate the encoder features. In Tacotron 2, it uses the location-sensitive attention mechanism to use cumulative attention weights to calculate the context vector. The decoder is an autoregressive recurrent neural network which predicts a mel spectrogram from the encoded input sequence one frame at a time. The prediction from the previous timestep is first to pass through a pre-net, which contains two fully connected layers of 256 hidden ReLU units. The output of pre-net and attention context vector are then concatenated and passed through a stack of two uni-directional LSTM layers with 1024 units. The concatenation of the LSTM output and attention context vector is projected through three different linear transforms to predict the target spectrogram frame, stop token, estimated residual respective. Next, the predicted mel spectrogram is passed through a 5-layer convolutional post-net which predicts a residual to add to the prediction to improve the overall reconstruction. Finally, the predicted mel spectrogram is transformed into waveforms by modified WaveNet. Please refer to [2] to get more Tacotron 2 structure details.
Next, we will describe the training step of Es-Tacotron2.
First, we pre-train the Es-Network, by minimizing the estimated loss L e s as:
L e s = ( Y Y e s ) 2
and we calculate the estimated residual Y r e = ( y r e 1 , y r e 2 , . . . , y r e n ) as:
Y r e = Y Y e s
where Y = ( y 1 , y 2 , . . . , y T ) is the target mel spectrogram and Y e s is the estimated mel spectrogram.
The next step is to train the Tacotron 2 model. As in Tacotron 2, the network is composed of an encoder and decoder. The encoder converts a character sequence X = [ x 1 , x 2 , , x n ] into a hidden feature representation sequence h = ( h 1 , . . . , h L ) as:
h = E n c o d e r ( X )
which is then consumed by a location-sensitive attention network to summarize the encoded sequence as a fixed-length context vector for each decoder output step. The decoder predicts a mel spectrogram Y = ( y 1 , y 2 , . . . , y T ) from the encoded input sequence one frame at a time. The decoder calculates the attention context vector c t at timestep t:
c t = A t t e n t i o n ( l t , h , α t 1 )
l t = ψ p r e + l s t m ( y t 1 , c t 1 )
where α t 1 is the attention vector of timestep t 1 and l t is output of the LSTM layers of timestep t.
The main task is to predict the mel spectrogram frame y t from the concatenation of context vector c t and LSTM layers output l t :
y t = f m a i n ( c t , l t )
The second task is to predict the ’stop token’ S = ( s 1 , s 2 , . . . , s t ) :
s t = f s e c ( c t , l t )
We set the prediction of estimated residual of the target mel spectrogram as the third task:
y r e t = f t h i ( y t )
Then, the predicted mel spectrogram Y is simply passed through a 5-layers convolutional post-net, which predicts a residual to improve the overall reconstruction:
Y = Y + ψ p o s t ( Y )
The model is optimized by minimizing the summed mean squared error (MSE) for following objection function:
min L m o d e l = L m a i n + L s e c + L t h i + L r e = ( Y Y ) 2 + ( S i g m o i d ( S ) S i g m o i d ( S ) ) 2 + ( Y r e Y r e ) 2 + ( Y Y ) 2
At last, a modified WaveNet is adopted as the neural vocoder to transform the predicted mel spectrogram into corresponding waveform samples.
Unlike the original Tacotron 2, the Es-Tacotron2 contains an additional estimated residual prediction task. The layer of residual prediction predict the estimated residual from before predicted mel spectrogram. The loss of the estimated residual constrain the predicted mel spectrogram to own more individual features. These individual features is beneficial to the post-net to improve mel spectrogram reconstruction.

4. Experience

4.1. Initialization

Tacotron 2 and the Es-Network were trained using Adam optimizer with β 1 = 0 . 9 , β 2 = 0 . 999 , ε = 10 6 and a learning rate of 10 3 , decaying exponentially to 10 5 starting from 50,000 iterations. We employ an internal US English dataset [1], which contains 24.6 h of speech from a single professional female speaker, sampled at frequency of 16 kHz. We employ 80 filter-band log mel-scale spectrogram with Hann windowing, a 50 ms frame length, 12.5 ms frame shift, and 1024-point Fourier transform. We train using a batch size of 32, distributed on a single TITANx GPUs with synchronous updates, using r = 2 (output layer reduction factor) for the MOS results. Since the focus of our study is to validate the effectiveness of the Es-Network, we follow the same hyper-parameters setting of Tacotron 2 as [2] .
To pre-train the Es-Network, we set n = 5 (the heads number of estimated tokens) and d = 80 (dimension of estimated tokens: the same as the number of filters of the mel spectrogram) with a truncated normal distribution initialization. And we discuss the effect of heads number in the Section 4.4. We then performed 10,000 optimization steps to train the Es-Network.
Next, we trained Tacotron 2 on the ground truth mel spectrogram, and estimated residual from the Es-Network using the teacher-forcing technique to help the network to learn the alignment. We applied L 2 regularization with weight 10 6 . In this work, we performed 200,000 optimization steps to train the Tacotron 2 model.

4.2. Objective Evaluation

We adopt the original Tacotron 2 as the baseline to generate mel spectrogram from the input sentence symbols. The synthesized mel spectrogram rescaled to 4 to 4 ranges and saved as image.
We first compare the results synthesized by original Tacotron 2 and Es-Tacotorn2 in teacher-forcing mode. In this test, we employed the ground-truth output from the prior timestep as the input of current timestep. We present a comparison of the natural mel spectrogram, the mel spectrogram synthesized by original Tacotron 2, and that synthesized by the proposed Es-Tacotron2 model in Figure 4. This comparison shows that the synthesized mel-spectrograms peaks for Es-Tacotron2 are shaper and contain more details than those synthesized by original Tacotron 2. The corresponding spectrum sequence of synthesized spectrogram is shown in Figure 5.
Next we compare the results synthesized by original Tacotron 2 and Es-Tacotron2 without teacher-forcing mode, as shown in Figure 6. We note that in this mode, the duration of natural mel spectrogram ere different from those of generated ones. The comparison of these spectrum sequences is presented in Figure 7. We find that the mel spectrogram synthesized by Es-Tacotron2 is again shaper than that of the original Tacotron 2.

4.3. Subjective Evaluation

We randomly selected 200 sentences from the Bible, and synthesized speech using these models. These synthesized speeches were evaluated for naturalness with several groups of preferences. Ten naive listeners were asked to listen the speech of these sentences synthesized by the two compared models evaluated at random. In each preference test, the listeners were asked to judge whether one speech in each pair had superior naturalness or express no preference.
We first compared the speech synthesized by the original Tacotron 2 with of Es-Tacotron2 using Griffin-Lim algorithm, which transfers linear spectrograms into waveforms. The comparison results are presented in Table 1. As expected, Es-Tacotron2 synthesized better quality speech than the original Tacotron 2. That is, Es-Tacotron2 achieved a 67.5% preference, while the original Tacotron 2 achieved 14.0%. We note that Es-Tacotron2 can generate more stable alignment, which also contributes to better quality speech, as shown in Figure 8. One possible reason for this is that the residual prediction task made models generate more specific mel spectrogram frame containing more individual features, which is important for attention mechanism to calculate exact attention vector in the next timestep.
However, we also notice that the speech synthesized by Es-Tacotron2 using WaveNet exhibits no significant improvement than original Tacotron 2 in terms of naturalness. This may be because of the powerful ability of WaveNet, which recurrently autoregressive synthesizes waveform samples. Thus, the naturalness gap is narrowed for the high-quality speech generated by WaveNet.

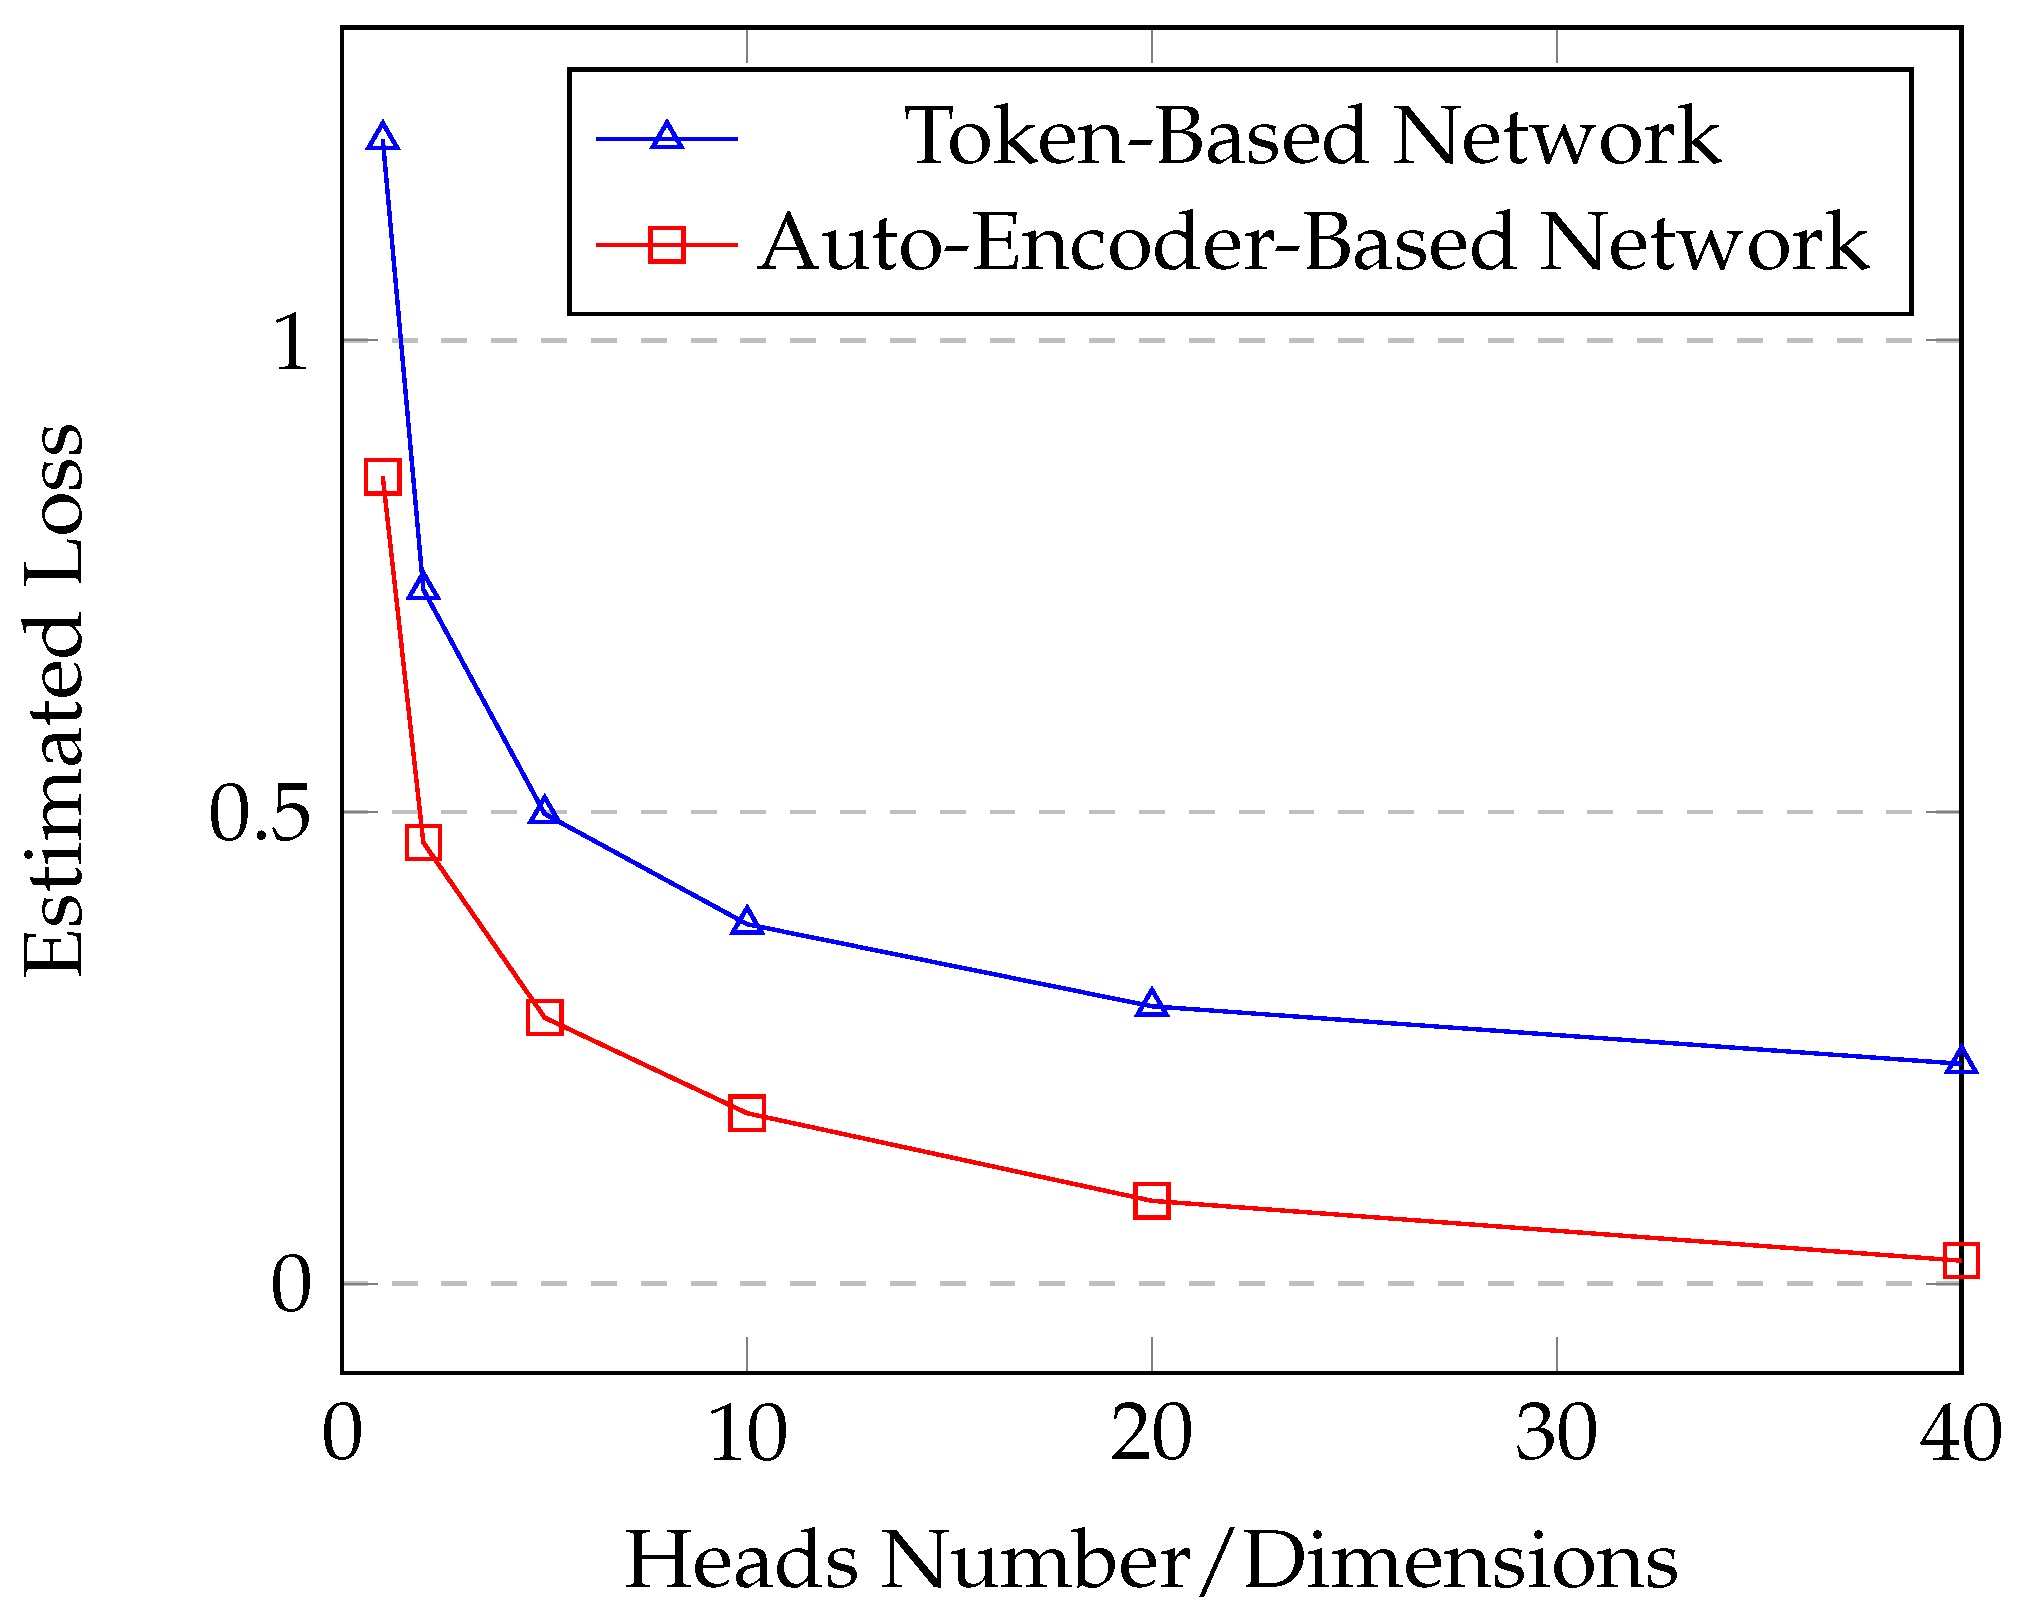
4.4. Effect of Heads Number n of the Es-Network

In this section, we discuss the effect of different heads numbers n to estimated mel spectrograms. As shown in Figure 9, we first exhibit the averaged estimated loss of the Es-Network with different heads number n. With the increasing of n, the loss is decreasing into a small number. As introduced in Section 3.1, it is obvious that the increase of n improve the capability of the Es-network, which allows the network to capture more individual features for reducing the estimated loss.
In order to measure the average distance between the estimated spectrogram and the estimated residual with the original spectrogram, we introduce three statistics: average cross-entropy (aCE), average Cosine similarity (aCos) and average variance (aVar). To calculate aCE of estimated and ground-truth spectrogram, these two spectrograms first rescaled to 0 to 1 range by Sigmoid function and then calculate the average of cross entropy of all estimated and original spectrogram frame. The aCos is similar to aCE but no need the rescaling. The aVar is the mean of the variance of every frame of the spectrogram. All statistic results are shown in Table 2. The aCE of the estimated spectrogram is decreasing and the aCos is increasing as the heads number of Es-Network increase, which means the estimated spectrogram contains more individual features and become more similar to the original spectrogram. However, the estimated residual is different, of which the aCE is increasing as the heads number increase while the aCos has a max value when n = 5 . This may be because the aCos is more sensitive to noise than aCE, and the Es-Network is unable to output a variable spectrogram which is more like noises when the heads number less than 5. We simply adopt aVar to evaluate the average information amount of every estimated residual frame.
We notice that the increase of n does not significantly improve the quality of the edges of the estimated mel spectrogram when heads number greater than 5. The comparison of these estimated mel spectrograms can be observed in Figure 10. This may be because these edges are difficult for the token-based network to capture. In contrast to the auto-encoder-based networks, the token-based network applies the weighted sum of the estimated tokens to acquire estimated output. However, each token only can remember some portions of the mel spectrogram features and learns an averaged distribution from these features. Besides, the original mel spectrogram is complicated that is generated by so many variables, and these tokens unable to capture all these variables distributions. This is the reason the mel spectrogram generated by the token-based network is extremely blurry. In contrast, the auto-encoder-based network learning a relationship between the hidden representation and the input with the representation and with the output. The neural network is expert to deal with such learning task. Therefore, the estimated loss of the auto-encoder-based network has significantly decreased with the increase of the capability of the network.
From what has been discussed above, we reasonably conclude that it is hard for the Es-Network to acquire the estimated spectrogram which contains abundant meanwhile exact individual features. Therefore, we make the trade-off and set heads number n = 5 in this paper.

5. Conclusion

In this paper, we have proposed a new neural network, called estimated network (Es-Network), to obtain the estimated residual of a mel spectrogram. We set the residual prediction as a third task for Tacotron 2, to reduce over-smoothness problem. We found that when statistical models learn a target distribution, they tend to focus more on the general features than individual features containing information on mel spectrogram details, which can significantly decrease the loss of objection function. Therefore, we employed Es-Network to obtain the estimated residual of mel spectrogram, and found the task of learning estimated residual can help the Tacotron 2 to learn more clear alignments and generate higher quality speeches.
However, the Es-Network cannot absolutely separate the general and individual features of the original speech. The estimated residual still miss some information on individual features, which is detrimental for models to generate natural speech. On the other hand, Es-Tacotron2 alleviates the over-smoothness problem, but cannot fundamentally solve it. In future work, we plan to derive a more powerful Es-Network structure and a more suitable modeling approach to utilize the estimated residual to obtain high-quality speech.

Author Contributions

Y.L. designed, wrote the paper and did the experiments, J.Z. supervised the work and offered financial support. All authors have read and approved the final manuscript.

Funding

This work is supported by the National Natural Science Foundation of China (Grant No. 61379109, M1321007) and Science and Technology Plan of Hunan Province (Grant No. 2014GK2018, 2016JC2011).

Acknowledgments

This work is supported by the Funding above. Authors would like to thank anonymous reviewers for the valuable comments and feedbacks. Moreover, the implement of the Tacotron 2 in this work can be acquired from https://github.com/Rayhane-mamah/Tacotron-2/, thanks for the awesome codes. And express my gratitude to Longxiang Cheng and Kamal Al-Sabahi. Best wishes to all my friends in the 113-2 Lab and the Deep Sound CO., LTD.

Conflicts of Interest

The authors declare no conflict of interest.

References

  1. Wang, Y.; Skerry-Ryan, R.; Stanton, D.; Wu, Y.; Weiss, R.J.; Jaitly, N.; Yang, Z.; Xiao, Y.; Chen, Z.; Bengio, S.; et al. Tacotron: Towards End-to-End Speech Synthesis. Proc. Interspeech 2017. [Google Scholar] [CrossRef]
  2. Shen, J.; Pang, R.; Weiss, R.J.; Schuster, M.; Jaitly, N.; Yang, Z.; Chen, Z.; Zhang, Y.; Wang, Y.; Skerrv-Ryan, R.; et al. Natural TTS Synthesis by Conditioning Wavenet on MEL Spectrogram Predictions. In Proceedings of the 2018 IEEE International Conference on Acoustics, Speech and Signal Processing (ICASSP), Calgary, AB, Canada, 12–17 May 2018; pp. 4779–4783. [Google Scholar] [CrossRef]
  3. Nguyen, G.N.; Phung, T.N. Reducing over-smoothness in HMM-based speech synthesis using exemplar-based voice conversion. EURASIP J. Audio Speech Music Proc. 2017, 2017, 14. [Google Scholar] [CrossRef]
  4. Toda, T.; Black, A.W.; Tokuda, K. Spectral conversion based on maximum likelihood estimation considering global variance of converted parameter. In Proceedings of the IEEE International Conference on Acoustics, Speech, and Signal Processing (ICASSP ’05), Philadelphia, PA, USA, 23–23 March 2005; Volume 1, pp. I-9–I-12. [Google Scholar]
  5. Toda, T.; Tokuda, K. A speech parameter generation algorithm considering global variance for HMM-based speech synthesis. IEICE Trans. Inf. Syst. 2007, 90, 816–824. [Google Scholar] [CrossRef]
  6. Nghia, P.T.; Van Tao, N.; Huong, P.T.M.; Diep, N.T.B.; Hien, P.T.T. A Measure of Smoothness in Synthesized Speech. REV J. Electr. Commun. 2016, 6. [Google Scholar] [CrossRef]
  7. Goodfellow, I.; Pouget-Abadie, J.; Mirza, M.; Xu, B.; Warde-Farley, D.; Ozair, S.; Courville, A.; Bengio, Y. Generative Adversarial Nets. In Advances in Neural Information Processing Systems 27; Ghahramani, Z., Welling, M., Cortes, C., Lawrence, N.D., Weinberger, K.Q., Eds.; Curran Associates, Inc.: Red Hook, NY, USA, 2014; pp. 2672–2680. [Google Scholar]
  8. Michelsanti, D.; Tan, Z.H. Conditional Generative Adversarial Networks for Speech Enhancement and Noise-Robust Speaker Verification. arXiv 2017, arXiv:1709.01703. [Google Scholar]
  9. Sheng, L.; Pavlovskiy, E.N. Reducing over-smoothness in speech synthesis using Generative Adversarial Networks. arXiv 2018, arXiv:1810.10989. [Google Scholar]
  10. Donahue, C.; McAuley, J.; Puckette, M. Adversarial Audio Synthesis. arXiv 2018, arXiv:1802.04208. [Google Scholar]
  11. Van den Oord, A.; Dieleman, S.; Zen, H.; Simonyan, K.; Vinyals, O.; Graves, A.; Kalchbrenner, N.; Senior, A.; Kavukcuoglu, K. WaveNet: A Generative Model for Raw Audio. arXiv 2016, arXiv:1609.03499. [Google Scholar]
  12. Arik, S.O.; Chrzanowski, M.; Coates, A.; Diamos, G.; Gibiansky, A.; Kang, Y.; Li, X.; Miller, J.; Ng, A.; Raiman, J.; et al. Deep Voice: Real-time Neural Text-to-Speech. arXiv 2017, arXiv:1702.07825. [Google Scholar]
  13. Gibiansky, A.; Arik, S.; Diamos, G.; Miller, J.; Peng, K.; Ping, W.; Raiman, J.; Zhou, Y. Deep Voice 2: Multi-Speaker Neural Text-to-Speech. In Advances in Neural Information Processing Systems 30; Guyon, I., Luxburg, U.V., Bengio, S., Wallach, H., Fergus, R., Vishwanathan, S., Garnett, R., Eds.; Curran Associates, Inc.: Red Hook, NY, USA, 2017; pp. 2962–2970. [Google Scholar]
  14. Ping, W.; Peng, K.; Gibiansky, A.; Arik, S.O.; Kannan, A.; Narang, S.; Raiman, J.; Miller, J. Deep Voice 3: Scaling Text-to-Speech with Convolutional Sequence Learning. arXiv 2017, arXiv:1710.07654. [Google Scholar]
  15. Bradbury, J.; Merity, S.; Xiong, C.; Socher, R. Quasi-Recurrent Neural Networks. arXiv 2016, arXiv:1611.01576. [Google Scholar]
  16. Sotelo, J.; Mehri, S.; Kumar, K.; Santos, J.F.; Kastner, K.; Courville, A.; Bengio, Y. Char2wav: End-to-end speech synthesis. In Proceedings of the ICLR 2017 Workshop, Toulon, France, 24–26 April 2017. [Google Scholar]
  17. Caruana, R. Multitask Learning. Mach. Learn. 1997, 28, 41–75. [Google Scholar] [CrossRef]
  18. Gu, Y.; Kang, Y. Multi-task WaveNet: A Multi-task Generative Model for Statistical Parametric Speech Synthesis without Fundamental Frequency Conditions. arXiv 2018, arXiv:1806.08619. [Google Scholar]
  19. Sutskever, I.; Vinyals, O.; Le, Q.V. Sequence to Sequence Learning with Neural Networks. In Advances in Neural Information Processing Systems 27; Ghahramani, Z., Welling, M., Cortes, C., Lawrence, N.D., Weinberger, K.Q., Eds.; Curran Associates, Inc.: Red Hook, NY, USA, 2014; pp. 3104–3112. [Google Scholar]
  20. Gray, R. Vector quantization. IEEE ASSP Mag. 1984, 1, 4–29. [Google Scholar] [CrossRef]
Figure 1. The comparison of different structure of Es-Network. (a) The structure of the token-based network; (b) The structure of the auto-encoder-based network.
Information 10 00131 g001
Figure 2. An example of mel spectrogram of the original speech, estimated mel spectrogram and estimated residual. (a) The mel spectrogram synthesized by the Es-Network; (b) The mel spectrogram synthesized by auto-encoder-based network.
Information 10 00131 g002
Figure 3. The structure of Es-Tacotron2.
Information 10 00131 g003
Figure 4. An example of spectral segment for synthesized spectrogram from the natural mel spectrogram (left); original Tacotron 2 synthesized mel spectrogram (middle); and Es-Tacotron2 synthesized mel spectrogram (right) with teacher-forcing mode.
Information 10 00131 g004
Figure 5. The spectrum sequence of synthesized spectrogram by original Tacotron 2, synthesized spectrogram by Es-Tacotron2 and natural spectrogram with teacher-forcing mode. Please note that all spectrum sequences samples synthesized spectrogram at 1 15 sampling rate.
Information 10 00131 g005
Figure 6. An example of spectral segment for synthesized spectrogram from the natural mel spectrogram (left); original Tacotron2 synthesized mel spectrogram (middle); and Es-Tacotron2 synthesized mel spectrogram (right) without teacher-forcing mode.
Information 10 00131 g006
Figure 7. The spectrum sequence of synthesized spectrogram by original Tacotron 2, synthesized spectrogram by Es-Tacotron2 model and natural spectrogram without teacher-forcing mode.
Information 10 00131 g007
Figure 8. The alignment comparison of original Tacotron 2 and Es-Tacotron2 with a sentence “had the oddest effect the work was beautifully executed”.
Information 10 00131 g008
Figure 9. The averaged estimated loss with different heads number/dimensions.
Information 10 00131 g009
Figure 10. The estimated mel spectrogram and corresponding estimated residual with different heads number n.
Information 10 00131 g010
Table 1. Average preference scores (%) on naturalness. “N/P” stands for no preference.
VocoderTacotron 2Es-Tacotron2N/P
Griffin-Lim14.067.518.5
WaveNet18.533.548.0
Table 2. Statistic about the estimated spectrogram and estimated residual of different heads number. “Es-Spec” and “Es-Res” stands for estimated spectrogram and estimated residual respective.
Heads NumberaCEaCosaVar
Es-SpecEs-ResEs-SpecEs-Res
128.768.780.7341 0 . 4333 0.3741
225.799.950.8519 0 . 4372 0.2441
524.4110.680.8916 0 . 4408 0.1769
1023.4611.150.9109 0 . 4259 0.1477
2022.8511.500.9212 0 . 3999 0.1250
4022.5011.910.9345 0 . 3760 0.0997

