Article

Related Stocks Selection with Data Collaboration Using Text Mining †

1
Department of Systems Innovation, Faculty of Engineering, The University of Tokyo, 7-3-1 Hongo, Bunkyo-ku, Tokyo 113-8656, Japan
2
Department of Systems Innovation, School of Engineering, The University of Tokyo, 7-3-1 Hongo, Bunkyo-ku, Tokyo 113-8656, Japan
3
Quantitative Investment Department, Daiwa Asset Management Co. Ltd., 1-9-1 Marunouchi, Chiyoda-ku, Tokyo 100-6753, Japan
4
Frontier Technologies Research & Consulting Deptartment, Daiwa Institute of Research Ltd., 15-6 Fuyuki, Koto-ku, Tokyo 135-8460, Japan
*
Author to whom correspondence should be addressed.
This paper is an extended version of our paper published in the 18th IEEE International Conference on Data Mining Workshops (ICDMW 2018), Singapore, 17–20 November 2018.
Information 2019, 10(3), 102; https://doi.org/10.3390/info10030102
Submission received: 23 January 2019 / Revised: 17 February 2019 / Accepted: 4 March 2019 / Published: 7 March 2019
(This article belongs to the Special Issue MoDAT: Designing the Market of Data)

Abstract

:
We propose an extended scheme for selecting related stocks for themed mutual funds. This scheme was designed to support fund managers who are building themed mutual funds. In our preliminary experiments, building a themed mutual fund was found to be quite difficult. Our scheme is a type of natural language processing method and based on words extracted according to their similarity to a theme using word2vec and our unique similarity based on co-occurrence in company information. We used data including investor relations and official websites as company information data. We also conducted several other experiments, including hyperparameter tuning, in our scheme. The scheme achieved a 172% higher F1 score and 21% higher accuracy than a standard method. Our research also showed the possibility that official websites are not necessary for our scheme, contrary to our preliminary experiments for assessing data collaboration.

1. Introduction

An increasing number of individual investors have recently become involved with equity markets. Mutual funds are also becoming popular, especially in Japan. A mutual fund is a financial derivative and built by companies, such as mutual fund companies and insurance companies, and contains equities in its portfolio.
Although exchange traded funds (ETF), which are also a financial derivatives, are fixed regarding their constituents, fund managers can change a mutual fund based on its constituents. This means a mutual fund is controlled by fund managers who also determine the equities that are bought or sold in the portfolio.
Themed mutual funds are popular among Japanese individual investors. A themed mutual fund is a mutual fund having one specific theme such as health, robotics, or artificial intelligence (AI). Such a fund is aimed at obtaining high returns from the theme’s prosperity. For example, an AI fund should include assets related to AI such as stocks in NVIDIA, and if AI technologies further develop and AI becomes more widespread, these assets’ prices will increase.
To attract many customers, mutual fund companies have to develop, launch, and manage various types of themed mutual funds. However, building such funds is burdensome for fund managers.
The following is the procedure fund managers use to build themed funds: (a) selecting a theme for the fund; (b) selecting stocks related to the fund’s theme; (c) using some of the selected stocks to build a portfolio for asset management.
Selecting stocks related to the fund’s theme is quite difficult for fund managers because there is a huge number of stocks. Even in the Tokyo Stock Exchange alone there are over 3600 stocks. For themed mutual funds focusing only on Japanese stocks, fund managers need to search only Japanese stocks and their information (company information) to build funds. However, focusing on stocks from around the world is practically impossible. Even focusing only on Japanese stocks, selecting all related stocks is difficult for fund managers who are not familiar with a fund’s theme. In addition, there is a good chance of missing related stocks because of human errors or fund managers’ lack of knowledge for companies. So, to reduce the burden of fund managers and avoid missing promising stocks, a method selecting related stocks automatically is needed.
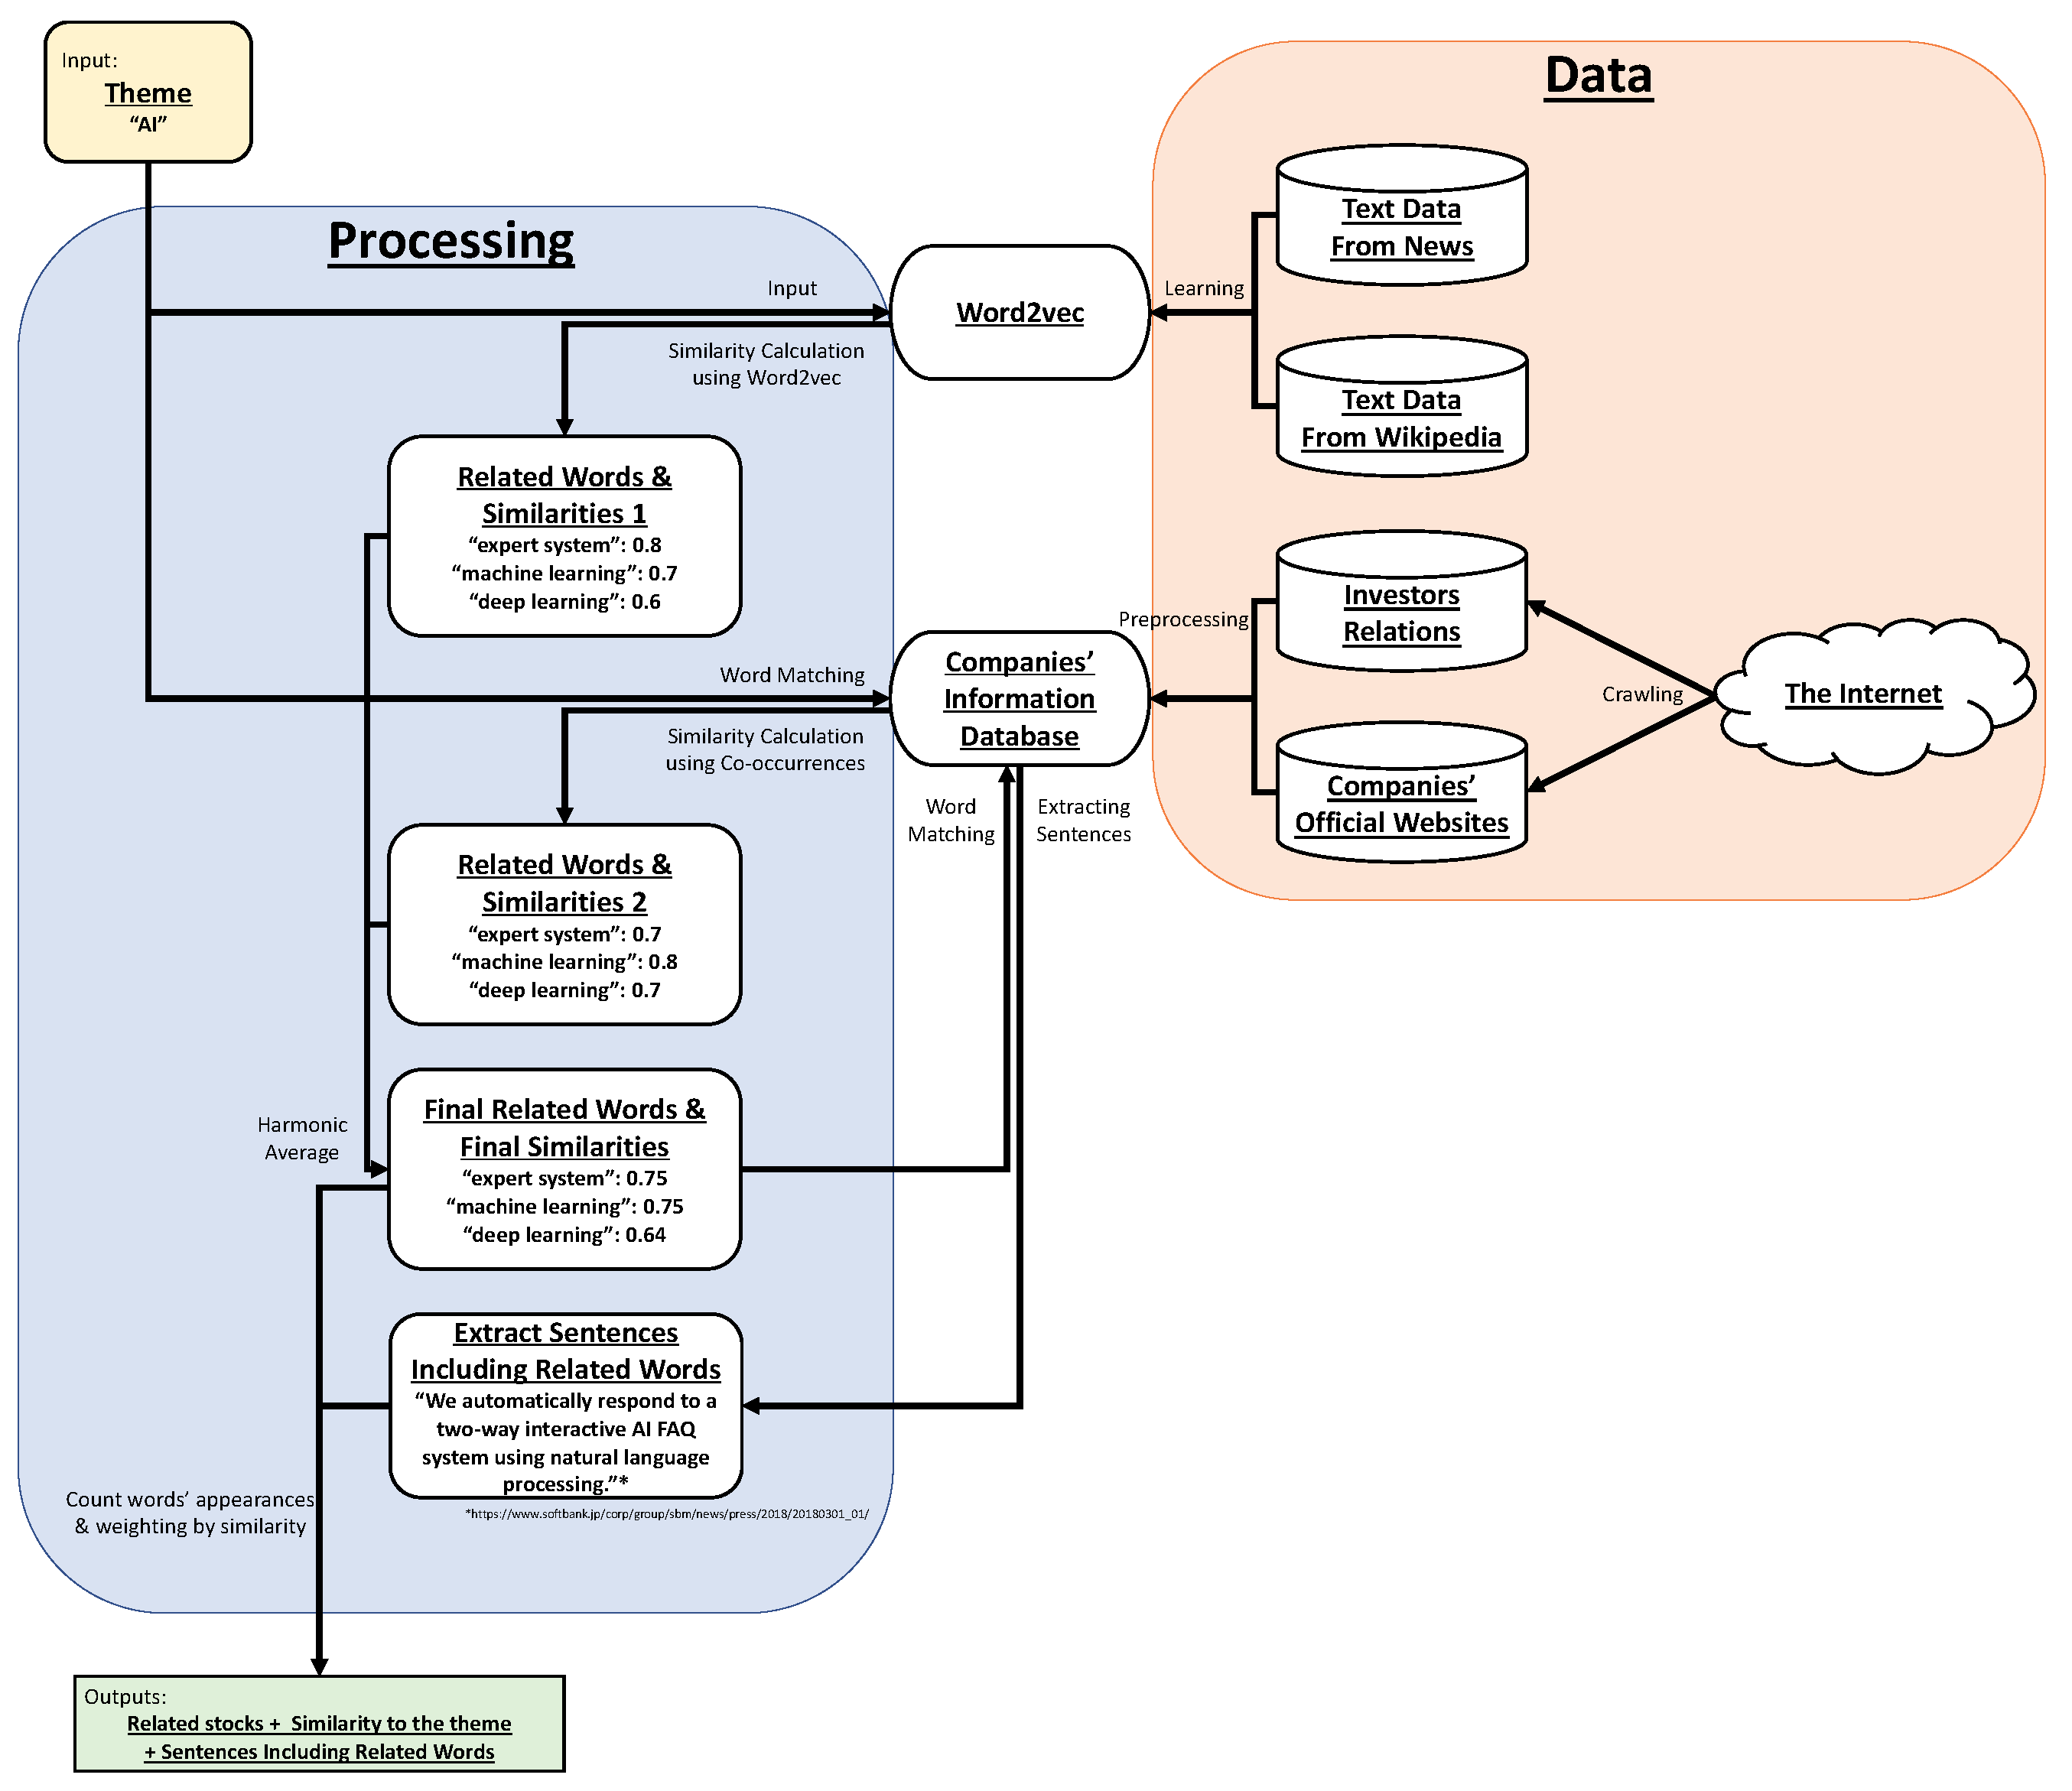
As the method, we propose a scheme extended from our previous scheme [1]. We developed the previous scheme to handle this task mainly using natural language processing (NLP). Details of this and the extended scheme are given in Section 2. The main contributions in this article are as follows: (a) extending our previous scheme, (b) creating ground truth data through collaboration with experienced fund managers and evaluating our scheme, (c) assessing the task difficulty from preliminary experiments, (d) hyperparameter tuning for our scheme, and (e) deeper analysis for data collaboration.

2. Our Extended Scheme: Related-Word-Based Stock Extraction Using Multiple Similarities

We now explain our scheme for selecting stocks related to a fund’s theme, which is an extension of our previous scheme [1]. By inputting a word for a fund’s theme in our scheme, a ranking of related companies appears with similarity scores and reasons for extracting each companies. The scheme outline is shown in Figure 1. In the following subsections, we explain each component of our extended scheme.

2.1. Word2vec Model and Similarities

After inputting a theme word, related words and their similarities are calculated using word2vec, which is a method proposed by Mikolov et al. [2] to translate words into vectors. Similarities are calculated using cosine similarity, which is calculated for two given words’ representative vectors v 1 , v 2 by the following equation:
( cosine similarity ) = v 1 · v 2 | v 1 | | v 2 | .
In this calculation, we used nine word2vec models with the following nine hyperparameter sets:
  • Fixed parameters (common in 9 sets):
    -
    Model: continuous bag of words (CBOW)
    -
    Number of negative examples: 25
    -
    Hierarchical softmax: not used
    -
    Threshold for occurrence of words: 1 × 10 - 4
    -
    Training iterations: 15
  • Unfixed Parameters (9 types: 3 types of dimensions × 3 types of word window sizes):
    -
    Dimensions: 200, 400, or 800
    -
    Word window size: 4, 8, or 12.
Using these nine word2vec models, the first type of similarities (it is called similarities 1 in followings) are calculated with the following definitions using w o r d i : the ith words in all vocabulary, M i : the ith word2vec model, c M j , w o r d i : cosine similarity between theme word and w o r d i in M j , s M j , w o r d i : similarity of w o r d i in M j , s 1 , w o r d i : similarity 1 for w o r d i . Note that the second of the following two calculation modes is new in this article.
  • topn mode: only using top-n words in each word2vec model
    s M j , w o r d i = c M j , w o r d i ( when the word s similarity is in topn . ) 0 ( when the word is not in topn similar words . )
  • thr. mode: only using words whose similarities are above threshold t
    s M j , w o r d i = c M j , w o r d i ( c M j , w o r d i t ) 0 ( c M j , w o r d i < t )
Then, using s M j , w o r d i defined above, s 1 , w o r d i is calculated by the following equation:
s 1 , w o r d i = 1 1 9 j = 1 9 1 s M j , w o r d i .
This equation means taking the harmonic average of similarities in all word2vec models. In addition, when s M j , w o r d i is 0, i.e., when w o r d i is not in the top-n similar words or when the similarity of w o r d i is below t, s 1 , w o r d i is also 0.
This ensembling is based on a previous study [3], in which they used multiple word2vec models with different settings for deciding whether two words are similar words or not by a majority vote of multiple results. However, we extended their study and use harmonic average newly since our previous study [1].
In our previous scheme [1], we used top-100 (topn mode) with no evidence. However, since we thought there are some possible parameters or modes, we extended this part of the scheme.

2.2. Calculation for Similarities Using Word Co-Occurrences

Two types of similarity calculation are used in our scheme. One is using word2vec explained in Section 2.1, and the second is using word co-occurrences, i.e., s 2 , w o r d i . Word2vec is a method focusing on context, so the results contain some inappropriate results for our task such as “Tokyo” and “New York”, which are quite similar in word2vec. To cancel out these results, we also use the second type of similarity calculation.
Such similarities are calculated in the following manner. Figure 2 shows an example for this calculation.
The first step involves selecting all companies whose information, e.g., investor relations (IRs) or official website we crawl via the Internet, includes the theme word. In the example in Figure 2, ten companies were selected for the word “AI”. The term “TYO: xxxx” means the ticker code of the companies on the Tokyo Stock Exchange. We call these ten companies a “master set”. The second step is almost the same as the first step. The difference is that the target word, which is searched in company information, is changed to w o r d i . This means we also select companies whose information includes w o r d i . In the same example, the w o r d 1 “NLP” is included in the information of five companies. We call these companies a “test set” for w o r d 1 . In the final step, s 2 , w o r d i are calculated with the following definition: precision of test set for w o r d i to the master set. For w o r d 1 “NLP”, only four companies in the test set are also included in the master set, so s 2 , w o r d 1 is 4 / 5 = 0.8 . Other calculations are the same, such as s 2 , w o r d 2 = 4 / 6 = 0.6667 .

2.3. Final Similarity Calculation & Final Related Words

Using the two types of similarity calculations, the final similarity F S w o r d i is calculated with the following equation:
F S w o r d i = 2 · s 1 , w o r d i · s 2 , w o r d i s 1 , w o r d i + s 2 , w o r d i .
This is just the harmonic average of s 1 , w o r d i and s 2 , w o r d i .
The final related words are then determined using F S w o r d i . There are four modes for determining which words are determined as final related words.
  • topn mode: using only top-n similar words as related words
  • thr. mode: using only words whose final similarity is above a threshold
  • hitxt mode: let e 1 be the number of companies that include the theme word in their information. Using the top k similar words, let e 2 , k be the total number of companies that include each top k similar words or the original theme word in their information. The smallest k that satisfies
    e 2 , k e 1 · x 1
    is then taken, and the top k similar words are adopted as related words in order from the top. Note that x 1 is a given hyperparameter.
  • hitxu mode: let e 1 be the number of companies that include the theme word in their information. Using the top k similar words and the theme word, let e 2 , k be the number of unique companies that include one or more of either the top k similar words or the original theme word in their information. The smallest k that satisfies
    e 2 , k e 1 · x 2
    is then taken, and the top k similar words are adopted as related words in order from the top. Note that x 2 is a given hyperparameter.
According to these modes, final related words are determined. In the following explanation, w o r d f 1 , w o r d f 2 , , w o r d f k represent final related words.
In our previous scheme [1], we used top-10 (topn mode) with no evidence. However, since we thought there are some possible parameters or modes, we also extended this part of the scheme.

2.4. Selecting Related Stocks and Calculation of Stock Similarities

In addition to w o r d f 1 , w o r d f 2 , , w o r d f k , let w o r d f 0 be the theme word and F S w o r d f 0 be set to 1. Under this condition, sentences of each company’s information including w o r d f 0 , w o r d f 1 , , w o r d f k are extracted and the number of appearances of each word by each company is counted. Then, the final similarity of each company C S is defined with the following equation:
C S = i = 0 k F S w o r d f i · c o u n t w o r d f i .
Note that c o u n t w o r d f i is the number of w o r d f i appearances. According to this equation, each company’s similarity to the theme is calculated and ranked.

3. Data and Preprocessing

We now describe the data we used for this study. We mainly used Japanese documents in our experiment because our first target to support fund managers is just Japanese asset markets. A unique preprocessing analysis for Japanese, such as morphological analysis, is needed to process Japanese sentences. We explain the data we used and the preprocessing we used below.

3.1. Data

In our scheme, we use various data for multiple aims. Roughly, these aims are divided into two types: word2vec training and company information. We give the details of these data below.
These data contain 1,809,736,365 words, 1,147,973 of which are unique.
  • For company information
    -
    IRs
    Dates: 9 October 2012–11 May 2018
    Number of files: 90,813 files (PDF format)
    Market domains: Tokyo, Sapporo, Nagoya, and Fukuoka stock exchanges
    Source: Japan Exchange Group’s Timely Disclosure Network (https://www.jpx.co.jp/equities/listing/tdnet/index.html)
    -
    Official websites
    Dates: 6 June 2018–25 June 2018
    Number of files: only 2,293,460 files (703,699 PDFs, 1,472,317 HTML files, and other formats)
    Market domains: Tokyo, Sapporo, Nagoya, and Fukuoka stock exchanges.
This company information was collected via the Internet.
In our scheme, therefore, these data are collaborating and making it possible to select stocks correctly related to a theme.

3.2. Preprocessing

As we mentioned at the beginning of this section, Japanese sentences require morphological analysis because there are no spaces between words. There are Japanese morphological analyzers such as KyTea [4] and JUMAN++ [5]. For our preprocessing, we use MeCab (version 0.996) as a Japanese morphological analyzer [6] (Available at http://taku910.github.io/mecab/) because MeCab is faster than the other morphological analyzers and the speed is crucial for processing a large amount of data. We also use NEologd as a Japanese dictionary for MeCab [7,8,9] that implements new words into MeCab’s default dictionary, improving the morphological performance of MeCab.
With MeCab and NEologd, all data are divided into morphemes and used.

4. Preliminary Experiments

We conducted two preliminary experiments. One was for assessing the difficulty of this task and selecting all stocks related to a theme. The other was for determining the impact of each piece of company information, i.e., IRs and official websites.

4.1. Cohen’s κ : Index of Task Difficulty

We used Cohen’s κ as an index for assessing task difficulty. Cohen’s κ was initially proposed as an index indicating the degree of agreement between two observers [10]. However, this indicator is used as an index for assessing task difficulty because when two people do the same task, the more difficult task decreases the agreement of their results. The original Cohen’s κ can be used for only two-classification tasks. However, weighted Cohen’s κ , an extension of Cohen’s κ , was proposed for multiple-classification tasks [11].
We first selected only 100 Japanese stocks from TOPIX 500 (TOPIX Core30 + TOPIX Large70 + TOPIX Mid400. These are disclosed in https://www.jpx.co.jp/markets/indices/topix/index.html). Four experienced fund managers then tagged whether all 100 companies were related to given themes. We used “beauty”, “child-care”, “robot”, and “amusement” as the given themes. This involves just a two-classification task (related or not related), but experienced fund managers also do a four-classification task. The tagging criteria for four-classification are as follows:
0.
Not Related
1.
It cannot be said that it is not related
2.
Part of the business of this company is related
3.
Related strongly and the main business of this company is related.
Using these criteria, we calculated Cohen’s κ for the two-category task and weighted Cohen’s κ for the four-category task between every pair of four experienced fund managers.

4.1.1. Results of Cohen’s κ for Two-Category Task

We now present the results of Cohen’s κ calculation for the two-category task: related or not related. Table 1 shows the Cohen’s κ for every pair of four experienced fund managers for the four themes (“FM” means fund manager).
This task was quite difficult even for experienced fund managers. Of course, some pairs of fund managers in certain themes resulted in a slightly better Cohen’s κ , but these values are not high enough considering these are the results from experienced fund managers. Therefore, deciding which companies are related to a theme is too difficult.

4.1.2. Results of Weighted Cohen’s κ for Four-Category Task

In addition to the two-category task, we calculated weighted Cohen’s κ for the four-category task. The results are listed in Table 2.
This results are almost the same as those for the two-category task, which means that the most challenging point in selecting stocks related to a theme is not how related the stocks are but whether the stocks are related.

4.2. Exact Matching Test for Two Types of Company Information

To check that there are differences between the two types of company information, i.e., IRs and official websites, we conducted another preliminary experiment.
The experiment involved matching the word “e-Sports” (electronic sports) to company IRs and official websites and counting how many companies have the word in their information. We chose “e-Sports” because it is quite a new word, so we have to check whether we had enough data for covering such new words.
Table 3 lists the results. Only a few companies were selected using IRs, but more were selected using official websites. There is always a chance of selecting the wrong companies, but focusing on covering all companies related to the theme instead of selecting only correct companies, not only using either IRs or official website data but using both should be appropriate for our task, i.e., supporting fund managers.

5. Experiments and Results

We used the same four themes (“beauty”, “child-care”, “robot”, and “amusement”) for collecting the response data from the four experienced fund managers. These data were almost the same as the data presented in Section 4.1. The fund managers classified 100 companies selected randomly from TOPIX500 into four categories. They also tagged their confidence level. i.e., if they were not confident in their classification, they could tag it as such.
Table 4 shows an example of the evaluation sheet for collecting the response data. As we mentioned in Section 4.1, this task was too complicated, so when only one fund manager thinks a stock was related, there is a good chance that other fund managers passed over the stocks as related. We devised the following criteria for collecting the response data. If, except for those who do not have confidence, one or more fund managers classified the stock into 1, 2, or 3, the stock is marked as “related”; rating a stock’s relation to a theme is calculated averaged rating, but only when there are fund managers who do not have confidence in their rating, their weights for average are set as 0.5.
Table 5 shows examples of converting fund managers’ evaluation data into response data. Stocks A and B are typical cases. All fund managers thought stock A was a stock related to a theme. Therefore, stock A was marked as a related stock in the response data. Stock B was also marked as a related stock in response data because one fund manager marked it as a related stock. As mentioned above, we marked stocks that only one fund manager thought was related to a theme because there is a good chance that other fund managers passed it over due to lack of information or human error. However, when only one fund manager who thought a stock was related was not confident that a stock was related, as with stock C, we did not mark the stock as a related stock in the response data. The difference between stocks C–F and stocks A and B is that those who did not have confidence in their evaluation were counted as half a person. However, stocks marked as “not confident” by fund managers were only 28 / 1200 = 2 . 3 % . In fact, stocks that more than one fund manager marked as “not confident”, i.e., stocks D–F, were not recorded in the fund managers’ evaluation data.

5.1. Evaluation of Extended Scheme Using Hyperparameters from Our Previous Study

We evaluated our proposed scheme using the same hyperparameters in our previous study [1]. There are two hyperparameters in our scheme. One is that in the word2vec ensemble phase discussed in Section 2.1. The other is that in the calculation of final similarity discussed in Section 2.3. In our previous study [1], we assumed the former is top-100 (mode1: topn) and the latter is top-10 (mode2: topn). Using these hyperparameters, we tested and calculated the precision, recall, and F1, the results of which are listed in Table 6.
According to the results, our scheme and hyperparameters in this test significantly depended on a theme. Therefore, we sought more robust hyperparameters.

5.2. Hyperparameter Tuning

We conducted experiments to determine more robust hyperparameters. We changed the data source, the mode and its hyperparameter in the word2vec ensembling phase in Section 2.1 (mode1 and hyperparamter1, respectively), and the mode and its hyperparameter in the calculation of final similarity in Section 2.3 (mode2 and hyperparameter2, respectively). Our tuning approach is like a grid search. Grids for each parameter are as follows:
  • Data Source: Only IRs, only official websites, and both IRs and official websites
  • Hyperparameter1 (details are given in Section 2.1):
    -
    mode1: topn; top-10, top-20, top-50, top-100, top-200, top-500, top-1000, top-2000
    -
    mode1: thr.; t = 0.3 , 0.4 , 0.5 , 0.6 , 0.7 , 0.8 , 0.9 , 1.0 (used in Equation (3))
  • Hyperparameter2 (details are given in Section 2.3):
    -
    mode2: topn; top-5, top-10, top-20, top-50, top-100, top-200, top-500, top-1000
    -
    mode2: thr.; thrshold is 0.3, 0.4, 0.5, 0.6, 0.7, 0.8, 0.9, or 1.0
    -
    mode2: hitxt; x 1 = 1.0 - 49.0 (step is 1.0; used in Equation (6))
    -
    mode2: hitxu; x 2 = 1.0 - 9.9 (step is 0.1; used in Equation (7))
We used 3 data-source patterns, 16 hyperparameter1 patterns, and 155 hyperparameter2 patterns and tested a total of 7440 patterns for each theme. We have already collected response data for beauty, child-care, robot, and amusement. We used the data from three of the themes, i.e., beauty, child-care, and amusement, for tuning and those from robot for testing.
We tested two types of indexes for the tuning parameter. We eventually used only one type, but we explain both below and then we explain why we used only one type.
One type is the series of precision, recall, and F1. Let A be the set of stocks tagged as related in our scheme’s result, and let B be the set of stocks tagged as related in the response data. Then, precision, recall, and F1 are defined by the following equations.
( Precision ) = | A B | | A |
( Recall ) = | A B | | B |
( F 1 ) = 2 · ( Precision ) · ( Recall ) ( Precision ) + ( Recall )
The other type of index is normalized discounted cumulative gain (NDCG). We used only 100 stocks for the test, so the index we used was NDCG@100. NDCG was proposed by Järvelin et al. [12,13]. We used the related stock ranking output from our scheme and rating from fund managers’ evaluations described at the beginning of this section. We first explain DCG for NDCG. Let G [ i ] be the rating for the ith ranked stocks in the results of our scheme. Thus, DCG is defined with the following equation:
D C G @ i = G [ 1 ] ( i = 1 ) D C G @ ( i - 1 ) + G [ i ] log 2 i ( otherwise ) .
Therefore, this equation can be written as the following equation when applied to our task:
D C G @ 100 = G [ 1 ] + i = 2 100 G [ i ] log 2 i .
However, when including the same ranking, i.e., the jth to kth ranked stocks have the same C S , we assume all these stocks are kth ranked. D C G p e r f e c t , which is the DCG when the result is perfect, is calculated. Then, NDCG is defined with the following equation:
N D C G = D C G D C G p e r f e c t .
We calculated precision, recall, F1, and NDCG for every set of hyperparameters and took their averages among the test data, i.e., for beauty, child-care, and amusement.
Table 7 and Table 8 list the results from hyperparameter tuning. Table 7 lists some of the results including only the top 20 F1, and Table 8 lists some of the results including only the top 20 NDCG. The averaged F1 for beauty, child-care, and amusement in Section 5.1 was only 0.7340, suggesting that at least hyperparameter tuning works. However, when the tuning target is NDCG, recall is too high. For a very high recall, there is a good chance to select most stocks as related stocks. Therefore, for addressing this problem, we also checked the statistical data.
Table 9 shows the correlation table among NDCG, precision, recall, and F1 for every theme. Regarding the results for beauty and amusement, correlations between NDCG and recall were very high. This means that our hyperparameter tuning based on NDCG tended to cause only higher recall instead of precision as a result. This tendency results in selecting all stocks as related stocks. If the ranking from our scheme is correct, there is no problem to support fund managers, and NDCG indicates how good the ranking is. However, if too much information or related stocks are shown for fund managers, fund managers’ load does not decrease. Therefore, we used only the results from hyperparameter tuning based on F1. We adopted the hyperparameter set whose data source was IR, hyperparameter1 is top-500 (mode1: topn), and hyperparameter2 is top-50 (mode2: topn).

5.3. Result for Test Data

Using the hyperparameters tuned above, we conducted a test for the test theme “robot”.
Table 10,Table 11 and Table 12 list the final results using test data and the result using a standard method; only using IR and matching “robot” for each company’s information. Although the precision of our scheme for the final results was a little lower than that of the standard method, there were significant differences in recall and F1.

6. Discussion

Our scheme was designed for supporting fund managers in selecting related stocks. This task was revealed to be very difficult (Section 4.1), even with our scheme. It is also not clear how correct our response data are. Therefore, it is difficult to estimate the accuracy of our scheme. According to the results in Table 12, our scheme works better than standard approaches.
According to the preliminary experiment discussed in Section 4.2, data from official websites seem to be beneficial in some respects. However, in our scheme, after hyperparameter tuning, data from official websites seem unnecessary according to Table 7 and Table 8. One possible reason is that the themes we used for tuning and testing are ordinary, and if we use other new theme words, such as “e-Sports”, we may obtain different results. Therefore, we will test other theme words for future work.
In our main experiments, we used a type of supervised method for hyperparameter tuning. However, this method requires more response data, and it has to be more correct. Under the condition that whether answer data is truly accurate or not is unclear, this type of method has its limitation. So, we have to use unsupervised, or at least semi-supervised, methods for hyperparameter tuning.
We can also extract the sentences including related words with our scheme, but we cannot yet use such information effectively. This information can be beneficial for fund managers to decide whether each stock is related to a theme. However, we cannot be sure how useful it is. Therefore, we will apply our scheme to fund managers’ real jobs and collaborate with fund managers to improve our scheme and hyperparameters.
There are other methods of using the sentences including related words. There are many methods to evaluate natural language sentences. Combining methods such as machine learning for NLP with our scheme, we can estimate how important these sentences can be. If we can connect these estimations with our scheme, we will be able to improve the accuracy of our scheme.

7. Related Work

Regarding text mining in the financial domain, Koppel et al. proposed a labeling method for classifying news stories as bad or good from companies’ stock price changes using text mining [14]. Low et al. proposed a semantic expectation-based knowledge extraction (SEKE) methodology for extracting causal relations from texts, such as news, and used an electronic thesaurus, such as WordNet [15], to extract terms representing market movement [16]. Schumaker et al. tested a machine learning method with different textual representations to predict stock prices using financial news articles [17]. Ito et al. proposed a text-visualizing neural network model to visualize online financial textual data and a model called gradient interpretable neural network (GINN) to clarify why a neural network model make the result in financial text mining [18,19]. Milea et al. predicted the MSCI EURO index (3 classes: up, down, and stay) based on the fuzzy grammar of European Central Bank (ECB) statement text [20]. Xing et al. proposed a method for building a semantic vine structure among companies on the US stock markets using text mining and extended this method by implementing the similarity between all pairs of vector representations of descriptive stock company profiles into an asset allocation task to reveal the dependence structure of stocks and optimize financial portfolios [21].
Regarding Japanese financial text mining, Sakai et al. proposed a method of extracting causal implying phrases from Japanese newspapers concerning business performance. This method uses clue words gathered automatically in their method like the bootstrapping method to obtain causal information [22]. Sakaji et al. proposed a method of automatically gathering basis expressions indicating economic trends from news articles using a statistical method [23]. Sakaji et al. proposed a method of automatically finding rare causal knowledge from financial statement summaries [24]. Kitamori et al. proposed a semi-supervised method for extracting and classifying sentences using a neural network in terms of business performance and economic forecasts from financial statement summaries [25].
The task in our study was a kind of recommendation task; our scheme recommends related stocks to fund managers. There have been many studies on recommendation tasks. The collaborative filtering approach is common recommendation task, and some studies have used it successfully in the early stage [26,27]. This approach was extended in many respects, and the stream for the general recommendation task became the item-based collaborative filtering [28]. De facto standard data sets have been created, and many studies have been conducted based on these data sets, such as [29]. However, these studies were based on human behavior on the site. Our works are not the same type and cannot be applied these approaches. On the other hand, our scheme can apply evaluation indexes for evaluating the ranking (recommendation) results. NDCG is a widely used evaluation index on recommendation; thus, we also used this index in our parameter tuning.

8. Conclusions

We proposed an extended scheme for selecting related stocks based on a theme. Through preliminary experiments, we showed how difficult this task is. We also conducted experiments, including hyperparameter tuning. Our scheme achieved a 172% higher F1 score and 21% higher accuracy than the standard method. Contrary to the preliminary experiments, if we tune hyperparameters correctly, company information from official websites may not be necessary for our scheme. However, this study heavily depended on theme words; therefore, further research is necessary.

9. Patents

We are applying for a patent in Japan based on this research.

Author Contributions

Conceptualization, M.H., H.S., S.K., K.I., H.M., S.N., and A.K.; methodology, M.H.; software, M.H.; validation, M.H.; formal analysis, M.H.; investigation, M.H.; resources, M.H., S.K., S.N., and A.K.; data curation, M.H., S.K., S.N., and A.K.; writing-original draft preparation, M.H.; writing-review and editing, M.H., H.S., and K.I.; visualization, M.H.; supervision, M.H., H.S., and K.I.; project administration, H.S., and K.I.; funding acquisition, H.S., K.I., and H.M.

Funding

This research was funded by Daiwa Securities Group.

Acknowledgments

We thank Uno, G.; Shiina, R.; Suda, H.; Ishizuka, T. and Ono, Y. from Daiwa Asset Management Co. Ltd. for participating in our interviews. In the process to make our scheme, we referred to a fund candidates list provided by Suda, H. We thank Takebayashi, M.; Kounishi, T.; Suda, H. and Shiina, R. for making evaluation data. We also thank Tsubone, N. from Daiwa Institute of Research Ltd. for supporting our meeting, Morioka, T. from Daiwa Institute of Research Ltd. for providing our communication tool, and Yamamoto, Y. from the School of Engineering, The University of Tokyo for assisting in our clerical tasks including scheduling.

Conflicts of Interest

The authors declare no conflict of interest. The funders had no role in the design of the study; in the collection, analyses, or interpretation of data; in the writing of the manuscript, or in the decision to publish the results.

References

  1. Hirano, M.; Sakaji, H.; Kimura, S.; Izumi, K.; Matsushima, H.; Nagao, S.; Kato, A. Selection of related stocks using financial text mining. In Proceedings of the 18th IEEE International Conference on Data Mining Workshops (ICDMW 2018), Singapore, 17–20 November 2018; pp. 191–198. [Google Scholar] [CrossRef]
  2. Mikolov, T.; Chen, K.; Corrado, G.; Dean, J. Efficient estimation of word representations in vector space. In Proceedings of the International Conference on Learning Representations (ICLR 2013), Scottsdale, AZ, USA, 2–4 May 2013; pp. 1–12. [Google Scholar] [CrossRef]
  3. Nagata, R.; Nishite, S.; Ototake, H. A method for detecting overgeneralized be-verb based on subject-compliment identification. In Proceedings of the 32nd Annual Conference of the Japanese Society for Artificial Intelligence (JSAI 2018), Kagoshima, Japan, 5–8 June 2018. (In Japanese). [Google Scholar]
  4. Neubig, G.; Nakata, Y.; Mori, S. Pointwise prediction for robust, adaptable Japanese morphological analysis. In Proceedings of the 49th Annual Meeting of the Association for Computational Linguistics: Human Language Technologies (ACL HLT 2011); Association for Computational Linguistics: Stroudsburg, PA, USA, 2011; pp. 529–533. [Google Scholar]
  5. Morita, H.; Kawahara, D.; Kurohashi, S. Morphological analysis for unsegmented languages using recurrent neural network language model. In Proceedings of the 2015 Conference on Empirical Methods in Natural Language Processing (EMNLP 2015), Lisbon, Portugal, 17–21 September 2015; pp. 2292–2297. [Google Scholar]
  6. Kudo, T.; Yamamoto, K.; Matsumoto, Y. Applying conditional random fields to Japanese morphological analysis. In Proceedings of the 2004 Conference on Empirical Methods in Natural Language Processing (EMNLP 2004), Barcelona, Spain, 25–26 July 2004. [Google Scholar]
  7. Toshinori, S. Neologism Dictionary Based on the Language Resources on the Web for Mecab. 2015. Available online: https://github.com/neologd/mecab-ipadic-neologd (accessed on 6 March 2019).
  8. Toshinori, S.; Taiichi, H.; Manabu, O. Operation of a word segmentation dictionary generation system called NEologd. In Information Processing Society of Japan, Special Interest Group on Natural Language Processing (IPSJ SIGNL 2016); Information Processing Society of Japan: Tokyo, Japan, 2016; p. NL-229-15. (In Japanese) [Google Scholar]
  9. Toshinori, S.; Taiichi, H.; Manabu, O. Implementation of a word segmentation dictionary called mecab-ipadic-NEologd and study on how to use it effectively for information retrieval. In Proceedings of the Twenty-three Annual Meeting of the Association for Natural Language Processing (NLP 2017); The Association for Natural Language Processing: Tokyo, Japan, 2017; p. NLP2017-B6-1. (In Japanese) [Google Scholar]
  10. Cohen, J. A coefficient of agreement for nominal scales. Educ. Psychol. Meas. 1960, 20, 37–46. [Google Scholar] [CrossRef]
  11. Cohen, J. Weighted kappa: Nominal scale agreement provision for scaled disagreement or partial credit. Psychol. Bull. 1968, 70, 213–220. [Google Scholar] [CrossRef] [PubMed]
  12. Jarvelin, K.; Kekalainen, J. IR evaluation methods for retrieving highly relevant documents. In Proceedings of the 23rd Annual International ACM SIGIR Conference on Research and Development in Information Retrieval (SIGIR ’00); ACM Press: New York, NY, USA, 2000; pp. 41–48. [Google Scholar] [CrossRef] [Green Version]
  13. Järvelin, K.; Kekäläinen, J. Cumulated gain-based evaluation of IR techniques. ACM Trans. Inf. Syst. 2002, 20, 422–446. [Google Scholar] [CrossRef] [Green Version]
  14. Koppel, M.; Shtrimberg, I. Good news or bad news? Let the market decide. In Computing Attitude and Affect in Text: Theory and Applications; Springer: Dordrecht, The Netherlands, 2006; pp. 297–301. [Google Scholar]
  15. Fellbaum, C. WordNet: An Electronic Lexical Database; The MIT Press: Cambridge, MA, USA, 1998. [Google Scholar]
  16. Low, B.T.; Chan, K.; Choi, L.L.; Chin, M.Y.; Lay, S.L. Semantic expectation-based causation knowledge extraction: A study on Hong Kong stock movement analysis. In Proceedings of the Pacific-Asia Conference on Knowledge Discovery and Data Mining (PAKDD 2001), Hong Kong, China, 16–18 April 2001; pp. 114–123. [Google Scholar]
  17. Schumaker, R.P.; Chen, H. Textual analysis of stock market prediction using breaking financial news: The AZFin text system. ACM Trans. Inf. Syst. 2009, 27, 12. [Google Scholar] [CrossRef]
  18. Ito, T.; Sakaji, H.; Tsubouchi, K.; Izumi, K.; Yamashita, T. Text-visualizing neural network model: Understanding online financial. In Proceedings of the 22nd Pacific-Asia Conference on Knowledge Discovery and Data Mining (PAKDD 2018), Melbourne, Australia, 3–6 June 2018; pp. 247–259. [Google Scholar] [CrossRef]
  19. Ito, T.; Sakaji, H.; Izumi, K.; Tsubouchi, K.; Yamashita, T. GINN: Gradient interpretable neural networks for visualizing financial texts. Int. J. Data Sci. Anal. 2018, 1–15. [Google Scholar] [CrossRef]
  20. Milea, V.; Sharef, N.M.; Almeida, R.J.; Kaymak, U.; Frasincar, F. Prediction of the MSCI EURO index based on fuzzy grammar fragments extracted from European Central Bank statements. In Proceedings of the 2010 International Conference of Soft Computing and Pattern Recognition, Paris, France, 7–10 December 2010; pp. 231–236. [Google Scholar] [CrossRef]
  21. Xing, F.; Cambria, E.; Welsch, R.E. Growing semantic vines for robust asset allocation. Knowl. Based Syst. 2018, 165, 297–305. [Google Scholar] [CrossRef]
  22. Sakai, H.; Masuyama, S. Extraction of cause information from newspaper articles concerning business performance. In Proceedings of the 4th IFIP Conference on Artificial Intelligence Applications & Innovations (AIAI 2007), Athens, Greece, 19–21 September 2007; pp. 205–212. [Google Scholar] [CrossRef]
  23. Sakaji, H.; Sakai, H.; Masuyama, S. Automatic extraction of basis expressions that indicate economic trends. In Proceedings of the Pacific-Asia Conference on Knowledge Discovery and Data Mining (PAKDD 2008), Osaka, Japan, 20–23 May 2008; pp. 977–984. [Google Scholar] [CrossRef]
  24. Sakaji, H.; Murono, R.; Sakai, H.; Bennett, J.; Izumi, K. Discovery of rare causal knowledge from financial statement summaries. In Proceedings of the 2017 IEEE Symposium on Computational Intelligence for Financial Engineering and Economics (CIFEr 2017), Honolulu, HI, USA, 27 November–1 December 2017; pp. 602–608. [Google Scholar] [CrossRef]
  25. Kitamori, S.; Sakai, H.; Sakaji, H. Extraction of sentences concerning business performance forecast and economic forecast from summaries of financial statements by deep learning. In Proceedings of the 2017 IEEE Symposium Series on Computational Intelligence (IEEE SSCI 2017), Honolulu, HI, USA, 27 November–1 December 2017; pp. 67–73. [Google Scholar] [CrossRef]
  26. Resnick, P.; Iacovou, N.; Suchak, M.; Bergstrom, P.; Riedl, J. GroupLens: An open architecture for collaborative filtering of netnews. In Proceedings of the 1994 ACM Conference on Computer Supported Cooperative Work (CSCW ’94); ACM Press: New York, NY, USA, 1994; pp. 175–186. [Google Scholar] [CrossRef]
  27. Shardanand, U.; Maes, P. Social information filtering: Algorithms for automating “Word of Mouth”. In Proceedings of the SIGCHI Conference on Human Factors in Computing Systems (CHI ’95); ACM Press: New York, NY, USA, 1995; pp. 210–217. [Google Scholar] [CrossRef]
  28. Sarwar, B.; Karypis, G.; Konstan, J.; Riedl, J. Item-based collaborative filtering recommendation algorithms. In Proceedings of the 10th International Conference on World Wide Web; ACM Press: New York, NY, USA, 2001; pp. 285–295. [Google Scholar] [CrossRef] [Green Version]
  29. Linden, G.; Smith, B.; York, J. Amazon.com recommendations: Item-to-item collaborative filtering. IEEE Int. Comput. 2003, 7, 76–80. [Google Scholar] [CrossRef]
Figure 1. Scheme outline. Artificial intelligence (AI) is used as an example input theme.
Information 10 00102 g001
Figure 2. s 2 , w o r d i calculation. “TYO: xxxx” means the ticker code of the companies on the Tokyo Stock Exchange. Here, s 2 , w o r d 1 = 4 / 5 = 0 . 8 and s 2 , w o r d 2 = 4 / 6 = 0 . 6667 .
Information 10 00102 g002
Table 1. Cohen’s κ for two-category task among four experienced fund managers.
(a) Beauty
FM 1FM 2FM 3FM 4
FM 1 0.28850.40310.5470
FM 2 0.35190.4206
FM 3 0.5761
Ave.0.4312
(b) Child-Care
FM 1FM 2FM 3FM 4
FM 1 0.04590.28020.6058
FM 2 0.01800.0927
FM 3 0.2318
Ave.0.2124
(c) Robot
FM 1FM 2FM 3FM 4
FM 1 0.47410.19040.4796
FM 2 0.32210.7385
FM 3 0.3389
Ave.0.4239
(d) Amusement
FM 1FM 2FM 3FM 4
FM 1 0.50480.63300.7793
FM 2 0.37720.4407
FM 3 0.5559
Ave.0.5485
Table 2. Weighted Cohen’s κ for four-category task among four experienced fund managers.
(a) Beauty
FM 1FM 2FM 3FM 4
FM 1 0.35260.49000.6352
FM 2 0.40430.4334
FM 3 0.4937
Ave.0.4682
(b) Child-Care
FM 1FM 2FM 3FM 4
FM 1 0.00820.30510.6062
FM 2 0.00490.0120
FM 3 0.2904
Ave.0.2045
(c) Robot
FM 1FM 2FM 3FM 4
FM 1 0.55490.29910.5745
FM 2 0.46510.6625
FM 3 0.4400
Ave.0.4993
(d) Amusement
FM 1FM 2FM 3FM 4
FM 1 0.71970.51590.7490
FM 2 0.46660.5673
FM 3 0.4132
Ave.0.5720
Table 3. Exact matching test for investor relations (IRs) and official websites for “e-Sports”. Numbers mean how many times “e-Sports” appeared in each company’s IRs or official website.
TickerCompany NameIRsOfficial WebsiteTotal
2138Crooz Inc.-66
2180SUNNY SIDE UP Inc.-11
2389Opt Holding Inc.-11
2590DyDo Group Holdings Inc.-22
3020Applied Co., Ltd.-66
3326Runsystem Co., Ltd.-44
3635Koei Tecmo Holdings Co., Ltd.156
3659NEXON Co., Ltd.-11
3686DLE Inc.-88
3765GungHo Online Entertainment Inc.6-6
3922PR TIMES Inc.-33
7832Bandai Namco Holdings Inc.-11
7860Avex Inc.-11
9468Kadokawa Dwango Corp.-11
9684Square Enix Holdings Co., Ltd.-66
9697CAPCOM CO., LTD.-33
9766Konami Holdings Corp.9413
Table 4. Portion of evaluation data from fund managers. “+” means they were not confident in their classification for certain company.
TickerFM1FM2
ClassNot ConfidentClassNot Confident
45441+0
45551+0
45781+0
46612 0
46651 3
46761 0
Table 5. Examples of converting fund managers’ evaluation data into response data.
FM’s EvaluationResponse Data
FM1FM2FM3FM4RelatedRating
Stock A1321 ( 1 + 3 + 2 + 1 ) / 4 = 1.7500
Stock B0100 ( 0 + 1 + 0 + 0 ) / 4 = 0.2500
Stock C01 (+)00- ( 0 + 1 × 0.5 + 0 + 0 ) / 3.5 = 0.1429
Stock D21 (+)0 (+)0 ( 2 + 1 × 0.5 + 0 × 0.5 + 0 ) / 3 = 0.8333
Stock E001 (+)0 (+)- ( 0 + 0 + 1 × 0.5 + 0 × 0.5 ) / 3 = 0.1667
Stock F001 (+)1 (+)- ( 0 + 0 + 1 × 0.5 + 1 × 0.5 ) / 3 = 0.3333
Table 6. Precision, recall, and F1 with hyperparameters in our previous study [1].
ThemePrecisionRecallF1
Beauty0.61110.75000.6735
Child-care0.83720.90000.8675
Robot0.55170.56140.5565
Amusement0.79170.56720.6609
Table 7. Hyperparameter-tuning results based on F1.
Data SourceHyperparameter1Hyperparameter2NDCGPrecisionRecallF1
ModeValueModeValue
1IRtopn500topn500.78820.71730.89530.7956
2Alltopn50topn200.80040.71110.90200.7947
3Official websitetopn50topn200.77250.71170.89210.7912
4Official websitethr.0.4topn200.78120.71340.88710.7903
5IRtopn500hitxt9.00.80090.70290.91560.7897
6Official websitethr.0.3topn500.80190.69520.91380.7882
7IRtopn50topn200.78960.70950.88770.7873
8IRthr.0.3topn500.78590.69790.90520.7864
9Allthr.0.4topn200.78220.71120.87950.7861
10Allthr.0.3topn500.80010.69800.90200.7857
11Official websitetopn200topn500.80110.69410.90880.7856
12IRtopn200hitxt7.00.79280.70670.89310.7853
13Alltopn200topn500.80370.69630.90460.7851
14IRtopn500hitxt8.00.79560.70200.90310.7851
15IRtopn500hitxt13.00.79810.68610.93310.7842
16IRtopn500hitxt10.00.81630.68910.92560.7841
17Official websitethr.0.4hitxt6.00.79440.70690.88550.7840
18IRtopn1000topn500.77490.72570.85530.7837
19IRtopn2000hitxt8.00.77700.69860.90570.7825
20IRtopn500hitxt11.00.80510.68700.92560.7824
Table 8. Hyperparameter-tuning results based on normalized discounted cumulative gain (NDCG).
Data SourceHyperparameter1Hyperparameter2NDCGPrecisionRecallF1
ModeValueModeValue
1IRtopn2000hitxt33.00.82600.65100.96400.7680
2IRtopn2000hitxt34.00.82600.64860.96400.7664
3IRtopn2000hitxt35.00.82590.64860.96400.7664
4IRtopn2000hitxt45.00.82550.64460.97150.7652
5IRtopn2000hitxt44.00.82540.64460.97150.7652
6Alltopn1000topn2000.82540.66320.94460.7748
7IRtopn2000hitxt46.00.82540.64460.97150.7652
8IRtopn2000hitxt43.00.82530.64460.97150.7652
9IRtopn2000hitxt32.00.82520.65510.96400.7712
10IRtopn2000hitxt31.00.82470.65510.96400.7712
11Alltopn1000hitxt18.00.82460.66560.91640.7656
12Alltopn2000hitxt18.00.82460.66560.91640.7656
13IRtopn500hitxt34.00.82460.65310.97410.7711
14Alltopn500hitxt20.00.82430.66360.91640.7640
15IRtopn500hitxt35.00.82420.65310.97410.7711
16Official websitetopn2000topn2000.82420.66800.92970.7724
17Alltopn2000topn2000.82410.66800.92970.7724
18Alltopn1000hitxt21.00.82400.66470.92130.7666
19Alltopn1000hitxt17.00.82380.66800.90140.7611
20IRtopn2000hitxt39.00.82370.64540.96400.7635
Table 9. Correlation among NDCG, precision, recall, and F1.
(a) Beauty
NDCGPrecisionRecallF1
NDCG1−0.82640.7775−0.6478
Precision 1−0.97030.6628
Recall 1−0.4908
F1 1
(b) Child-Care
NDCGPrecisionRecallF1
NDCG1−0.0098−0.3326−0.3844
Precision 1−0.6647−0.5270
Recall 10.9846
F1 1
(c) Amusement
NDCGPrecisionRecallF1
NDCG1−0.92040.89000.9310
Precision 1−0.9637−0.9672
Recall 10.9788
F1 1
Table 10. Confusion matrix for test data.
Actual
RelatedNot Related
PredictedRelated4834
Not Related99
Table 11. Confusion matrix for comparison, only using IR and matching one word “robot”.
Actual
RelatedNot Related
PredictedRelated95
Not Related4838
Table 12. Precision, recall, F1, and accuracy for test data.
PrecisionRecallF1Accuracy
Final result for “robot”0.58540.84210.69060.5700
Only using IR and matching one word “robot” (for comparison)0.64290.15790.25350.4700

