Abstract
The main aim of this paper is to identify critical success factors (CSFs) and investigate whether they are the same or not across different project organization structures. The organization structures under the study are: functional, project, and matrix. The study is based on a survey that was conducted on a large number of software projects in Jordan. To rank success factors (SFs) and identify critical ones, we use the importance index of SFs, which is calculated based on the likelihood and impact across different structures. For deeper analysis, we carry out statistical experiments with an ANOVA test and Spearman’s rank correlation test. Analysis results of an ANOVA test partially indicates that the values of the SF importance index are slightly different across the three organization structures. Moreover, the Spearman’s rank correlation test results show a high degree of correlation of the SF importance index between the function and project organization structures and a low degree of correlation between the function and matrix organization structures.
1. Introduction
The main aim of software project management is to ensure success of a software project. Usually, time, cost, and quality are used as criteria for measuring project success. A project is considered successful when it meets its desired budget, finishes within the scheduled deadline, and meets functional and technical specifications. The aforementioned criteria is often referred to as the “iron triangle” [1] or “triple constraints” [2] and has been commonly used as a measure for project success. However, there has been a debate whether this criteria is incomplete or excessive [3]. A number of researchers argued that the aforementioned measures are not enough and added other measures to ensure success of the project such as client satisfaction, business success, and others [4,5]. On the other hand, other researchers considered the “iron triangle” measures as excessive and reduced them into a single evolution criterion, the financial criterion [3]. However, the three measures remain the most commonly used measures for project success.
According to the Standish Group International [6], for the year 2015, only 29% of the studied projects were considered successful, with 52% of projects not finishing on time, within budget, or with a satisfactory result, and 19% of projects were cancelled during development or not being used after implementation. An alarm is raised in regard to project failure when, for example, one realizes that the New York City Automated Payroll System (NYCAP) finished with a cost of $360 million where the initial estimate of budget is $66 million, meaning that it cost 5.5 times the initial budget [6].
To understand the low percentages of success of projects, an attention has been paid to identify the conditions that can lead to a successful project or, in other words, critical success factors (CSFs).
CSFs are defined by [7] as the limited number of areas in which satisfactory results will ensure successful competitive performance for the individual, department, or organization.
This area has attracted attention from researchers world-wide without taking into consideration the relying organization structure which may play a role in having different CSFs across different structures. Generally, there are different organization structures which identify how organizational units can be structured. The three well-known types of organization structures are: functional, project, and matrix organization. In functional organization, employees are grouped into departments and projects are usually pipelined through the departments. In project organization, team members are grouped into projects, each of which has a problem to be solved. Teams are assembled for a project as it is created and they are disassembled once the project terminates. Matrix organization is a combination between the two aforementioned types where participants from different departments of the functional organization are assigned to work on projects as they are created [8].
Each of the three types has its own advantages and disadvantages. Each structure has its own working environment where the nature and strength of relationships between team members are different, the relationship between management and staff might be different, skill proficiency of team members might be different, and the roles and responsibilities definition across the structures might be different [8]. Thus, it may not be necessary to have the same CSFs across different organization structures. Additionally, it may not be necessary for SFs to have the same importance across different organization structures. This has lead us to focus in this work on studying and analyzing success factors of software projects with different organization structures. In this paper, we investigate the following two research questions:
- Do CSFs vary based on the organization structure type for software projects?
- What are the correlations between different organization structures based on the SF importance index?
The first question addresses the relationship between CSFs and the organization structural type. The results will provide valuable information to project managers and CEOs about prioritizing CSFs based on the structure of their organizations. The second research question aims to identify the relationship between SFs importance index of each two organization structures. The goal is to provide useful information for managers in case the current organization needs to be migrated or merged to another organizational structure; for example, migrating from a project organization structure to a functional organization structure. In this case, managers can rely on SFs with high correlation values between functional and project types.
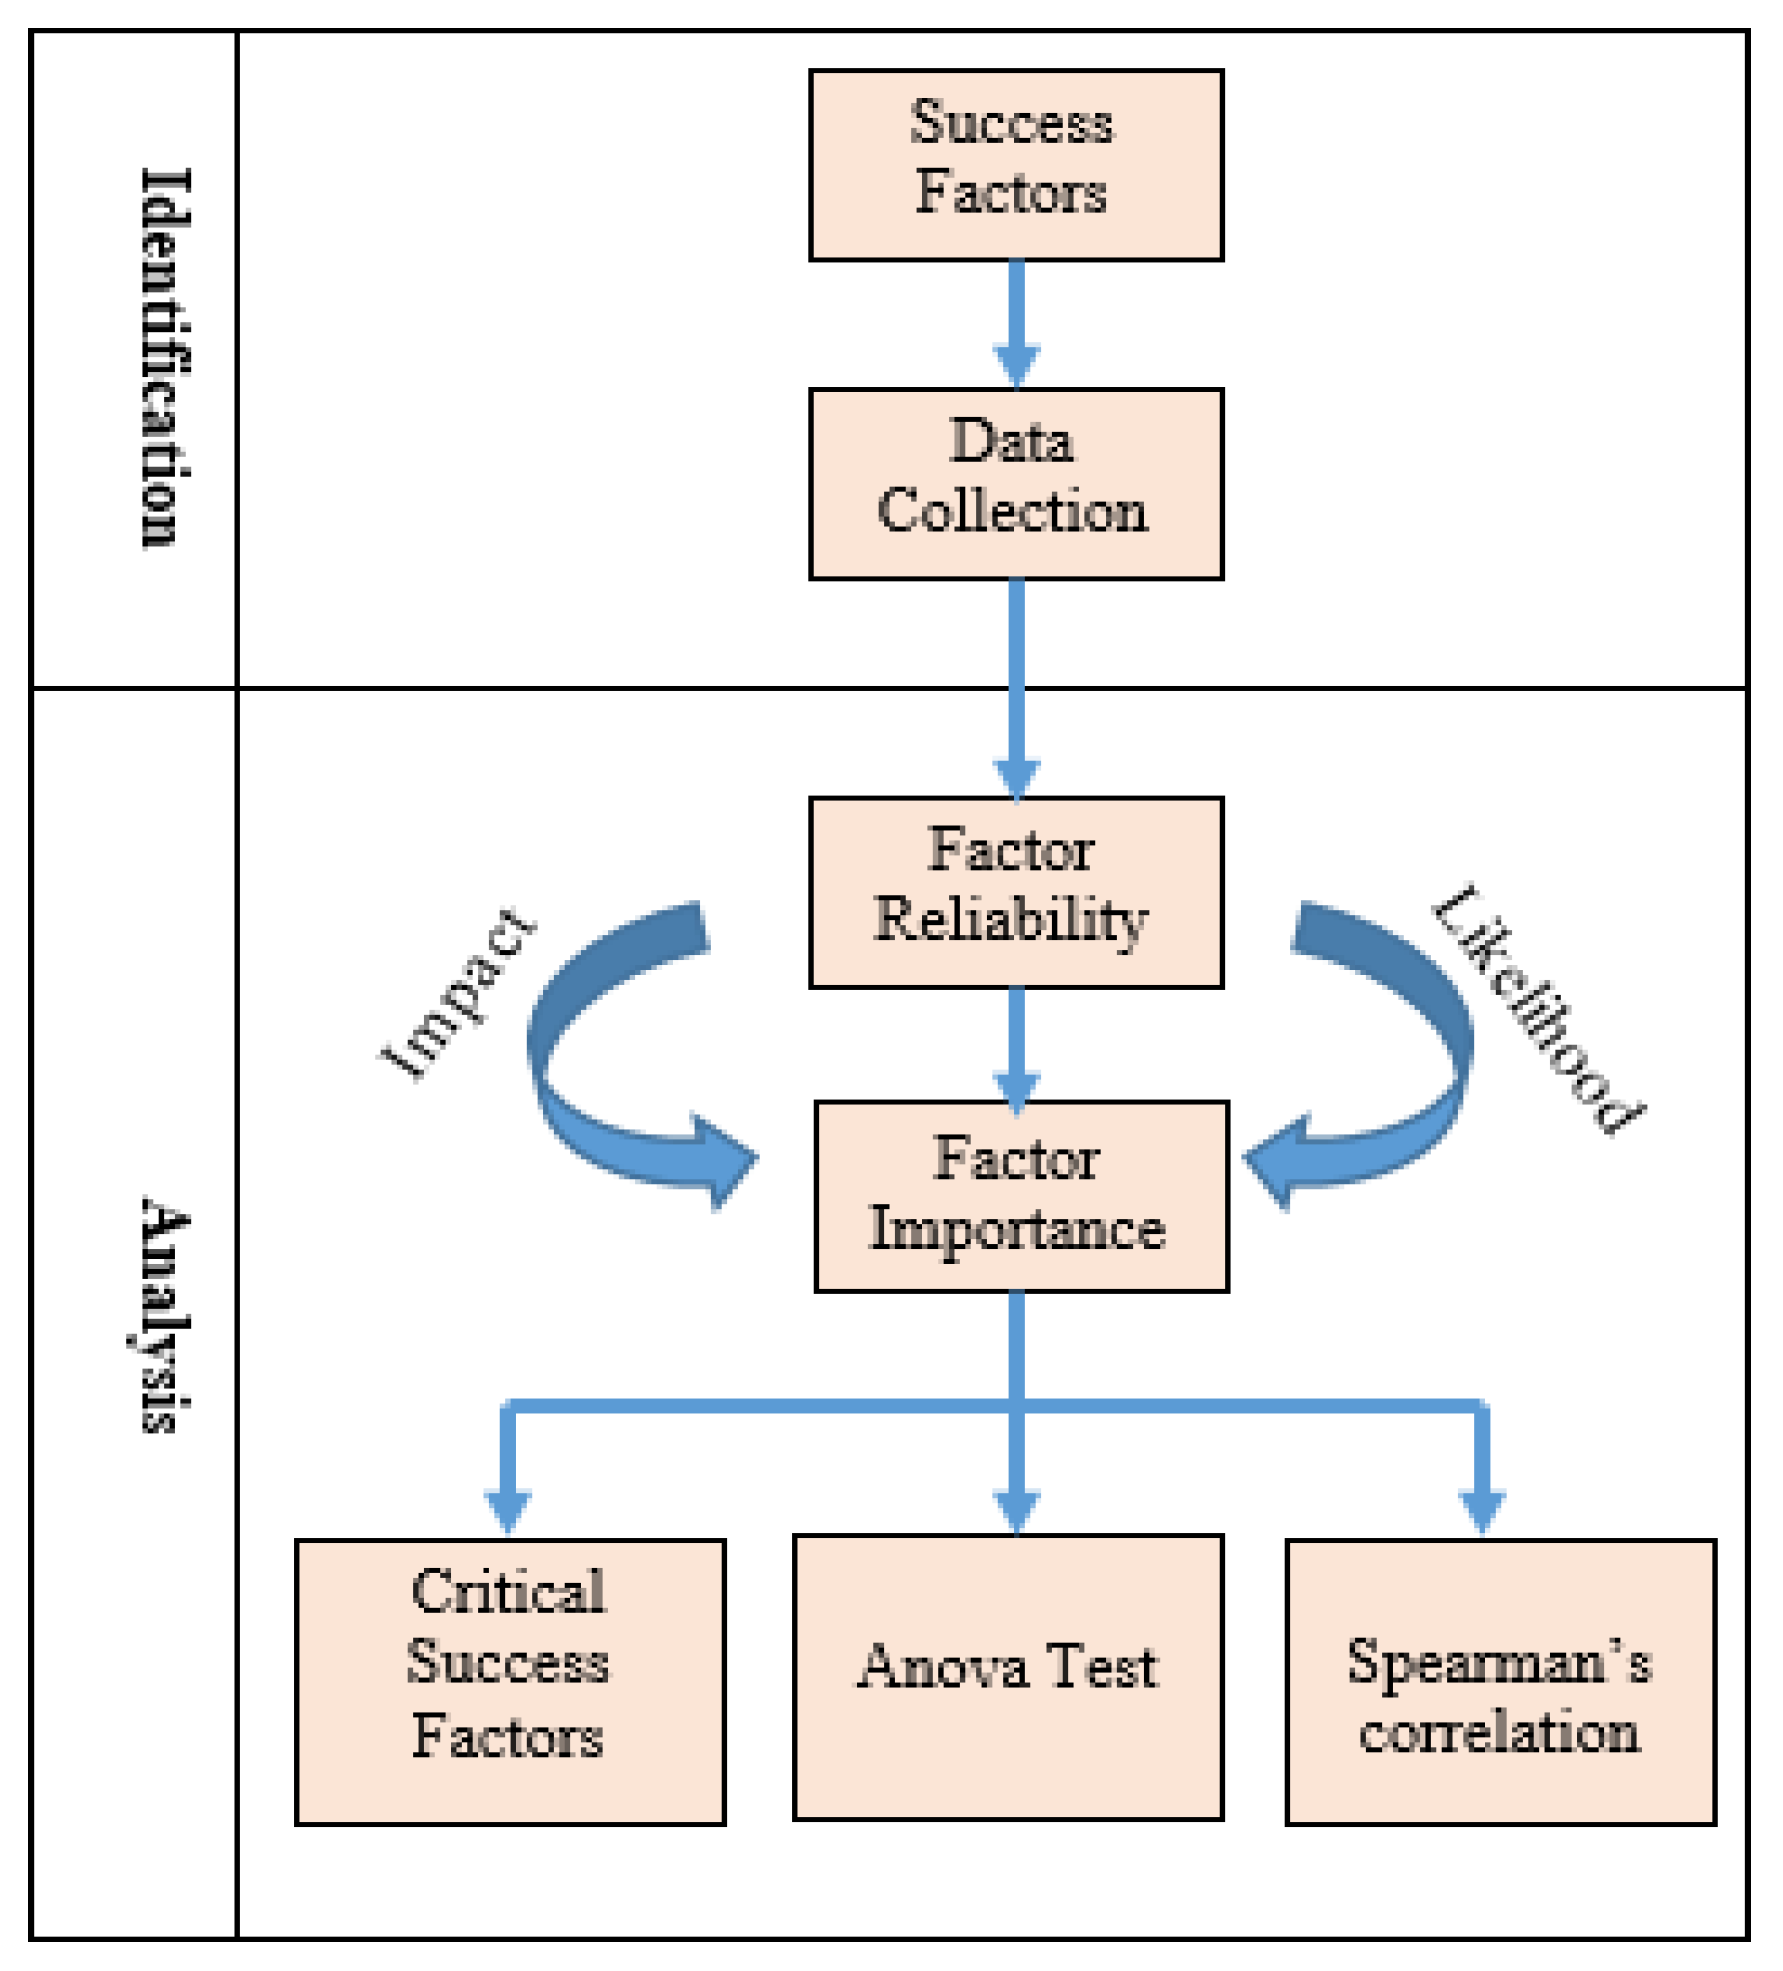
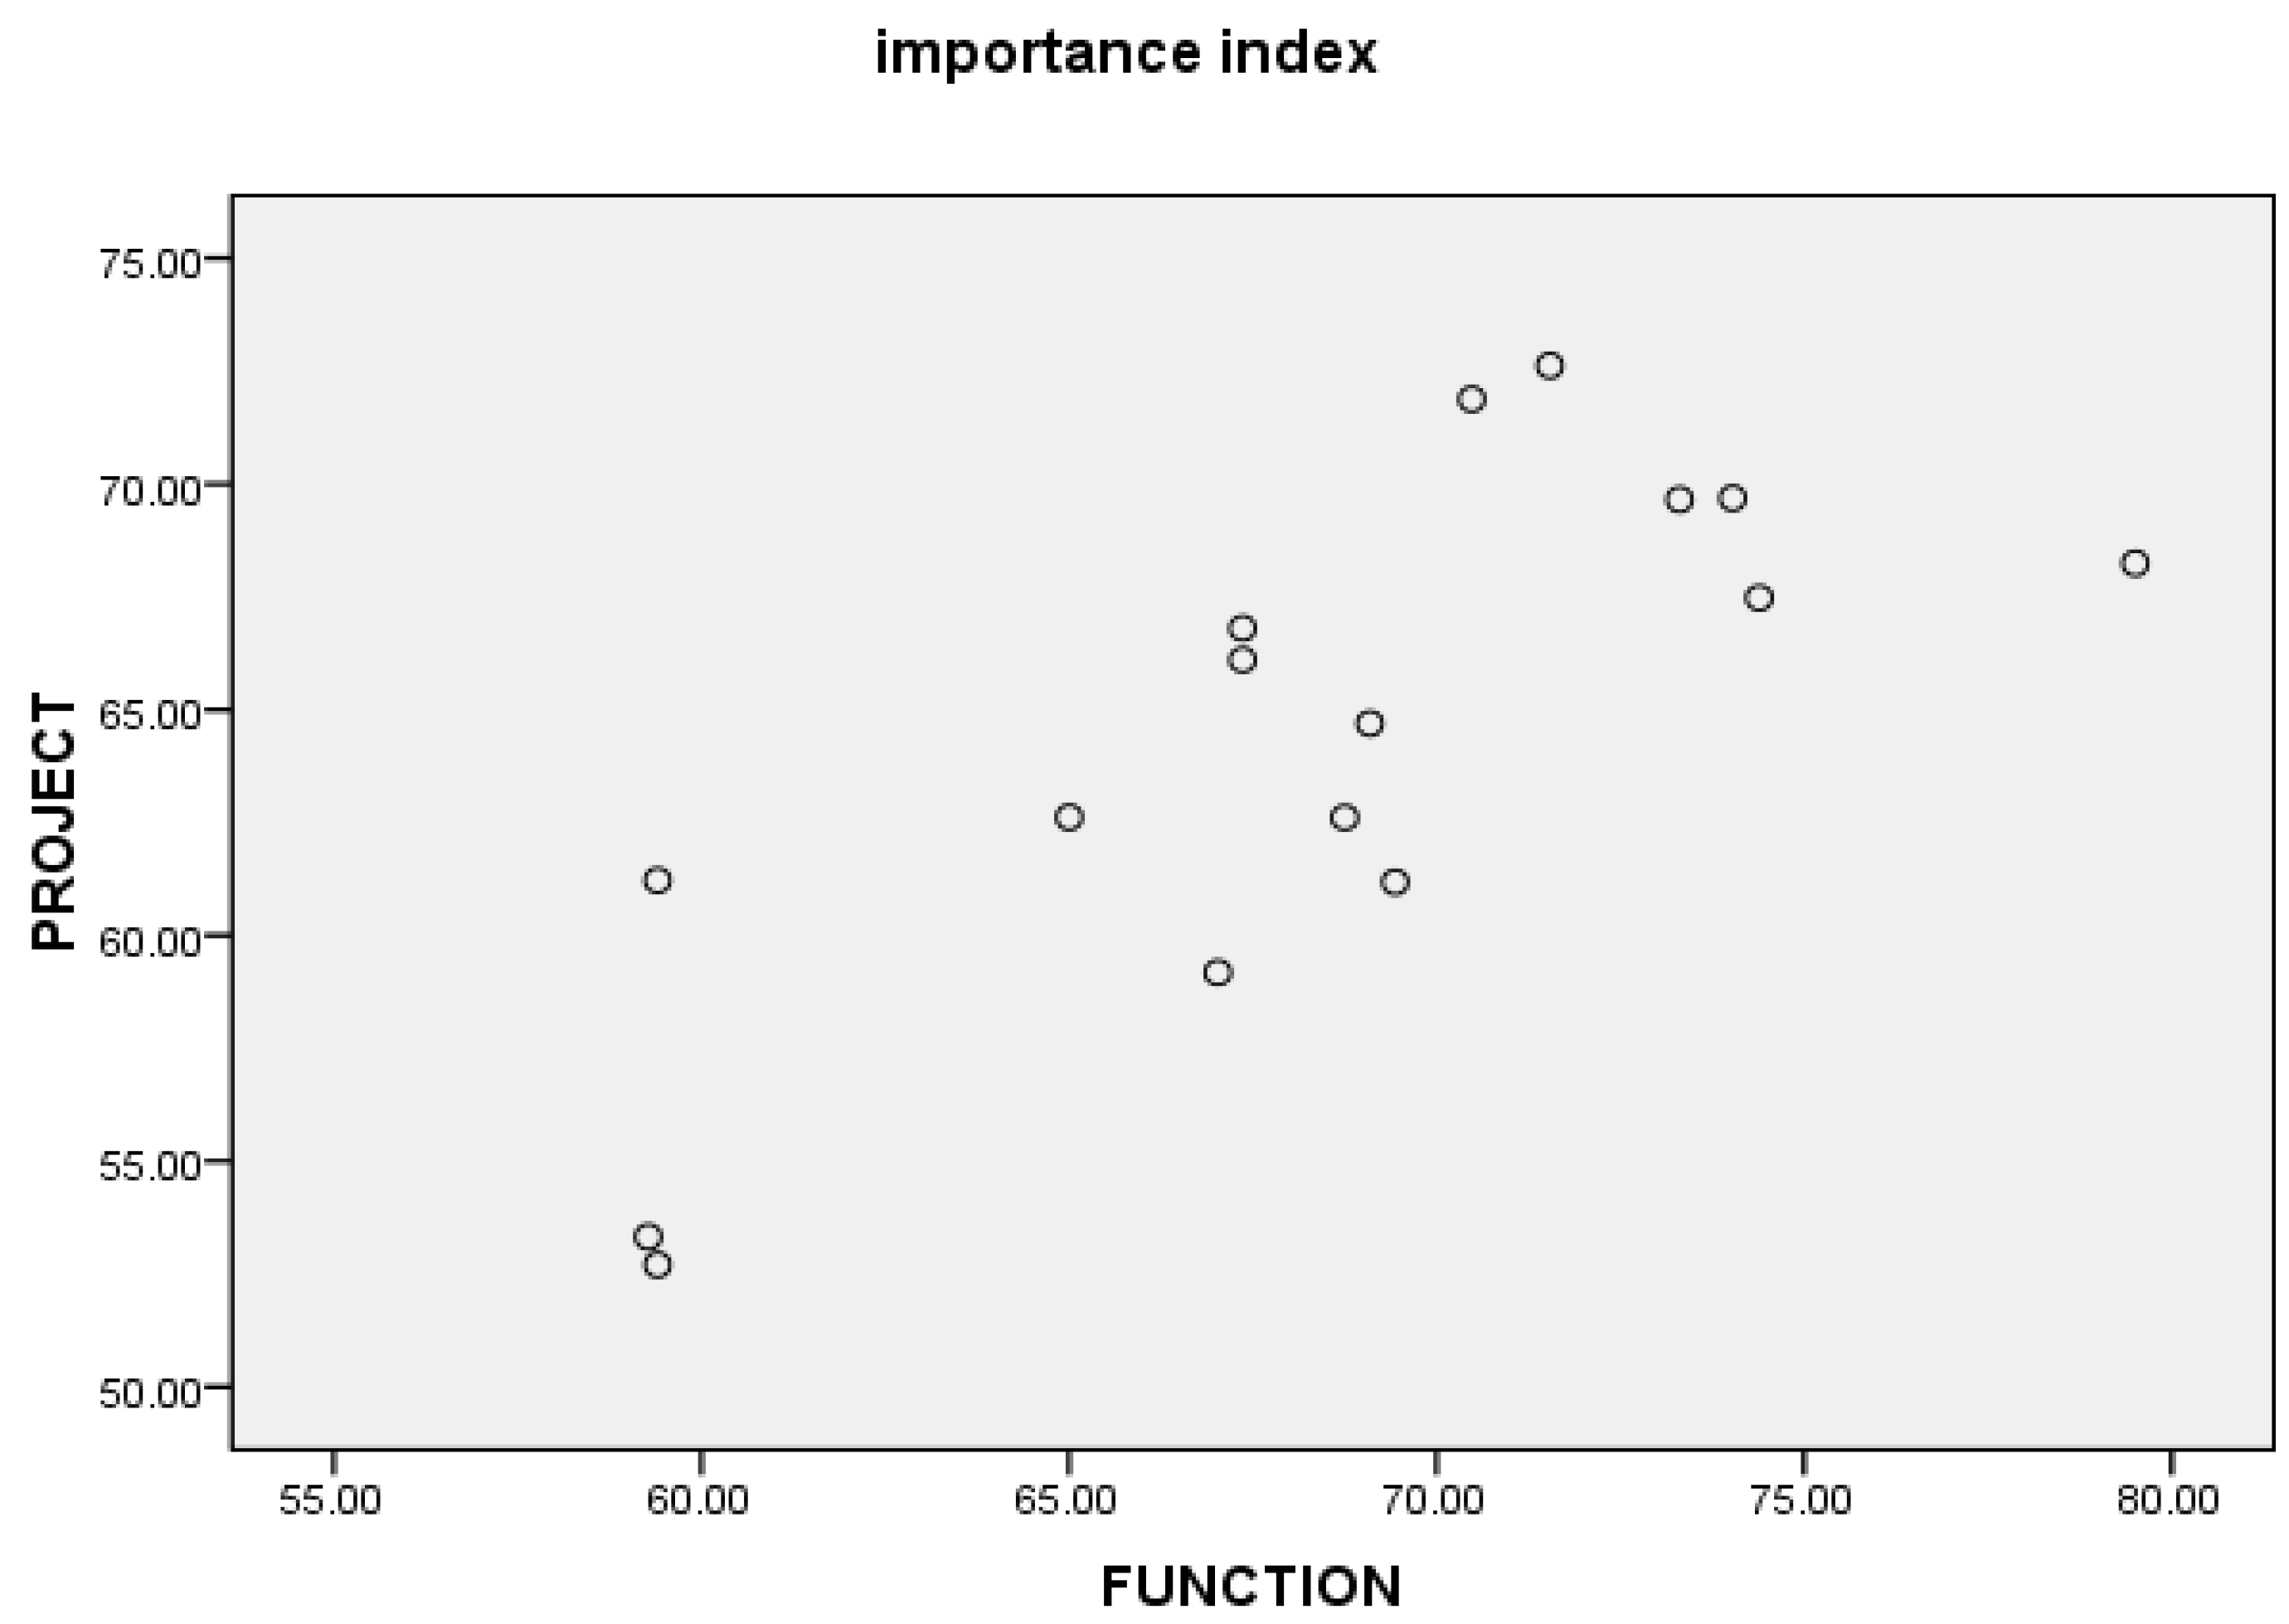
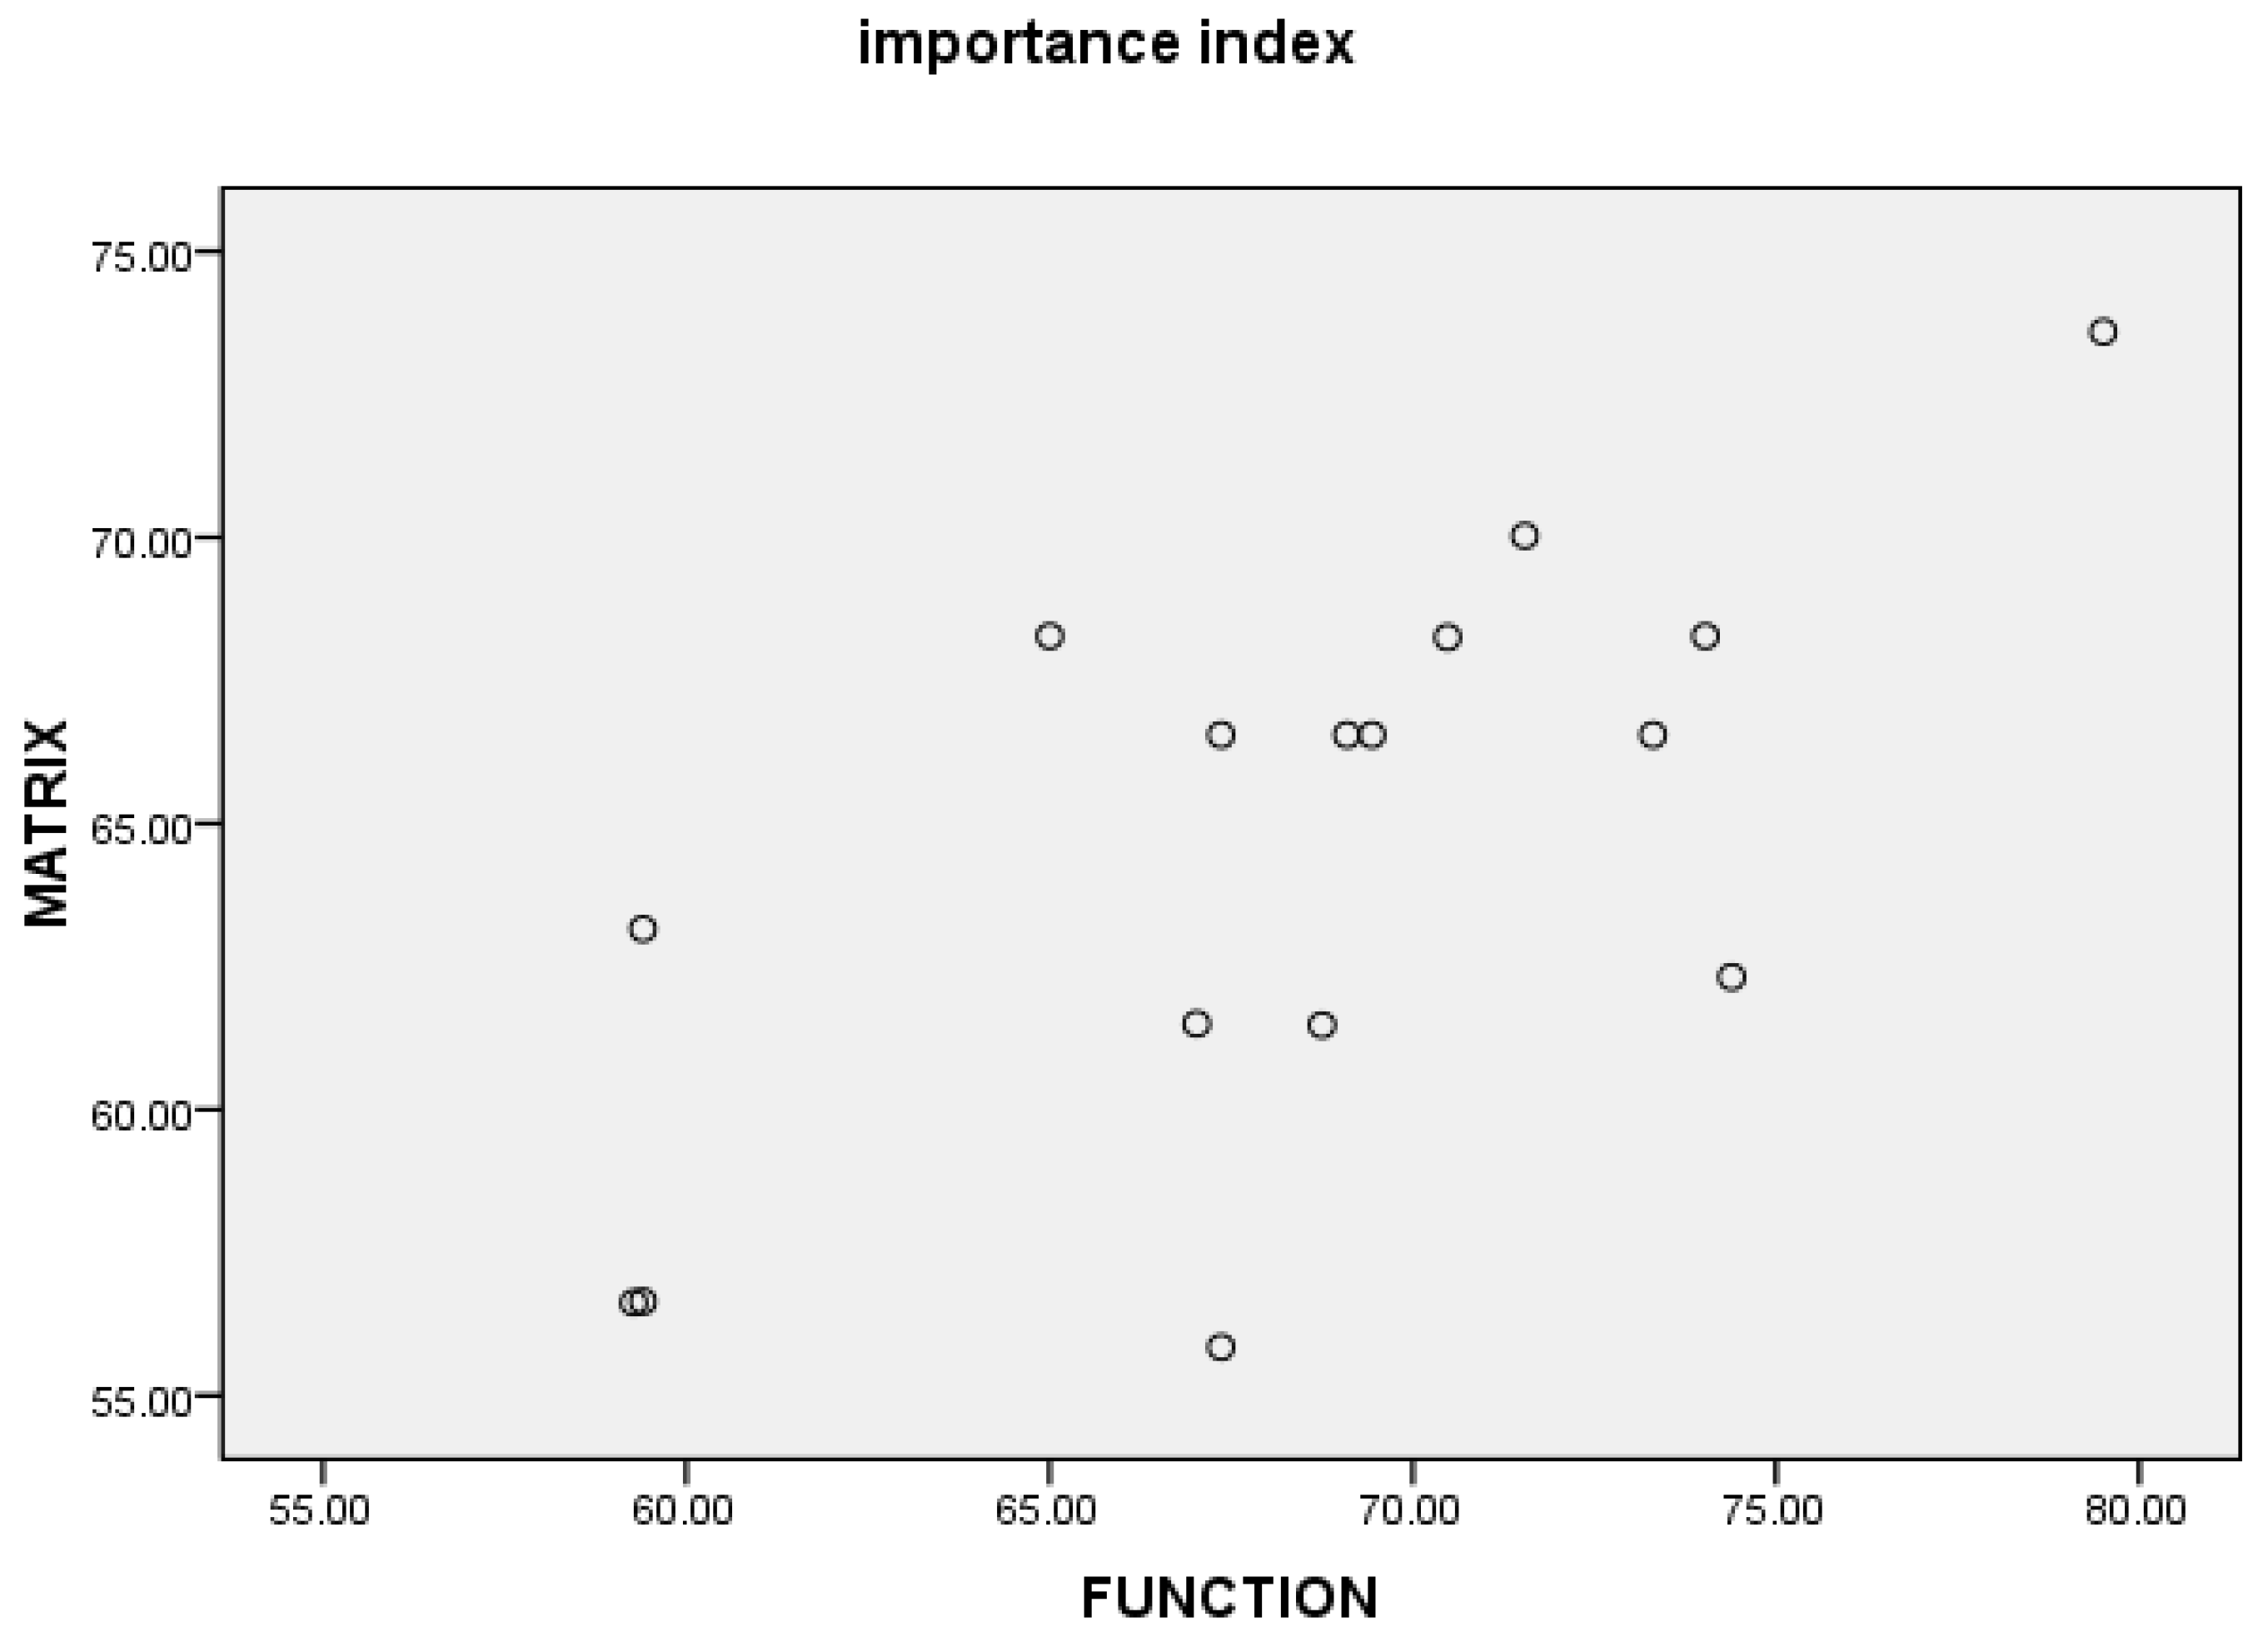
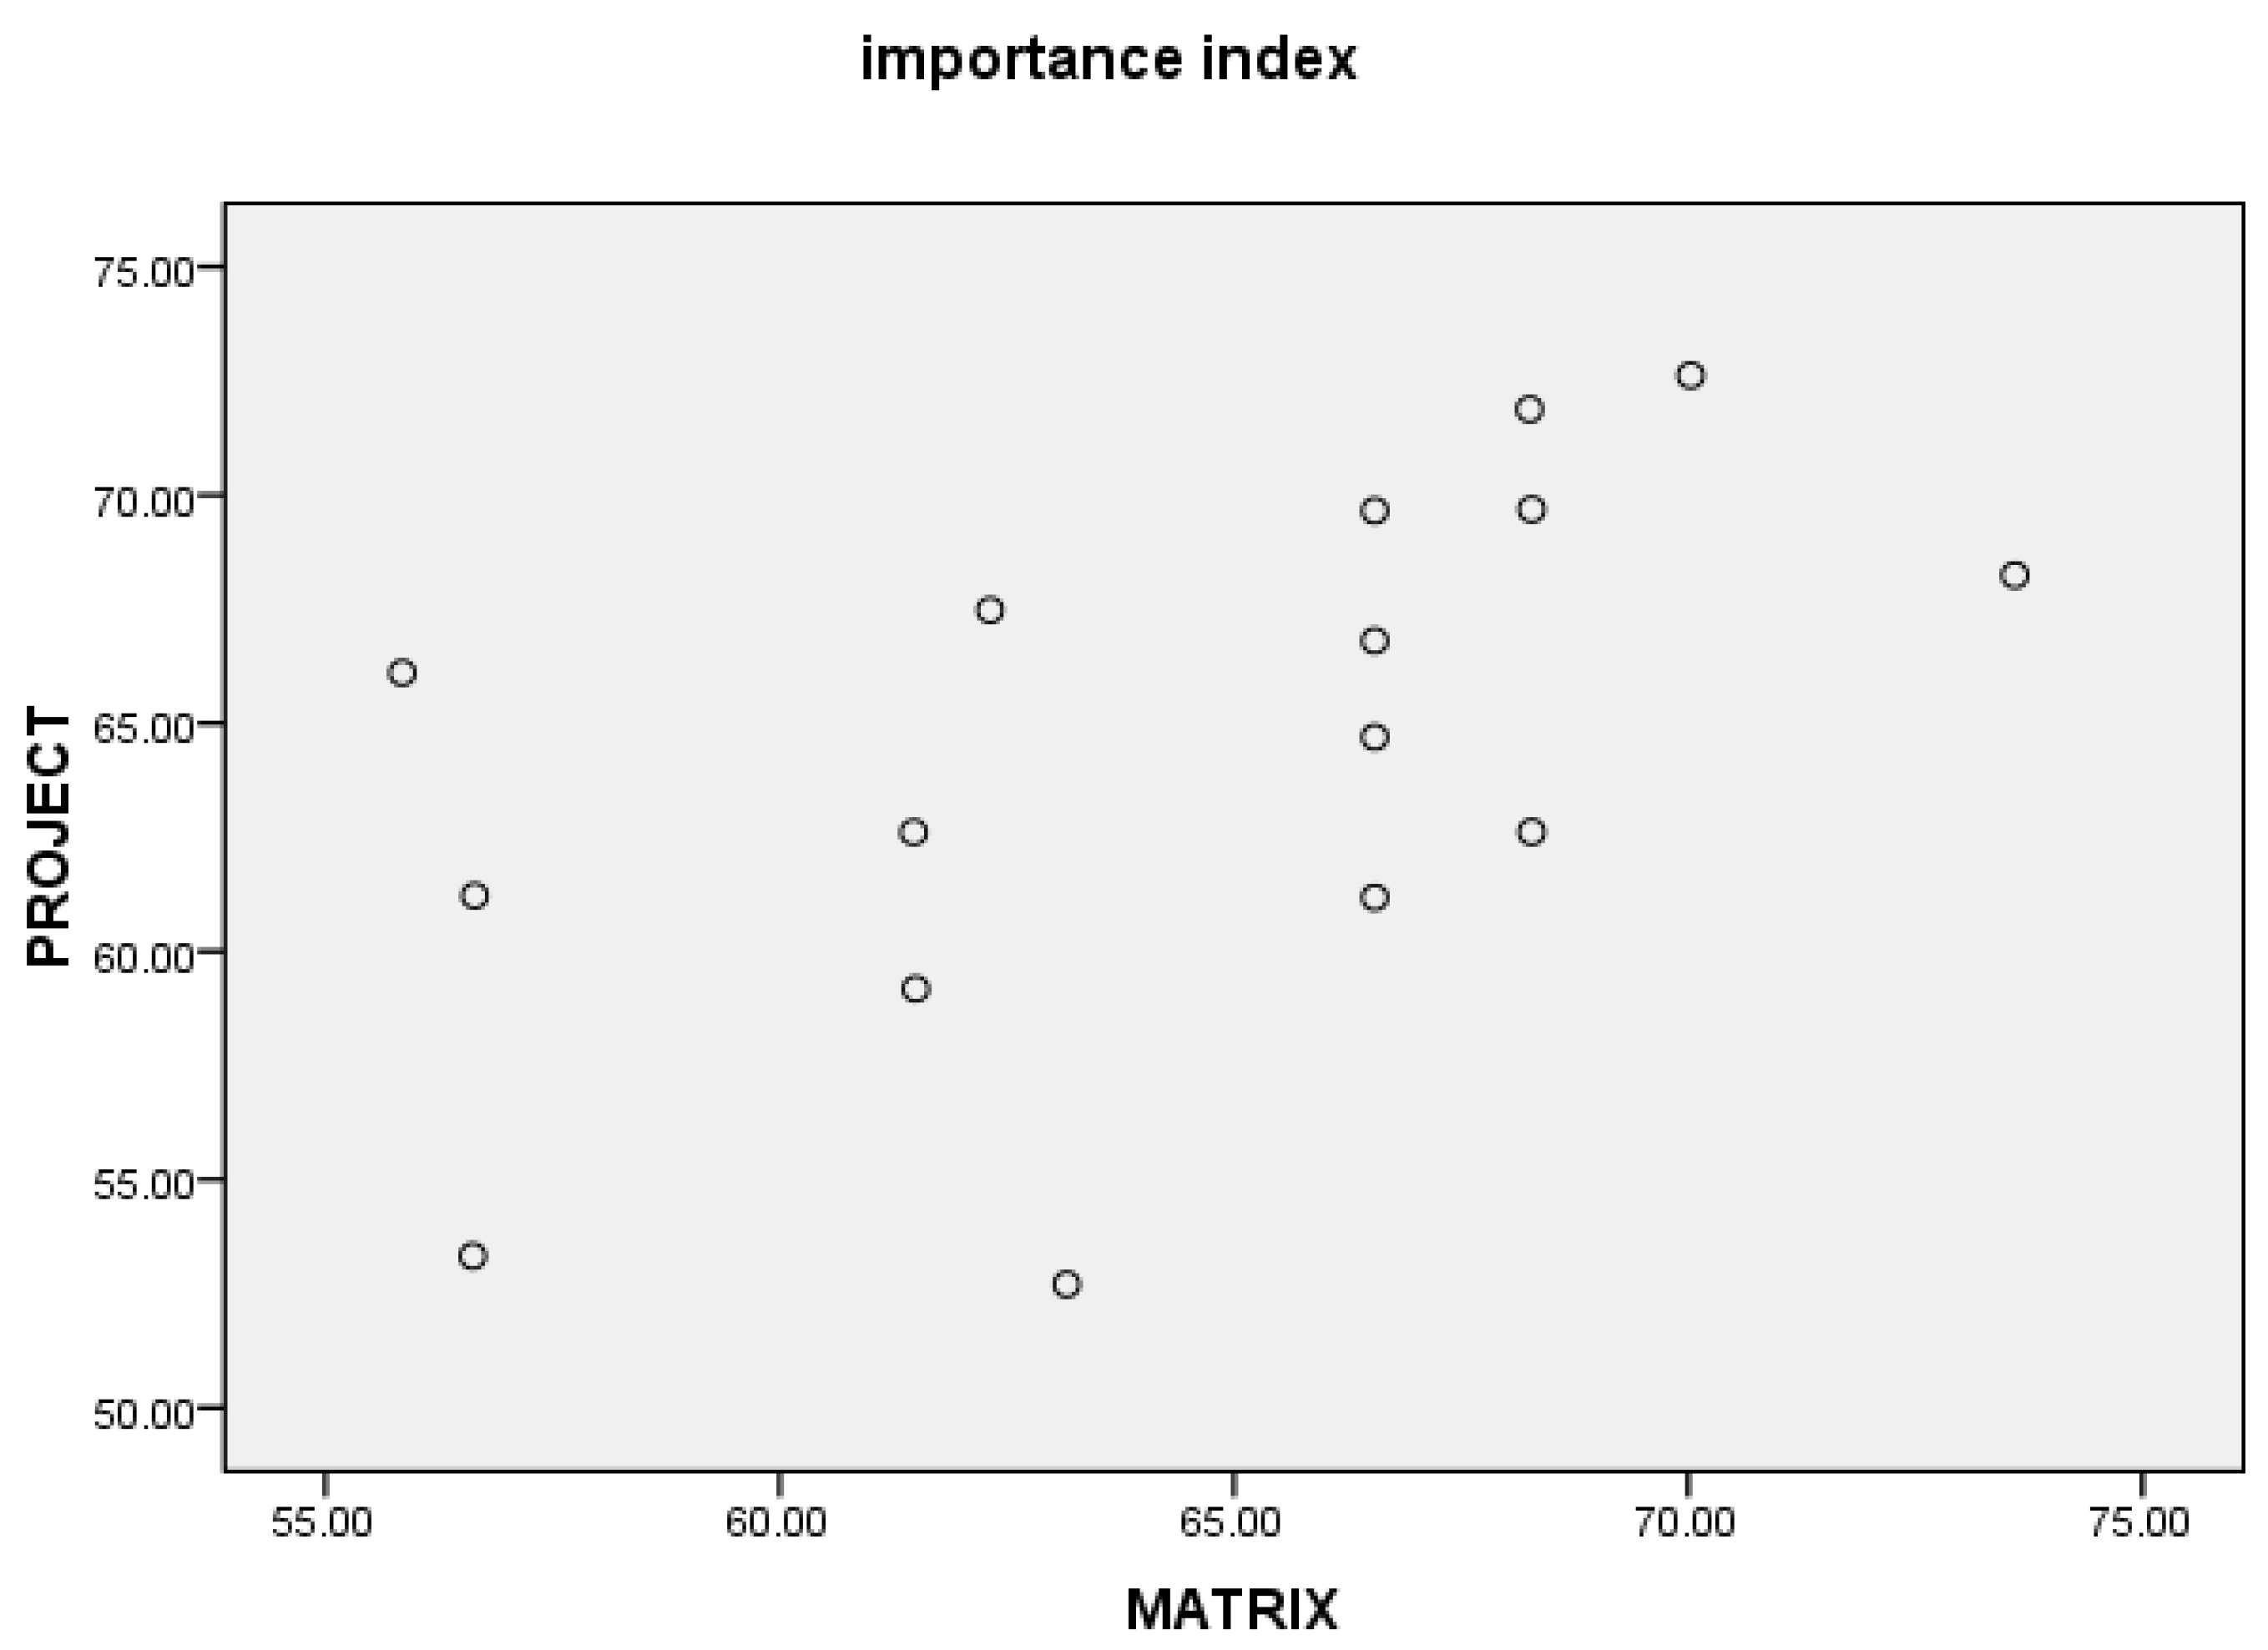
For this purpose, we identify a number of SFs and assess them based on their importance index for each project organization structure separately (functional, project, or matrix). Then, the top ranked SFs are considered as CSFs. After that, we experiment with ANOVA test and Spearman’s rank correlation test for deeper analysis of the data. An ANOVA test is used to check whether there is a significant difference between the importance of success factors across the three types of organization structures or not. Moreover, Spearman’s rank correlation test is run to measure the degree of correlation of the importance index of the success factors across the three organization structures.
The research contributions of this paper can be summarized as follows:
- Analyzing in details of SFs based on different software projects organization types in Jordan.
- Identifying and ranking the CSFs based on different organization structures.
- Comparing SFs importance across the three types of organization structures.
- Measuring the correlation between different organization structures based on SFs.
2. Related Work
An attention worldwide has been paid to studying project success (e.g., [9,10,11,12,13,14,15,16,17,18,19,20,21]), with two main directions of research: (1) CSFs and success, and (2) process maturity and success. Hereafter, we review research works in these two directions and we draw up our conclusions in the summary part.
2.1. Critical Success Factors
A widely recognized research work in this field is the work of [9], where the authors reviewed 63 research works related to projects’ CSFs, with almost half of the articles being related to software projects. The reported five highest cited CSFs are: the importance of projects, top management support, having clear and realistic objectives, producing an efficient plan, and good communication. However, their findings cannot be generalized as CSFs for software projects as project success factors are not universal to all projects [10]. Similar to the aforementioned review but with a concentration on software projects only, the authors in [11] reviewed 43 publications related to software projects CSFs; 26 CSFs were found related to the success of software projects with the top five as follows: clear requirements and specification, clear objectives and goals, realistic schedule, effective project management skills, and top management support.
Recently, the authors in [12] studied the CSFs for Turkish software companies. CSFs related data were collected form 101 software projects. The top three reported CSFs are: (a) team experience with the software development methodologies, (b) team expertise with the task, and (c) project control. Moreover, the authors reported that the CSFs might change as company size, project size, and development methodology change.
In the work of [13], the authors built a framework that integrates CSFs for the successful implementation of information technology governance (ITG). The framework is built based on analysis of related studies and by grouping them into ten different categories. Under each of these categories, a number of CSFs were listed, with a total number exceeding 50 CSFs across the ten categories. Further analysis and filtering was then carried out and the authors ended up with 15 CSFs from five different categories: (a) strategic alignment, (b) environmental effect, (c) organizational effect, (d) performance management, and (e) resource management. Examples of CSFs from the five aforementioned categories are: effective communication between IT and business, requirements compliance, clear IT strategy, good project management methodology, and sufficient financial support. The authors in [14] followed a similar approach to that of [13] and grouped 80 success factors into seven categories based on their occurrences in the literature. Then, each category’s top five factors were identified resulting in 35 CSFs. Among these CSFs are: communication in project, top management support, clear project goals, reliability of output, and project planning.
Within this context, the authors in [15] applied an expert-based Bayesian model for identifying CSFs of software projects. For this purpose, a set of success factors was prepared based on the literature and distributed to 51 experts to identify the main success factors that are important to finish on time, budget, and with a quality level. According to the authors, top management support is the most important factor for finishing on time. A skilled leader is the most important factor to finish within budget and, user involvement, is the most important factor for building a quality software. The aforementioned factors are close to those identified by [16] where five cases of executed IT project were studied and a number of CSFs were identified including top management support, skilled workers, user involvement, and communications.
A number of related research works focused on studying CSFs in agile software projects [17,18,19]. In [17], a comparison of CSFs was carried out between traditional-based and agile-based methodologies for the development of outsourced software projects. A number of CSFs were investigated covering four main categories that are related to organization, team, customer, and project uncertainty. A survey was conducted and multivariate analysis were run to study the relationship between the aforementioned factors and project success from process and product perspectives. The authors concluded that CSFs are significantly different between traditional and agile methodologies. Within the same context, the authors in [18] investigated the CSFs for agile projects. For this purpose, they identified an initial set of success factors based on the literature. They ran reliability tests and factor analysis and ended up with 12 factors that are related to four categories: quality, scope, time, and cost. Based on these factors, 109 agile projects from 25 countries were surveyed. Using multiple regression analysis, the authors concluded that the following factors can be considered as CSFs for agile projects: (a) correct delivery strategy, (b) proper practice of agile techniques, and (c) high-caliber team. Other factors that can be considered as critical to certain success dimensions are: (a) good agile project management process, (b) an agile friendly team environment, and (c) customer involvement. However, in a study by the authors in [19], none of the aforementioned factors was considered a CSF when a similar survey was conducted on agile projects in 23 different companies in five former Yugoslavian countries.
2.2. Process Maturity Models
In another direction of research, few number of research works focused on linking project success with the implemented process maturity model with majority of them focusing on not studying software project alone but rather a combination of software projects and projects from other industries (e.g., [3] and [20]). As specific for software projects, the authors in [21] studied the relationship between the implementation of software process maturity and project performance. Within this context, the Capability Maturity Model (CMM) was studied. The CMM maps organization’s software project process into five-level system [21]. At each level, a set of key process activities identify the maturity level which can be one of the following levels, ordered from level 1 to level 5: initial, repeatable, defined, managed, and optimizing. A survey was conducted with 154 software engineers where 38 items are used to measure software maturity and 15 items are used to identify project performance. The results indicate that there is a positive relationship between software process management maturity and project performance. Moreover, the project performance is directly related to activities of level 3 and level 4 of the CMM model.
2.3. Summary
Generally, there has been an extensive research for identifying the variables that can lead to a successful project whether they are critical success factors or process maturity items. However, the majority of research works target projects in all industries and not too much attention has been paid to studying the success of software projects. Moreover, by reviewing research works related to CSFs, it can be noticed that there is no agreement among the cited research works on the CSFs which supports the idea that there is no consensus among researchers about the CSFs [22]. In addition, a little attention has been paid to studying SFs across different organizational structures. CSFs may vary according to the underlying organizational structure. Moreover, the order and importance of SFs might be different across different structures. Therefore, in this paper, we focus on studying and deeply analyzing the CSFs and the SFs importance based on each organization type separately for software projects in Jordan. For this purpose, we assess a number of SFs based on their importance index for each project organization structure separately. The highly ranked SFs are considered as CSFs. Then, we experiment with an ANOVA test and Spearman’s rank correlation test for deeper analysis of the data.
3. The Approach
In this section, we discuss our approach as illustrated in Figure 1. It consists of two major stages: identification and analysis.
Figure 1.
The approach.
3.1. Identification
At this stage, the success factors are identified and the data is collected. In our study, we have used eighteen factors that are commonly studied in the literature within the context of success factors for software projects and have been studied in [23]. The 18 factors are listed in Table 1 with a brief description of each factor.
Table 1.
Success factor descriptions.
Once the success factors are identified, data must be collected. A survey must be conducted to identify CSFs and carry out further analysis. The survey questions must be related to the success factors, and the project structure (functional, project, or matrix). These information are extracted from the authors’ survey in [23].
In this survey, 59 companies in Jordan were considered. The companies vary in terms of size, history, domains, target sectors, and products and service types. The size of the companies vary from small size to medium- and large size. The history identifies how long the organization has been in business and includes three intervals: less than five years, from 6–10 years, and more than 11 years. The domains of the companies include: products, services, solutions, training, and consultations. The target sectors are government, public safety, healthcare, education, smart grid, energy, transportation, finance, manufacturing, hospitality, media, and entertainment. The products and service types are: development, training, cloud computing, networking, data centers, and others.
A questionnaire was distributed to the respondents electronically and manually. The questions are related to the likelihood and impact of a success factor. The likelihood of a factor answer can be a one of five choices (1: Never, 2: Rarely, 3: Sometimes, 4: Often, 5: Always). The impact of a factor answer can be a one of five choices (1: Not at all, 2: Slightly, 3: Somewhat, 4: Very, 5: Extremely). Thirty-seven CEOs and 53 project managers responded with a response average of 97%. However, only 76% of their responses were used in our analysis as they were complete.
3.2. Analysis
As a first step of our analysis, we studied the success factors reliability using Cronbach’s alpha method. It describes the reliability of an average of K measurements where they may represent K raters, occasions, or questionnaire items. When the measurements represent multiple questionnaire items, Cronbach’s alpha is referred to as a measure of internal consistency and we implement it in our study to determine which factor must be included in the study or excluded according to its relation with other factors [24].
Once reliable factors are identified, factor importance index is calculated to be able to identify the CSFs based on each project organization separately: functional, project, and matrix. The importance index is calculated as the multiplication of the likelihood index and the impact index [25]. The likelihood index measures the frequency (probability) of the factor. It is calculated as:
where a is the weight of each choice (ranging from 1 to 5) related to a likelihood question, n is the frequency of the response, and N is the number of respondents.
Likelihood (%) = ∑a (n / N) × 100 / 5
On the other hand, the impact index measures the severity of the factor. It is calculated as:
where a is the weight of each choice (ranging from 1 to 5) related to an impact question, n is the frequency of the response, and N is the number of respondents.
Impact (%) = ∑a (n ⁄ N) × 100/5
Then, the importance index is calculated as follows:
Importance Index (%) = [Likelihood (%) × Impact (%)]/100
Once the importance index is calculated, factors are ordered in a descending order of importance and the top five factors are considered as critical success factors. As a second step of analysis and to examine from a statistical point of view of whether there is a difference of success factors importance index across the three organization structures or not, we run a one-way ANOVA test. It is used to measure significant differences between three or more independent sample means. It requires the assumption of the normality and homogeneity of variance.
To further analysis of the data, and to measure the correlation between the importance index of the SFs across the three organization structures, we run a Spearman’s rank correlation test. It is used to measure the size and direction of the linear relationship between two structures.
4. Data Analysis and Results
4.1. Factors Reliability
Table 2 shows the Cronbach’s alpha value with the 18 factors with a value of 0.862 which is considered a good value to conduct the research [24]. However, as it is clear from Table 3, the value of Cronbach’s alpha will increase if two of the factors are eliminated: well defined objective (new value will be 0.872) and client involvement (new value will be 0.867). Thus, these two factors are eliminated and the new Cronbach’s alpha values after elimination are clear in Table 4. Thus, we ended up with 16 factors with a new value of Cronbach’s alpha of 0.878. These 16 factors are illustrated in Table 5. Across all the Cronbach’s alpha values of these 16 factors, there is no value that exceeds 0.877.
Table 2.
Cronbach’s alpha for 18 factors.
Table 3.
Cronbach’s alpha value when deleting an item (18 factors).
Table 4.
Cronbach’s alpha for 16 factors.
Table 5.
Cronbach’s alpha value when deleting an item (16 factors).
4.2. Critical Success Factors
In the following, we discuss the results of identifying the critical success factors based on each project organization separately: functional, project and matrix. It is clear from Table 6 that the organization structures of the 59 companies are as follows: 53.3% of projects are of a functional structure, 25.6% are of a project structure, and 21.1% of projects are of a matrix structure. The functional structure type is a common type of organization structure.
Table 6.
Percentages of projects’ organization types.
In Table 7, Table 8 and Table 9, we show the order of success factors based on the importance index and across the three organization types.
Table 7.
Order of SFs based on the importance index for the functional organization structure.
Table 8.
Order of SFs based on the importance index for the project organization structure.
Table 9.
Order of SFs based on the importance index for the matrix organization structure.
Table 7 shows the likelihood, impact, and importance index of each success factor for the functional organization structure. It also presents the order of success factors based on the importance index. It is clear from this table that the critical factors in this organization type are: (1) team capability, (2) stakeholders’ communication, (3) leadership, (4) top management support, and (5) the right team.
Table 8 illustrates the likelihood, impact, and importance index of each success factor for the project organization structure. It also presents the order of success factors based on the importance index. It is clear from this table that the critical factors are: (1) the right team, (2) realistic budget, (3) leadership, (4) top management support, and (5) team capability.
Table 9 presents the likelihood, impact and importance index of each success factor for the project organization structure. It also shows the order of success factors based on the importance index. It is clear from this table that the critical factors are: (1) team capability, (2) the right team, (3) leadership, (4) progress reports, and (5) realistic budget.
Generally, the critical success factors are slightly different across the three organization structures. There are three common critical factors across the three organization structures which are (1) the right team, (2) team capability, and (3) leadership. However, the order of CSFs is different across the three organization structures. The only common order of a factor across the three structures is the leadership factor with the third order of importance.
It can be noted that certain success factors might be considered most critical in certain structure while it might be considered less critical in another structure. For example, the importance of the right team factor is the highest for project organization structure while it is in the fifth-order in the function organization structure.
Another example is the team capability factor which is considered as the most critical factor from functional organization project managers and CEOs point views, but it is considered the fifth most critical factor from the other viewpoint of the project organization structure. Moreover, the progress reports factor is considered among the most critical factors in the matrix organization structure while, in the other two structures, it is considered among the least critical factors.
On the other hand, the least important success factors for the functional organization are: minimum customization, staff training and risk analysis. For the matrix organization, the factors are: minimum customization, risk analysis, and top management control. For the project organization, the least important factors are: quality standards, risk analysis, and staff training. It is clear that there is an agreement of project managers and CEOs across the three types of project structures that risk analysis factor is not a so important factor for the success of a project.
4.3. One-Way ANOVA Test
To test our hypothesis of whether there is a significant difference of success factors importance index across the three organization structures or not, we run one-way ANOVA test. To carry out ANOVA, we must first examine the normality and homogeneity of the variance. The results of the normality of variance are explained in Table 10. We chose the results of Shapiro–Wilk test rather than Kolmogorov–Smirnova test because of the small sample size of 16. The significance results are clearly greater than 0.05 to all structures which means that the structures are normally distributed. Then, we test the homogeneity of variance between the different structures using the Levene test, as illustrated in Table 11. The test result is equal to 0.103 and the significance value is 0.90. Thus, the homogeneity of variance between structures is valid and homogeneity is not violated, as the significance value is greater than 0.05 between structures. The results of the ANOVA test are shown in Table 12. The ANOVA value (F) is equal to 2.743 and the significance value is equal to 0.075. As the significance value is close to 0.05, it partially indicates a difference of the importance index values across the three organization structures. However, in order to study more the level of correlation across the three organizational structure types, we examine the Spearman’s rank correlation.
Table 10.
Tests of normality.
Table 11.
Tests of homogeneity of variances.
Table 12.
ANOVA results.
4.4. Spearman’s Rank Correlation.
We run Spearman’s rank correlation to measure the degree of correlation of the importance index of the success factors across the three organization structures. The results are illustrated in Table 13 and Figure 2, Figure 3 and Figure 4. It is clear from this table that the highest degree of correlation of the importance index is between the function and project organization structures (with a positive r value of 0.785) which indicates that these two organizational structures tend to give attention to closely similar success factors. On the other hand, the lowest degree of correlation is between the function and matrix organization structures (with a positive r value of 0.598) which indicates that these two organizational structures tend to give attention to slightly different success factors.
Table 13.
Correlation results.
Figure 2.
Correlation between function and project structures’ importance index.
Figure 3.
Correlation between function and matrix structures’ importance index.
Figure 4.
Correlation between matrix and project structures’ importance index.
Figure 2, Figure 3 and Figure 4 show scatter plots for the success factors importance index across the three organization structures. It is clear from Figure 2 that success factors importance indices are clustered in diagonal way from the lower left to the upper right which indicates strong positive correlation between the importance indexes of the functional and project organization types. However, the data is more scattered in Figure 3 and Figure 4 because of the less correlation between organization structures types.
5. Conclusions
Extensive research has been carried out in the software engineering and project management communities to try to identify the CSFs that can lead to a successful project. Software project organization structures can be one of the three structures: functional, project, or matrix structure, where there is a difference between them in terms of the working environment, the relationship between staff and management, and skill proficiency of team members. This has motivated us to study whether there is a difference of CSFs across the three structures. For this purpose, we identified a number of SFs and assessed them based on their importance index for each project organization structure separately. Then, the highest ranking SFs are considered as CSFs. After that, we experiment with an ANOVA test and Spearman’s rank correlation test for deeper analysis of the data.
Our findings indicate that there is a slight difference of CSFs across the three organization structures. The three common critical factors across the three organization structures are the right team factor, the team capability factor, and leadership factor. Moreover, the importance order of the CSFs is different across the three structures. In addition, we noticed that certain success factors might be considered most critical in certain structure while it might be considered less critical in another structure. The ANOVA results indicates a slight a difference of the values of SFs importance index across the three organization structures with the ANOVA value (F) equal to 2.743 and with a significance value of 0.075. Moreover, the Spearman’s rank correlation test results show high degree of correlation of the SFs importance index between the function and project organization structures and a low degree of correlation between the function and matrix organization structures. There are some limitations and potential threats to validity for our conclusions. The obtained and discussed results are based on the surveyed companies in Jordan only. We acknowledge that having the respondents from only one country can be a source of bias. Results may change in case the study is conducted in another country or combined countries. Thus, the conclusions of this paper are limited to the local companies in Jordan. For generalization of the findings, replication of this study may be needed in other countries. Another limitation is related to the answers of the respondents. They are based on the perception of respondents, which may affect the results and conclusions.
Author Contributions
Conceptualization, G.A.K.; Formal analysis, A.F.O. and M.H.; Methodology, A.F.O.; Software, G.A.K.; Writing—original draft, A.F.O.; Writing—review & editing, M.H., R.J.S. and H.H.
Funding
This research received no external funding.
Conflicts of Interest
The authors declare no conflicts of interest.
References
- Pinto, J.K.; Slevin, D.P. Critical factors in successful project implementation. IEEE Trans. Eng. Manag. 1987, 1, 22–27. [Google Scholar] [CrossRef]
- Yaghoobi, T. Prioritizing key success factors of software projects using fuzzy AHP. J. Softw. Evol. Process 2018, 30, 1891. [Google Scholar] [CrossRef]
- Berssaneti, F.T.; Carvalho, M.M. Identification of variables that impact project success in Brazilian companies. Int. J. Project Manag. 2015, 33, 638–649. [Google Scholar] [CrossRef]
- Ika, L.A. Project success as a topic in project management journals. Project Manag. J. 2009, 40, 6–19. [Google Scholar] [CrossRef]
- Ralph, P.; Kelly, P. The dimensions of software engineering success. In Proceedings of the 36th International Conference on Software Engineering, Hyderabad, India, 31 May–7 June 2014; pp. 24–35. [Google Scholar]
- CHAOS Report 2015; The Standish Group International Inc.: Boston, MA, USA, 2015.
- Bullen, C.V.; Rockart, J.F. A Primer on Critical Success Factors; Massachusetts Institute of Technology: Cambridge, MA, USA, 1981. [Google Scholar]
- Bruegge, B.; Dutoit, A.H. Object-Oriented Software Engineering: Using UML, Patterns, and Java; Prentice Hall: Upper Saddle River, NJ, USA, 2010. [Google Scholar]
- Fortune, J.; White, D. Framing of project critical success factors by a systems model. Int. J. Project Manag. 2006, 24, 53–65. [Google Scholar] [CrossRef]
- Dvir, D.; Lipovetsky, S.; Shenhar, A.; Tishler, A. In search of project classification: A non-universal approach to project success factors. Res. Policy 1998, 27, 915–935. [Google Scholar] [CrossRef]
- Nasir, M.H.N.; Sahibuddin, S. Critical success factors for software projects: A comparative study. Sci. Res. Essays 2011, 6, 2174–2186. [Google Scholar]
- Garousi, V.; Tarhan, A.; Pfahl, D.; Coşkunçay, A.; Demirörs, O. Correlation of critical success factors with success of software projects: An empirical investigation. Softw. Qual. J. 2019, 27, 429–493. [Google Scholar] [CrossRef]
- Alreemy, Z.; Chang, V.; Walters, R.; Wills, G. Critical success factors (CSFs) for information technology governance (ITG). Int. J. Inf. Manag. 2016, 36, 907–916. [Google Scholar] [CrossRef]
- Purna Sudhakar, G. A model of critical success factors for software projects. J. Enterp. Inf. Manag. 2012, 25, 537–558. [Google Scholar] [CrossRef]
- Gingnell, L.; Franke, U.; Lagerström, R.; Ericsson, E.; Lilliesköld, J. Quantifying success factors for IT projects—An expert-based Bayesian model. Inf. Syst. Manag. 2014, 31, 21–36. [Google Scholar] [CrossRef]
- Brocke, H.F.; Uebernickel, F.; Brenner, W. Success factors in IT-projects to provide customer value propositions. In Proceedings of the 20th Australasian Conference on Information Systems (ACIS), Melbourne, Australia, 2–4 December 2009. [Google Scholar]
- Ahimbisibwe, A.; Daellenbach, U.; Cavana, R.Y. Empirical comparison of traditional plan-based and agile methodologies: Critical success factors for outsourced software development projects from vendors’ perspective. J. Enterp. Inf. Manag. 2017, 30, 400–453. [Google Scholar] [CrossRef]
- Chow, T.; Cao, D.B. A survey study of critical success factors in agile software projects. J. Syst. Softw. 2008, 81, 961–971. [Google Scholar] [CrossRef]
- Stankovic, D.; Nikolic, V.; Djordjevic, M.; Cao, D.B. A survey study of critical success factors in agile software projects in former Yugoslavia IT companies. J. Syst. Softw. 2013, 86, 1663–1678. [Google Scholar] [CrossRef]
- Joslin, R.; Müller, R. The impact of project methodologies on project success in different project environments. Int. J. Manag. Projects Bus. 2016, 9, 364–388. [Google Scholar] [CrossRef]
- Jiang, J.J.; Klein, G.; Hwang, H.G.; Huang, J.; Hung, S.Y. An exploration of the relationship between software development process maturity and project performance. Inf. Manag. 2004, 41, 279–288. [Google Scholar] [CrossRef]
- Wateridge, J. IT projects: A basis for success. Int. J. Project Manag. 1995, 13, 169–172. [Google Scholar] [CrossRef]
- Kateb, G.; Swies, R.; Obeidat, B.; Maqableh, M. An investigation on the critical factors of information system implementation in Jordanian information technology companies. Eur. J. Bus. Manag. 2015, 7, 11–28. [Google Scholar]
- Bonett, D.G.; Wright, T.A. Cronbach’s alpha reliability: Interval estimation, hypothesis testing, and sample size planning. J. Organ. Behav. 2015, 36, 3–15. [Google Scholar] [CrossRef]
- Assaf, S.A.; Al-Hejji, S. Causes of delay in large construction projects. Int. J. Project Manag. 2006, 24, 349–357. [Google Scholar] [CrossRef]
© 2019 by the authors. Licensee MDPI, Basel, Switzerland. This article is an open access article distributed under the terms and conditions of the Creative Commons Attribution (CC BY) license (http://creativecommons.org/licenses/by/4.0/).