Information Security Risk Propagation Model Based on the SEIR Infectious Disease Model for Smart Grid

1
Institute of Advance Technology, Nanjing University of Posts and Telecommunications, Nanjing 210046, China
2
School of Computer Science and Information Security, Guilin University of Electronic Technology, Guilin 541004, China
*
Author to whom correspondence should be addressed.
Information 2019, 10(10), 323; https://doi.org/10.3390/info10100323
Submission received: 2 September 2019
/
Revised: 13 October 2019
/
Accepted: 14 October 2019
/
Published: 21 October 2019
Abstract
:With the high integration of smart grid information and physical systems, the security of information systems must affect the safe and stable operation of physical systems. Risk assessment is an effectual means to objectively evaluate the information security threats of the smart grid. However, the existing risk assessment methods are aim at solving the threat of security risks in communication networks and information systems in the smart grid, but there is no in-depth study on how the spread of information security risks between information systems and physical systems in the smart grid. Therefore, based on the traditional infectious disease transmission theory, the information security risk propagation model based on the Susceptible–Exposed–Infected–Recovered (SEIR) infectious disease model for smart grid (ISRP-SEIRIDM) is proposed in this paper. In ISRP-SEIRIDM, we analyze the information interaction between information collection devices and define the connection of nature and the security risks between the information collection devices in the smart grid. At the same time, we also study the impact of the number of information acquisition devices and information interaction capabilities of these devices on the speed of security risk transmission between information systems and physics systems in the smart grid and the maximum risk range. Experimental results show that the risk propagation range can be significantly reduced by optimizing the data interaction capability and information transmission path between information collection devices in the smart grid; when a probability from a susceptible state to an exposed state reduces by 0.15, the maximum spread and average spread of security risk will be reduced by 7% and 1.96%, respectively.
1. Introduction
A smart grid is a fully automated power supply network in which each power user and node can be monitored in real-time to ensure the bidirectional flow of current and information at every point between the power plant and the customers [1,2]. The traditional three-way defense of the grid information system is shown in Figure 1. With the expansion of the intelligent and interactive services of a smart grid, the user side continues to extend to the information extranet side, and security threats to information systems will continue to grow [3]. The deep integration of smart grid information and physical systems will further lead to network attacks on the information system, which will directly affect the security and stable operations of the physical system while damaging its functions.
In recent years, attacks on smart grids through the Internet have occurred periodically. On 23 December 2015, the Ukrainian power supply system was attacked by a malicious code. This caused 700,000 households in Western Ukraine to lose power for several hours, which brought huge economic losses to the country and the people [4]. On 25 January 2016, the Israel Electricity Authority suffered a serious cyberattack. After the incident, the Israeli authorities were forced to shut down all infected computers in the power facilities to prevent further deterioration of the situation [5]. On 7 March 2019, the Venezuelan power grid suffered an electromagnetic attack that caused a large-scale blackout in the country. It was one of the largest blackouts in the history of the country, and only five of the 23 states were unaffected [6]. As a national critical infrastructure, power systems have become an important target of cyberattacks [7,8,9,10]. These attacks can achieve effects similar to physical attacks, leading to the paralysis of substations and the entire energy supply system. The existing information security protection strategy cannot completely overcome the objective impact of the cyberattack threats of the information system on the physical system of the power grid. In a zone with Internet access, attack information may enter the information extranet from the Internet, and once the criminals obtain sensitive information data from the grid, there will be great security risks to the grid system.
The information collection system of a power grid is shown in Figure 2. Information on the use of electricity is continuously collected and analyzed as data support for power generation, distribution, and transmission of electricity. With the continuous emergence and improvement of various interactive services in the smart grid (access to distributed energy such as photovoltaic and wind power and the establishment of electric vehicle charging stations), the information acquisition system of power grids will become more complicated. Increasingly more information systems will be directly oriented to users. Although these systems bring increased convenience to users, they also increase the ways in which one can attack a system. As various types of network security risks increase, these network security threats to the information systems in the smart grid will directly affect the safe operations of physical systems in the smart grid [11]. For example, in a wind power system, the data acquisition end of the wind power system includes sensors and data acquisition devices. The location of the wind farm is usually remote and far away from the city, and most of the control equipment will face the problem of untimely operating system upgrades, which will expose the control system to risks. Once these security holes are exploited by criminals, it will interfere with the accuracy of the collected information, thereby interfering with the wind farm’s power generation plan and causing deviations in the power planning. In serious cases, there may also be power outages. Therefore, how to construct the propagation model of information security risk in a smart grid between the information system and the physical system is essential for the active defense of the information security of the smart grid [12,13].
In a smart grid, the propagation protocols and security measures that are used by device nodes (information collection devices) in the same area are unified. A network attack based on a vulnerability can attack any device node in this area. Once a node device in this area is destroyed, the node that has information interaction with this node may also be attacked, which will ultimately affect the operations of the physical system of the substation. For example, the user can acquire, destroy, modify, or delete various power consumption data in the area by attacking the user’s smart meter, the substation detector of the cell, or the total information detector of the area. These behaviors will affect the analysis of the overall power consumption situation, which will have a huge impact on the distribution and power consumption of the entire area and will affect the normal operation of the smart grid in this area.
Most of the existing studies on information security protection for smart grids focus on information security risk assessment [14,15,16,17,18], network attacks against power grids [19], and so on. The current research does not consider how the information security risk affects the physical system of the smart grid and the specific laws of this impact. Therefore, it cannot provide a theoretical and methodological reference for the subsequent grid physical system security protection. An infectious disease model is a mathematical model of how infectious diseases spread among people [20]. It is a good way to explain the transmission process of infectious diseases in the population, the probability of the infection of normal individuals in the population, and the impacts on individuals after infection. To better explain the propagation mechanism of Information system security threats in the physical system of a smart grid, this paper proposes the Information security risk propagation algorithm based on the Susceptible–Exposed–Infected–Recovered (SEIR) infectious disease model for a smart grid (ISRP-SEIRIDM). The major contribution of our work are listed as follows.
(1) To better evaluate the spread of risk, we apply the infectious disease algorithm to the risk propagation model and propose the information security risk propagation algorithm based on the SEIR infectious disease model for a smart grid (ISRP-SEIRIDM).
(2) The experimental results show that the algorithm can simulate the propagation process of risk in a smart grid information system. The risk propagation range can be significantly reduced by optimizing the data interaction capability and information transmission path between the information collection devices in the smart grid.
The remainder of this paper is organized as follows. Section 2 discusses the related works. Section 3 introduces the information security risk propagation model based on the SEIR Infectious Disease Model for a smart grid. Section 4 conducts detailed comparative experiments. Finally, conclusions are given in Section 5.
2. Related Work
2.1. Risk Assessment
At present, many researchers have begun to research and apply risk assessment to smart grids, including the aspects of power generation; transmission; distribution and consumption; and the planning, design, operation, and maintenance of intelligent grid information nodes. Li and Xu et al. [18] established a complex information system security risk propagation model based on cellular automata and studied the risk propagation problems in four network topologies: the nearest neighbor coupled network, the random network, the WS small world network, and the BA scale-free network. Lu and Liu et al. [21] analyzed the impact of information systems on protection behavior, established a reliable model of information systems, and proposed a grid risk assessment method that considers the reliability of information systems. Kosut and Jia et al. [19] consider the strategies of covert attacks by adversaries on smart grid meters by injecting malicious data with the goal of affecting the power system state estimation. Ghanbari and Jialili et al. [22] study the mechanism of cascade failures’ propagation in power systems. Dey and Mehra et al. [23] studied the basic topological characteristics of a power grid in detail and calculated the average fault propagation under different topological conditions. de Jong and Papaefthymiou et al. [24] proposed a risk-based safety assessment method that assesses the operational safety of a power system with uncertainty in the topology and prediction error in the power system risk assessment. Peng and Sifeng et al. [17] proposed an idea based on the gray clustering analysis method to evaluate the security risk of power systems and studied the power system security risk assessment model using gray clustering and maximum entropy theory. Falahati and Fu et al. [11] combined the impact of network failures on grid reliability and quantitatively assessed the reliability of modern power systems. Zhao and Lu et al. [16] considered the risk factors of information systems in the model and proposed a power system risk assessment method based on the comprehensive fault probability model. Ding and Xiao et al. [25] analyzed the existing grid cascading failure chain model and proposed a development model based on the accident chain model and fuzzy clustering algorithm to predict cascading failures. Yan and Wang et al. [26] studied the framework and methods of the safety and risk assessments of large power grids based on the status quo of regional power grids and risk control requirements.
The current risk assessment technologies only analyzed the weak points in the smart grid system and evaluated the overall grid system risk. The characteristics of risk propagation in a smart grid information system and the risk of information leakage that is faced by the entire smart grid system after the nodes in the system are successfully attacked are not studied. Because the vulnerability of the information infrastructure of the power information system is objective, the risk of an attack on the power grid system cannot be ignored. This paper focuses on the propagation of risk in a smart grid information system and visualizes the process of risk propagation.
2.2. Infectious Disease Model
The infectious disease model can express the quantitative relationship between the related factors in the process of infection propagation. The initial proposal is to study the process of disease transmission [20,27,28], which is now widely used to study the process of information dissemination. Giri et al. [29] studied the spread of malware on Twitter based on the infectious disease model. Chen and Chen [30] designed a research project from the perspective of the role of network opinion leaders, established an opinion interaction model, and proposed a new method to analyze the evolution of events. Gardner et al. [31] studied botnet attacks in the Internet of Things using the SEIRS infectious disease model. Chen et al. [32] used infectious disease models to analyze the dynamics of information transmission in cognitive sensor networks. In recent years, infectious disease models have also begun to be applied to information dissemination in the power industry. Romero-L et al. [33] proposed an SI infectious disease model to assess the spread of voltage sag in distribution systems. Wu et al. [34] established a data-driven power system disturbance propagation dynamic model based on the spread of infectious disease models and network disturbances. Cisotto et al. [35] studied the safe propagation process in smart grids using an infectious disease model that was applied to cellular automata. Tian et al. [36] proposed a cascade fault model and a fault chain propagation model and verified it on the IEEE 39 bus system.
The current infectious disease models had not been used in the field of risk propagation in smart grids. This paper combines complex network theory and risk propagation theory and builds a smart grid information system risk propagation model based on the infectious disease model. According to the characteristics of the information acquisition devices in the grid information system and the complex relationship, the intelligence defines the connection properties between the information collection devices. According to the information interaction relationship between the information collection devices, the vulnerability of the information collection node is defined. Finally, the characteristics of risk propagation in the smart grid information system are analyzed using simulations.
3. Information Security Risk Propagation Model Based on SEIR Infectious Disease Model for Smart Grids
3.1. Information Security Risk Propagation Method for a Smart Grid
The security issues of smart grids include physical security and information security. With respect to smart grid information systems, the risks in the information systems may be transmitted to physical systems and cause power equipment failures. The informatization of smart grids and the deep integration of physical and information systems in smart grids have brought new hidden dangers to the security of power grids. The network attacks against information systems will also transmit to the physical system and threaten its safe operation while destroying its functions. Power information security network management is mainly used to prevent and predict various security issues in the use of power information networks, create a healthy network operating environment, and to provide support and assurance for the safe and efficient operation of power systems. Therefore, it is necessary to strengthen the safety risk assessment mechanism of power information networks in new situations.
The communication network of a smart grid system can be divided into a dedicated network and a general network. In the past, data transmission over private networks typically relied on specialized and privatized propagation protocols. These propagation protocols are difficult to resolve for common network attacks. However, to achieve greater data sharing and interoperability between devices, it has become a common practice to adopt standardized propagation protocols in power systems. Domestic researchers have also performed research on open propagation systems. With the gradual improvement of the demand for intelligent power grids, the informatization degree of smart power grids is also increasing, and the information interaction between the information collection devices in the smart power grid has become very close. To facilitate the flow of information, the security measures that are used in the information collection devices of the same area are unified. Because of this feature, attacks on an information collection device in a smart grid system can also be used in the area of other information collection devices. As these information collection devices perform very frequent interactions such as information analysis, such attacks can also infect other information collection devices through information interactions. In this way, it will be easier for an attacker to launch a network attack. By attacking the information acquisition device in a smart grid system, the attacker can more easily obtain relevant information about the operation of the smart grid system, and the attacker can even directly affect the operational stability of the power system, especially the distribution system.
3.2. SEIR Infectious Disease Model
The susceptible–infected–recovered (SIR) infectious disease model was first proposed to describe the spread of diseases. Susceptible refers to a healthy population that lacks immunity and is susceptible to infection after contact with an infected person, infected refers to an infected person who can transmit the disease to susceptible people, and recovered refers to people who are immune, dead, or quarantined. The SIR infectious disease model is defined as follows,
where is the probability of the susceptible population being infected; is the probability of the infected population recovering from the infection cycle; is the probability of the susceptible population removing from the recovered population; and , , and , respectively, represent the numbers of susceptible, infected, and recovered people at time t.
As the SIR infectious disease model was proposed, many methods for analyzing the epidemiology have emerged. In recent years, the infectious disease model has been used to describe the spread of computer viruses. Exposed states can describe the time between when the virus infects a system to the onset of symptoms, and the addition of the exposed state allows the infectious disease model to simulate the spread of a virus. The model is called the susceptible–exposed–infected–recovered (SEIR), given as follows,
where is the probability that the susceptible population is infected; is the probability that the susceptible population that is infected is the recovered population; is the probability that the recovered population is transformed into the infected population; is the probability that the infected population recovers from the infection cycle; and , , , and , respectively, represent the numbers of susceptible, exposed, infected, and recovered people at time t. For some infectious diseases, the model is a better way to model the spread of the disease.
3.3. ISRP-SEIRIDM
With the development of computer technology, the complexity of information systems for smart grids has been greatly improved, and the factors affecting the spread of risks between the information systems of the smart grid are more complicated. The risk will spread with the transmission of information in the information system for the smart grid. The smart grid realizes the collection of information through intelligent substations, smart meters, real-time detection systems, and other information collection devices. These information collection devices constitute a very complicated network. According to the characteristics of the information collection device in the smart grid system, in this paper, the information acquisition device that has not been successfully attacked is understood to be an exposed state. The information collection device that was successfully attacked is in an infected state. The infected information collection device can be restored to a healthy state using its own antivirus software and externally added defense resistance measures, and it is in an immune state at this time. If the information collection device in the infected state does not return to the normal state for a long time, it will lose its information interaction ability and be dead. Recovered states include the dead state and immune state. In view of the peer to peer network structure of the information system for a smart grid, combined with the characteristics of the SEIR infectious disease model, a series of analyses is carried out on the risk propagation of a smart grid information system. The workflow of this model is shown in Figure 3.
The status of information security risk propagation in the smart grid is shown in Figure 4. Here, S is the number of information collection devices in a susceptible state, E is the number of information collection devices in the exposed state, I is the number of information collection devices in the infection status, and R is the number of information acquisition devices in the recovered state. Table 1 provides a detailed description of these parameters. Once a certain information collection device in the system is successfully attacked, other information collection devices are also attacked at a probability of (through the transmission of information). The information collection device (exposed state) after being attacked is converted into the infected state at a probability of , and converted into the recovered state at a probability of . Whether the attacked information collection device is converted into the infected state or the immune state depends on the affordability of the system. The information collection devices that are not attacked are all defined as susceptible states. The information collection device in the infected state can transmit the risk of the attack to another information collection device through information interactions. The information collection device in an infected state can be restored to an immune state at a probability of using additional protection means, or it can be converted into the dead state at a probability of . The information acquisition devices in the immune state and the dead state are not infectious. The information acquisition devices in the immune state change to the susceptible state at a probability of , and the information collection devices in the dead state change to the susceptible state at a probability of .
The information interaction between the information collection devices in the information system of the smart grid is very common and necessary. The closeness of the information collection devices is determined by the frequency of the information exchange and the size of the data stream. To better describe the relationship between information collection devices, this paper creates a node matrix of information collection devices, abstracts the information collection devices in the smart grid information system into individual nodes, and expresses the space of the smart grid information system as an N-dimensional matrix of N nodes in the smart grid information space, where n is the total number of nodes (information collection devices), Z is the total number of connected edges, and the entire smart grid information system is represented by a matrix M. represents the tightness between two nodes. The larger the value of is, the closer the relationships between the nodes. However, when the interaction frequency of two nodes or the data flow of information interaction is 0, is used to express the tightness between the two nodes. That is, there is no direct connection between the two nodes. If the value of the tightness between nodes is greater than 0, then the two nodes are considered to be neighboring nodes.
According to the infectious disease model and the risk propagation status of the smart grid information system, the risk propagation model is defined as follows.
The coefficient indicates the probability that the susceptible node is attacked. This paper uses the vulnerability of the smart grid information system network to represent . The vulnerability of smart grid information systems is reflected in the tightness between nodes in complex networks. Considering the diversity of the information flow in the information system for the smart grid, the tightness of the information interaction between nodes and their neighbors is used as a measure of the value of the attack. If the tightness between this node and other neighboring nodes is relatively high, the amount of information flowing through this node is relatively large, the value of the attack is greater, and the more places that can be exploited as vulnerabilities. In this paper, the median value of the tightness between a node and its neighbors is used to represent the vulnerability of the node. The vulnerability is denoted as , where is the tightness between the node and it connected nodes, represents the combination of all neighbors of the node, and is the number of all neighboring nodes of the node.
The vulnerability of the information system of the smart grid is closely related to the vulnerability of each node. Due to the large number of information collection devices and the complexity of the information flow process, there are large differences in the vulnerability of the nodes in a smart grid. This paper uses the average of all node vulnerabilities to represent the vulnerability of the entire grid information system. The vulnerability of the grid information system is defined as follows,
The probability of the information collection device from the susceptible state to the latent state is defined as follows,
where is the attack coefficient of the smart grid information system.
The change in the number of infected nodes will affect the vulnerability of the entire grid information system, and will change accordingly. In this paper, the probability of the information collection device passing from the susceptible state to the exposed state is redefined as .
The coefficient of the information collection device from the exposed state to the infected state indicates the probability that the exposed node is successfully attacked. The security protection measures (such as security protocols, firewalls, etc.) that are established for the information collection device of the smart grid information system provide the nodes with a certain ability to withstand attacks. The affordability of smart grid information systems is also related to the vulnerability and relevance of each node. As the nodes in the same area of the smart grid system are installed with the same security protection measures, the correlation of the nodes in the smart grid information system is defined as follows,
where is the number of neighboring nodes and is the set of all neighbors of this node. In view of the large number of information collection devices in the smart grid information system, this paper uses the average of all node correlations to represent the correlation of the network in the entire smart grid information system. The correlation of the system is defined as follows,
The ability of the smart grid information system to withstand attacks is related to the vulnerability of the system, the correlation, the strength of the attack , and the security protection capability of the information collection device. The affordability of the smart grid information system is defined as follows,
where F is the vulnerability of the smart grid information system, L is the correlation of the smart grid information system, m is the vulnerability capability coefficient, and n is the correlation capability coefficient.
The change in the number of infected nodes will affect the vulnerability and correlation of the entire grid information system, and will change accordingly. In this paper, the probability of a node passing from the susceptible state to the exposed state is redefined as .
The coefficient, , of the information acquisition device from the exposed state to the immune state is determined by the affordability of the smart grid information system. When the capacity of a node is sufficient to withstand the risk of attacks, the node can be transferred from the exposed state to the immune state. The coefficient is denoted as , is the protection coefficient, and is the security protection capability of the information collection devices. When the smart grid information system is exposed to risks, the system protection capability can be artificially added to the information system.
The coefficient, , of the node from the infected state to the immune state is determined by the system’s own recovery capability and the added protection capability. The coefficient, , of the node transitioning from the infected state to the dead state is determined by its own recover capability and the protection capability added to the system. If the system’s own resilience and the added protection of the system are not enough to restore the system to a susceptible state, the node will be in a state of death. In the smart grid information system, the node will temporarily lose the information interaction ability after it is in a state of death, and the information interaction capability can be regained until the node’s own recovery capability restores it from a dead state to a susceptible state.
The value of the probability, , of the node transitioning from the immune state to the susceptible state and the probability, , of transitioning from the dead state to the susceptible state are determined by the strength of the attack, . Nodes in immune state means that it will be almost never be attack by the same attack. The coefficient is defined as , is the immune state recovery coefficient, and is the strength of the attack. Nodes in dead state means that this node lose the ability of information interaction, the coefficient is defined as , is the dead state recovery coefficient, and is the strength of the attack.
This paper only discusses the situation in which the risk propagation in the information system is directed to an attack, and so immune nodes and dead nodes are less likely to be infected again. The value of the probability, , of the node transitioning from the immune state to the susceptible state is set to 0.03. The value of the probability, , of transitioning from the dead state to the susceptible state is set to 0.015.
The risk propagation model in the smart grid information system is defined as follows,
where ) is the sum of all nodes in the smart grid system in an area. The third part of this paper conducts the experiments and analyzes this risk propagation model.
4. Experimental Analysis
4.1. Experimental Environment
The risk propagation process in an information system causes the physical system in the smart grid to be affected by the vulnerability, correlation, and intensity of information system attacks. Therefore, this paper has set up a series of simulations to analyze the risk propagation process and propagation range, study the effect of the vulnerability and correlation of information collection devices, the ability of the power grid to withstand attacks, and the effect of the size of the smart grid system on the risk propagation.
It is necessary to pay attention to the change of the number of different state information collection devices in the simulation process. The main factor affecting the number of latent state information collection devices is the vulnerability of the information system. The number of infected information collection devices reflects the protection capabilities of the information system. The more the number of infected state, the more information is lost in the nodes, and the leakage of such information will adversely affect the stable operation of the smart grid. The sum of the numbers of information collection devices in the immune state and the healthy state indicates the survivability of the information collection device of the information system under attack. We performed a series of simulation verifications on this model. To ensure the applicability of this model in the power system, this paper also carried out simulation experiments in the IEEE 30 bus system. The process of changing the number of information acquisition devices in five different states is displayed.
4.2. Experimental Data
The propagation of risk in a smart grid information system is affected by the vulnerability, correlation, and intensity of attacks on the smart grid information system. This paper designed a variety of programs to compare the impacts of changes in these factors on the risk propagation state. The risk propagation model in Model 1 does not impose additional protection measures on the system, and everything is protected by the system itself; Model 2 optimizes the transmission of the data streams between the smart grid information collection devices; Model 3 studies the correlation between the information acquisition devices in the smart grid information system; Model 4 analyzes the security protection capacity of the smart grid information system on the risk propagation process; Model 5 elevation the system’s own recovery capability of the smart grid information system. Models 6 and 7 study the strength of the attack of the smart grid information system on the risk propagation process. Because the distribution of the information acquisition devices in the smart grid information system is very complicated and the numbers in different regions also vary, this experiment also studies the influence of the difference in the number of information collection devices on the propagation of risks in the smart grid information system in model 8. The parameter information is shown in Table 2. The simulation was carried out on the IEEE30 bus system to analyze the risk propagation process. The data used in the IEEE 30 bus system is IEEE standard data. In the IEEE bus system, this paper solves the impedance of each node and adjacent nodes. When the impedance is infinite, the node is infected. When the impedance is within a reasonable range, the node is in an immune state.
4.3. Evaluation Index
During the propagation of risk in a smart grid, the speed of risk propagation and the spread of risk will have major impacts on the safe and stable operations of the grid. Once the transmission speed becomes too fast, the safety supervisors of the smart grid cannot respond to risks in time to control them. The propagation scope directly determines the information loss in the smart grid and the stable operations of the grid. This paper use the maximum risk propagation range, the risk propagation range, and the speed of risk propagation as evaluation indexes of the risk propagation situation in a smart grid information system.
Definition 1.
The maximum risk propagation range is the ratio of maximum number of infected nodes to the total number of nodes, and it is calculated as , where is the maximum number of infected nodes and is the total number of nodes.
Definition 2.
The risk propagation range is the ratio of the number of infected nodes that tend to be stable (the spread of propagation when the number of infected nodes no longer changes) to the total number of nodes, and it is calculated as , where is the number of infected nodes at time and is the total number of nodes.
Definition 3.
The speed of risk propagation is the number of infected nodes that tends to be stable(the value of the number of infected nodes no longer changes. ) with respect to time. It is calculated as , where is the number of infected nodes at the stable time and is the total number of nodes.
4.4. Experimental Analysis
This paper conducts a series of analyses of the risk propagation process in a smart grid information system. The process of risk propagation in a smart grid information system relies on the information interaction between the information collection devices. The probability of risk propagation is affected by the interaction capability between the information collection devices. The speed of risk propagation is affected by the safety measures of the information collection devices. The numbers of various state node changes over time in models 1–8 are shown in Figure 5. This paper compares the maximum risk propagation range, the risk propagation range, and the risk propagation speed for models 1–8; the results are shown in Figure 6.
Model 1 analyzes the risk propagation process in an area. The simulation results show that the number of infected information collection devices will gradually decrease and stabilize after a rapid increase to a maximum point. This is because the information collection devices can resist attacks and restore themselves. However, due to the limited self-recovery ability, the number of infected nodes is still large.
Model 2 optimizes the transmission of data between information collection devices in a smart grid, thereby avoiding the repeated transmission of data. This move can accelerate the total analysis capabilities of the data center and reduce the probability of the information collection device being infected. Compared with model 1, the risk propagation speed is lower. The maximum risk propagation range and the risk propagation range are reduced.
Model 3 optimizes the security protection measures of the information collection devices. For example, it updates and improves the protection measures that are installed on the information collection device in a timely manner. Compared with model 1, the risk propagation speed and the risk propagation range are reduced, but it has less effect of the maximum risk propagation range.
Model 4 improves the security protection capability of the information collection devices in the smart grid information system by optimizing the transmission path of the data. Compared with model 1, the risk propagation range and the risk propagation speed are slightly lower. As the optimization of the information transmission path between the information collection devices in the smart grid is affected by the overall area planning and the existing equipment hardware, the optimization measures that can be performed are limited. Therefore, this program cannot effectively control the risk propagation process.
Model 5 elevation the system’s own recovery capability of the smart grid information system, results shows that adding effective protective measures to the smart grid information system can greatly reduce the risk propagation range. However, this will produce larger data and have a great impact on the timeliness of data transmission and analysis.
Models 6 and 7 study the strength of the attack of the smart grid information system on the risk propagation process, model 6 reduces the value of the probability of the node transitioning from the immune state to the suspectable state, and model 7 reduces the value of the probability of the node transitioning from the dead value to the suspectable state. Compared with model 1, the maximum rang of risk propagation, risk propagation rang, and the speed of risk propagation have almost no change; this also indicates that for the same attack method, the change of and will not have much impact on the risk propagation process.
The differences in China’s regional populations are large, resulting in different numbers of information collection devices that are included in smart grid information systems. Model 8 analyzes the spread of risk in a smart grid information system that contains more information gathering devices. As the number of information collection devices has increased from 10,000 to 50,000, the information interaction between the information collection devices is more complicated, the probability that the information collection device is infected increased, and the resistance of the information system to risk attacks is reduced. Figure 5 shows that increasing the number of information acquisition devices in a smart grid information system can increase the risk propagation speed, and the risk spread range will be greatly increased.
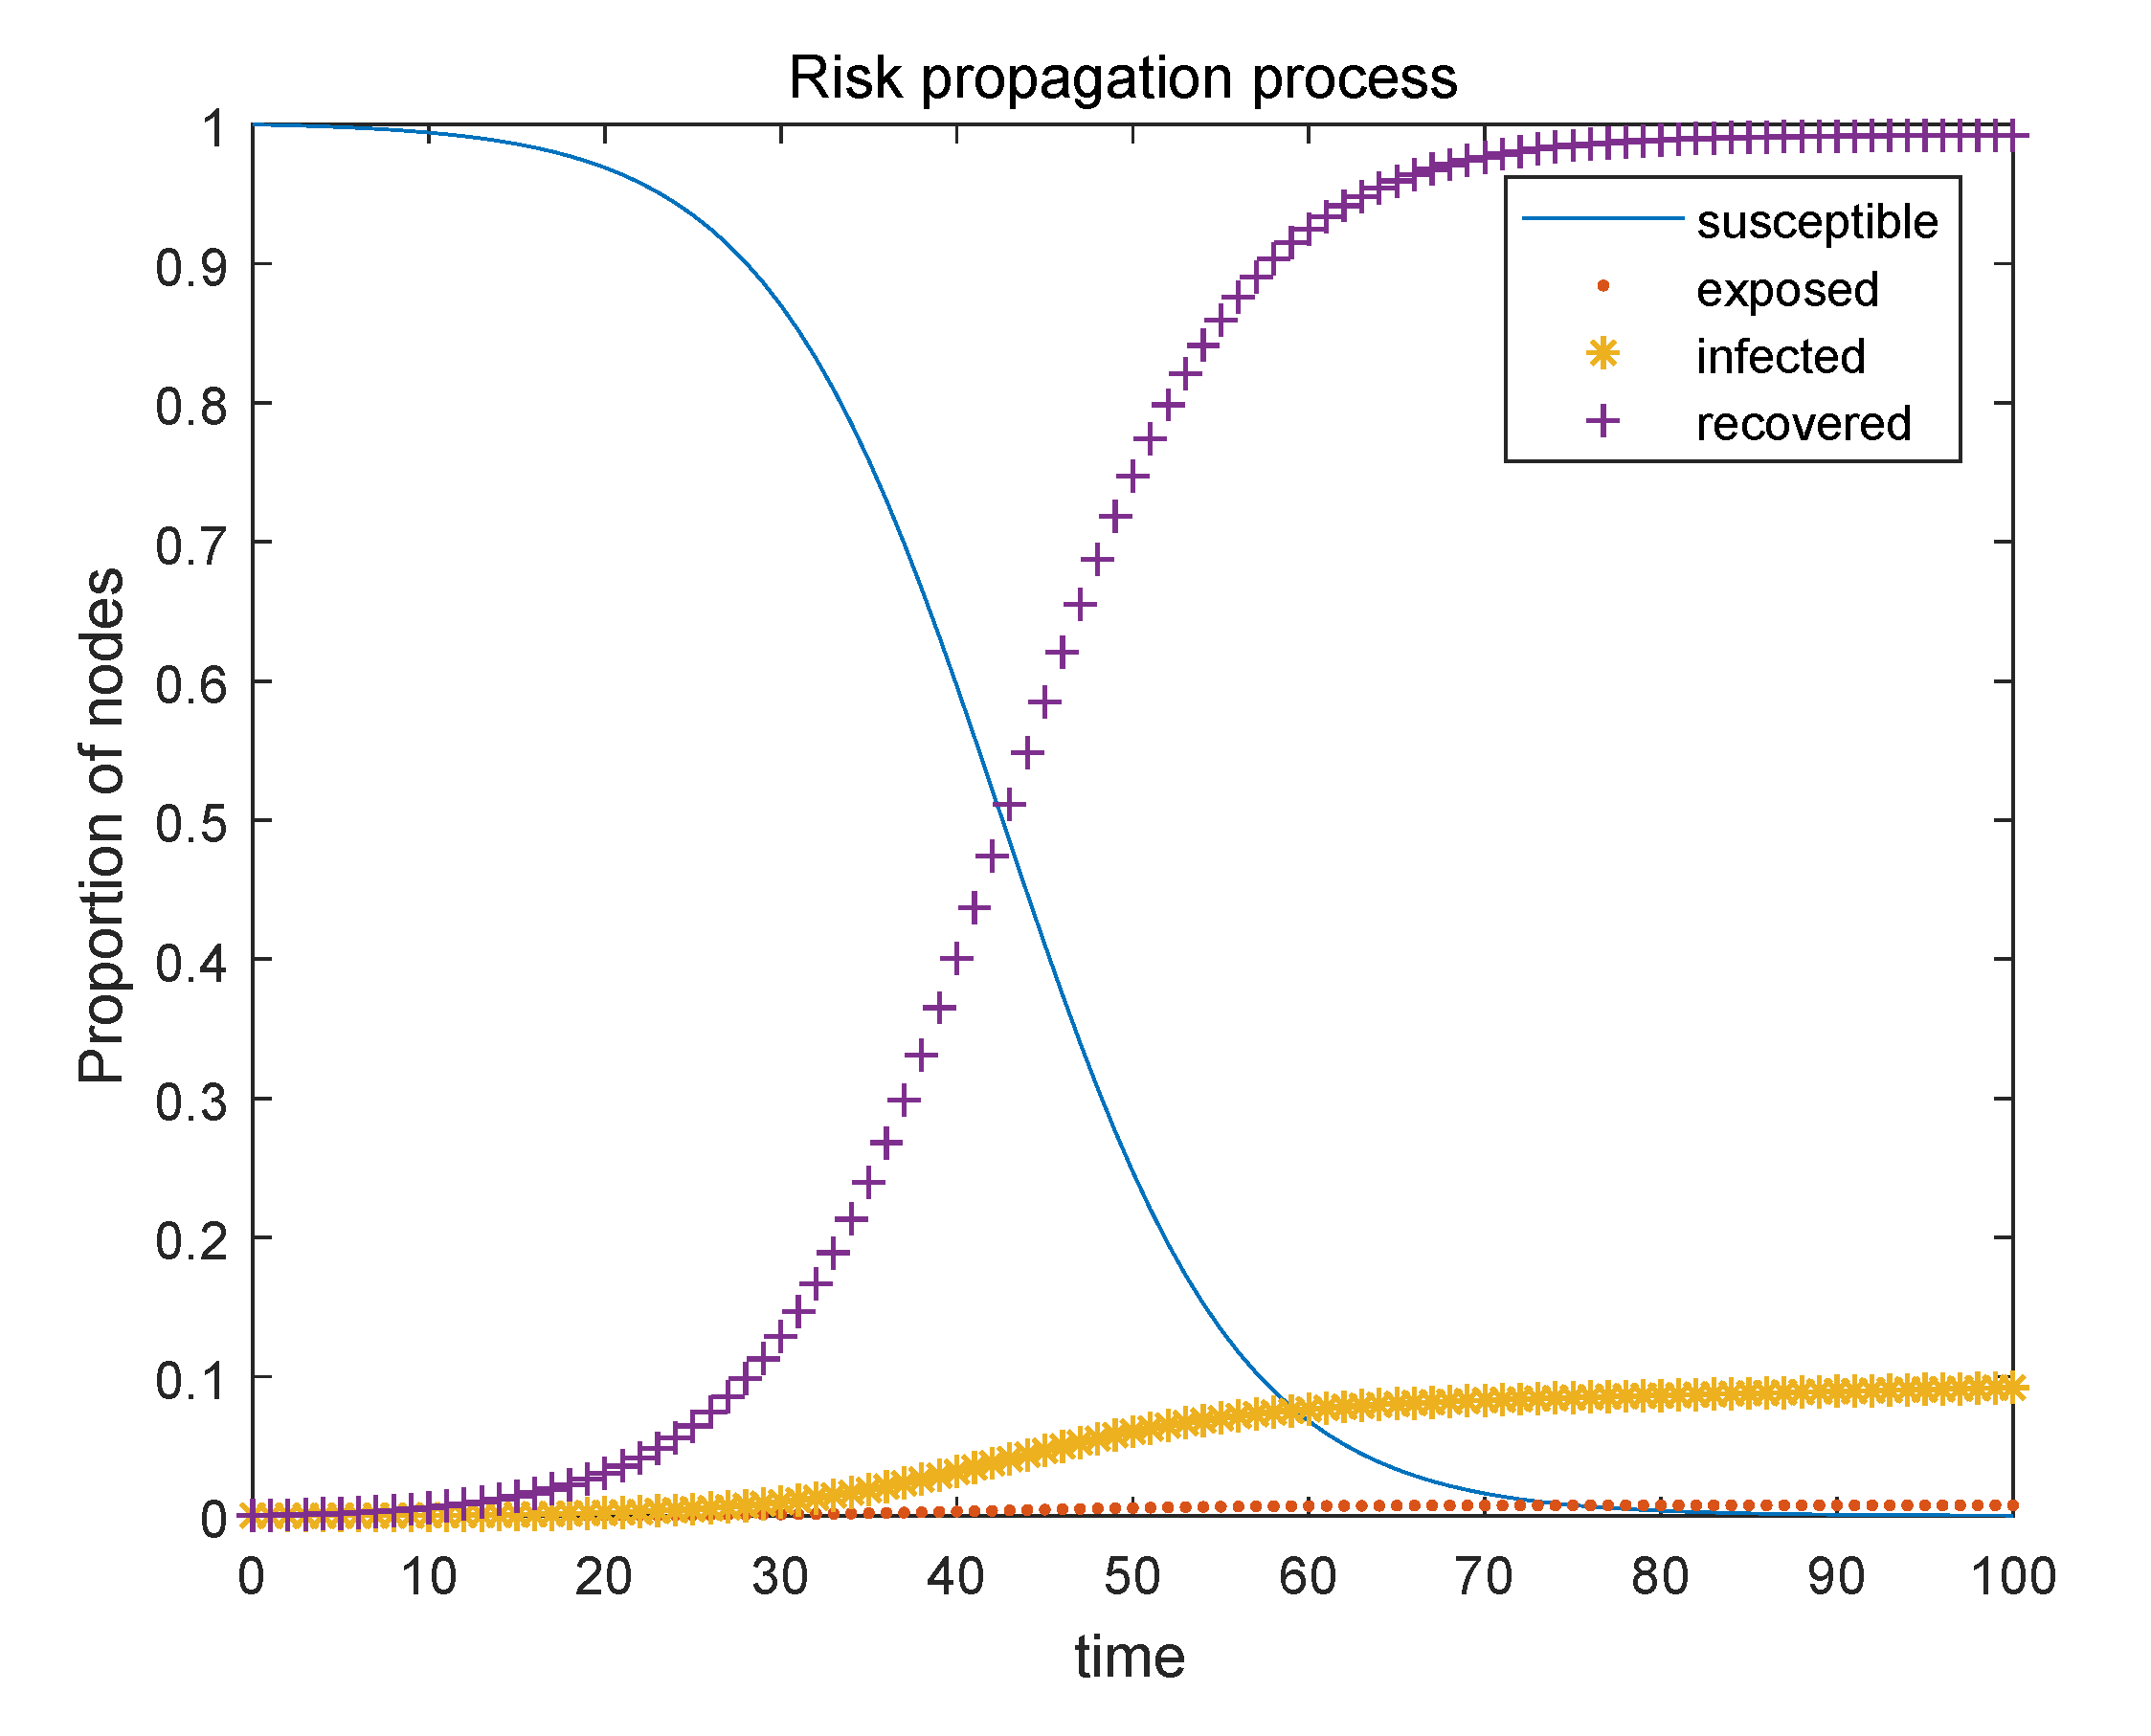
The model in this paper is simulated in the ieee 30 bus system. Calculate the active power of the node and compare the results of the changes in the number of nodes of different types, as shown in the Figure 7, in the ieee node system, the number of infected nodes will eventually stabilize.
Comprehensive analysis and comparison found that, with respect to the risk in a smart grid information system, because of the inherent security protection measures in the information system, the number of infections in the system is eventually steady. This also shows that once the risk spread is too large, if effective protection measures cannot be added to the system in a short period of time, the system will lose much data and the normal operations of the smart grid system will also be greatly affected. The optimization of the information interaction between information acquisition devices in a smart grid information system and the timely update of the security protection measures in the information collection device will reduce the risk propagation speed and propagation range. However, with more intelligent information collection devices in grid systems, and due to the complexity of their data stream interactions, the transmission speed and the transmission range will be greatly increased. This requires optimizing the information system security protection measures while optimizing the information interaction between the information collection devices to reduce the risk spread.
5. Conclusions
The intelligent grid information system risk propagation algorithm based on the infectious disease model that is proposed in this paper quantifies the information interaction of the information collection devices in a smart grid information system, and it combines the infectious disease model with risk propagation, which allows for quick and clear analysis. The risk propagation process effectively evaluates the risk propagation process in a smart grid information system. The evaluation information given can help staff better understand the shortcomings of a smart grid information system when facing the risk of attacks to optimize these situations and can help reduce the damage to the smart grid during the attack. The information will better ensure the normal operations of the smart grid, and it also provides reliable data support for controlling risk situations and dealing with risks.
Author Contributions
B.Z., S.D. and Z.Z. contributed to the conception of the study; B.Z., Y.X., and X.Y. designed and performed the experiments; B.Z. and Y.X. analyzed the data; B.Z. wrote the manuscript.
Acknowledgments
This work was supported by the National Natural Science Foundation of China (Nos. 51507084 and 61363037)
Conflicts of Interest
The authors declare no conflicts of interest.
References
- Gungor, V.C.; Sahin, D.; Kocak, T.; Ergut, S.; Buccella, C.; Cecati, C.; Hancke, G.P. Smart grid technologies: Communication technologies and standards. IEEE Trans. Ind. Inform. 2011, 7, 529–539. [Google Scholar] [CrossRef]
- McDaniel, P.; McLaughlin, S. Security and privacy challenges in the smart grid. IEEE Secur. Priv. 2009, 7, 75–77. [Google Scholar] [CrossRef]
- Aloul, F.; Al-Ali, A.; Al-Dalky, R.; Al-Mardini, M.; El-Hajj, W. Smart grid security: Threats, vulnerabilities and solutions. Int. J. Smart Grid Clean Energy 2012, 1, 1–6. [Google Scholar] [CrossRef]
- Case, D.U. Analysis of the Cyber Attack on the Ukrainian Power Grid; Electricity Information Sharing and Analysis Center (E-ISAC): Washington, DC, USA, 2016. [Google Scholar]
- Li, Z.W.; Tong, W.M.; Jin, X.J. Construction of cyber security defense hierarchy and cyber security testing system of smart grid: Thinking and enlightenment for network attack events to national power grid of Ukraine and Israel. Autom. Electr. Power Syst. 2016, 40, 147–151. [Google Scholar]
- Vaz, R. Venezuela’s power grid disabled by cyber attack. Green Left Weekly, 15 March 2019; 15. [Google Scholar]
- Depuru, S.S.S.R.; Wang, L.; Devabhaktuni, V.; Gudi, N. Smart meters for power grid—Challenges, issues, advantages and status. In Proceedings of the 2011 IEEE/PES Power Systems Conference and Exposition, Phoenix, AZ, USA, 20–23 March 2011; pp. 1–7. [Google Scholar]
- Amin, S.M.; Wollenberg, B.F. Toward a smart grid: Power delivery for the 21st century. IEEE Power Energy Mag. 2005, 3, 34–41. [Google Scholar] [CrossRef]
- Wang, W.; Lu, Z. Cyber security in the smart grid: Survey and challenges. Comput. Netw. 2013, 57, 1344–1371. [Google Scholar] [CrossRef]
- Delgado-Gomes, V.; Martins, J.F.; Lima, C.; Borza, P.N. Smart grid security issues. In Proceedings of the 2015 9th International Conference on Compatibility and Power Electronics (CPE), Costa da Caparica, Portugal, 24–26 June 2015; pp. 534–538. [Google Scholar]
- Falahati, B.; Fu, Y.; Wu, L. Reliability assessment of smart grid considering direct cyber-power interdependencies. IEEE Trans. Smart Grid 2012, 3, 1515–1524. [Google Scholar] [CrossRef]
- Sridhar, S.; Hahn, A.; Govindarasu, M. Cyber–physical system security for the electric power grid. Proc. IEEE 2012, 100, 210–224. [Google Scholar] [CrossRef]
- Varaiya, P.P.; Wu, F.F.; Bialek, J.W. Smart operation of smart grid: Risk-limiting dispatch. Proc. IEEE 2011, 99, 40–57. [Google Scholar] [CrossRef]
- Marsadek, M.; Mohamed, A.; Norpiah, Z. Risk of static security assessment of a power system using non-sequential monte carlo simulation. J. Appl. Sci. 2011, 11, 300–307. [Google Scholar] [CrossRef]
- Habash, R.W.; Groza, V.; Krewski, D.; Paoli, G. A risk assessment framework for the smart grid. In Proceedings of the 2013 IEEE Electrical Power & Energy Conference, Halifax, NS, Canada, 21–23 August 2013; pp. 1–6. [Google Scholar]
- Zhao, T.; Lu, D.; Wang, D.; Zeng, Y.; Liu, Y. A risk assessment approach for power system based on a comprehensive fault probabilistic model. In Proceedings of the 2015 5th International Conference on Electric Utility Deregulation and Restructuring and Power Technologies (DRPT), Changsha, China, 26–29 November 2015; pp. 574–577. [Google Scholar]
- Peng, P.; Liu, S.; Mi, C.; Tao, J. A study on the assessment of power system security risk based on gray clustering and maximum entropy theory. In Proceedings of the 2016 IEEE International Conference on Systems, Man, and Cybernetics (SMC), Budapest, Hungary, 9–12 October 2016; pp. 3002–3007. [Google Scholar]
- Li, Z.; Xu, G.A.; Ban, X.F.; Zhang, Y.; Hu, Z.M. Complex information system security risk propagation research based on cellular automata. Acta Phys. Sin. Chin. Ed. 2013, 62. [Google Scholar] [CrossRef]
- Kosut, O.; Jia, L.; Thomas, R.J.; Tong, L. Malicious data attacks on smart grid state estimation: Attack strategies and countermeasures. In Proceedings of the 2010 First IEEE International Conference on Smart Grid Communications, Gaithersburg, MD, USA, 4–6 October 2010; pp. 220–225. [Google Scholar]
- Kermack, W.O.; McKendrick, A.G. Contributions to the mathematical theory of epidemics. III.—Further studies of the problem of endemicity. Proc. R. Soc. Lond. Ser. A 1933, 141, 94–122. [Google Scholar] [CrossRef]
- Lu, D.; Liu, Y.; Zeng, Y. Risk assessment of power grid considering the reliability of the information system. In Proceedings of the 2016 IEEE International Conference on Smart Grid Communications (SmartGridComm), Sydney, Australia, 6–9 November 2016; pp. 723–728. [Google Scholar]
- Ghanbari, R.; Jalili, M.; Yu, X. Discovering the structure of cascade propagation in power grids. In Proceedings of the 2018 IEEE International Conference on Industrial Electronics for Sustainable Energy Systems (IESES), Hamilton, New Zealand, 31 January–2 February 2018; pp. 272–276. [Google Scholar]
- Dey, P.; Mehra, R.; Kazi, F.; Wagh, S.; Singh, N.M. Impact of topology on the propagation of cascading failure in power grid. IEEE Trans. Smart Grid 2016, 7, 1970–1978. [Google Scholar] [CrossRef]
- De Jong, M.; Papaefthymiou, G.; Palensky, P. A framework for incorporation of infeed uncertainty in power system risk-based security assessment. IEEE Trans. Power Syst. 2018, 33, 613–621. [Google Scholar] [CrossRef]
- Ding, M.; Xiao, Y.; Zhang, J.; He, J. Risk assessment model of power grid cascading failures based on fault chain and dynamic fault tree. Proc. CSEE 2015, 35, 821–829. [Google Scholar]
- Yan, F.; Wang, Y.; Yin, X.; Li, J.; Yang, W.; Xu, B.; Jian, C. Research on the security risk assessment system for regional complex power grid. In Proceedings of the 2015 5th International Conference on Electric Utility Deregulation and Restructuring and Power Technologies (DRPT), Changsha, China, 26–29 November 2015; pp. 1–4. [Google Scholar]
- Kermack, W.O.; McKendrick, A.G. A contribution to the mathematical theory of epidemics. Proc. R. Soc. Lond. Ser. A 1927, 115, 700–721. [Google Scholar] [CrossRef] [Green Version]
- Kermack, W.O.; McKendrick, A.G. Contributions to the mathematical theory of epidemics. II.—The problem of endemicity. Proc. R. Soc. Lond. Ser. A 1932, 138, 55–83. [Google Scholar] [CrossRef]
- Jyothi, S.; Vorugunti, C.S. Epidemic model based evaluation of malware propagation in Twitter. In Proceedings of the 2017 9th International Conference on Communication Systems and Networks (COMSNETS), Bangalore, India, 4–8 January 2017; pp. 407–408. [Google Scholar]
- Chen, F.; Chen, T. Research on Public Opinion Emergencies Evolution: Based on the Perspective of Opinion Leaders Guiding Role. Inf. Doc. Serv. 2015, 36, 23–28. [Google Scholar]
- Gardner, M.T.; Beard, C.; Medhi, D. Using SEIRS Epidemic Models for IoT Botnets Attacks. In Proceedings of the 13th International Conference on DRCN 2017-Design of Reliable Communication Networks, Munich, Germany, 8–10 March 2017; pp. 1–8. [Google Scholar]
- Chen, P.Y.; Cheng, S.M.; Hsu, H.Y. Analysis of information delivery dynamics in cognitive sensor networks using epidemic models. IEEE Internet Things J. 2018, 5, 2333–2342. [Google Scholar] [CrossRef]
- Romero-L, M.; Gallego, L. Analysis of voltage sags propagation in distribution grids using a SI epidemic model. In Proceedings of the 2017 IEEE Workshop on Power Electronics and Power Quality Applications (PEPQA), Bogota, Colombia, 31 May–2 June 2017; pp. 1–6. [Google Scholar]
- Wu, Q.; Zhang, D.; Liu, D.; Liu, F.; Ling, X.B.; Li, Z. Disturbance propagation in power system based on an epidemic model. In Proceedings of the 2017 IEEE Conference on Energy Internet and Energy System Integration (EI2), Beijing, China, 26–28 November 2017; pp. 1–6. [Google Scholar]
- Cisotto, G.; Badia, L. Cyber security of smart grids modeled through epidemic models in cellular automata. In Proceedings of the 2016 IEEE 17th International Symposium on a World of Wireless, Mobile and Multimedia Networks (WOWMoM), Coimbra, Portugal, 21–24 June 2016; pp. 1–6. [Google Scholar]
- Tian, C.; Wang, Y.; Zhou, Y.; Wang, J. Composite power system risk assessment and weak links identification considering cascading failures. In Proceedings of the 2015 5th International Conference on Electric Utility Deregulation and Restructuring and Power Technologies (DRPT), Changsha, China, 26–29 November 2015; pp. 543–548. [Google Scholar]
Figure 1.
The three traditional defenses of information systems in the smart grid.
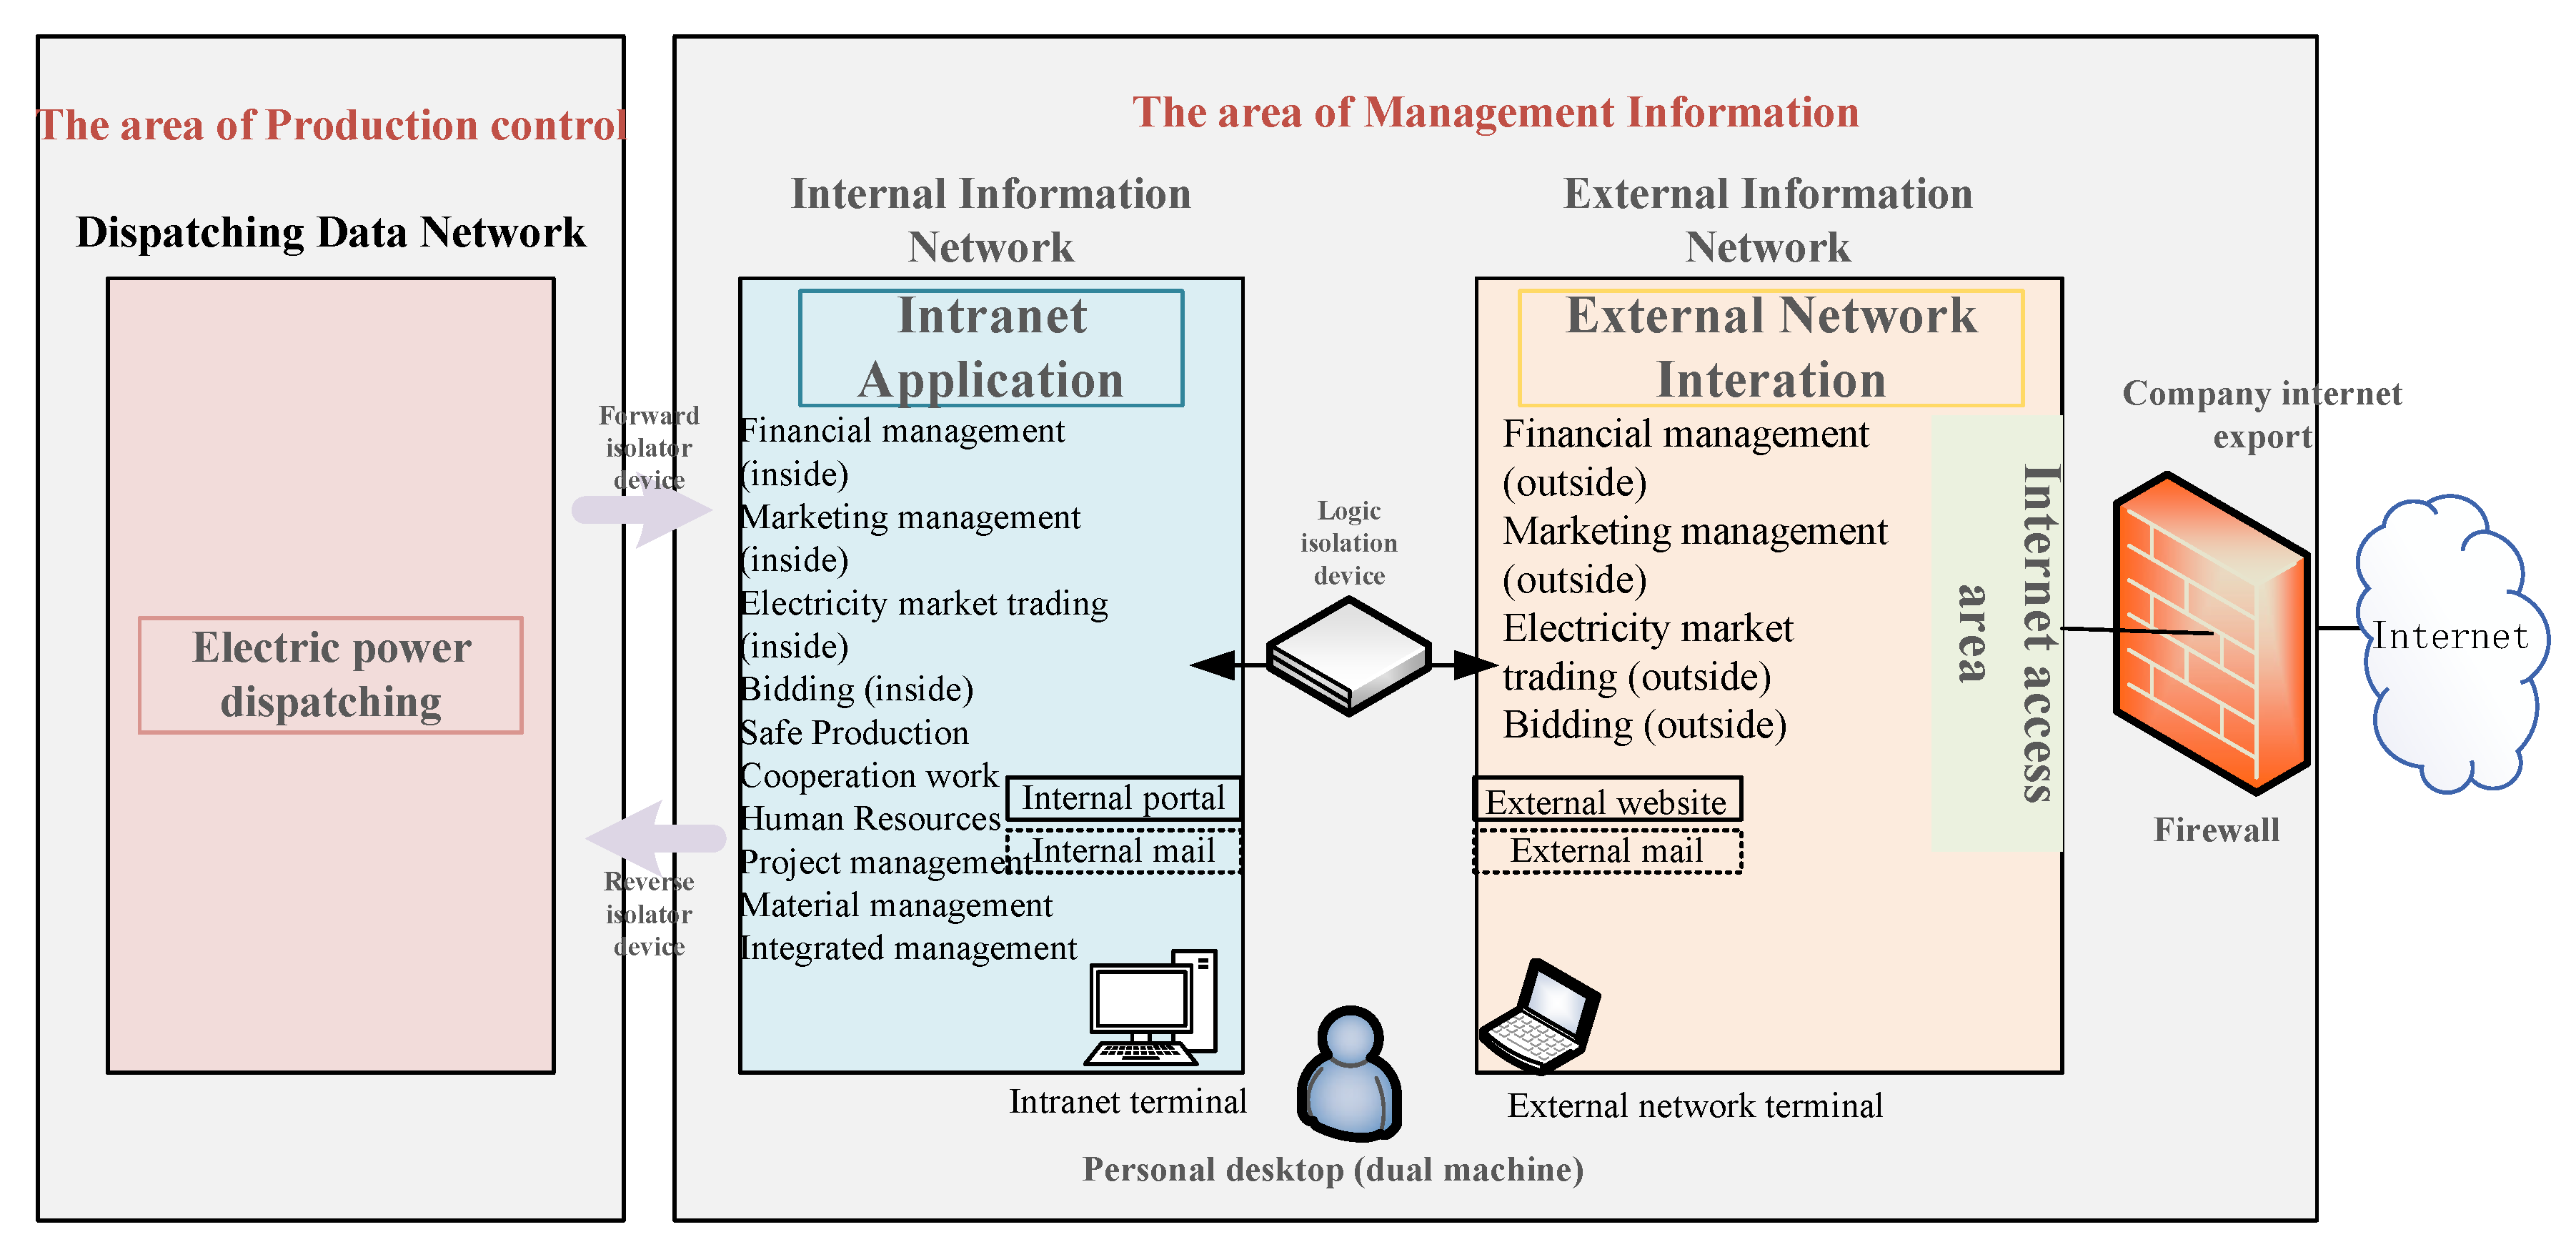
Figure 2.
The information collection system of the power grid.
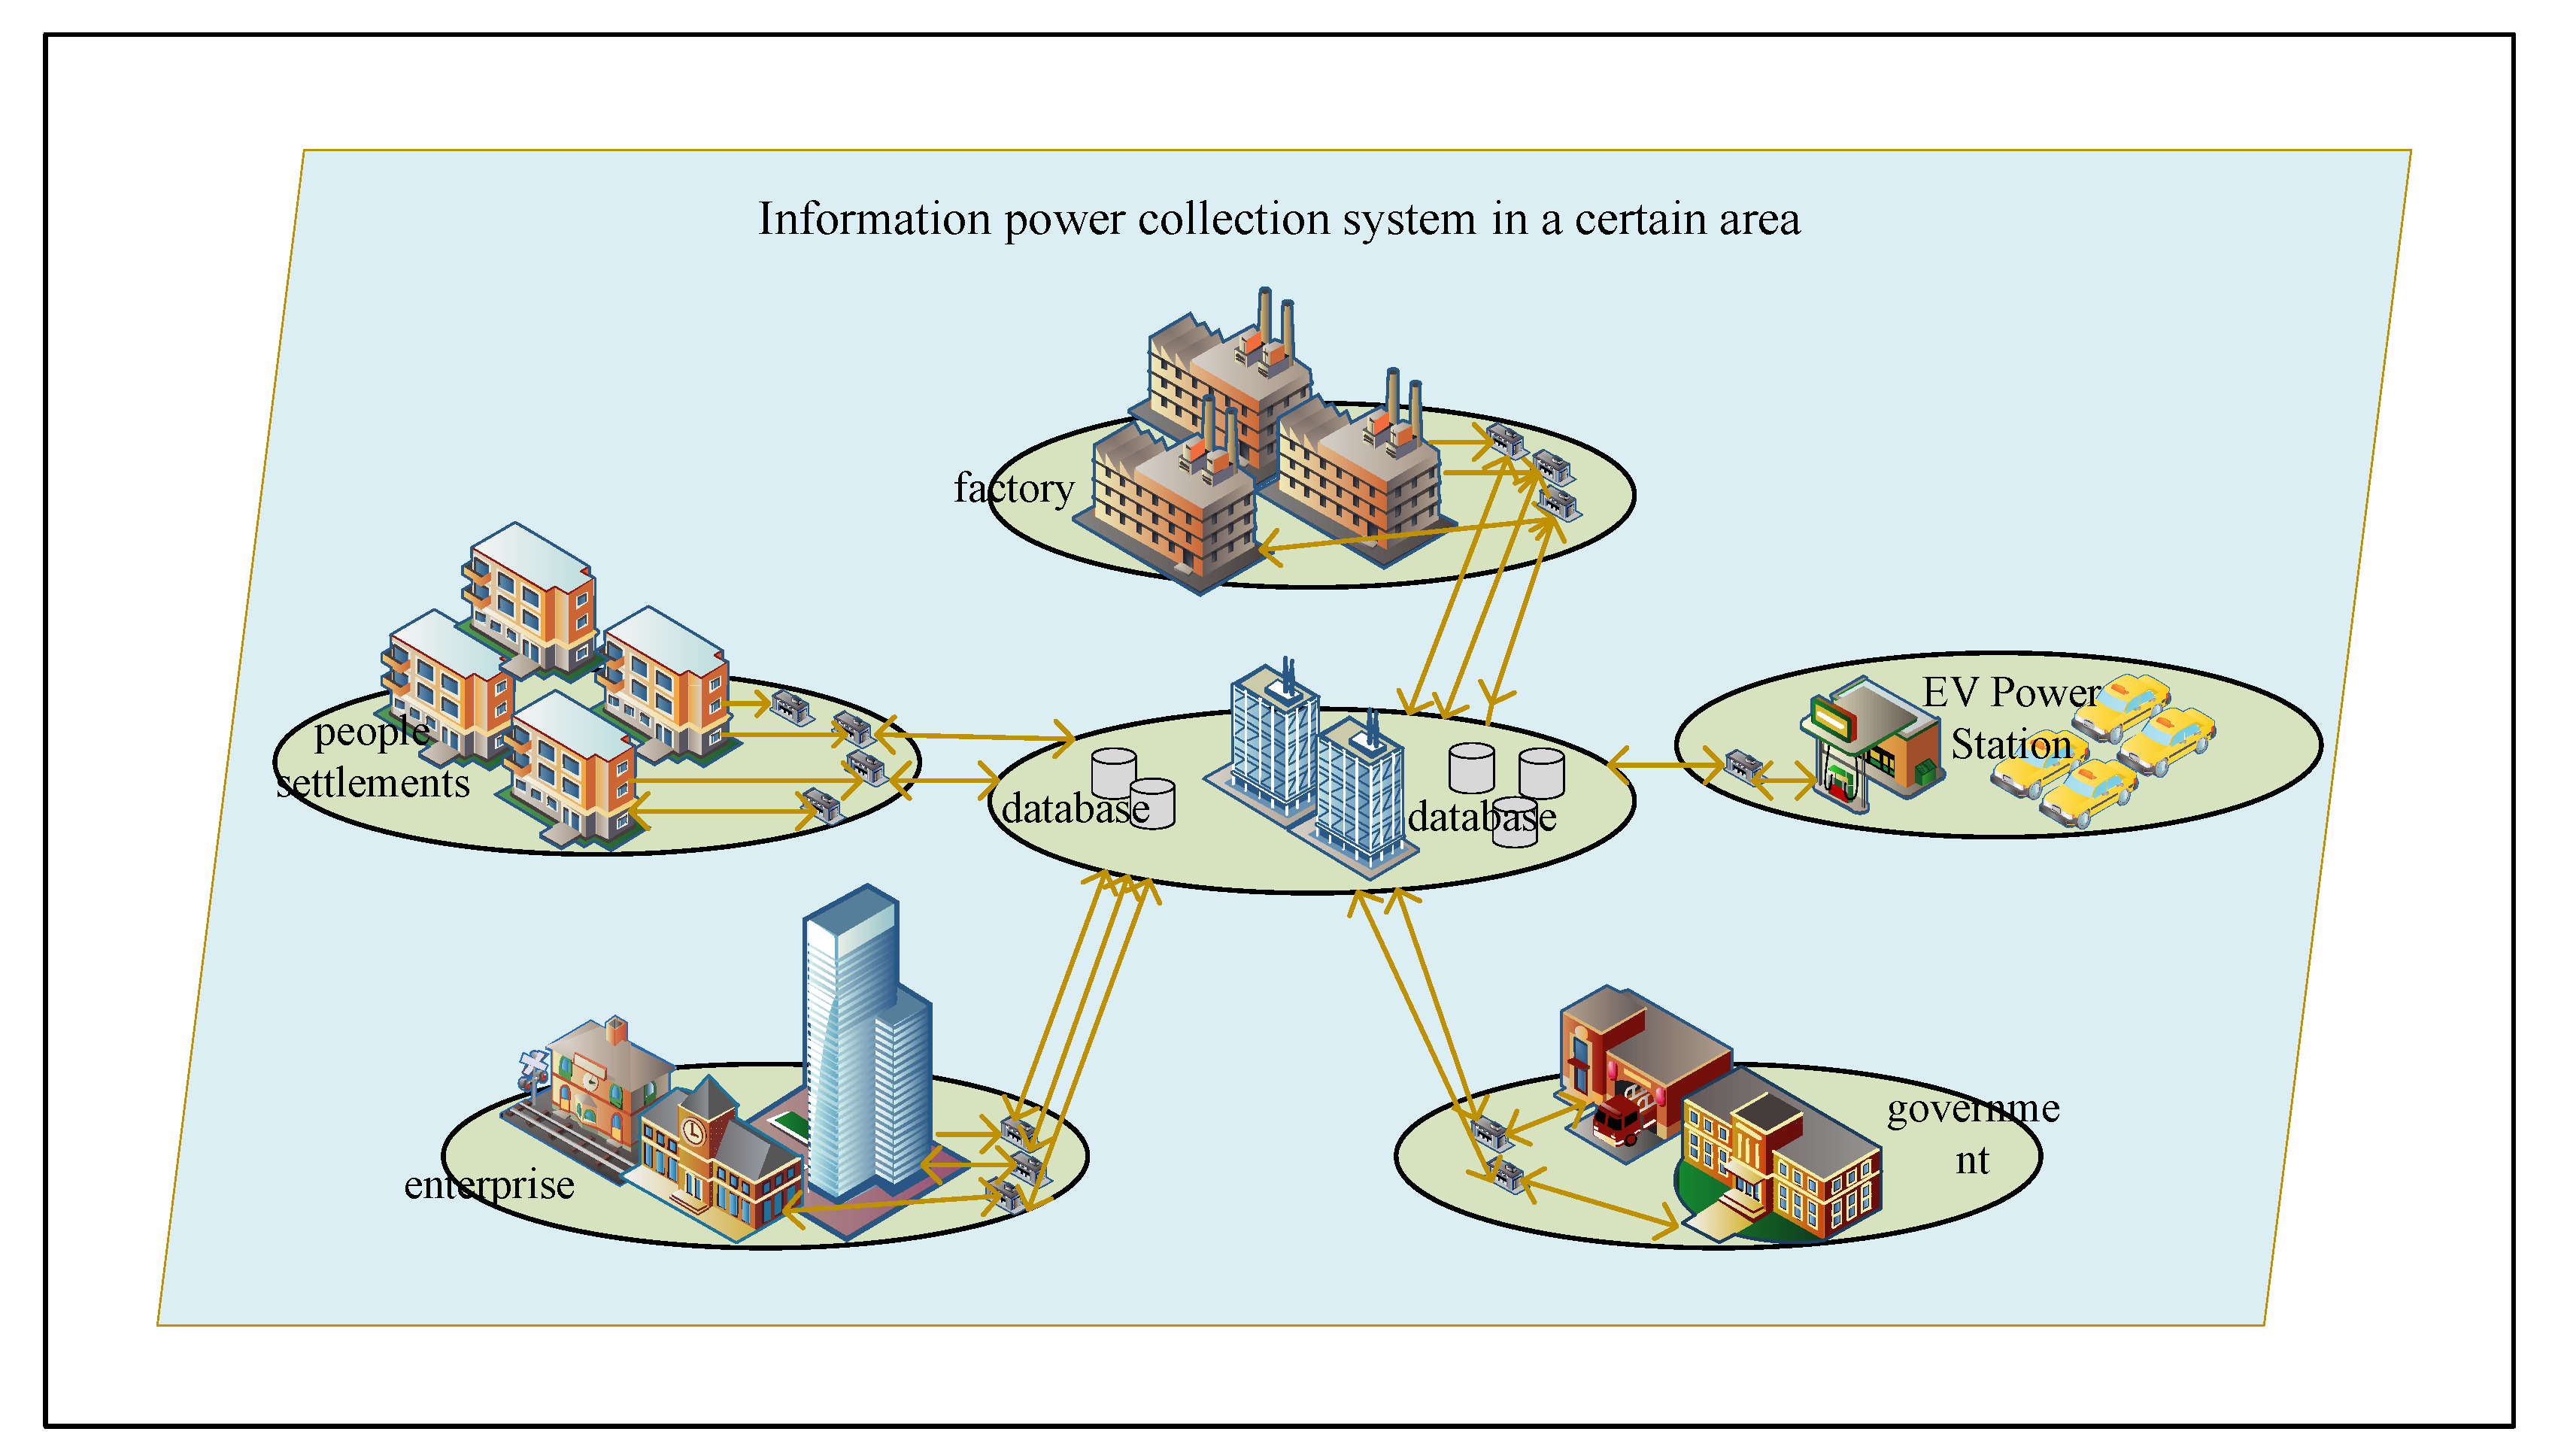
Figure 3.
The workflow of the information security risk propagation model based on the Susceptible–Exposed–Infected–Recovered infectious disease model (ISRP-SEIRIDM).
Figure 3.
The workflow of the information security risk propagation model based on the Susceptible–Exposed–Infected–Recovered infectious disease model (ISRP-SEIRIDM).
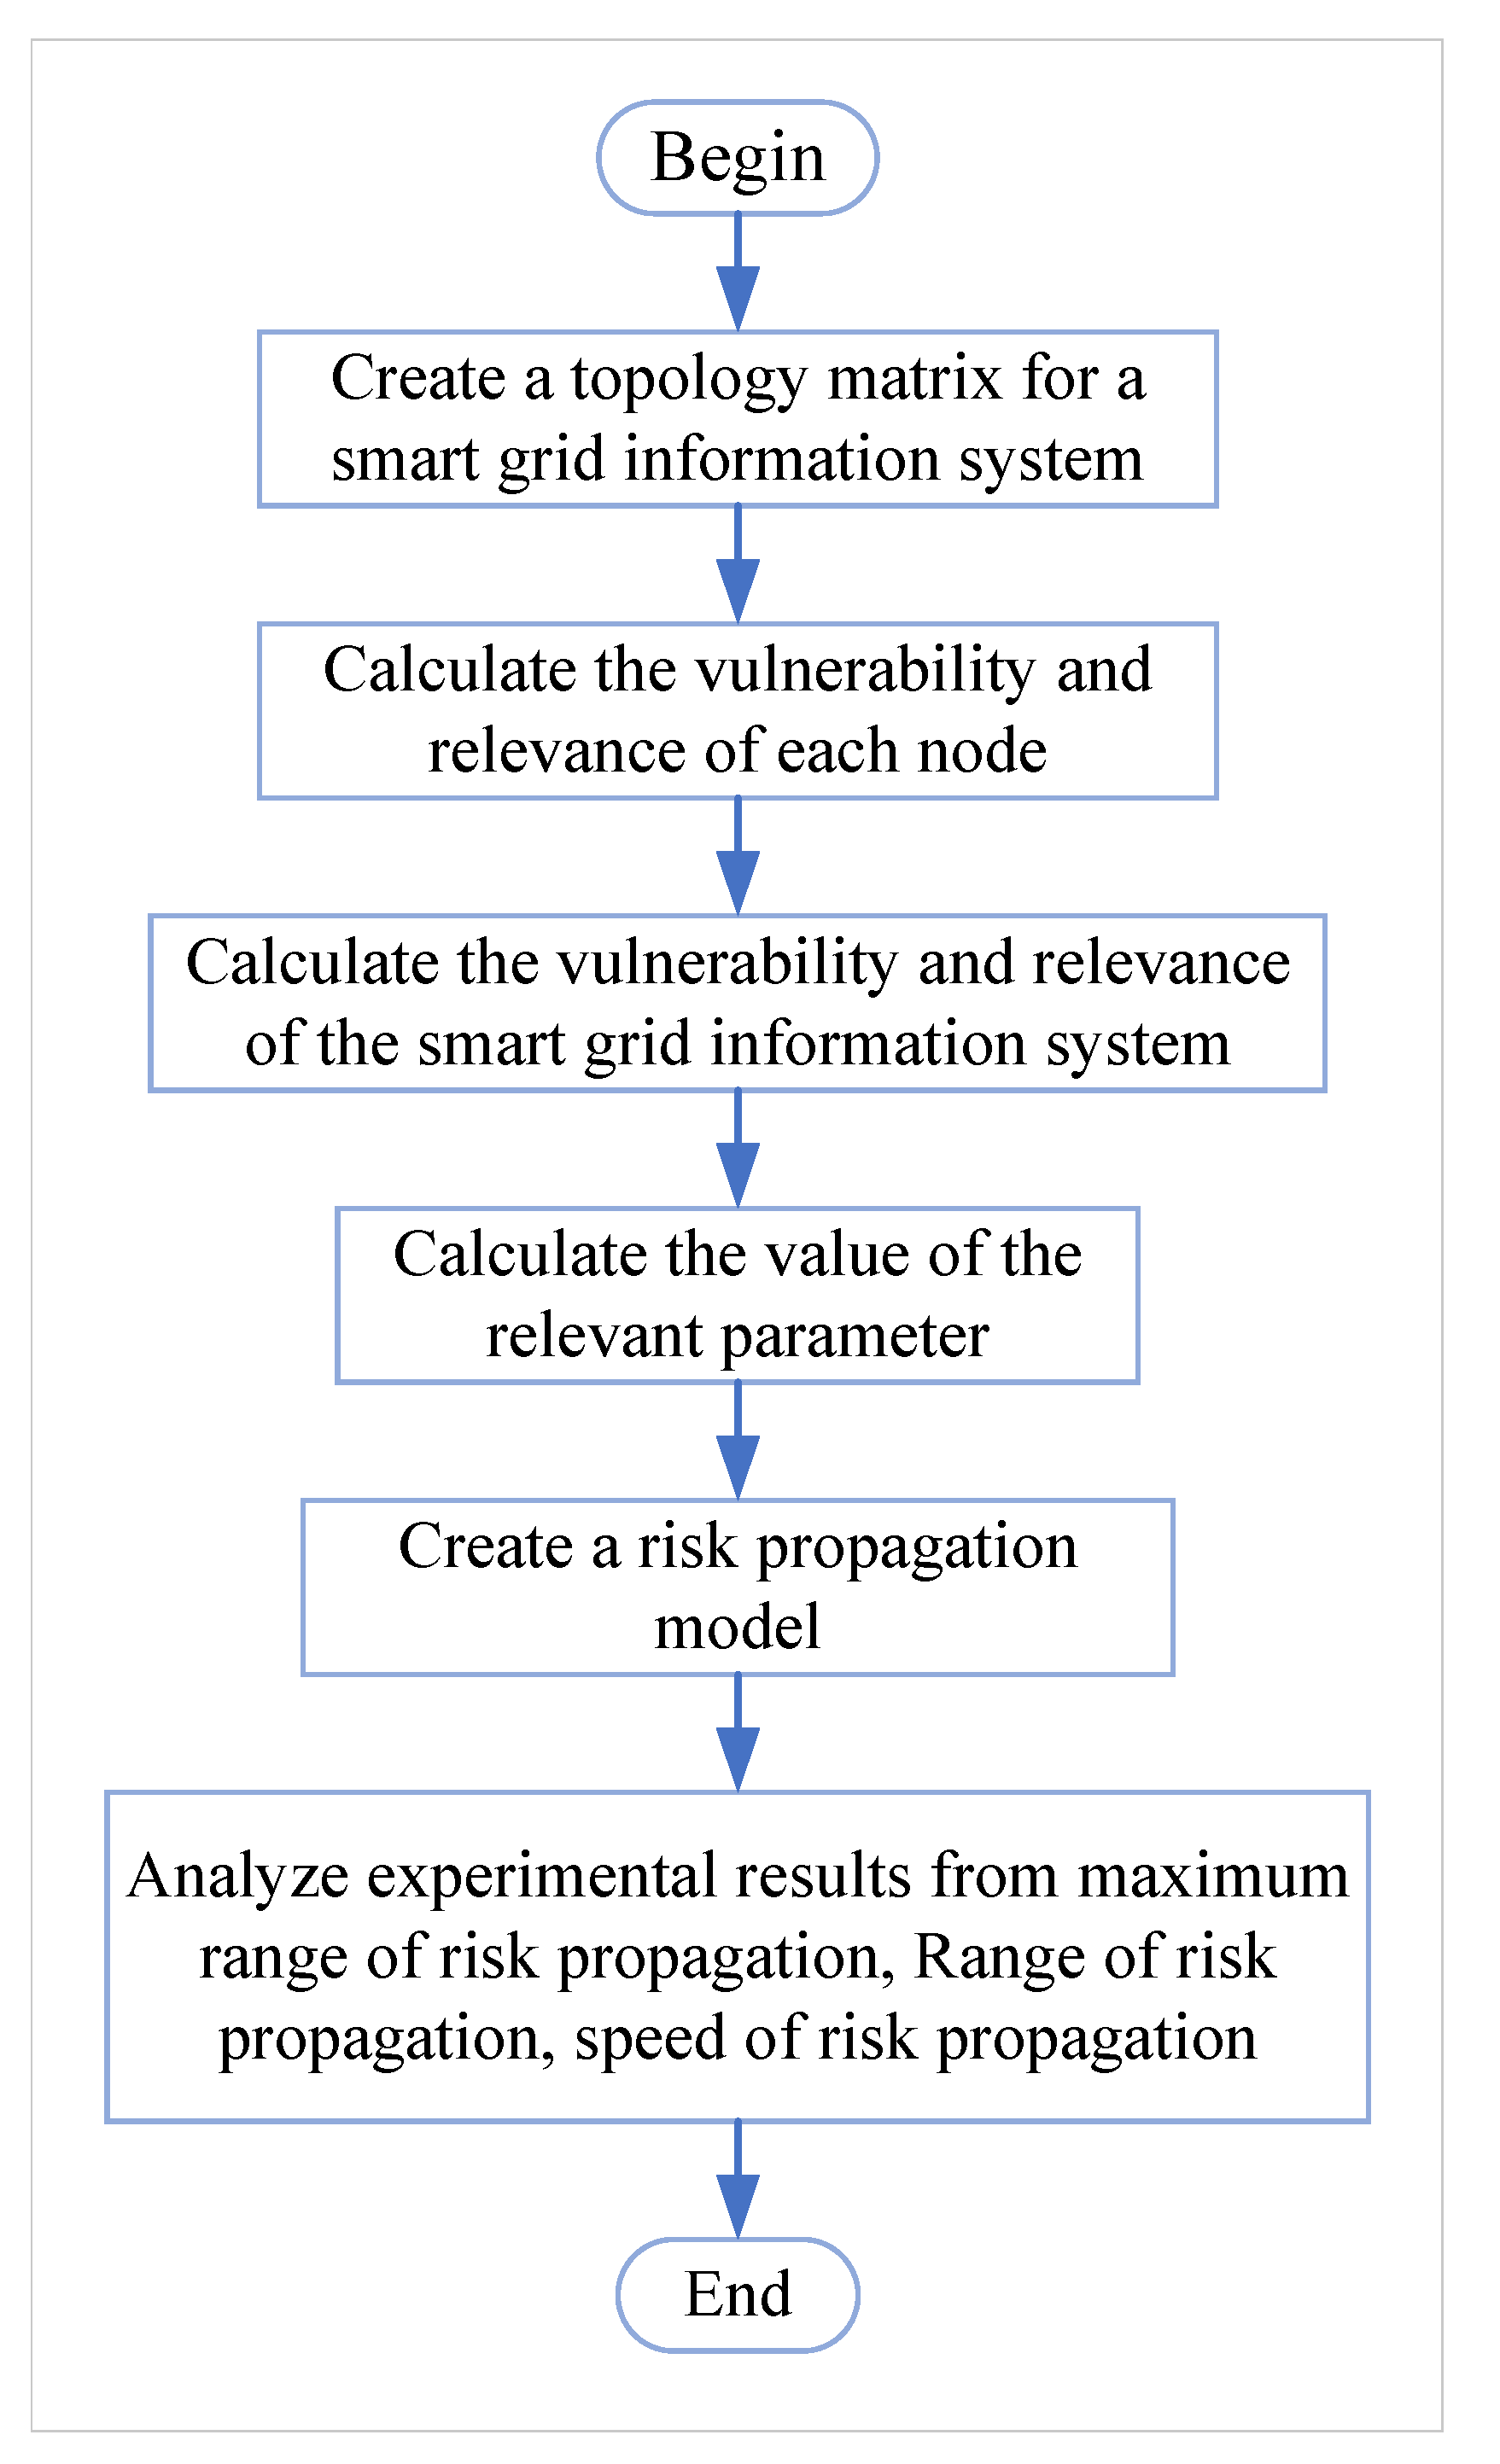
Figure 4.
Information security risk propagation method in smart grid.
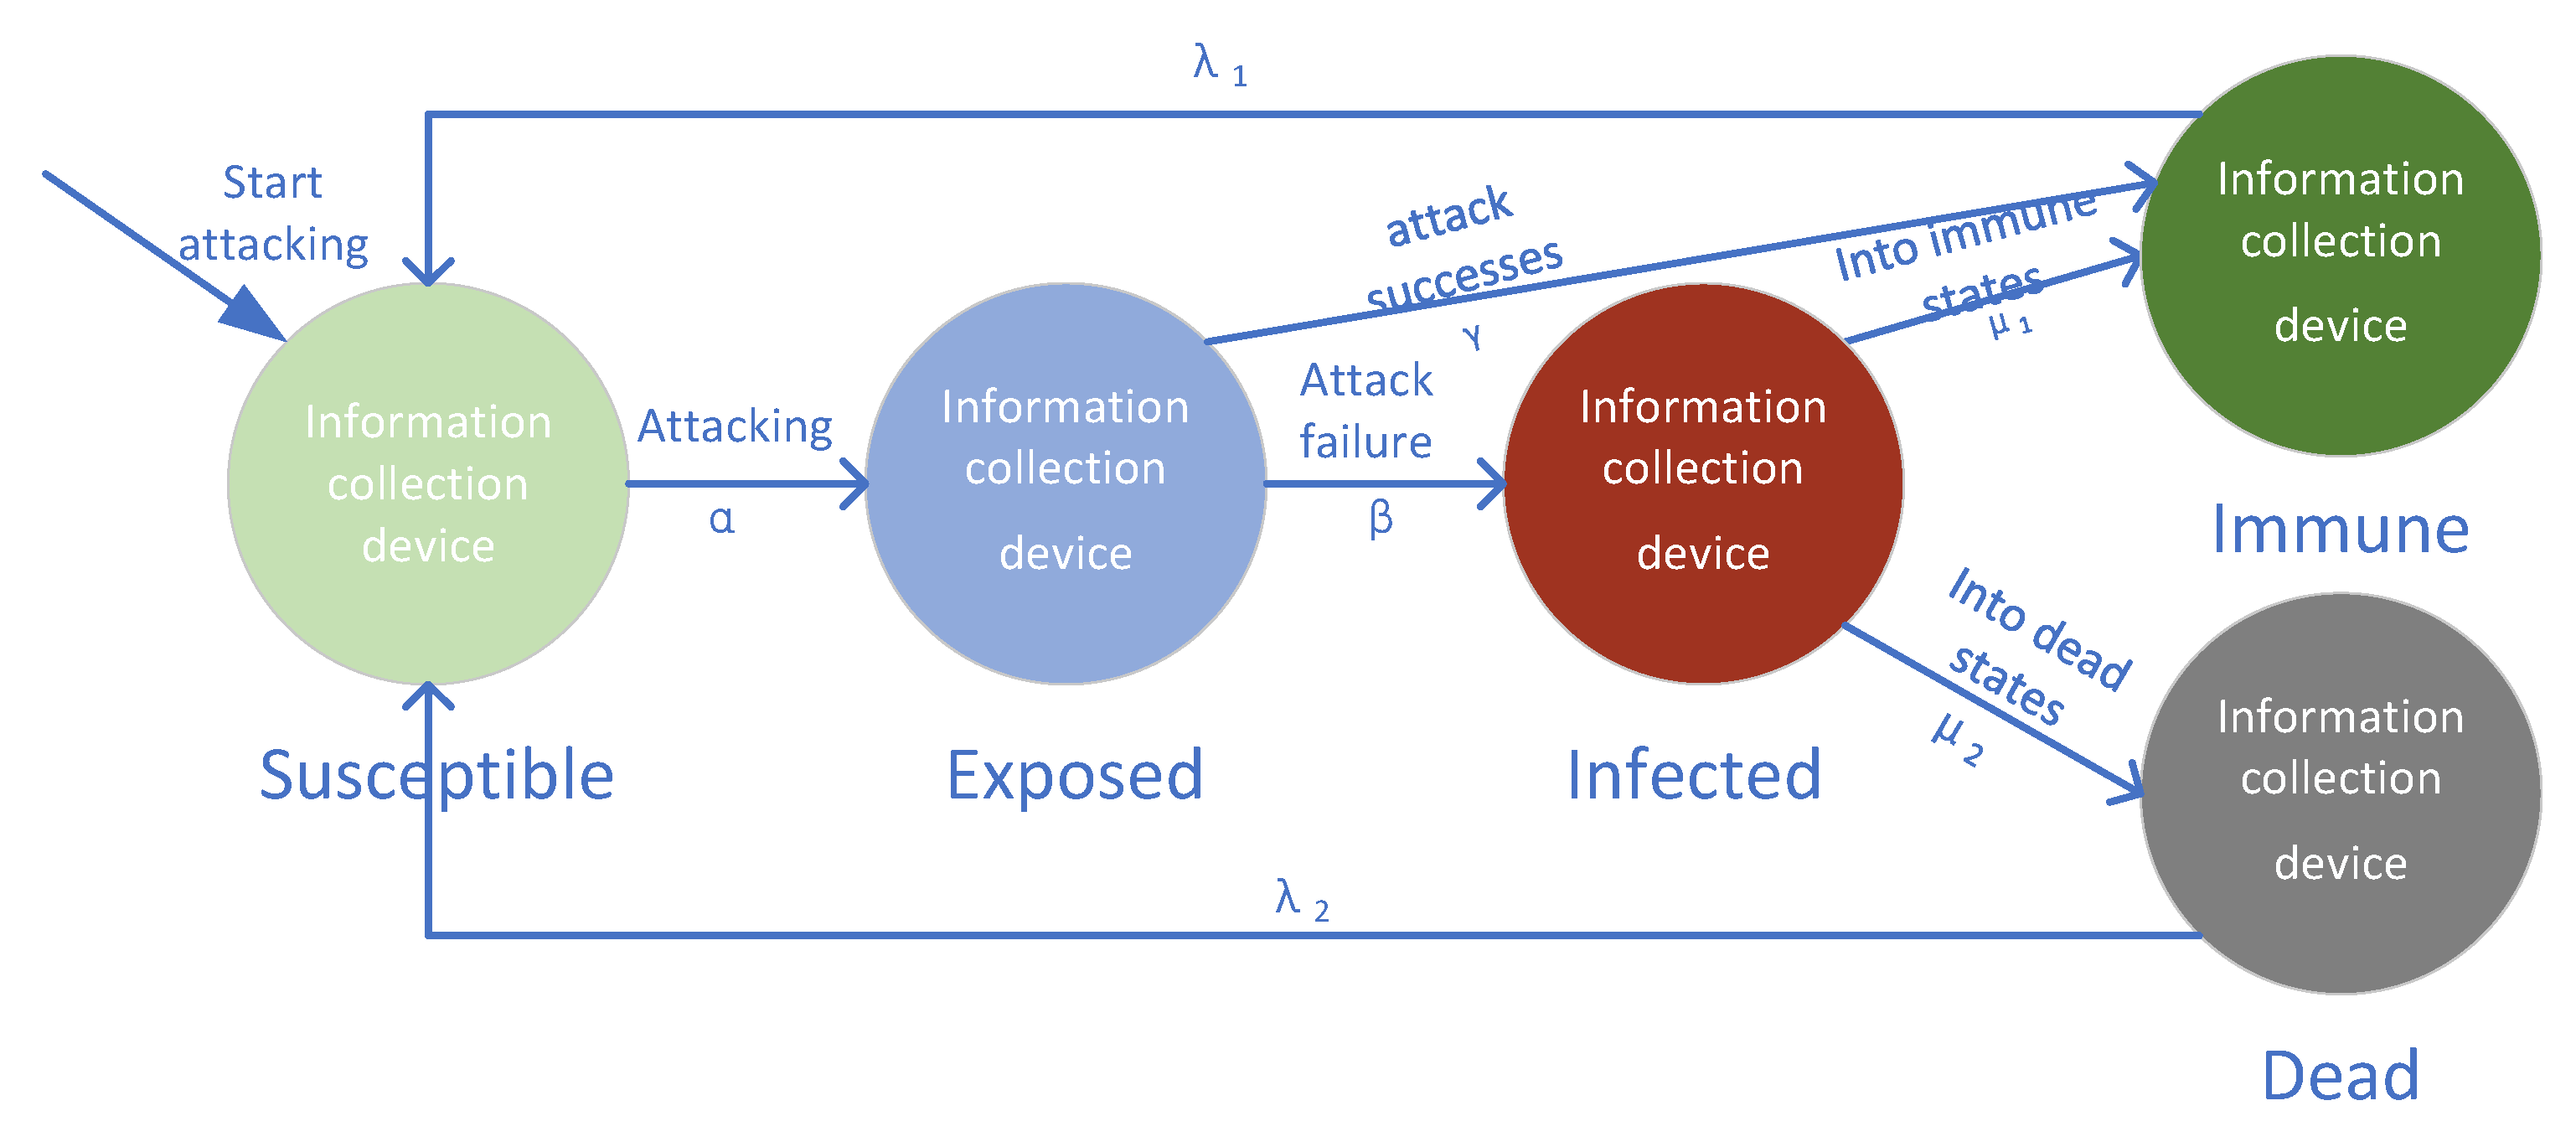
Figure 5.
Simulation results.
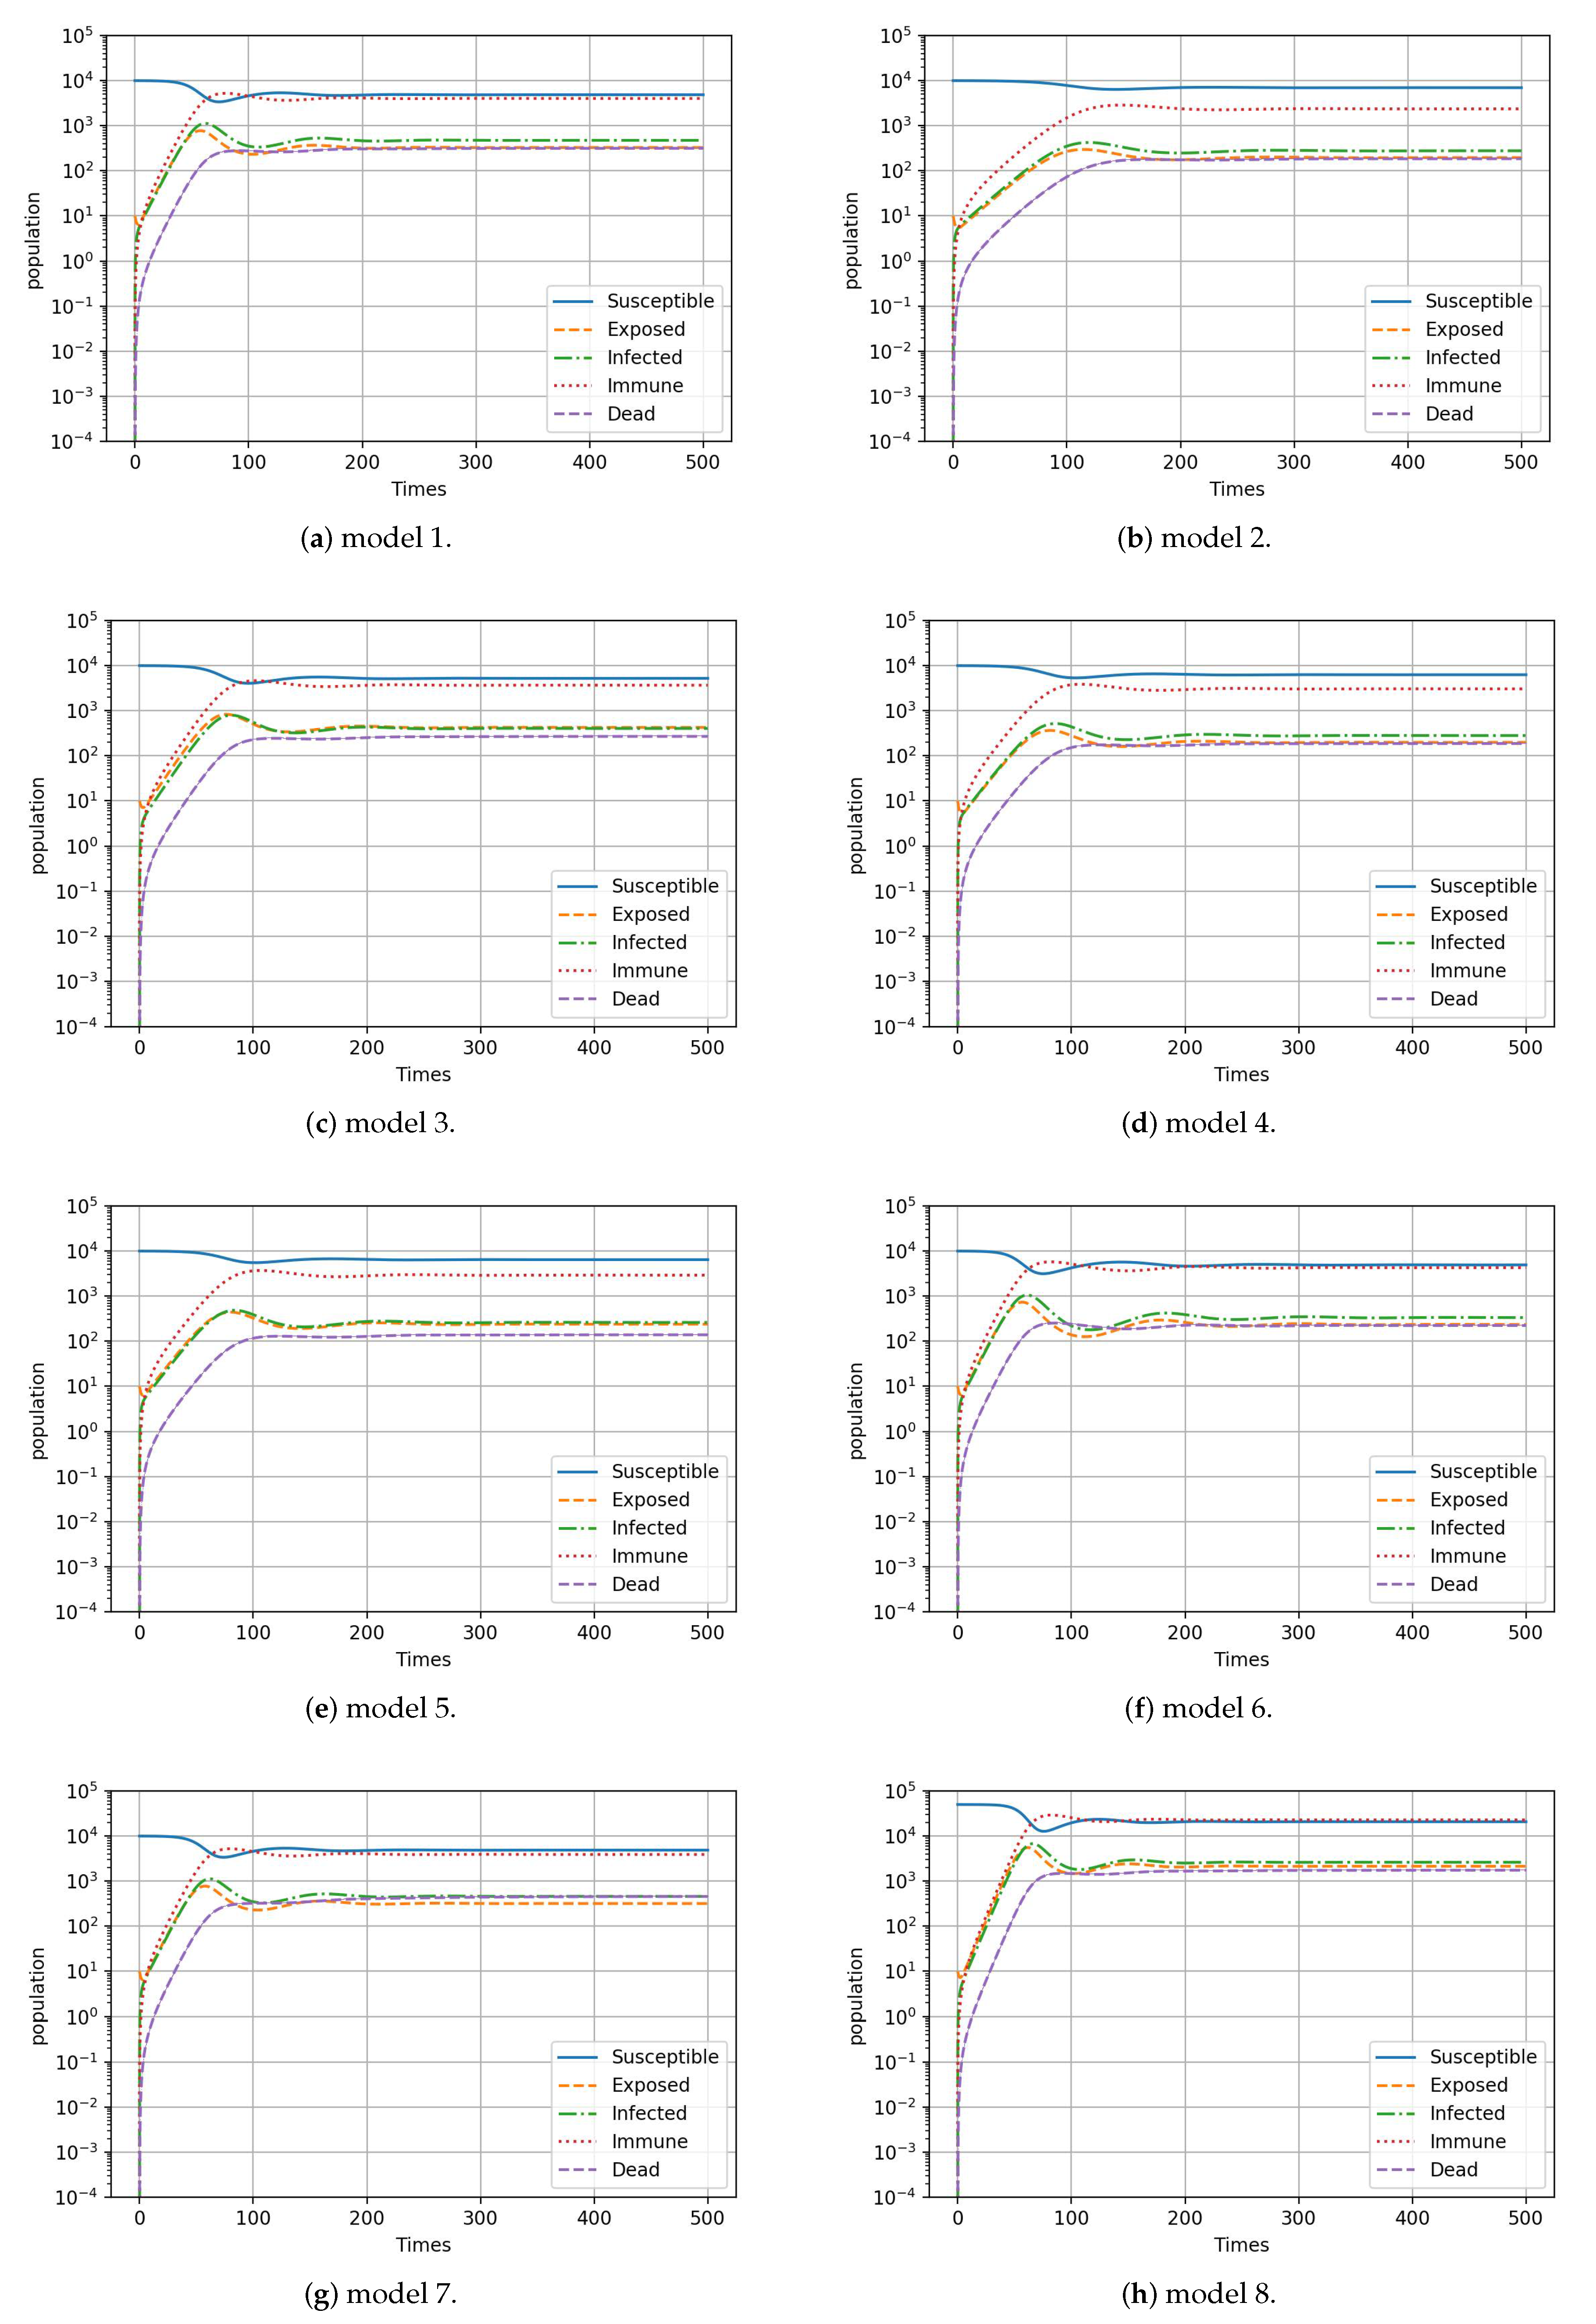
Figure 6.
Comparison of risk propagation in models 1–8.
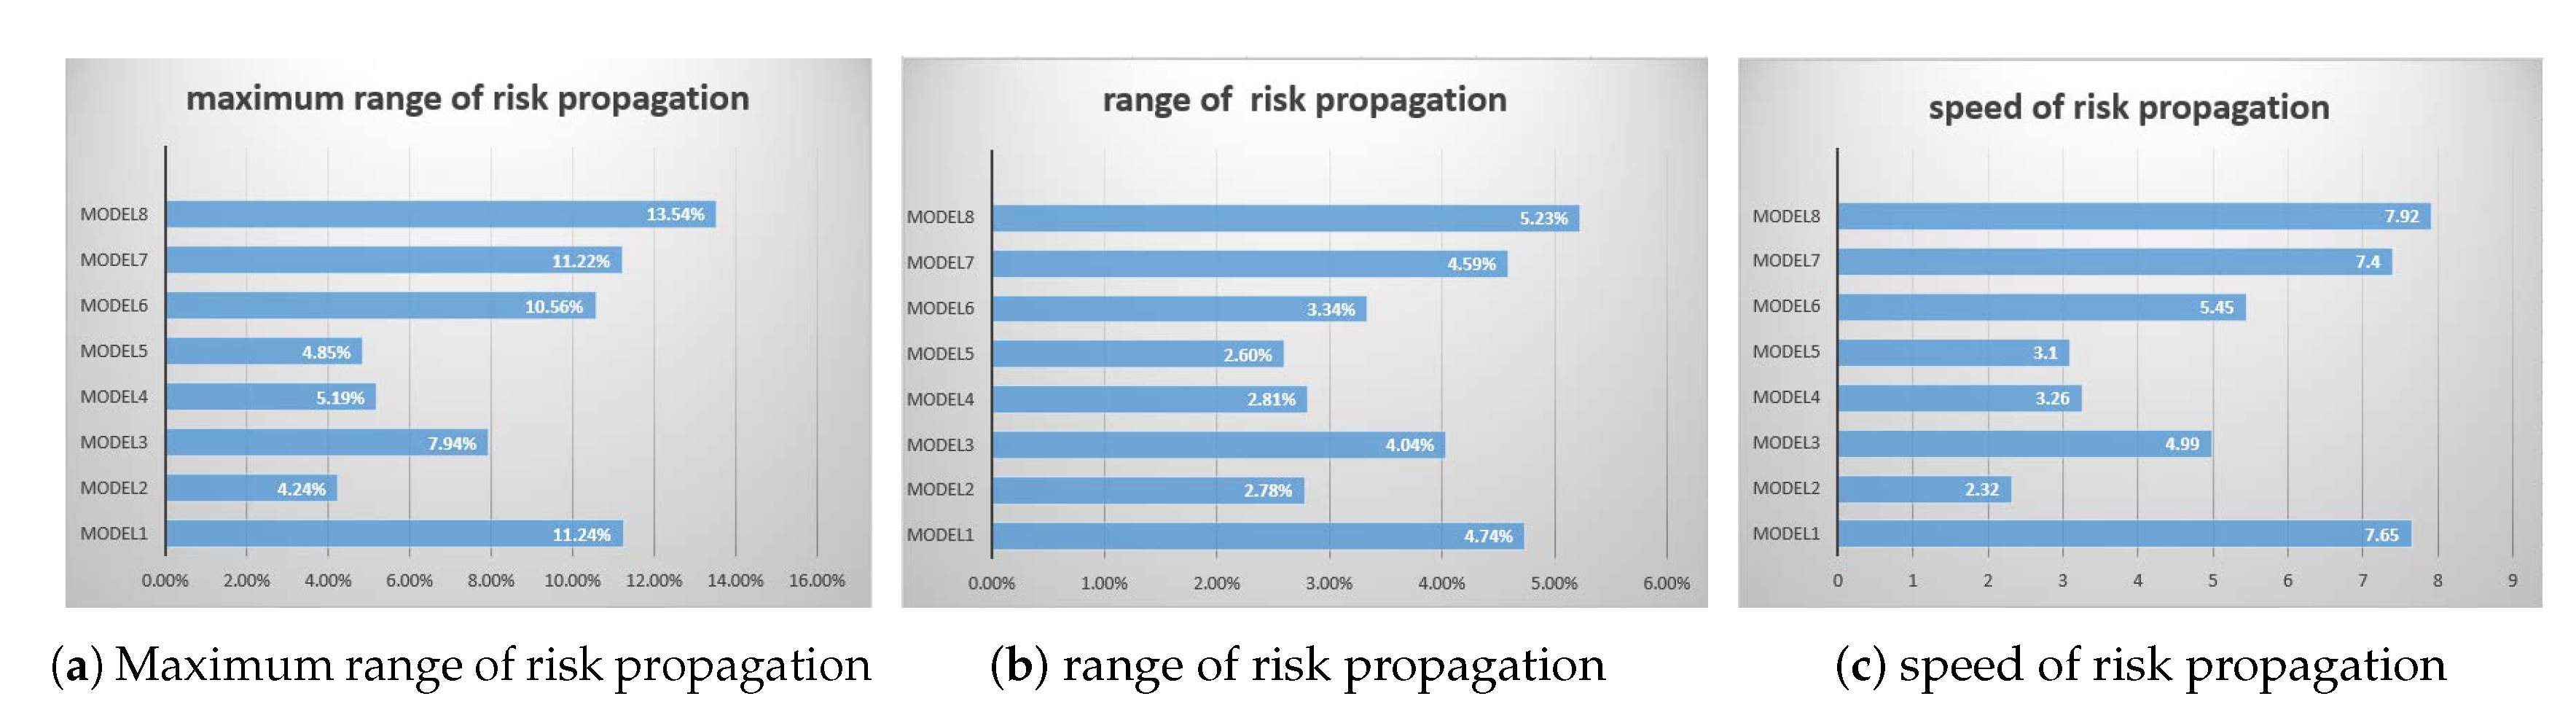
Figure 7.
Risk propagation process in IEEE 30 bus system.

Table 1.
Risk assessment model parameters.
| Parameters | Description |
|---|---|
| Probability of transitioning from a susceptible state to a exposed state | |
| Probability of transitioning from a exposed state to a infected state | |
| Probability of transitioning from a exposed state to a immune state | |
| Probability of transitioning from a infected state to a immune state | |
| Probability of transitioning from a infected state to a dead state | |
| Probability of transitioning from a immune state to a susceptible state | |
| Probability of transitioning from a dead state to a susceptible state |
Table 2.
Parameters of the experiment.
| Model | N | |||||||
|---|---|---|---|---|---|---|---|---|
| 1 | 0.52 | 0.317 | 0.05 | 0.22 | 0.010 | 0.03 | 0.015 | 10,000 |
| 2 | 0.37 | 0.317 | 0.05 | 0.22 | 0.010 | 0.03 | 0.015 | 10,000 |
| 3 | 0.52 | 0.210 | 0.05 | 0.22 | 0.010 | 0.03 | 0.015 | 10,000 |
| 4 | 0.52 | 0.317 | 0.15 | 0.22 | 0.010 | 0.03 | 0.015 | 10,000 |
| 5 | 0.52 | 0.317 | 0.05 | 0.29 | 0.008 | 0.03 | 0.015 | 10,000 |
| 6 | 0.52 | 0.317 | 0.05 | 0.22 | 0.010 | 0.02 | 0.015 | 10,000 |
| 7 | 0.52 | 0.317 | 0.05 | 0.22 | 0.010 | 0.03 | 0.010 | 10,000 |
| 8 | 0.62 | 0.268 | 0.05 | 0.22 | 0.010 | 0.03 | 0.015 | 50,000 |
© 2019 by the authors. Licensee MDPI, Basel, Switzerland. This article is an open access article distributed under the terms and conditions of the Creative Commons Attribution (CC BY) license (http://creativecommons.org/licenses/by/4.0/).
Share and Cite
MDPI and ACS Style
Zhu, B.; Deng, S.; Xu, Y.; Yuan, X.; Zhang, Z. Information Security Risk Propagation Model Based on the SEIR Infectious Disease Model for Smart Grid. Information 2019, 10, 323. https://doi.org/10.3390/info10100323
AMA Style
Zhu B, Deng S, Xu Y, Yuan X, Zhang Z. Information Security Risk Propagation Model Based on the SEIR Infectious Disease Model for Smart Grid. Information. 2019; 10(10):323. https://doi.org/10.3390/info10100323
Chicago/Turabian StyleZhu, Boyu, Song Deng, Yunan Xu, Xinya Yuan, and Zi Zhang. 2019. "Information Security Risk Propagation Model Based on the SEIR Infectious Disease Model for Smart Grid" Information 10, no. 10: 323. https://doi.org/10.3390/info10100323
Note that from the first issue of 2016, this journal uses article numbers instead of page numbers. See further details here.