Article

Automatic Diagnosis of Neurodegenerative Diseases: An Evolutionary Approach for Facing the Interpretability Problem

Department of Electrical and Information Engineering and Applied Mathematics, Università degli Studi di Salerno, Via Giovanni Paolo II, 132, 84084 Fisciano, Italy
*
Author to whom correspondence should be addressed.
Information 2019, 10(1), 30; https://doi.org/10.3390/info10010030
Submission received: 11 December 2018 / Revised: 13 January 2019 / Accepted: 14 January 2019 / Published: 17 January 2019
(This article belongs to the Special Issue eHealth and Artificial Intelligence)

Abstract

:
Background: The use of Artificial Intelligence (AI) systems for automatic diagnoses is increasingly in the clinical field, being a useful support for the identification of several diseases. Nonetheless, the acceptance of AI-based diagnoses by the physicians is hampered by the black-box approach implemented by most performing systems, which do not clearly state the classification rules adopted. Methods: In this framework we propose a classification method based on a Cartesian Genetic Programming (CGP) approach, which allows for the automatic identification of the presence of the disease, and concurrently, provides the explicit classification model used by the system. Results: The proposed approach has been evaluated on the publicly available HandPD dataset, which contains handwriting samples drawn by Parkinson’s disease patients and healthy controls. We show that our approach compares favorably with state-of-the-art methods, and more importantly, allows the physician to identify an explicit model relevant for the diagnosis based on the most informative subset of features. Conclusion: The obtained results suggest that the proposed approach is particularly appealing in that, starting from the explicit model, it allows the physicians to derive a set of guidelines for defining novel testing protocols and intervention strategies.

1. Introduction

Parkinson’s disease (PD) is a neurodegenerative disorder that affects dopaminergic neurons in the Basal Ganglia, whose death causes several motor and cognitive symptoms [1]. PD patients show impaired ability in controlling movements and disruption in the execution of everyday skills due to postural instability, the onset of tremors, stiffness, and bradykinesia [2,3,4]. As with other motor tasks, handwriting production, which involves the fine control of complex movements of the fingers and wrist, and consequently, is influenced by Basal Ganglia activity [5], is characterized by slowness, lack of fluency (dysgraphia), abrupt changes of pen tip direction, and micrographia (reduction of letter size) [6,7,8,9]. In the last decades, the analysis of handwriting (or, more in general, the analysis of handwritten production) has brought many insights for uncovering the processes occurring during both physiological and pathological conditions [10,11,12,13,14] and provided a non-invasive method for evaluating the stages of the disease [15].
A reliable, early diagnosis of PD is very challenging due to the difficulty in correctly interpreting the first symptoms, which may be easily attributed to other disorders. It would, however, provide more prompt and effective intervention strategies. Since handwriting deterioration could appear in the early stage of the disease, its analysis could provide some insight for an early diagnosis. In the field of graphonomics and pattern recognition, many studies have proposed different AI based approaches for the automatic identification of tremors and the micrographia phenomena in handwriting, i.e., the identification of letter size reduction (or, more generally, a reduction in the graphical gesture) for supplying useful information to the clinician. These tests involve the analysis of more automated writing patterns (such as signatures [16]), or the inspection of specific words or letters, such as the cursive “e” and “l” [12,14], in which it is easier to observe the horizontal micrographia. However, as suggested by the evaluation of different PD detection tests carried out by Zham et al. [17], word and letter handwriting is influenced by several factors, such as writing style, education level, and language ability. As a result of these influencing variables, this study concludes that PD evaluation should rely on graphical tests that involve the production of geometric shapes, such as spirals or meanders, in free conditions or following a printed trace.
From handwritten ink traces, both static (size, curvature, slant) and dynamic (velocity, acceleration, pressure, fluency, duration) features can be extracted. The former can be acquired with a pen and paper and the analysis can be performed on a scanned image of the ink trace, whereas the latter can be acquired through the use of a graphic tablet. As expected, the analysis of combined static and dynamic features allows one to achieve better results than those obtained by the analysis of static features only  [18,19,20]. However, improving the performance obtained with only static features should be considered a goal worthy of attention, since (1) analyzing old writing or drawings from the subject (available only on the paper) could be useful for reconstructing the patient’s medical history or to date the onset of the disease; (2) some subjects, especially elderly ones, do not feel comfortable writing on a graphic tablet, and this can lead to errors in assessment.
Pereira et al. [21] addressed this goal by asking a group of patients and healthy subjects to retrace a set of drawings (spirals and meanders) printed on paper. From the collected data, they computed a set of static features, calculated on the basis of some spatial parameters, mainly based on the difference between the printed trace and that created by the writer. Eventually, they applied different classifiers, namely the support vector machine classifier (SVM), the Naive Bayes (NB) classifier, and the Optimum-Path Forest (OPF) classifier, to automatically identify the presence of the disease in the writer. Their results show that a better classification performance (67% global accuracy) could be achieved through the meander analysis using a SVM classifier.
However, the classification accuracy reached by the methods proposed by Pereira is not satisfactory for application in a real scenario, and the used classifiers provide no clue about the way the decision is taken. In other words, they do not provide any information about the influence of each feature in the classification decision. As a consequence, the acceptance of their diagnosis by doctors would be hampered in that they would look to the Artificial Intelligence (AI) system as a black-box. For this reason, Explainable AI has recently become increasingly prevalent, especially related to the rationale behind the decision-making process.
The work proposed aims to develop a system that provides explicit criteria for discriminating between healthy and unhealthy patients handwriting productions, while exhibiting comparable or even better performance than state-of-the-art methods. We tackle the problem by using for the classification step Evolutionary Algorithms, in particular the Cartesian Genetic Programming (CGP) approach [22,23], which allowed us to construct an explicit representation of the problem, built from the considered features and a predetermined set of functions.
In the remainder of the paper, Section 2 describes the proposed approach and the tuning phase for calibrating the algorithm parameters, Section 3 shows and discusses the obtained results, and the last section reports the conclusions and give an outline of future investigations.

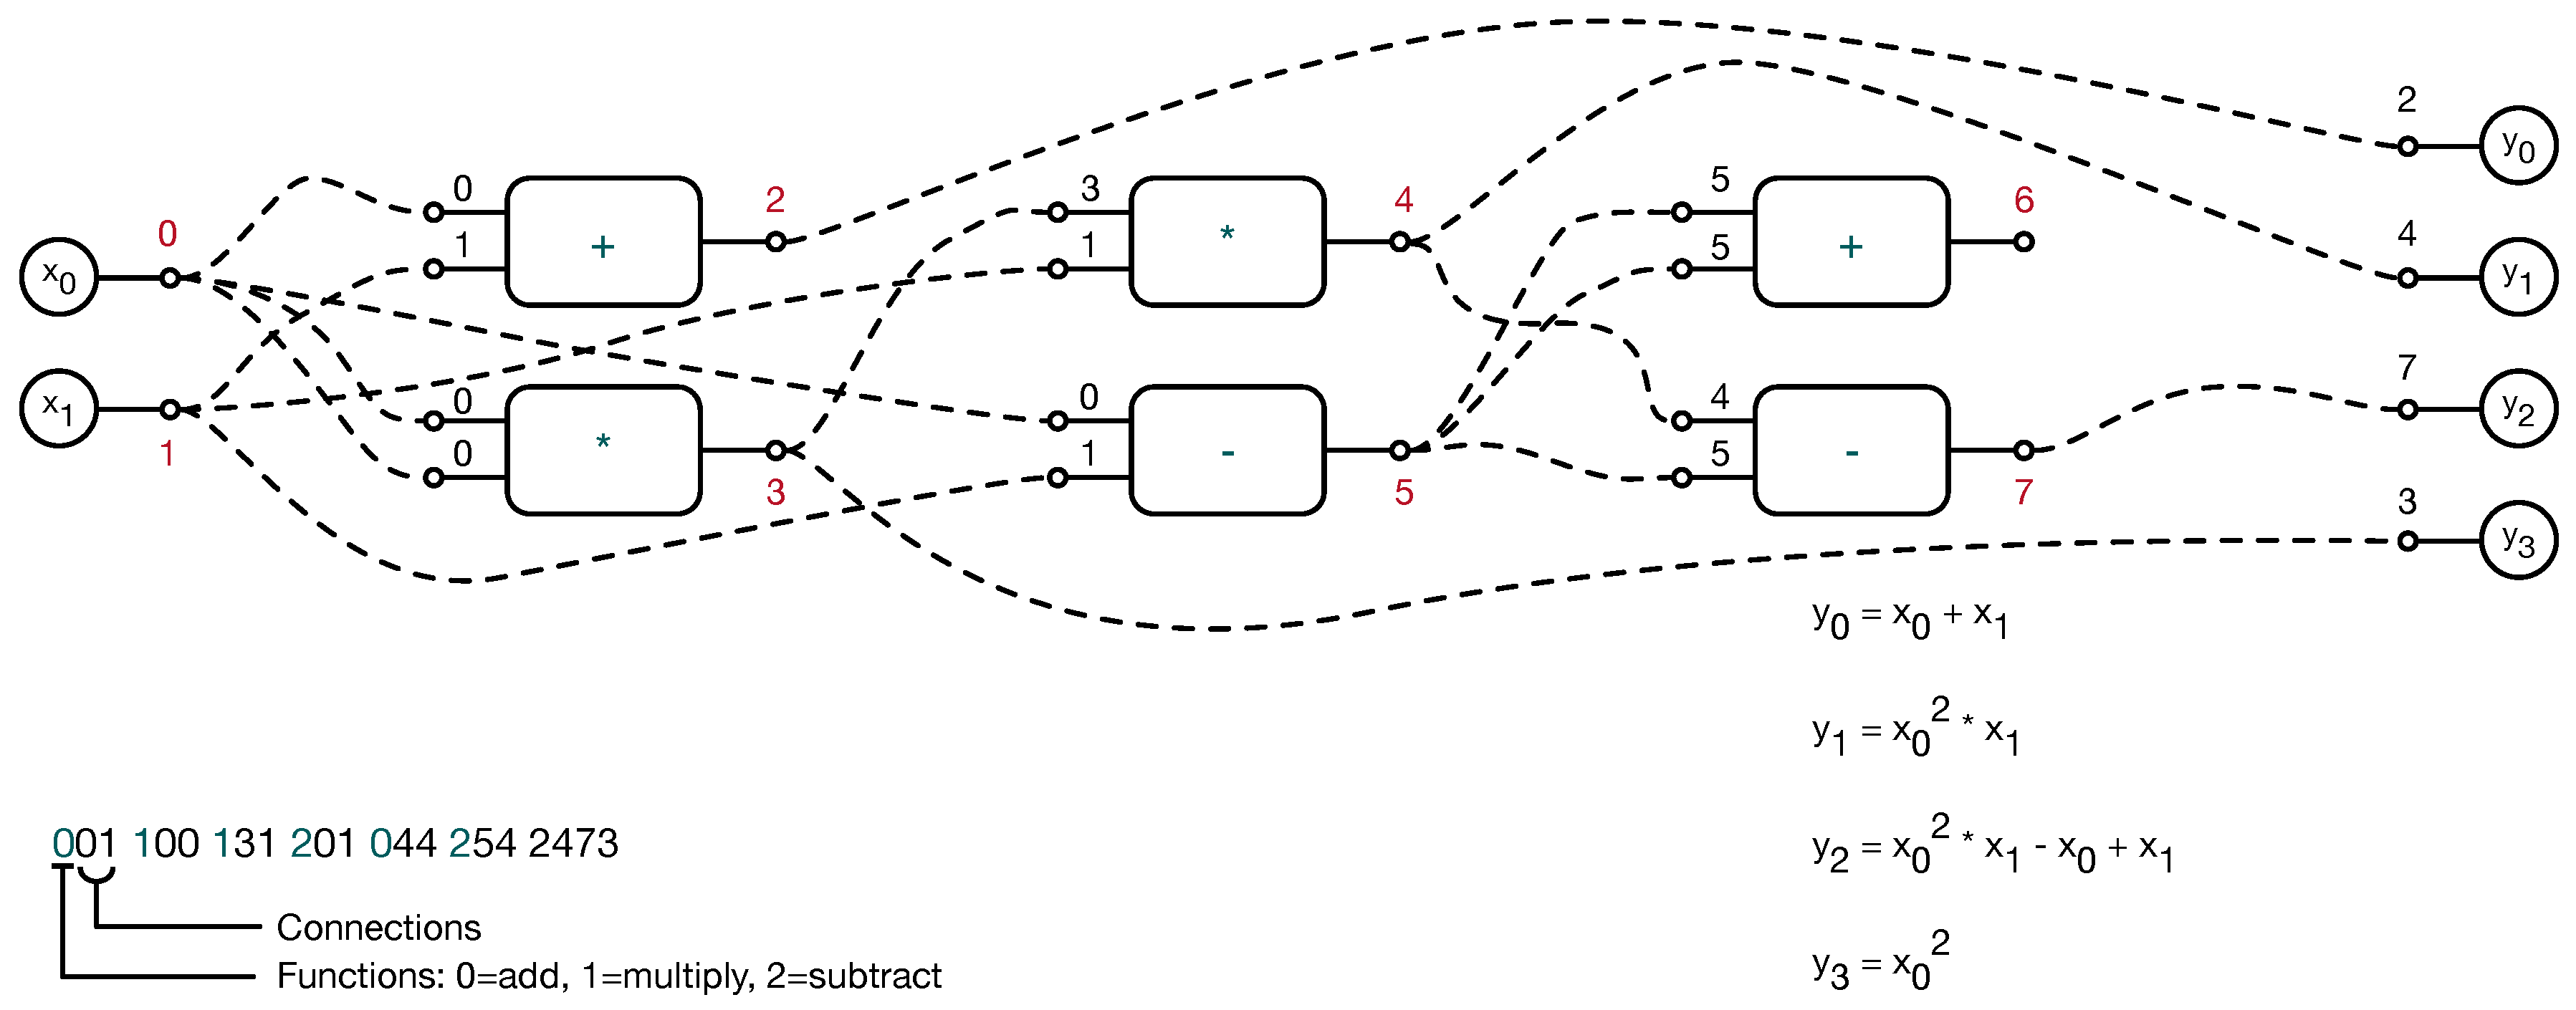
2. The Proposed Method

Genetic Programming [24] is a heuristic methodology well suited for optimization purposes [25,26,27,28,29]. It has its roots in implementing in computer programs mechanisms borrowed from the natural evolutionary process.
CGP is a highly flexible and efficient form of Genetic Programming, that can be used for finding the solutions to a broad class of problems and applied to many domains [22].
In this work, with the application of CGP, we aim to provide some insights into the automatic diagnosis of PD. In particular, we use a CGP approach for the automatic identification of the disease through the analysis of drawing shapes. Compared to other classification techniques, this approach also provides the explicit model of the classification criteria, and therefore allows the clinician to highlight the most informative handwriting features (and their relationships), thus learning which should be taken into account for the diagnosis.
CGP uses a very simple representation of the computational structure in the form of a directed acyclic graph, represented though a two-dimensional grid of nodes, organized in n r number of rows and n c number of columns. Figure 1 shows an example of a simple CGP network, where six nodes are arranged in a 2 × 3 rectangular format. The graph has two inputs ( x 0 and x 1 ) and four outputs ( y 0 ,   y 1 ,   y 2 ,   y 3 ).
Each node is numbered progressively (starting from zero) and is associated with a particular function, chosen among a set of predefined ones (these can be algebraic, logic, non-linear, etc.). Inputs to the nodes are manipulated according to the node function and the results are then provided to the output nodes. Nodes are connected in a feed-forward manner: each node provides an output to the nodes of the next columns and takes one or more inputs (depending on the arity of the function, that is the number of its input parameters) from the nodes in the previous columns. In order to manipulate this kind of structure (the phenotype), CGP makes use of a different representation, called the genotype, made up of a fixed length array of integers representing a sequence of chromosomes (the individuals of the population) (bottom part of Figure 1). Chromosomes are composed of values representing the node function (function gene) and the node inputs (connection genes). Phenotype ends with the values representing the outputs of the computational structure (output genes). The phenotype can be obtained from the genotype by a decoding procedure. It is noteworthy that when genotypes are decoded into phenotypes not all the nodes are connected in the path from inputs to outputs, and therefore, with the CGP approach, one genotype can correspond to different phenotypes. Nodes that are not connected in the phenotype are referred to as non-coding nodes.
As in other genetic programming approaches, the chromosomes in the initial population are initialized with random values and a fitness function is used for quantitatively evaluating the efficacy of the solution in solving the problem. According to the value of the fitness measured for each member of the population, parents are selected according to their quality and mutation is applied to generate offsprings. Through mutation, the status of both coding and non-coding genes is changed according to a probability value, the mutation rate, and can result in offspring that are very different from the parents. The process is repeated until the maximum number of generations is reached or the optimum solution is found.

3. Experimental Results and Discussion

The evaluate the performance of the proposed approach in providing explainable yet effective solutions, and following the suggestions by Zham et al. [17], we ran a set of experiments on the HandPD dataset [21], which contains handwritten data collected from 92 graphical tests performed by 74 PD patients and 18 healthy subjects. It is composed of 368 spirals and 368 meanders drawn by the participants following a printed template on paper with a pen. As a result, we have two unbalanced datasets, i.e., spirals and meanders, each of which is composed of 296 samples belonging to PD patients and 72 belonging to healthy subjects. Examples of the handwriting tasks and their execution by both healthy subjects and PD patients are reported in Figure 2.
Nine handwriting features, reported in Table 1, were extracted from the dataset, as proposed in Reference [21], and used as the input for the CGP. Figure 3 shows, together on one sample, the two main geometric entities, namely the distance between the centre of the template and the template/written trace (ET/HT radius), from which all the features are computed. Following Reference [21], we divided the dataset into a Training set and a Test set made of 75% and 25% of the original dataset, respectively, in such a way as to maintain the relative occurrence of patients and healthy subjects.

3.1. Parameter Settings

In order to choose the values of the parameters that regulate the behavior of the CGP, and because there is not an established procedure to follow [22], we performed an exploratory tuning phase. We ran a set of experiments on the Training set with different morphologies of the network and selected the parameters that maximized the performance, also taking into account the trade-off between computational cost and performance. The analyzed ranges for the values of the parameters and those selected for performing the analysis on the entire dataset are reported in Table 2. As regards the evolution strategy, we considered two alternatives in the exploratory phase: tournament selection and ( λ + μ ) strategy. The latter provided a better performance.
Regarding the set of functions associated with the nodes of the CGP, the exploratory phase was aimed at identifying the minimum set of functions with the best performance. We started with a set comprising arithmetic functions (for defining the expressions) and selection functions (if-then-else functions, which help to define the structure of the decision model). Subsequently, we added different function subsets (logical, non linear, and comparison). Overall we analyzed the behavior of 23 functions, and we selected 10 functions, out of 23, for the final set, which is reported in Table 3.
To numerically assess the quality of each classification model M achieved during the CGP execution, the fitness function was designed taking into account two aspects of the problem: (1) In a real scenario the detection of PD is more important than having false positives; (2) the dataset on which we tested our approach is unbalanced (80.44% patients vs. 19.56% healthy subjects). Consequently, we defined the fitness function as follows:
ϕ ( M ) = PD acc · H rate + H acc · PD rate · k
where PD acc and H acc represent PD and H group accuracy (i.e., the fraction of correctly identified patients and healthy subjects), respectively. The coefficient k was introduced to give priority to the PD accuracy, and the constants PD rate and H rate were introduced to mitigate the dataset disequilibrium.
In particular,
PD rate = n PD n , H rate = n H n
represent the ratio between the number of drawings performed by the PD group and H group, respectively, and the total number n of drawings. In the exploratory phase, we analyzed the performance trend obtained by varying the parameter k in the range [ 0.05 ; 0.15 ] and selected the value k = 0.125 , which provided the best performance.
At the end of the evolution, in order to compare the results provided by CGP with those provided by Reference [21], the global accuracy of the best model found so far was computed using the method described in Reference [30] for unbalanced datasets.

3.2. Results

The results were obtained by applying a cross-validation procedure with 20 runs. For the sake of comparison with state-of-the-art methods, both recognition rates per class and global accuracy were averaged over runs and compared with those obtained with three different algorithms (Support Vector Machine, Naive Bayes, and Optimum-Path Forest) used in Reference [21]. Table 4 and Table 5 report the results (in terms of m e a n ± s d ) for spirals and meanders, respectively.
As regards the spiral dataset, CGP performs better than OPF and SVM, but worse than NB, which provides the best solution in terms of global accuracy. However, if we consider the recognition rates per class, CGP performs worse than OPF on the PD patients, while it is much better on healthy subjects. Moreover, it is evident that SVM classifies all the subjects as patients.
As regards the results obtained with the meanders, CGP is the best performing method, since it reaches the highest value of global accuracy. In particular, while CGP reaches a performance very close to SVM on PD patients, it is able to outperform SVM on healthy patients, thus gaining better global accuracy. High standard deviation values could be due to the high variability of the datasets, which contains images drawn by PD patients in different stages of the disease.

3.3. Explicit Models of Classification Criteria

As already mentioned, one of the key features motivating our choice of using the CGP is the possibility of obtaining some insights into the rationale behind the classification process. Indeed, by decoding the genotype obtained at the end of the training phase, one can obtain the explicit classification model inferred by the CGP. This model, in turn, allows one to achieve two goals: to highlight the most informative features, and by interpreting the identified relationships, to obtain more efficient guidelines for the diagnosis of the disease.
Looking at the explicit models obtained at the end of 19 out of 20 cross validation runs, a general model can be extracted. This model (reported in Algorithm 1) takes into account the relationship among three features ( x 0 , x 5 , and x 7 ) and a combination of other features, indicated with C ( x ) . This suggests that, regardless of the data used for training the CGP, an underlying scheme is always present in the obtained models, which involves three main global features: x 0 and x 7 , related to the global difference between handwritten and template trace, and x 5 , related to the maximum extension of the handwritten trace. One model out of twenty was more complex and was not characterized by the same underlying scheme. This model was the one with the worst performance.
Algorithm 1 The general model inferred by using all the best models at the end of each run. C ( x ) can contain both local and global features.
if ( 2 x 0 + x 5 x 7 ) < C ( x ) ) then
  output = ”control”;
else
  output = ”patient”;
end if
Table 6 reports the occurrence of the features in the models evolved by the CGP across all the runs. The data shows that, among the features included in the expression C ( x ) , x 1 is always present, while the other ones are exploited for further refinements of the classification criteria, and presumably, are less informative then the others in highlighting the graphical signs caused by the disease.
In order to evaluate whether the features which occurred least ( x 2 and x 3 ) were those carrying less information about the handwriting signs of the disease, we excluded them from the training phase of the CGP. As expected, since those features rarely contribute to the definition of the evolved models, information carried by them does not capture distinctive signs of the disease, and in some cases, could represent a noise component for the classification process. Indeed, looking at the results reported in Table 7, it can be observed that, on average, classification performance is not significantly different in the three conditions and the standard deviation of the results decreases by removing the features.
Among the evolved models, we selected the one with the best performance (reported in Algorithm 2) and, in order to evaluate whether it captures the most informative features and their related relationships, we employed the model for classifying the 20 datasets used in the previous cross-validation experiment.
Algorithm 2 The best performing model evolved by CGP among all the 20 runs.
if ( 2 x 0 + x 5 x 7 ) ( x 1 + x 4 + 2 x 6 ) then
  output = ”control”;
else
  output = ”patient”;
end if
Table 8 reports the obtained results and shows that using the best-evolved model gives an even better performance than those obtained in the cross validation analysis.
Furthermore, looking at the relationship among features included in the best performing model (see Figure 4), some guidelines for the diagnosis of the disease can be extracted. First of all, the model analyzes the relationship between six features, dropping three of them, namely x 2 , x 3 , and x 8 . This suggests that an overly fine characterization of the trace drawn by the subjects, such as the one measured by x 8 , negatively affects the performance and therefore should be avoided. From a numerical point of view, the order of magnitude of the values of the features x 0 and x 1 is 10 3 , for x 5 and x 7 is 10 2 , for x 4 is 10 1 , and eventually, for x 6 is 10 2 . Because x 0 and x 1 are on different sides of the inequality, and because x 6 values are negligible, the decision mainly depends on the relationship between x 4 and the difference between x 5 and x 7 . In the case of PD patients, the tremor, measured by x 4 , must be larger than the maximum distance between the template and the written trace, measured by x 5 , minus the standard deviation of the written trace radius, expressed by x 7 . This algebraic relationship may be linked to signs clinically associated to Parkinson’s disease by noting that the higher the values of x 5 and x 7 , the larger the difference between the template and the written trace, and therefore their difference can be used to characterize the skill of the subject in following the template. Thus, the model learned by the CGP suggests that, for diagnostic purpose, the tremor plays a crucial role, but in relation to the subject skill in tracing the reference pattern. Therefore, a large value of the tremor by itself does not suffice for a PD diagnosis, as there may be subject exhibiting high values of x 4 not because of the pathology, but because of their poor motor skills, which leads to larger values for x 0 , x 1 , and x 5 . Eventually, it is interesting to note that, in comparison with the best model discovered by the CGP, the simplest model (Algorithm 3) completely gets rid of the feature x 6 , which is perfectly plausible once the numerical values are considered.
Algorithm 3 The simplest model evolved by CGP among all the 20 runs.
if ( 2 x 0 + x 5 x 7 ) ( x 1 + x 4 ) then
  output = ”control”;
else
  output = ”patient”;
end if

4. Conclusions

This work proposed an evolutionary approach for the automatic diagnosis of Parkinson’s disease through handwritten shape analysis. In particular, we used Cartesian Genetic Programming on a set of static features, reported in a publicly available dataset, to improve the performance obtained in previous work and to provide an explicit model of the classification criteria.
The experimental results show that the features extracted by spirals are less informative than the ones extracted by meanders and that the global accuracy achieved by the analysis of meanders outperforms that obtained by other works. They also show that in its best configuration, the CGP performance is comparable or even better than the state-of-the-art methodologies proposed in the literature for PD diagnosis.
In our opinion, however, the most relevant feature of the proposed approach is the unveiling of the decision criteria with respect to the top performing state-of-the-art method based on SVM. As we have discussed above, by linking the feature values with the distinctive aspects of the handwriting they are meant to capture, it is possible to map the decision criteria onto the clinical signs, so as to aid the acceptance by clinicians of such an automatic system in the assistance of the diagnosis of PD.
However, to help the application of this approach in a real scenario, future work will be aimed at improving the obtained accuracy by (1) investigating an enlarged feature set, and (2) performing a more in-depth analysis on the more meaningful features involved in the classification step. Furthermore, as previous studies suggest that dynamic features generally improve the accuracy, we envisage testing the approach presented here on datasets such as PaHaw [19] and NewHandPD [20], which contain both static and dynamic features. According to our previous results on loop shapes [14], we expect that dynamic features, and in particular, changes in the acceleration of the pen tip due to its association with tremors, will appear among the most selected ones.

Author Contributions

All the authors have equally contributed to conceptualization, experimental work and writing.

Funding

This research was funded by grant PRIN-20154C9M5P-002 from the Italian Ministero dell’Istruzione, dell’Università e della Ricerca and is part of the research program HAND (Handwriting Analysis against Neuromuscular Disease).

Conflicts of Interest

The authors declare no conflict of interest.

References

  1. Jankovic, J. Parkinson’s disease: Clinical features and diagnosis. J. Neurol. Neurosurg. Psychiatry 2008. [Google Scholar] [CrossRef] [PubMed]
  2. Marsden, C.D. Slowness of movement in Parkinson’s disease. Mov. Disord. 1989, 4, S26–S37. [Google Scholar] [CrossRef] [PubMed]
  3. Sheridan, M.R.; Flowers, K.A.; Hurrell, J. Programming and execution of movement in parkinson’s disease. Brain 1987, 110, 1247–1271. [Google Scholar] [CrossRef] [PubMed]
  4. Stelmach, G.E.; Teasdale, N.; Phillips, J.; Worringham, C.J. Force production characteristics in Parkinson’s disease. Exp. Brain Res. 1989, 76, 165–172. [Google Scholar] [CrossRef] [PubMed]
  5. Senatore, R.; Marcelli, A. A neural scheme for procedural motor learning of handwriting. In Proceedings of the International Workshop on Frontiers in Handwriting Recognition (IWFHR), Bari, Italy, 18–20 September 2012. [Google Scholar] [CrossRef]
  6. McLennan, J.E.; Nakano, K.; Tyler, H.R.; Schwab, R.S. Micrographia in Parkinson’s disease. J. Neurol. Sci. 1972, 15, 141–152. [Google Scholar] [CrossRef]
  7. Teulings, H.; Contreras-Vidal, J.; Stelmach, G.; Adler, C. Parkinsonism reduces coordination of fingers, wrist, and arm in fine motor control. Exp. Neurol. 1997, 146, 159–170. [Google Scholar] [CrossRef] [PubMed]
  8. Van Gemmert, A.W.A.; Teulings, H.L.; Contreras-Vidal, J.L.; Stelmach, G.E. Parkinson’s disease and the control of size and speed in handwriting. Neuropsychologia 1999, 37, 685–694. [Google Scholar] [CrossRef]
  9. Teulings, H.; Stelmach, G.E. Control of stroke size, peak acceleration, and stroke duration in Parkinsonian handwriting. Hum. Mov. Sci. 1991, 10, 315–334. [Google Scholar] [CrossRef]
  10. De Stefano, C.; Marcelli, A.; Parziale, A.; Senatore, R. Reading cursive handwriting. In Proceedings of the 12th International Conference on Frontiers in Handwriting Recognition (ICFHR 2010), Kolkata, India, 16–18 November 2010. [Google Scholar] [CrossRef]
  11. Broderick, M.P.; Van Gemmert, A.W.A.; Shill, H.A.; Stelmach, G. Hypometria and bradykinesia during drawing movements in individuals with Parkinson’s disease. Exp. Brain Res. 2009, 197, 223–233. [Google Scholar] [CrossRef] [PubMed]
  12. Van Gemmert, A.W.A.; Adler, C.H.; Stelmach, G.E. Parkinson’s disease patients undershoot target size in handwriting and similar tasks. J. Neurol. Neurosurg. Psychiatry 2003, 74, 1502–1508. [Google Scholar] [CrossRef] [PubMed]
  13. Tucha, O.; Mecklinger, L.; Thome, J.; Reiter, A.; Alders, G.L.; Sartor, H.; Naumann, M.; Lange, K.W. Kinematic analysis of dopaminergic effects on skilled handwriting movements in Parkinson’s disease. J. Neural Transm. 2006, 113, 609–623. [Google Scholar] [CrossRef] [PubMed]
  14. Senatore, R.; Marcelli, A. A paradigm for emulating the early learning stage of handwriting: Performance comparison between healthy controls and Parkinson’s disease patients in drawing loop shapes. Hum. Mov. Sci. 2018. [Google Scholar] [CrossRef] [PubMed]
  15. Thomas, M.; Lenka, A.; Pal, P.K. Handwriting analysis in Parkinson’s disease: Current status and future directions. Mov. Disord. Clin. Prac. 2017. [Google Scholar] [CrossRef] [PubMed]
  16. Walton, J. Handwriting changes due to aging and Parkinson’s syndrome. Forensic Sci. Int. 1997, 88, 197–214. [Google Scholar] [CrossRef]
  17. Zham, P.; Arjunan, S.; Raghav, S.; Kumar, D.K. Efficacy of guided spiral drawing in the classification of Parkinson’s Disease. IEEE J. Biomed. Health Inf. 2017, 22, 1648–1652. [Google Scholar] [CrossRef] [PubMed]
  18. Rosenblum, S.; Samuel, M.; Zlotnik, S.; Erikh, I.; Schlesinger, I. Handwriting as an objective tool for Parkinson’s disease diagnosis. J. Neurol. 2013, 260, 2357–2361. [Google Scholar] [CrossRef] [PubMed]
  19. Drotár, P.; Mekyska, J.; Rektorová, I.; Masarová, L.; Smékal, Z.; Faundez-Zanuy, M. Analysis of in-air movement in handwriting: A novel marker for Parkinson’s disease. Comput. Methods Programs Biomed. 2014, 117, 405–411. [Google Scholar] [CrossRef] [PubMed]
  20. Pereira, C.R.; Weber, S.A.; Hook, C.; Rosa, G.H.; Papa, J.P. Deep learning-aided Parkinson’s disease diagnosis from handwritten dynamics. In Proceedings of the 2016 29th SIBGRAPI Conference on Graphics, Patterns and Images, Sao Paulo, Brazil, 4–7 October 2016. [Google Scholar] [CrossRef]
  21. Pereira, C.R.; Pereira, D.R.; Silva, F.A.; Masieiro, J.P.; Weber, S.A.; Hook, C.; Papa, J.P. A new computer vision-based approach to aid the diagnosis of Parkinson’s disease. Comput. Methods Programs Biomed. 2016, 136, 79–88. [Google Scholar] [CrossRef] [PubMed]
  22. Miller, J.F. Cartesian genetic programming. In Natural Computing Series; Springer: Berlin, Germany, 2011. [Google Scholar] [CrossRef]
  23. Smith, S.L. Medical Applications of Evolutionary Computation. In Proceedings of the Companion Publication of the 2015 Annual Conference on Genetic and Evolutionary Computation, Kyoto, Japan, 15–19 July 2018; ACM: New York, NY, USA, 2015; pp. 651–679. [Google Scholar] [CrossRef]
  24. Koza, J.R. Genetic Programming: On the Programming of Computers by Means of Natural Selection; MIT Press: Cambridge, MA, USA, 1992; Volume 1. [Google Scholar]
  25. De Falco, I.; Della Cioppa, A.; Tarantino, E.; Fontanella, F. A novel grammar-based genetic programming approach to clustering. In Proceedings of the ACM Symposium on Applied Computing, Santa Fe, NM, USA, 13–17 March 2005; Volume 2, pp. 928–932. [Google Scholar]
  26. De Falco, I.; Della Cioppa, A.; Tarantino, E.; Fontanella, F. An innovative approach to genetic programming-based clustering. In Advances in Soft Computing; Springer: Berlin, Germany, 2006; Volume 34, pp. 55–64. [Google Scholar]
  27. De Falco, I.; Della Cioppa, A.; Scafuri, U.; Tarantino, E. Accurate estimate of blood glucose through interstitial glucose by genetic programming. In Proceedings of the International Symposium on Computers and Communications, Heraklion, Greece, 3–6 July 2017; pp. 284–289. [Google Scholar]
  28. De Falco, I.; Della Cioppa, A.; Koutny, T.; Krcma, M.; Scafuri, U.; Tarantino, E. An evolutionary approach for estimating the blood glucose by exploiting interstitial glucose measurements. In Proceedings of the Eleventh International Joint Conference on Biomedical Engineering Systems and Technologies—HEALTHINF, Madeira, Portugal, 19–21 January 2018; Volume 5, pp. 625–632. [Google Scholar]
  29. Borrelli, A.; De Falco, I.; Della Cioppa, A.; Nicodemi, M.; Trautteur, G. Performance of genetic programming to extract the trend in noisy data series. Phys. A Stat. Mech. Its Appl. 2006, 370, 104–108. [Google Scholar] [CrossRef]
  30. Papa, J.P.; Falcão, A.X.; Suzuki, C.T. Supervised pattern classification based on optimum-path forest. Int. J. Imaging Syst. Technol. 2009, 19, 120–131. [Google Scholar] [CrossRef]
Figure 1. An example of a simple Cartesian Genetic Programming (CPG) network, composed of six nodes arranged in a 2 × 3 rectangular format. The directed graph represents the phenotype, whereas, in the bottom left of the figure, the corresponding genotype is reported.
Information 10 00030 g001
Figure 2. Examples of spirals and meanders extracted from the HandPD dataset [21]. First and second column: 58-year-old male and 28-year-old female individuals from the control group. Third and fourth column: 56-year-old male and 65-year-old female individuals from the patient group.
Information 10 00030 g002
Figure 3. An example of the feature extraction process for a spiral. The blue line is the ET, while the red line is the HT. The arrows indicate the radii for both ET and HT, the white circles indicate the intersection of a radius with the ET and the HT traces and the red circle represents the center of the ET. In order to compute all the features, the radius is shifted by using a predefined spanning angle (for a detailed description of the feature extraction process see Reference [21].
Information 10 00030 g003
Figure 4. Scatter plot of the best rule condition, rearranged as ( 2 x 0 + x 5 x 7 ( x 1 + x 4 + 2 x 6 ) ) 0 , applied to the whole dataset. Bars represent the average and standard deviation.
Information 10 00030 g004
Table 1. Features description of the dataset used. HT: handwritten trace, ET: exam template.
FeatureDescription
x 0 
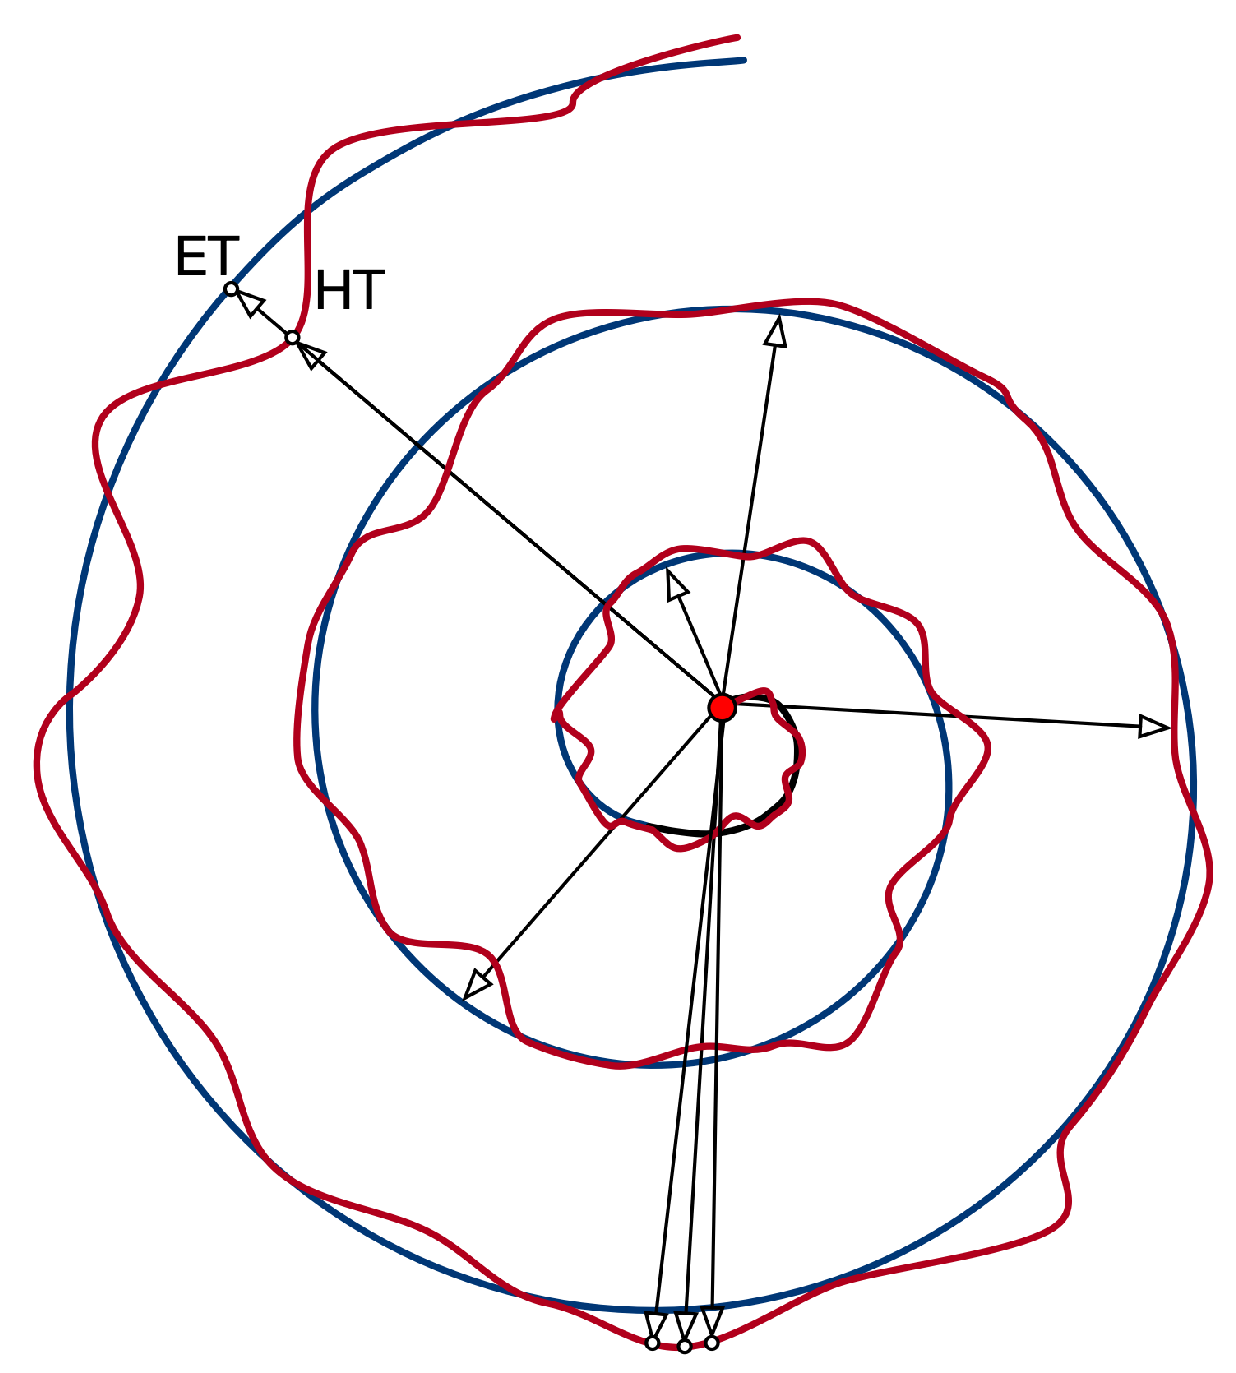
RMS of the difference between HT and ET radius
x 1 Maximum difference between HT and ET radius
x 2 Minimum difference between HT and ET radius
x 3 Standard Deviation of the difference between HT and ET radius
x 4 Mean Relative Tremor
x 5 Maximum HT radius
x 6 Minimum HT radius
x 7 Standard Deviation of HT radius
x 8 Number of times the difference between HT and ET radius changes sign
Table 2. CGP Parameters values.
ParameterValueAnalyzed Range
Row number n r 2
Column number n c 25
Node Configuration 2 × 25 [ 1 × 20 ; 1 × 25 ; 1 × 40 ; 2 × 25 ]
Generation number50,000[1–60,000] s t e p : 10,000
Levels-back25
Population15 [ 5 20 ]
Evolution Strategy μ + λ ( μ = 5 , λ = 10 )
Mutation Rate 15 % 3 % –20% s t e p : 1 %
Table 3. The function set.
FunctionDefinitionArity
sum O U T = x 1 + x 2 2
subtraction O U T = x 1 x 2 2
multiplication O U T = x 1 x 2 2
lessif ( x 1 < x 2 ) O U T = 1 else O U T = 0 2
less or equalif ( x 1 x 2 ) O U T = 1 else O U T = 0 2
greaterif ( x 1 > x 2 ) O U T = 1 else O U T = 0 2
greater or equalif ( x 1 x 2 ) O U T = 1 else O U T = 0 2
negation O U T = x 1 1
if-then-elseif ( x 1 0 ) O U T = x 2 else O U T = x 3 3
if-less-then-elseif ( x 1 < 0 ) O U T = x 2 else O U T = x 3 3
Table 4. Recognition rates per class and global accuracy ( m e a n ± s d ) for the spiral dataset.
Healthy SubjectsPD PatientsGlobal
CGP 65.56 ± 17.74 49.46 ± 8.03 57.51 ± 6.76
NB 65.56 ± 11.48 62.91 ± 12.65 64.23 ± 7.11
OPF 26.39 ± 9.17 78.58 ± 5.02 52.48 ± 5.32
SVM 1.67 ± 4.07 98.65 ± 4.34 50.16 ± 1.71
Table 5. Recognition rates per class and global accuracy ( m e a n ± s d ) for the meander dataset.
Healthy SubjectsPD PatientsGlobal
CGP 52.50 ± 14.02 92.23 ± 4.57 72.36 ± 7.97
NB 80.83 ± 16.37 37.57 ± 22.83 59.20 ± 4.78
OPF 32.78 ± 12.08 82.30 ± 3.72 57.54 ± 6.35
SVM 36.94 ± 10.71 96.49 ± 2.5 66.72 ± 5.33
Table 6. Percentage occurrence of each feature in the models evolved by CGP in all the runs. The most occurring features are reported in bold, while the less occurring features are reported in italics.
x 0 x 1 x 2 x 3 x 4 x 5 x 6 x 7 x 8
10095103065100506040
Table 7. Recognition rates per class and global accuracy ( m e a n ± s d ) for the original meander dataset and reduced versions.
Healthy SubjectsPD PatientsGlobal
CGP (all features) 52.50 ± 14.02 92.23 ± 4.57 72.36 ± 7.97
CGP ( x 2 removed) 49.17 ± 7.71 92.03 ± 4.27 70.60 ± 3.76
CGP ( x 2 and x 3 removed) 51.25 ± 8.23 91.55 ± 3.08 71.40 ± 3.89
Table 8. Recognition rates per class and global accuracy ( m e a n ± s d ) obtained by the best-evolved model.
Healthy SubjectsPD PatientsGlobal
58.33 ± 13.31 94.86 ± 2.96 76.60 ± 6.92

