1. Introduction
Fire is the fourth largest cause of accidental injury after road accidents, falls, and drowning. Globally, fires cause over 300,000 deaths annually. An estimated 180,000 of these deaths are caused by burns [
1]. Poisonous gases, mostly CO, but also HCN and acrolein, represent the second-most frequent cause of death in fires. Over 95% of the deaths and burn injuries are in low- and middle-income countries [
2,
3]. Still, in high-income countries, fires represent a serious threat to the population. Recently, subzero-temperature fires have caught increased attention from researchers who have found these fires to be extremely severe and fast developing [
4].
In the 1950s, Pirsko and Fons [
5] showed that the frequency of urban building fires was correlated with dew point temperature in the winter for selected areas studied in the USA, i.e., a lower ambient dew point resulted in higher fire frequency. In countries with cold climates, building fires are more common during winter [
6]. High electricity consumption, dangerous heating sources, such as kerosene heaters, fireplaces, and wood stoves, as well as increased time spent indoors increase the fire ignition frequency [
7,
8]. However, the increased fire frequency may not tell the complete story. The intensity of a fire, i.e., increased by low Fuel Moisture Content (FMC), is also important [
9,
10]. Such effects are discussed in the recent work by Ayoub et al. [
11], who showed that the hospitalization risk for fire-related burns increases during extreme cold weather in Canada.
The firefighter’s response time may also vary during the day and during the year due to traffic and weather conditions. Upson and Notarianni [
12] found that for nighttime fire calls, the observed mean average turnout time fell well above the current National Fire Protection Association (NFPA) 1710 [
13] benchmarks. Only 21% of the nighttime fire call turnouts were completed within the required 80 s. Studying fire service response time versus fire outcomes in New Zealand, Challands [
14] discovered that the fraction (y) of fires considered large, i.e., over 30 m
2, was linearly related to the response time x (min). The linear relationship for 27,500 structural fires gave y = 0.023 min
−1·x + 0.043, i.e., 2.3% more fires had grown beyond 30 m
2 for each additional minute of response time. For subzero ambient temperature wood structure fires, the relationship may be similar, but probably with a steeper slope as these fires are expected to reach flashover earlier [
15].
As there is a need to get a better grip on the issues of fire development in very dry structures, the present work aims at discussing the possibility for developing a cold climate structural fire danger rating system. Possible steps towards developing such a fire rating system are outlined and analyzed based on available knowledge and technology. A discussion regarding the firefighter’s turnout time and the response time is also included, since any mismatch in fast fire development and response time may result in uncontrolled fire development. Where new knowledge is needed, possible ways to produce the needed knowledge are analyzed before recommendations are made. Based on successes along the research paths, the possible benefits of an automatic weather-forecast-based structural fire danger rating system are outlined.
2. Recent Cold-Climate Fires
The severe subzero temperature fire in Lærdalsøyri (Norway) on 18 January 2014, which destroyed 40 structures, including 15 private homes and 4 historic buildings, may serve as an example of a recent cold-climate conflagration threatening a whole society. The fire was the largest peace-time fire in Norway since 250 structures were lost at Hemnesberget in 1923 [
16]. The severity of the Lærdalsøyri fire was due to adiabatic heating of the ambient air and drying of cellulosic materials, especially indoors, combined with very strong wind likely caused by climate changes. Since the lower indoor relative humidity resulted in fast fire development, indoor relative humidity has been studied as a possible fire risk telltale [
10].
The catastrophic fire at the Résidence du Havre nursing home (senior home) in L'Isle-Verte, Quebec, Canada, 23 January 2014, which resulted in 32 fatalities and 15 injured persons [
17], may serve as an example of a major single structure subzero temperature fire. Regarding structural fires, it has been concluded by [
4] that internal drying and strong winds represented the critical parameters governing fire development. Prior to these incidents, the possibility for very fast fire development did not seem to be understood by the response organizations, neither was it understood that the firefighters could arrive too late for successful intervention.
During December 2017, Norway experienced two fatal fires in wooden structures for vulnerable people, i.e., the “Bulls minde” fire in Horten, 16 December (one fatality and loss of ten flats) and the “Skinnarberga senior home and care center” fire at Kongsberg, 24 December (one fatality and loss of 24 flats). The first fire was reported at 16:16, while the last fire was reported at 03:00, i.e., during the night shift. Both fires received national attention due to the intense and very fast fire development, the narrow escape for low mobility inhabitants, and the loss of one life in each fire. Both fires had several signs of typical cold-climate fires. For the first fire, there was no meteorological station recording ambient relative humidity in the vicinity. For the second fire, the closest meteorological station was located only 4.5 km from the Skinnarberga senior home and care center. The ambient temperature and relative humidity for this meteorological station are shown in
Figure 1. Theoretically estimated indoor relative humidity, based on the values in
Figure 1 and the calculation procedure explained in [
9], is shown in
Figure 2. The buffering effect of the wooden materials and the moisture gain from indoor activities are not taken into consideration. It should be noted that in these types of flats inhabited by single seniors, a moisture gain well below 1 g/m
3 would be expected. Comparing this to the equilibrium water content of 20 g/m
3 at 22.5 °C, a less than 5% increase in the indoor relative humidity (RH) due to human activities may be expected.
As seen in
Figure 2, the theoretically calculated relative humidity was very low about 10 days prior to the Skinnarberga senior home and care center fire. This must have resulted in significant indoor wood drying. Due to hysteresis, only very limited adsorption can have been the case before the observed humidity peak starting 13 hours before the fire. It should also be noted that there would be a delay in this peak due to the finite number of air changes per hour. It has recently been demonstrated [
10] that the buffering capacity of the wood products will partly even out such a short duration peak in RH compared to the RH values seven days earlier. The short duration peak a few hours before the fire will therefore result in only minor moisture absorption at the surface of solid wood products, such as wall panels. The depth below 1 mm will not be influenced, i.e., the bulk of solid wooden panels, etc. must have been very dry in this particular fire. As this was certainly a dry indoor climate fire, flashover was reached much earlier than in a normal 50% RH condition [
15]. This may partly be the explanation for the response team from the Kongsberg fire department, located only 8 km by car from the Skinnarberga senior home and care center, not being able to control the fire. The normally longer turnout time during night shifts may also have influenced the response time.
The characteristics of these three fires based on references [
4,
9,
17] are summarized in
Table 1 with their corresponding wood Equilibrium Moisture Content (EMC). As fire testing of wood specimens, e.g., in a cone calorimeter, is usually performed with samples conditioned to equilibrium mass at 50% RH (±5% RH), the corresponding EMC value for 50% RH is included in
Table 1. In the normal (50% RH) condition, the 9.3% water contained in the wood slows the fire development in several ways and particularly due to the heat needed to evaporate the water vapor [
9]. Less water in the wood when exposed to a drier indoor climate, as indicated in
Table 1, increases the fire risk in cold climates. However, since it takes some time to dry the involved products, the dry indoor climate exposure time also plays a role in fire risk development.
3. Drying of Cellulose-Based Materials
It is well-known that dry wood burns more intensely than more humid wood. This is well-acknowledged within the wildfire community. For wood-based structures, it has recently been demonstrated that both vertical fire spread [
19] and time to flashover in wood-lined compartment fires [
15] is very dependent on the wood moisture content. The wood moisture sorption processes therefore play an important role in increasing cold weather fire risk.
Live plants may contain substantial amounts of water, i.e., >100% relative to being oven-dried for 48 h at 105 °C [
20]. Dead wood, when not soaked, contains less than 30% by weight water to the dry weight basis. It is the possibility of forming hydrogen bonds to water that makes wood and other cellulosic products hygroscopic. This water may be supplied from or exported to external sources, such as liquid water or dry or humid air. The wood’s Equilibrium Moisture Content (EMC) is a function of the air’s Relative Humidity (RH). The EMC for pine wood as a function of RH is shown in
Figure 3. Due to the complexity of the wood structure, also on a molecular level, hysteresis effects are observed [
21]. In principle, however, wood that is drier or more moist than the EMC corresponding to the current relative humidity will approach this EMC value by absorbing or releasing water vapor. This is, however, a very slow process, while the normal drying process is faster and governed by diffusion processes.
Mortensen [
23] studied the drying of thin sheets of paper and layers of such sheets. It was found that only for very low thicknesses, i.e., of 1–2 layers of paper, the drying process was limited by gas phase diffusion (convection). For thicker objects, e.g., wall panels, tables, and chairs with and without upholstery, the drying process is restricted by solid phase diffusion, which may be described by Equation (1), Fick’s law:
where
(kg/m
2 s) is the mass flux of water, Dw (m
2/s) is the diffusion coefficient of water in the actual solid, C (kg/m
3) is the water concentration, and x (m) is the distance. The transient drying is given by the 2nd order differential equation, Equation (2):
where t (s) is the time. The diffusion coefficient for wood is typically in the range 1 to 5·10
−10 m
2/s [
10], and it may be considered constant within normal variations of indoor temperatures [
20]. For the sake of simplicity, it may be assumed to be 3·10
−10 m
2/s. Based on the EMC values and Equation (2), the drying of indoor potentially combustible materials may be modelled as a function of the indoor relative humidity and time during periods of dry indoor conditions.
In a home, there may be different types of wood used as construction materials, wall panels, floor panels, furniture, etc. The sorption hysteresis is known to vary with the type of wood involved [
24] and represents a challenge in modelling [
21]. Funk [
25] and Hill et al. [
26] studied hysteresis based on the entropy and Gibbs free energy of activation for wood sorption processes and polymeric relaxation occurring within the cell wall during adsorption or desorption. Similar sound simplifications for modelling drying may probably be developed for evaluating fire danger.
By testing, e.g., mass recording of wood in a controlled atmosphere (climate chamber), it may also be documented whether hysteresis needs to be taken into consideration. If not, modelling the drying process may be done based on discretization of Equation (2). There may be challenges related to modelling diffusion restriction in, e.g., floor lacquer and possible non-penetrant wall papers. Knowledge about these issues may probably be found within the area of building physics or by drying experiments in a controlled atmosphere simulating indoor conditions.
A hysteresis model suitable for the numerical simulation of moisture content in wood is presented by Frandsen et al. [
27]. It uses closed-form expressions for the scanning curves where the current relative humidity and moisture content are the only input parameters. It has the advantage of being applicable to different sorption isotherms, which makes it promising for the numerical modelling of sorption processes in indoor wood products during winter time. According to Frandsen et al. [
28], complex multi-Fickian or multiphase sorption is associated with relative humidity above 54% RH. When considering increased fire risk during cold winter weather, the indoor RH values are well below 50% RH. At such low relative humidity, slow bound-water transport and fast sorption may probably allow for a simplification of the system to be modelled by a single Fickian diffusion equation [
28]. It is therefore quite likely that fair modelling accuracy of moisture content in indoor wood may be achieved.
4. Recording versus Predicting Indoor Relative Humidity
4.1. Recording Indoor Relative Humidity
Placing relative humidity sensors in a number of structures and recording the indoor air relative humidity through a web-based system would give access to real-time data. This would be very beneficial for estimating or modelling the FMC of cellulose-based materials in each individual structure. There are, however, some major drawbacks with this approach. There is a challenge with accuracy versus price, or much labor for calibrating low-cost equipment. It is also costly to purchase a large number of units and place them in the different structures. The owners, or people renting the space, may also be quite reluctant to have such equipment installed. They may even compromise the recordings. Maintenance is also a serious obstacle. Placing numerous detectors for recording indoor air relative humidity as a proxy for structural fire danger may therefore not be practicable.
4.2. Predicting Indoor Relative Humidity Based on Ambient Air Properties
If cold ambient air of known temperature and relative humidity is heated to indoor conditions, with no humidity exchange, the indoor relative humidity may be precisely calculated based on the equilibrium water vapor pressure, the ideal gas law, and the indoor temperature [
9].
Weather forecasts have been significantly developed during the last few decades as a result of better modelling techniques and powerful computers needed for the necessary numerical analysis. Researchers, as well as the public, can easily access weather forecasts for the next few days on the internet. Weather Application Programming Interfaces (APIs) may be provided for research purposes. As an example, the weather API from The Norwegian Meteorological Institute provides 10 days forecasts. Although the long-term forecasts are not very accurate, and temperature and relative humidity may vary locally, the 48 h forecasts have a very good accuracy regarding the water vapor content, i.e., the dew point, which is important when considering indoor drying in cold climates.
The indoor temperature in inhabited structures does not vary much from, e.g., 22 °C to 24 °C. In inhabited structures there will, however, be sources, such as humans, animals, pot plants, and house hold activities, releasing humidity to the indoor air. In principle, it would be possible then to predict indoor relative humidity based on the weather forecasts and adjust the results based on the sources mentioned. The ventilation, i.e., number of Air Changes per Hour (ACH), varies much between different types of structures. Window airing is another source of ventilation that varies significantly. The number of inhabitants and the size of the structure also exert influence on the resulting indoor relative humidity.
The building fabric, i.e., internal surfaces, such as wooden flooring, walls, and ceiling materials, as well as the furniture, may buffer changes in indoor relative humidity, especially for fast variations in ambient conditions [
29]. These objects may release or absorb significant amounts of humidity depending on the previous history. Humidity may even diffuse through the building envelope. It is therefore not straightforward to predict the indoor relative humidity based on weather forecasts. The buildings, as well as the furniture types, furniture densities, etc, vary. The system is tight coupled, i.e., the whole system must probably be modelled concurrently. Modelling single structures may not be the way forward. Modelling a limited number of idealized and representative buildings may, however, be a solution to these challenges.
4.3. A Compromise Solution
A sound compromise may be to investigate the correlation between forecasts in a few areas and recordings outside and inside a limited number of structures. Placing relative humidity sensors in selected homes for recording ambient as well as indoor temperature and relative humidity is possible and has been done in a number of studies for limited periods. In a recent study [
10], volunteers were selected among people with a special interest in the research field, i.e., firefighters, engineers, etc. As long as the number of sensors is limited, the cost of calibration, installation, and maintenance may be manageable.
Recordings may be retrieved from local meteorological stations and from the ambient air outside the structures. Any deviations can then be analyzed. These two ambient recordings may then be used for predicting indoor relative humidity values, which may then be compared to the recorded indoor values. Moisture gains or losses may be calculated keeping in mind the accuracy of the relative humidity recordings. It may then be checked how well modelling the whole system, including indoor air change rates, humidity production, and indoor wood drying, turns out to be regarding indoor relative humidity versus the values recorded indoors in these structures.
Using the forecasts for ambient air conditions is beneficial as it also contains data for the expected wind conditions for the next days. For cold weather wildfire urban interface (WUI) fires, such as the Flatanger fire that destroyed 60 structures in Norway in January 2014 [
20], prediction of precipitation (rain or snow) may also be incorporated into the rating system.
The current estimates can be updated based on the information gained from the recorded values at local meteorological stations, i.e., the actual estimate is based on ambient air recordings and the predictions are based on weather forecasts. Previous research in building physics, e.g., [
30,
31,
32,
33], may reveal the potentials of such modelling.
4.4. The Needed Accuracy?
Pirsko and Fons [
5] showed that the frequency of urban building fires was correlated with dew point temperature in the winter for selected areas in the USA, i.e., a lower ambient dew point resulted in higher fire frequency. The simplest version of a structural fire danger rating system may therefore be based on the ambient air dew point in combination with forecasted wind strength. Additionally, as the water vapor content in the ambient air is the fundamental property, the fire danger rating should be based on this parameter. It would, however, be even better to base the rating on the moisture content of potential fuel involved in a fire. Since the drying of wood generally is a slow process, typically involving 2–5 days for a wood-framed villa [
10], the drying time should be taken into consideration.
How precise this needs to be modelled is currently unknown. Since the challenge is to develop a tool for predicting fire risk in the society, does it then need to be extremely accurate? Or, does it just need to indicate that the risk contribution from dry cellulose materials is within certain ranges, e.g., low, medium, high, or extremely high?
Modelling the drying of wooden members may also be evaluated versus recorded values, not in situ in the homes, but in a climate chamber. A programmable climate chamber can be set to follow the previously recorded relative humidity in one of the homes. The modelling of the sorption processes may be compared to the mass loss and gain of the wooden member, e.g., a chair or other materials.
Whether there is a possibility for relying on modelling only cannot be answered at the moment. It would, however, seem like an interesting end point if the accuracy is sufficient for the purpose, i.e., predicting increased fire risk due to dry cellulosic materials. Wind strength is already very well-modelled by meteorologists.
4.5. Introducing the As Low As Reasonably Practicable (ALARP) Principle
The general 10-min response time requirement in Norway may not be the best approach, as the uncertainty in both the response time as well as the fire’s development may render this criterion inapplicable. Rather than accepting a 10-min response time threshold, it may be beneficial to consider an ALARP (As Low As Reasonably Practicable) approach to reduce the risk even further, especially on days of expected fast fire development. The ALARP principle, originating from a court case in the U.K. mining industry in 1949, and implemented in U.K. legislation, particularly the Health and Safety at Work Act in 1974, is currently used in the process industry regulation acts in several countries [
34]. It is recommended that this principle is enforced by the authorities also for the public sector, especially for objects defined as special fire objects in the Norwegian fire acts and regulations. A major quality of the ALARP principle is that it goes beyond the levels of the acts and regulations, i.e., beyond a 10-min response time requirement. In the ALARP process, the systematic process of reducing the risk even further by considering relevant Risk Reducing Measures (RRMs) must be documented. For each RRM not applied, the risk owner must document why it has not applied a considered RRM. This opposite argumentation process is important for continuous risk reduction. The ALARP process may reveal low cost RRMs to be implemented right away. It is therefore recommended that such industrial processes are also considered and tested out in the public sector too.
There may be several ways to achieve good protection during high risk periods (long dry periods combined with strong wind forecasts on particular days). Understanding the risk and thinking creatively may help identify measures to mitigate the danger.
5. Firefighter Response Time
5.1. Response Time Requirements
The Norwegian “Fire and Explosion Protection Act” [
35] requires that fire brigades define special fire objects within their jurisdiction area. The Norwegian “Regulation on fire preventing actions and inspections” [
36], including the respective guidelines [
37], defines three categories of special fire objects, i.e., (a) structures and areas where fire may result in multiple fatalities, (b) structures that, as per their nature or the activities taking place, are considered to present a particular fire hazard, or where fire can cause major societal consequences, and (c) important cultural and heritage structures and facilities. In the former two categories, it is required that inspections are undertaken annually. In the last category, inspections are required every four years. In addition to a general inspection, the procedure is meant to prepare fire brigades for efficient action if needed in a fire scenario in the special objects.
The authors have in some cases observed that a major expansion of special fire objects was known to the Fire Protection Team (FPT) performing the fire inspections, but not known to the Emergency Responders Team (ERT). This lack of communications may influence the response efficiency.
The firefighter’s response time must be seen in the context of likely fire development. Fast fire development, as discussed in the present work, may then require a faster response. According to the Norwegian “Regulation on fire preventing actions and inspections” [
36,
37] settlements/agglomerations with special risk of fire spread, or special fire objects, such as hospitals, nursing homes, and concentrated business areas and the like, shall have a response time which does not exceed 10 min. In urban areas in general, the response time shall not exceed 20 min. In rural areas, the response time should not exceed 30 min. Guidance documents also emphasize that dispensation may be granted from the (response) time by preventive measures, such as increased staffing at institutions, based on a risk and vulnerability analysis. The 10-min response time is, however, already less stringent than the NFPA 1710 standard, which states that the fire department shall have the capability to deploy an initial full alarm assignment within a 480-s travel time, i.e., 8 min, to 90 percent of the incidents [
13].
5.2. Observed Response Times
Upson and Notarianni [
12] investigated fire emergency and emergency medical services (EMS) call processing and turnout time in the USA and compared the findings to the requirements stated by the NFPA [
13]. They showed that the mean average turnout time for fire scenarios fell well within the current benchmark of 80 s. For about 60% of the fire calls, turnout was completed in the required 80 s or less. About 90% of the turnouts were completed within 123 s. Upson and Notarianni [
12] also found that for nighttime fire calls, the mean average turnout times were above the current NFPA 1710 benchmarks. Only 21% of the nighttime fire call turnouts were completed within the required 80 s.
In a recent study, Pedersen [
38] analyzed the response times for the fire brigades in 4306 incidents between 2011 and 2014 in Bodø and Tromsø, northern Norway, i.e., 2 of the 19 Norwegian fire and emergency alarm centers (FEAC). The response time was observed to be about 1 min longer during night time, i.e., confirming the results obtained by Upson and Notarianni [
12]. Pedersen [
38] did, however, not distinguish between emergencies to special objects and other responses. It may be valuable to investigate the response time for such objects in rural areas, where he concluded that the general response time was considerably longer than in more densely populated areas.
It is well-documented that the response time is longer during night shifts [
12,
38]. The response time may also be longer during harsh weather conditions with slippery roads during winter time. It is also known that fires in wooden heated structures develop faster during winter time. The response time issue can therefore be a challenge, especially in fire scenarios at night time during the winter season. It should be mentioned that the severe L’Isle-Verte nursing home fire, Quebec, Canada, which killed thirty-two people and injured fifteen, started at 00:35 on the night of 23 January 2014 [
4,
17]. The Skinnarberga senior home and care center fire, which killed one and injured five, started at 03:30 on the night of 24 December 2017 as presented in
Section 2.
In Norway, there is currently an ongoing process where municipal fire brigades merge to larger, inter-municipal organizations. This process was initiated by the Directorate of Civil Protection and Emergency Planning in order to make more robust response organizations with better qualified full-time fire chiefs and an increased number of full-time staff. In this process, fire stations may be relocated and the response time to the special objects may become a challenge. Flexibility and new ideas may be needed to comply with a sufficiently fast response time, especially when the fire development is expected to be very fast, e.g., wooden constructions in subzero temperatures.
6. Single-Structure or Multiple-Structure Fire Risk
6.1. Single-Structure Fire Risk
The research could, e.g., involve modelling representative structures of low, medium, and high indoor moisture supply. The values for such groupings may be found in the field of building research, e.g., [
39]. Increased air change rates in windy conditions could also be considered in the models, as well as light, medium, and heavy wood loadings (wall panels, floors, and furniture). In the simplest form, the fuel moisture content in the involved structures could be presented as the probability of flashover as a function of time for a given started fire, as suggested in
Figure 4. For the sake of simplicity, a normal distribution is assumed. One may then consider
Figure 4 as the dry wood contribution to the single wooden structure risk rating.
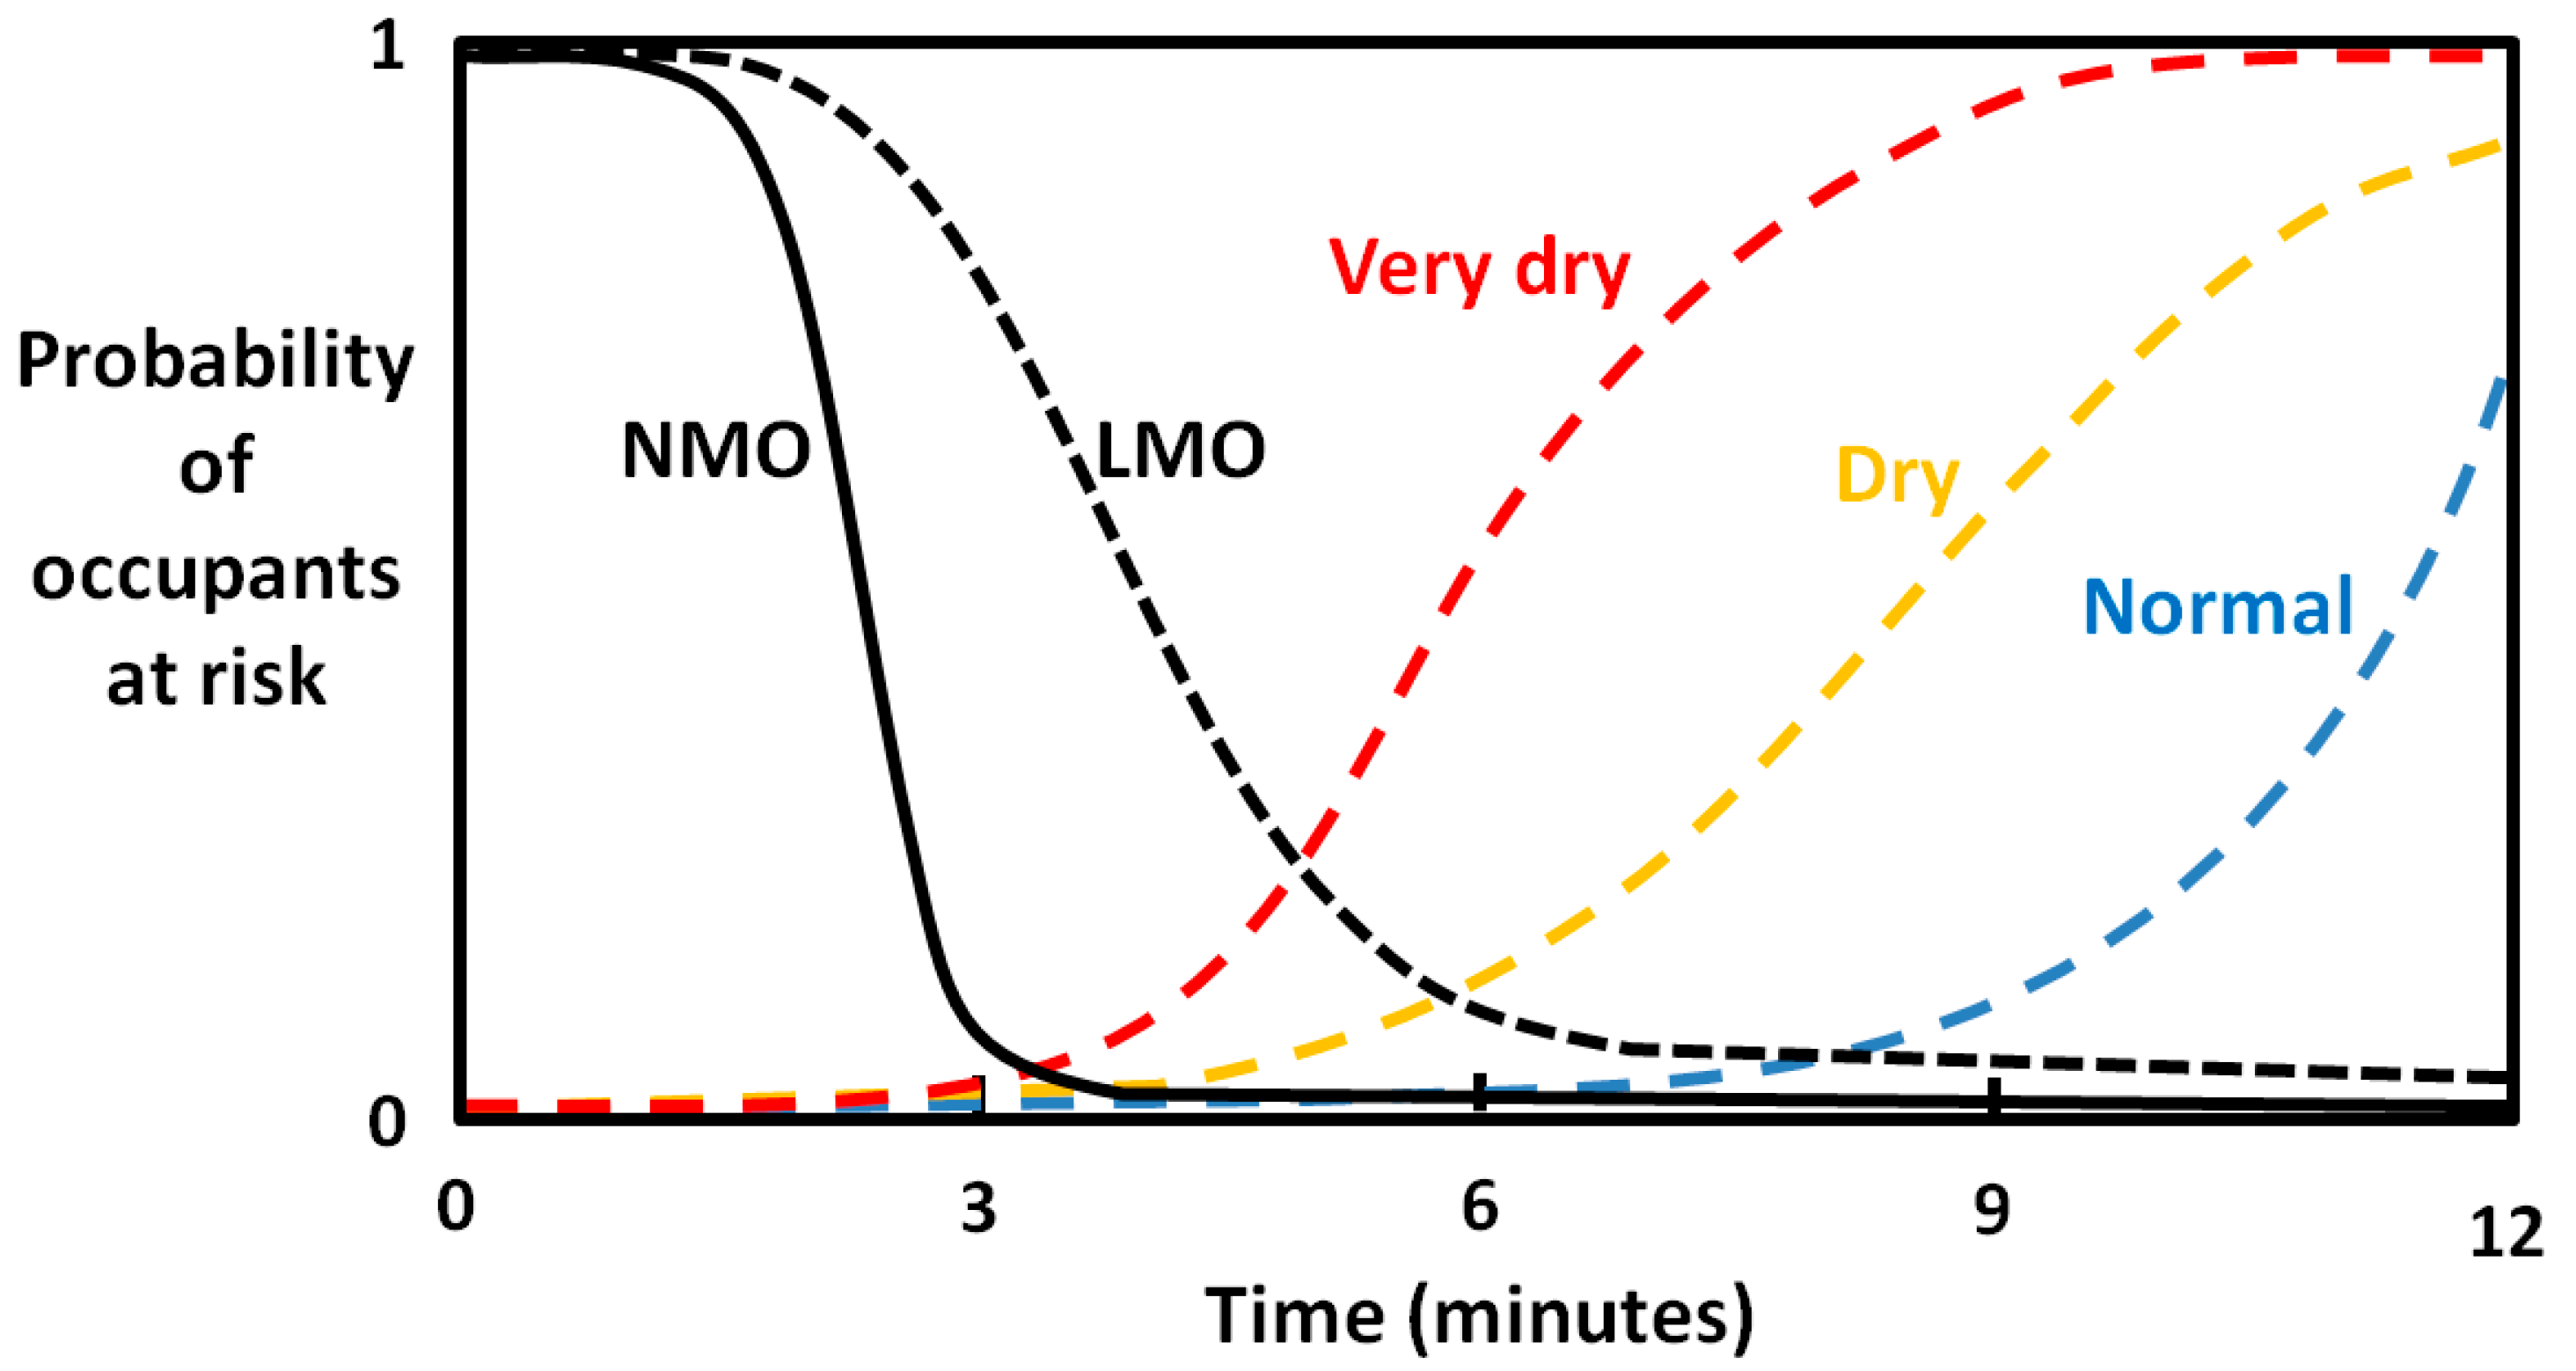
A fire in a single home dried to condition “very dry” may be taken as an example, and for simplicity, flashover may be taken as a non-tenability condition. If the inhabitants have normal mobility and are warned by fast-response smoke detectors, they will generally be able to evacuate their home before untenable conditions. This is indicated in
Figure 5 (solid black line), i.e., the probability of the inhabitants being able to evacuate is high. In the same figure, it is indicated that inhabitants with lower mobility are generally more at risk. It is also seen in
Figure 5 that, especially when the fire develops fast in very dry conditions, these groups of vulnerable people are significantly more at risk.
6.2. Conflagration Risk
In strong winds, there is a high probability for glowing embers and firebrands igniting neighboring structures as well as distant structures. In addition to the drying of indoor wooden products, the conflagration risk is therefore a function of the wind strength, the distance between the structures, the layout of the structures, and the fuel moisture content of the exposed structural parts. There may also be non-wooden combustibles exposed, such as plastic sidings and plastic gutters. The stronger the wind is, the more likely it is that a higher number of glowing embers and firebrands are transported to neighboring structures. The closer the exposed structure is to a burning structure, the higher the probability it will be involved in the fire. The dryer the neighboring structure receiving glowing embers and firebrands is, the higher the probability is that the new structure will become involved in the fire. The dryness of the external parts of a wooden structure is a function of ambient relative humidity, drying time, drying temperature, thickness, etc. The conflagration risk is also dependent on combustibles, such as trees, hedges, sheds, and any other scattered combustibles which may ignite and contribute to the fire spread.
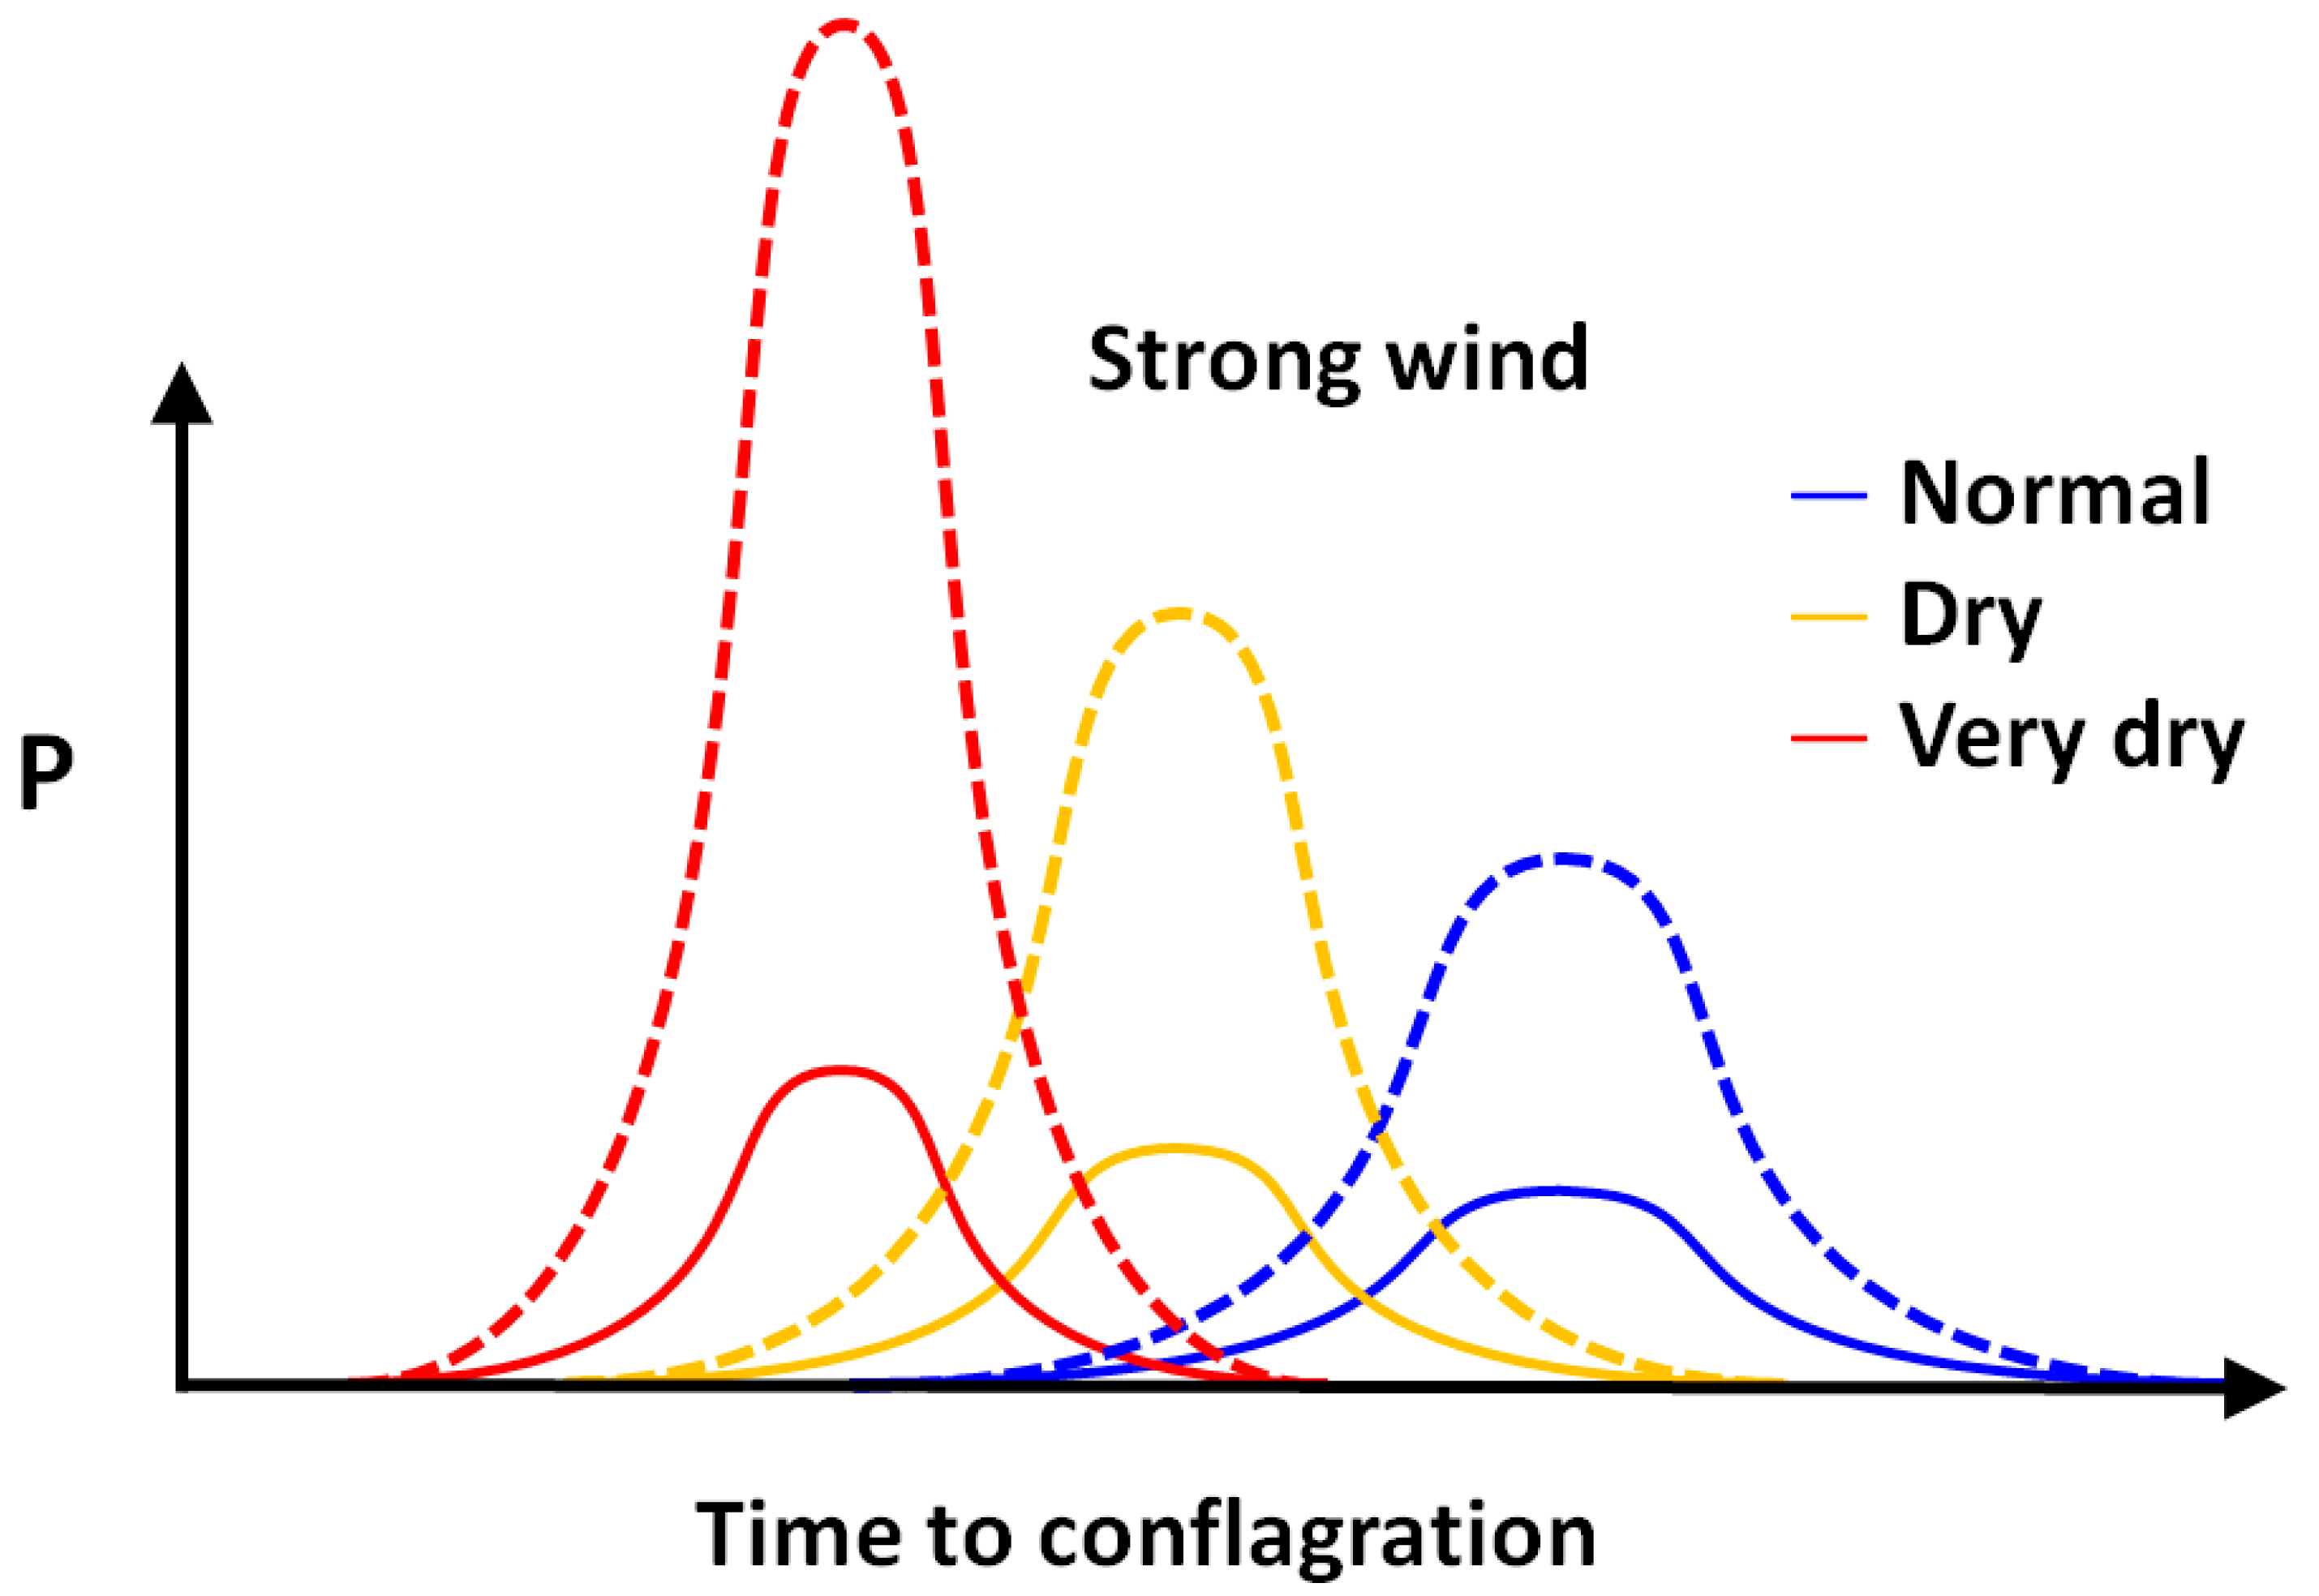
Parameters such as growing hedges, trees, and sheds being built between the main structures do not usually change rapidly. They usually change gradually over several years. Weather conditions (temperature, relative humidity, precipitation, and wind) may, however, change within a few hours. Wind conditions especially add considerably to the predicted conflagration risk, which may take the shape as illustrated in
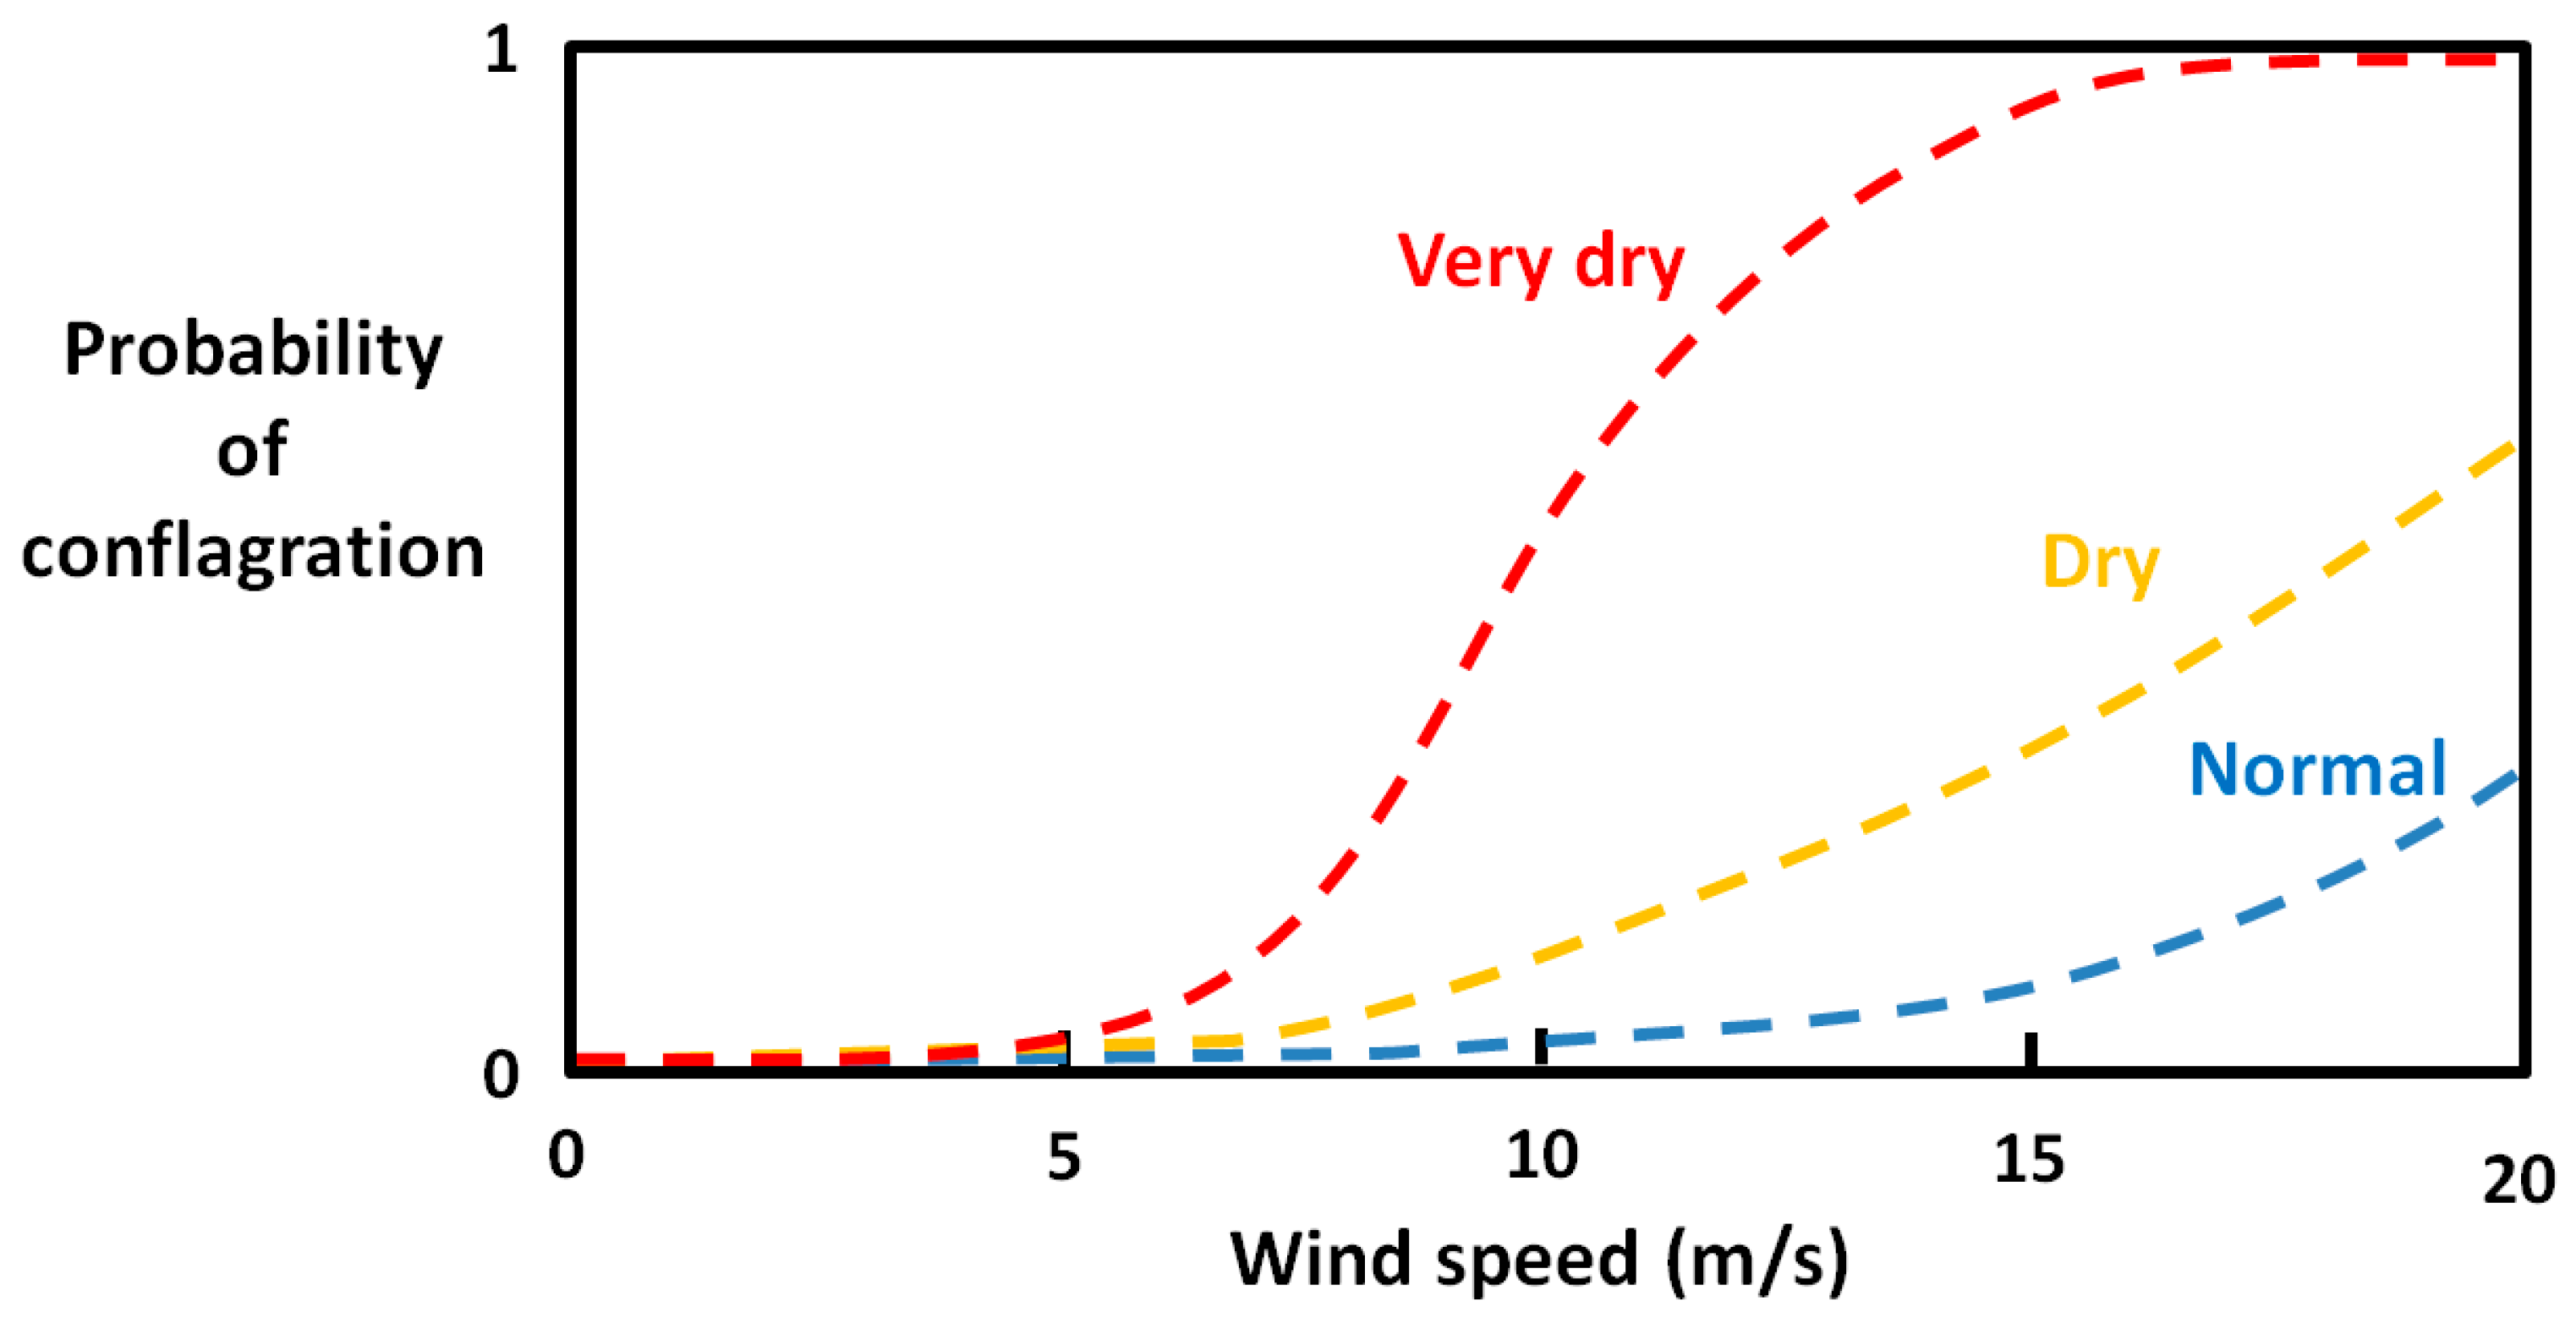
Figure 6. The combination of a fast-developing fire starting in or spreading to structures with many low mobility inhabitants represents a particular challenge in dry winter conditions with strong wind. The probability of conflagration may similarly be illustrated in
Figure 7 as a function of wind strength and dry indoor wood.
These illustrations are sketches only. Research on drying and fire development in windy conditions, including direct flame contact and production and transport of ember and firebrand to neighboring structures, may be needed to obtain more correct sketched proportions. This may also be related to fixed values, such as the size and density of structures. The accuracy may, however, not need to be more refined than three levels of FMC and three levels of wind speed in order to realize very unfortunate combinations of dry structures and strong wind forecasts.
It was considered that the extremely dry conditions leading to the Lærdalsøyri conflagration, in combination with strong winds, was a rare event. However, there has been no attempt to quantify the frequency of this particular combination. A starting point of research may be to analyze historical data on ambient temperature and wind conditions during winter time for, e.g., the last 10-year period. If it turns out that this was indeed a low-frequency event, it may actually be easier to perform compensation measures, e.g., placing fire trucks in high-risk areas or manning unmanned fire stations to reduce the turnout time, when such a situation is forecasted to occur again in the future.
7. Risk Maps
A possible way forward may be to consider developing a qualitative bowtie method as the basis for the risk modelling framework [
40], including threats to the barriers. In a bowtie, the left side represents a fault tree and the right side represents an event tree. Probabilities and outcomes could to some extent be quantitative when such data is available. The left-hand side would include parameters influencing the ignition probability. Ignition of a self-sustained fire could be identified as the top (critical) event. The right-hand side would represent the consequences given a self-sustained ignition. Previous, current, and forecasted weather conditions could then be implemented in the model and exert influence on both the left and the right side of the bowtie.
It would probably be best to develop one bowtie model for the individual structure fire risk and another for the conflagration risk. In the conflagration risk bowtie, ignition of a neighboring structure could be considered as the top (critical) event. In this bowtie, separation between the structures and wind strength would play an important role together with the dryness of the involved wood. These parameters would influence the left side regarding whether the top (critical) event would be reached, as well as the right side of this bowtie regarding potential fire spread to even more downwind constructions.
Lehna et al. [
41] used geographic information systems to create a cartographic risk model predicting areas of increased probability for home fire in Louisville, USA. Such risk maps may be further developed to include dynamic changes in fire risk related to cold climate and drying of wooden structures, with color identification of high-risk objects and high-risk areas. Dry winter weather would then result in structures reaching a higher risk rating (color) compared to the normal (average) conditions. Cold dry weather and strong wind should result in densely built wooden areas reaching a very-high-risk rating.
Based on such visual risk maps, the fire brigades may realize that for a number of days in the future, important single objects will not be within reach before a fire most likely has developed beyond control. The same may hold for fire spread in densely built wooden communities, i.e., conflagration scenarios. Becoming aware of such challenges may trigger a search for compensation measures, e.g., campaigns for preventing ignition, relocating fire trucks to reduce time to water-on-fire for high-risk objects and high-risk areas, and manning unmanned fire stations.
8. Discussion
It was considered that the very dry conditions leading to the Lærdalsøyri conflagration, in combination with strong winds, was a rare event. The frequency of this particular combination has, however, not been investigated based on historical recordings of ambient temperature and wind conditions during winter time for e.g., a 10-year period. If it turns out that this was indeed a low frequency event, it may actually be easier to apply compensation measures should such a situation occur in the future.
There is certainly a need for better understanding of the fire risk related to very dry indoor conditions in cold climates [
4,
10,
17]. The current concept paper tries to outline possible steps towards a structural fire danger rating system. Mostly, the structures are already in place, and therefore represent a given premise for community management and firefighter response. The current study therefore focuses on identifying and predicting the fire danger for the given structures in the near future. In doing so, the predicted drying of the structures and the interior must be modelled. Then, any low-humidity periods resulting in dry structures combined with windy conditions must be identified and presented in a way easily comprehensible by fire brigade managers and firefighters.
Information from other fields, e.g., building physics and indoor air quality, may reveal interesting approaches and simplifications [
29,
30,
31,
32,
33]. Modelling typical air change rates, moisture supply, and the indoor wood Fuel Moisture Content (FMC) may therefore be possible.
It is not easy to define a necessary level of accuracy needed to help predict indoor relative humidity and wood fuel moisture content. However, if measurement equipment is placed in a selected number of homes or other structures, the resulting indoor relative humidity levels are known. Modelled indoor relative humidity based on local outdoor sensors and professional weather stations could then be evaluated against the recorded values. Tuning the modelling techniques would increase the modelling accuracy. In the long run, the sensors may not be needed as the research may show that predictions based on weather forecasts may hopefully provide sufficient accuracy.
The authors want to point towards a very interesting study on the repeatability of real-scale fire tests done by Melcher et al. [
42]. It shows that even in carefully planned, full-scale, two-room fire experiments, with heptane or wood cribs fuel, large variations were observed in mass loss rate, temperature, the smoke layer height, CO
2 and CO levels, etc. Given that the structures are very different, furniture density and moisture supply from indoor activities varies. A coarse grouping of structures in low-, medium-, and high-moisture supply environments may help to solve the issues of numerous combinations of structures, moisture supply, air change rates, furniture loads, etc. Additionally, a few levels of risk rating may be sufficient, e.g., low, medium, and high structural fire risk.
In a study regarding the likelihood of wildfires, Mhawej et al. [
43] listed 28 factors categorized as climatic, topographic, in situ, historical, and anthropogenic. The present study is more confined, since it considers structural wooden structures in very dry condition fires compared to normal conditions. This allows us to focus on the most important issues, i.e., focus on drying for individual structures and drying and wind conditions for conflagrations.
The most severe obstacle along the way forward may be the hysteresis involved in water sorption in wood [
10,
21]. The authors do, however, believe that it is possible at least to develop a preliminary cold climate structural fire danger rating system. Additionally, along the way, the accuracy could be increased as the knowledge of this research field is increasing.
Since it is not possible to predict the outcomes of future research, there may be obstacles that remain unknown at the moment. The authors do, however, believe that the development of an automated cold climate fire rating system based on weather forecast is possible. It may certainly be very helpful for limiting the negative health impacts of such fires. Developing representative bowties and dynamic risk maps may be very beneficial.
9. Conclusions
Based on recording temperature and relative humidity outside and inside a limited number of structures, as well as a comparison with predictions (weather forecasts) and meteorological observations, we find that valuable knowledge may be gained for modelling drying processes. Controlled climate chamber drying tests of potential indoor fire fuel may give valuable information regarding fuel moisture modelling. Mathematical models for indoor relative humidity and wood drying based on weather forecasts and/or meteorological recordings may then be tuned to achieve sufficient accuracy. Imaginary structures with representative users and furniture may be used for modelling a representative fire risk rating. Rating levels, such as normal, high, and extremely high may be sufficient for risk evaluations where wind conditions and distance to neighboring structures are also included for estimating conflagration risk.
Moisture hysteresis in wood sorption processes may be a challenge. However, as far as the authors are concerned, the involved challenges may probably be overcome. The authors believe that it is possible at least to develop a preliminary cold climate structural fire danger rating system including illustrative bowties and risk maps.


