Life Cycle Assessment of a Virtual Reality Device
Abstract
:1. Introduction
1.1. Review of Prior Knowledge Observations
1.2. Objectives
2. Materials and Methods—Screening Life Cycle Assessment Using Single Weighted Scores
2.1. Methodology
2.2. Description of the VR Device Product and Life Cycle
2.2.1. Functional Unit
2.2.2 System Boundaries
Pre-Final Assembly—Raw Material Acquisition, Part Production, and Final Assembly
Final Assembly (FA)
Distribution
Use
End-of-Life Treatment (EoLT)
3. Results
4. Discussion
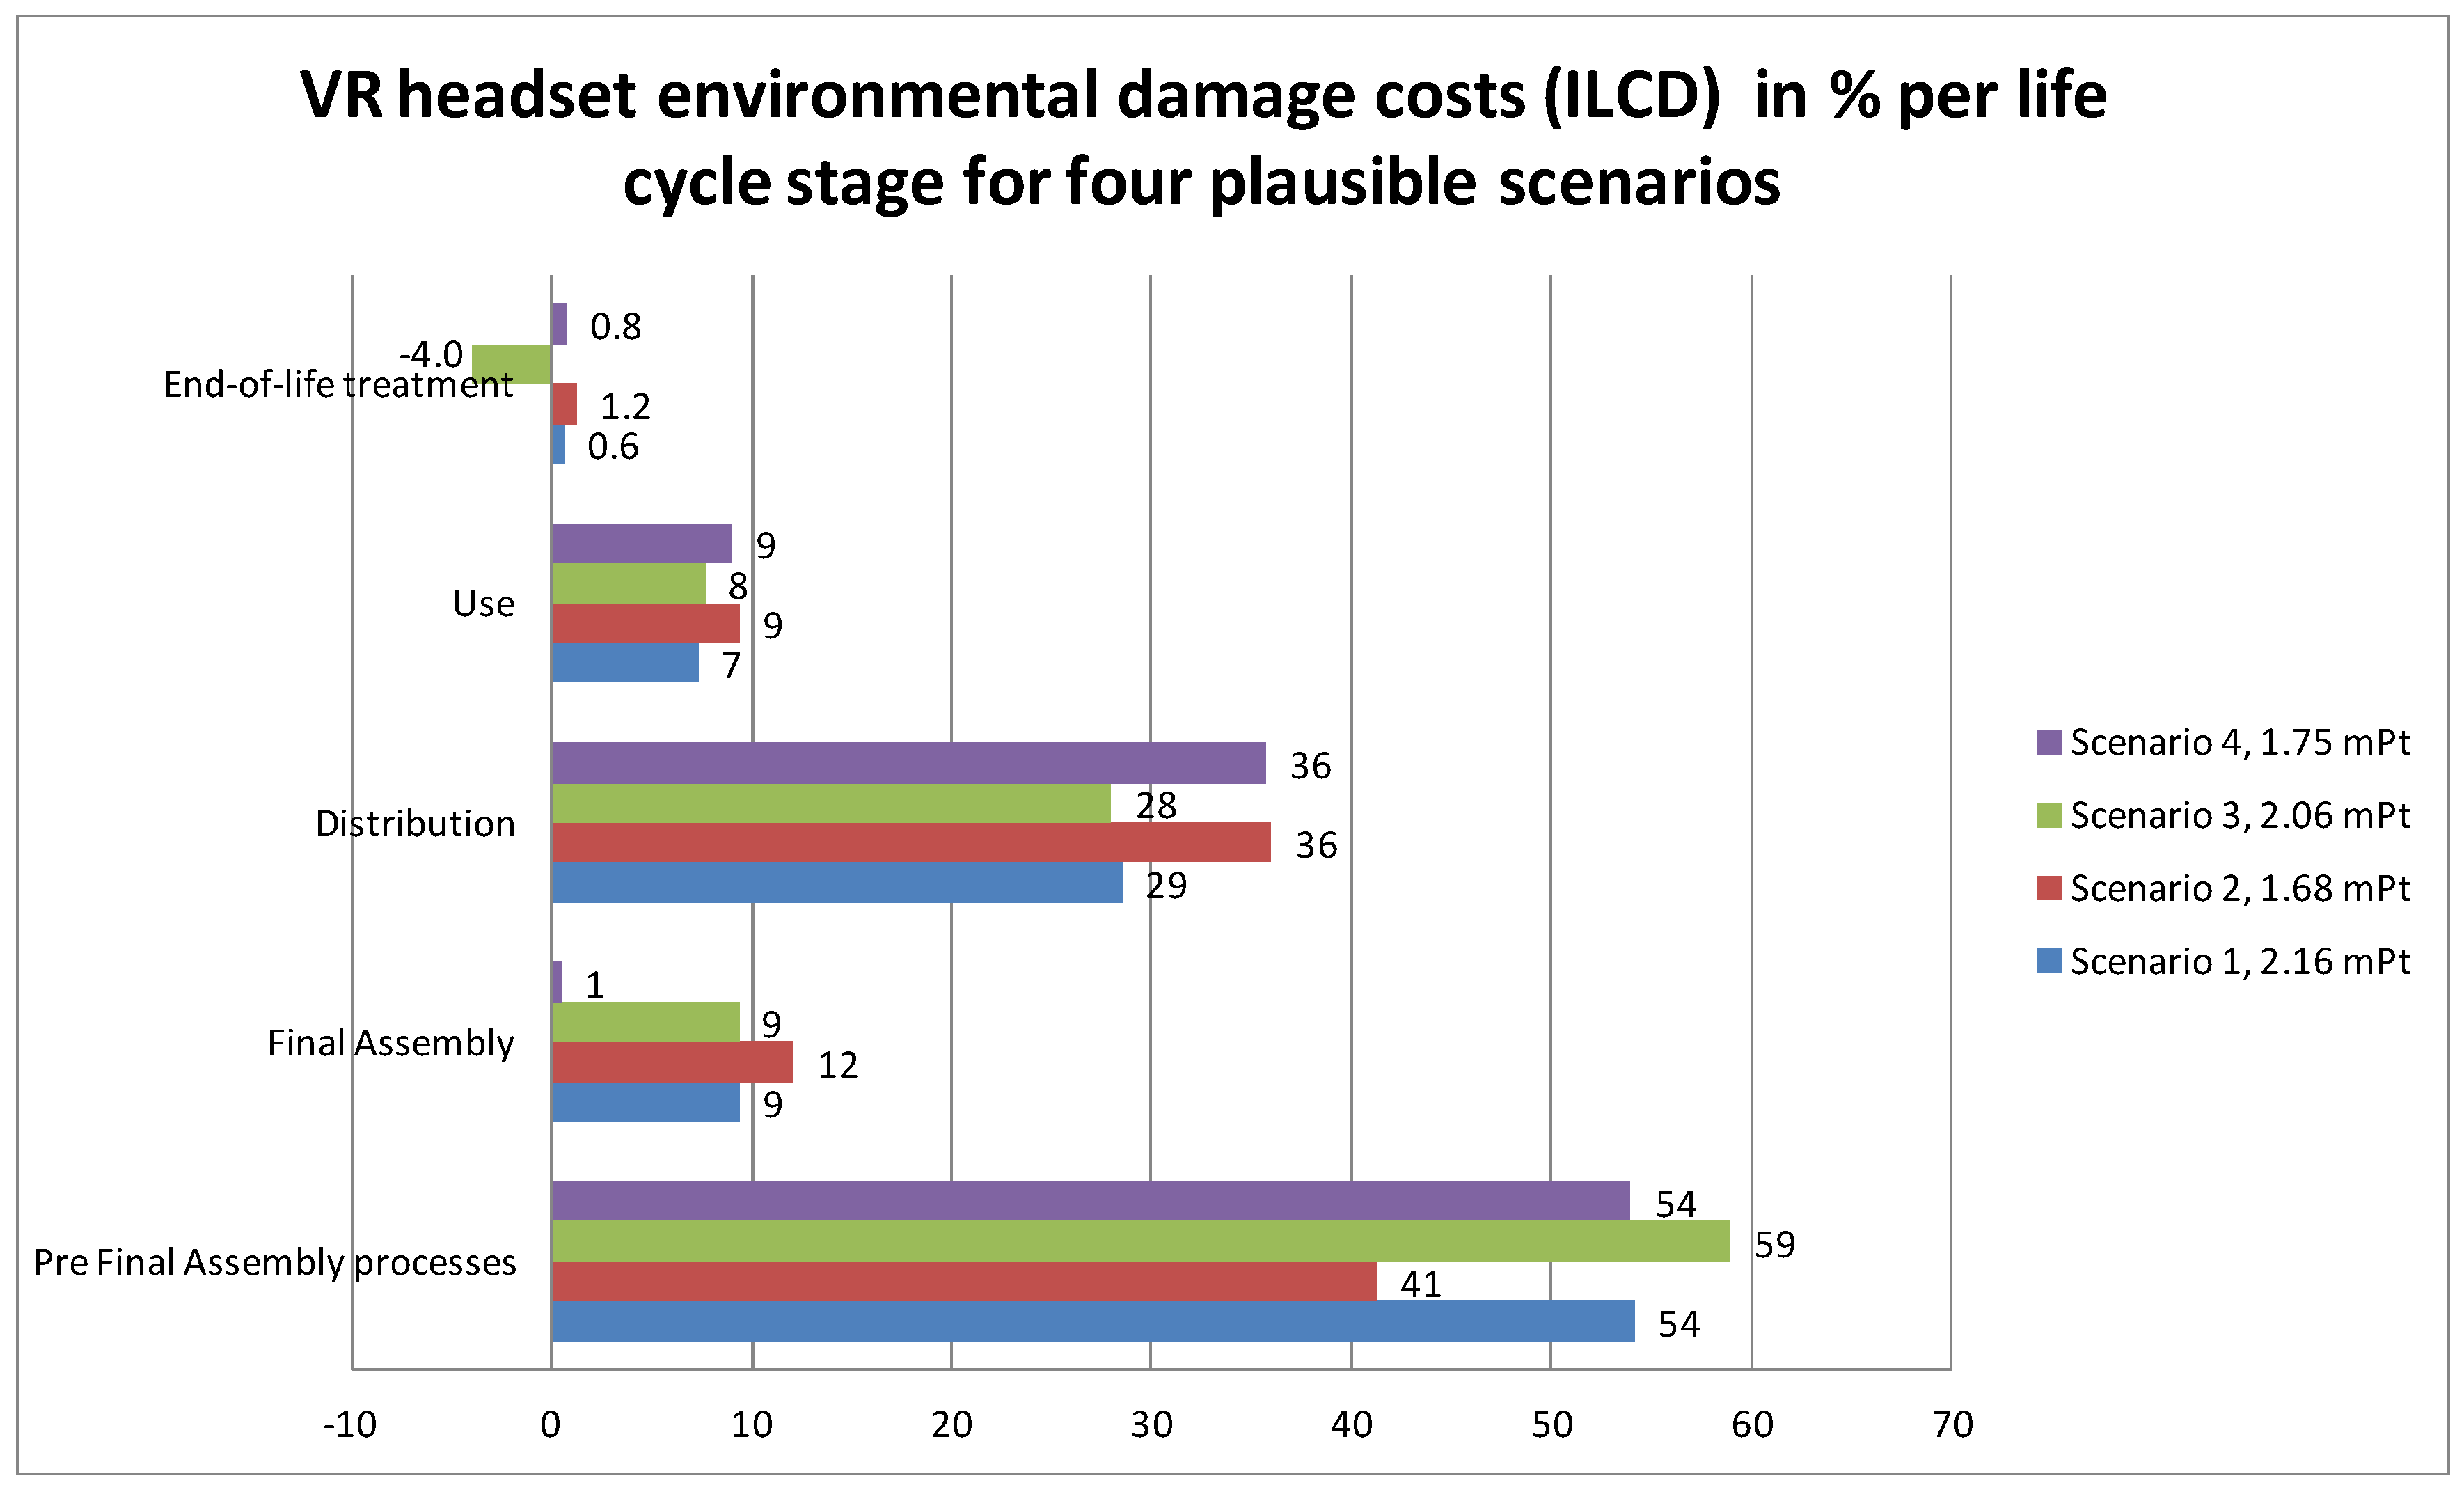
4.1. ILCD Evaluations
4.2. Applying the Weighting Methods EPS2015 and LIME2 as a Sensitivity Check of ILCD
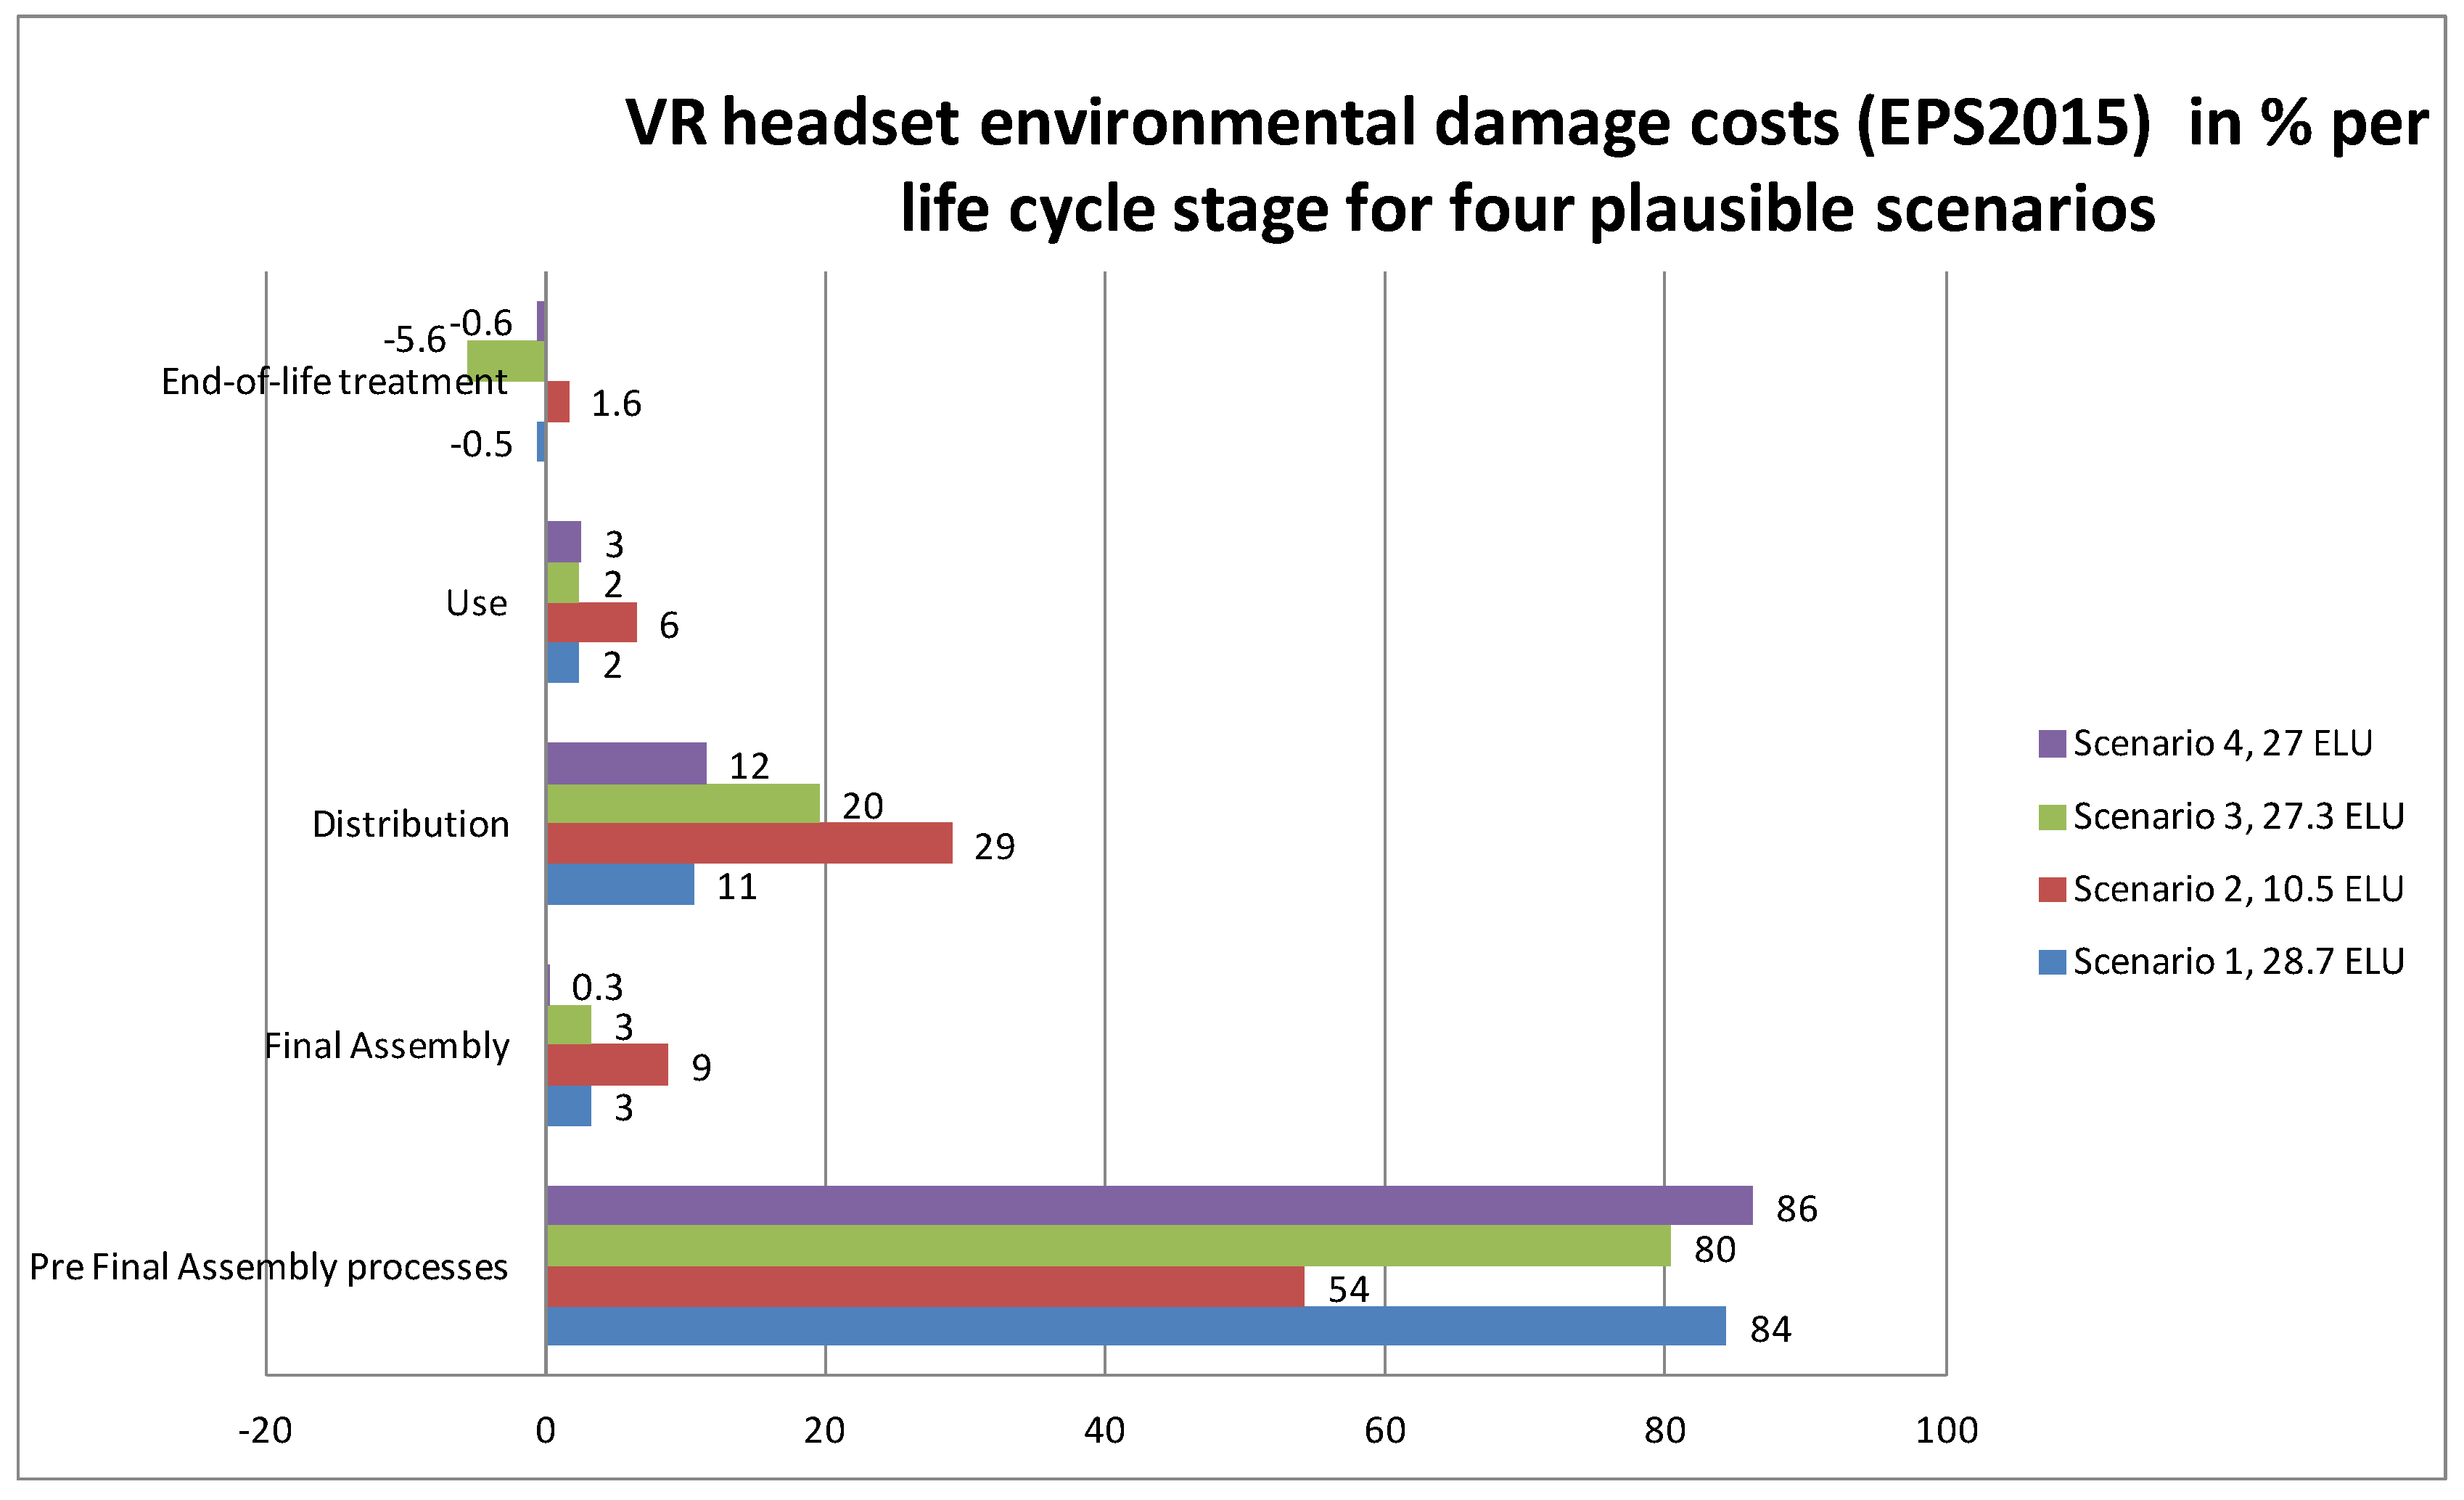
4.3. EPS2015 Evaluations
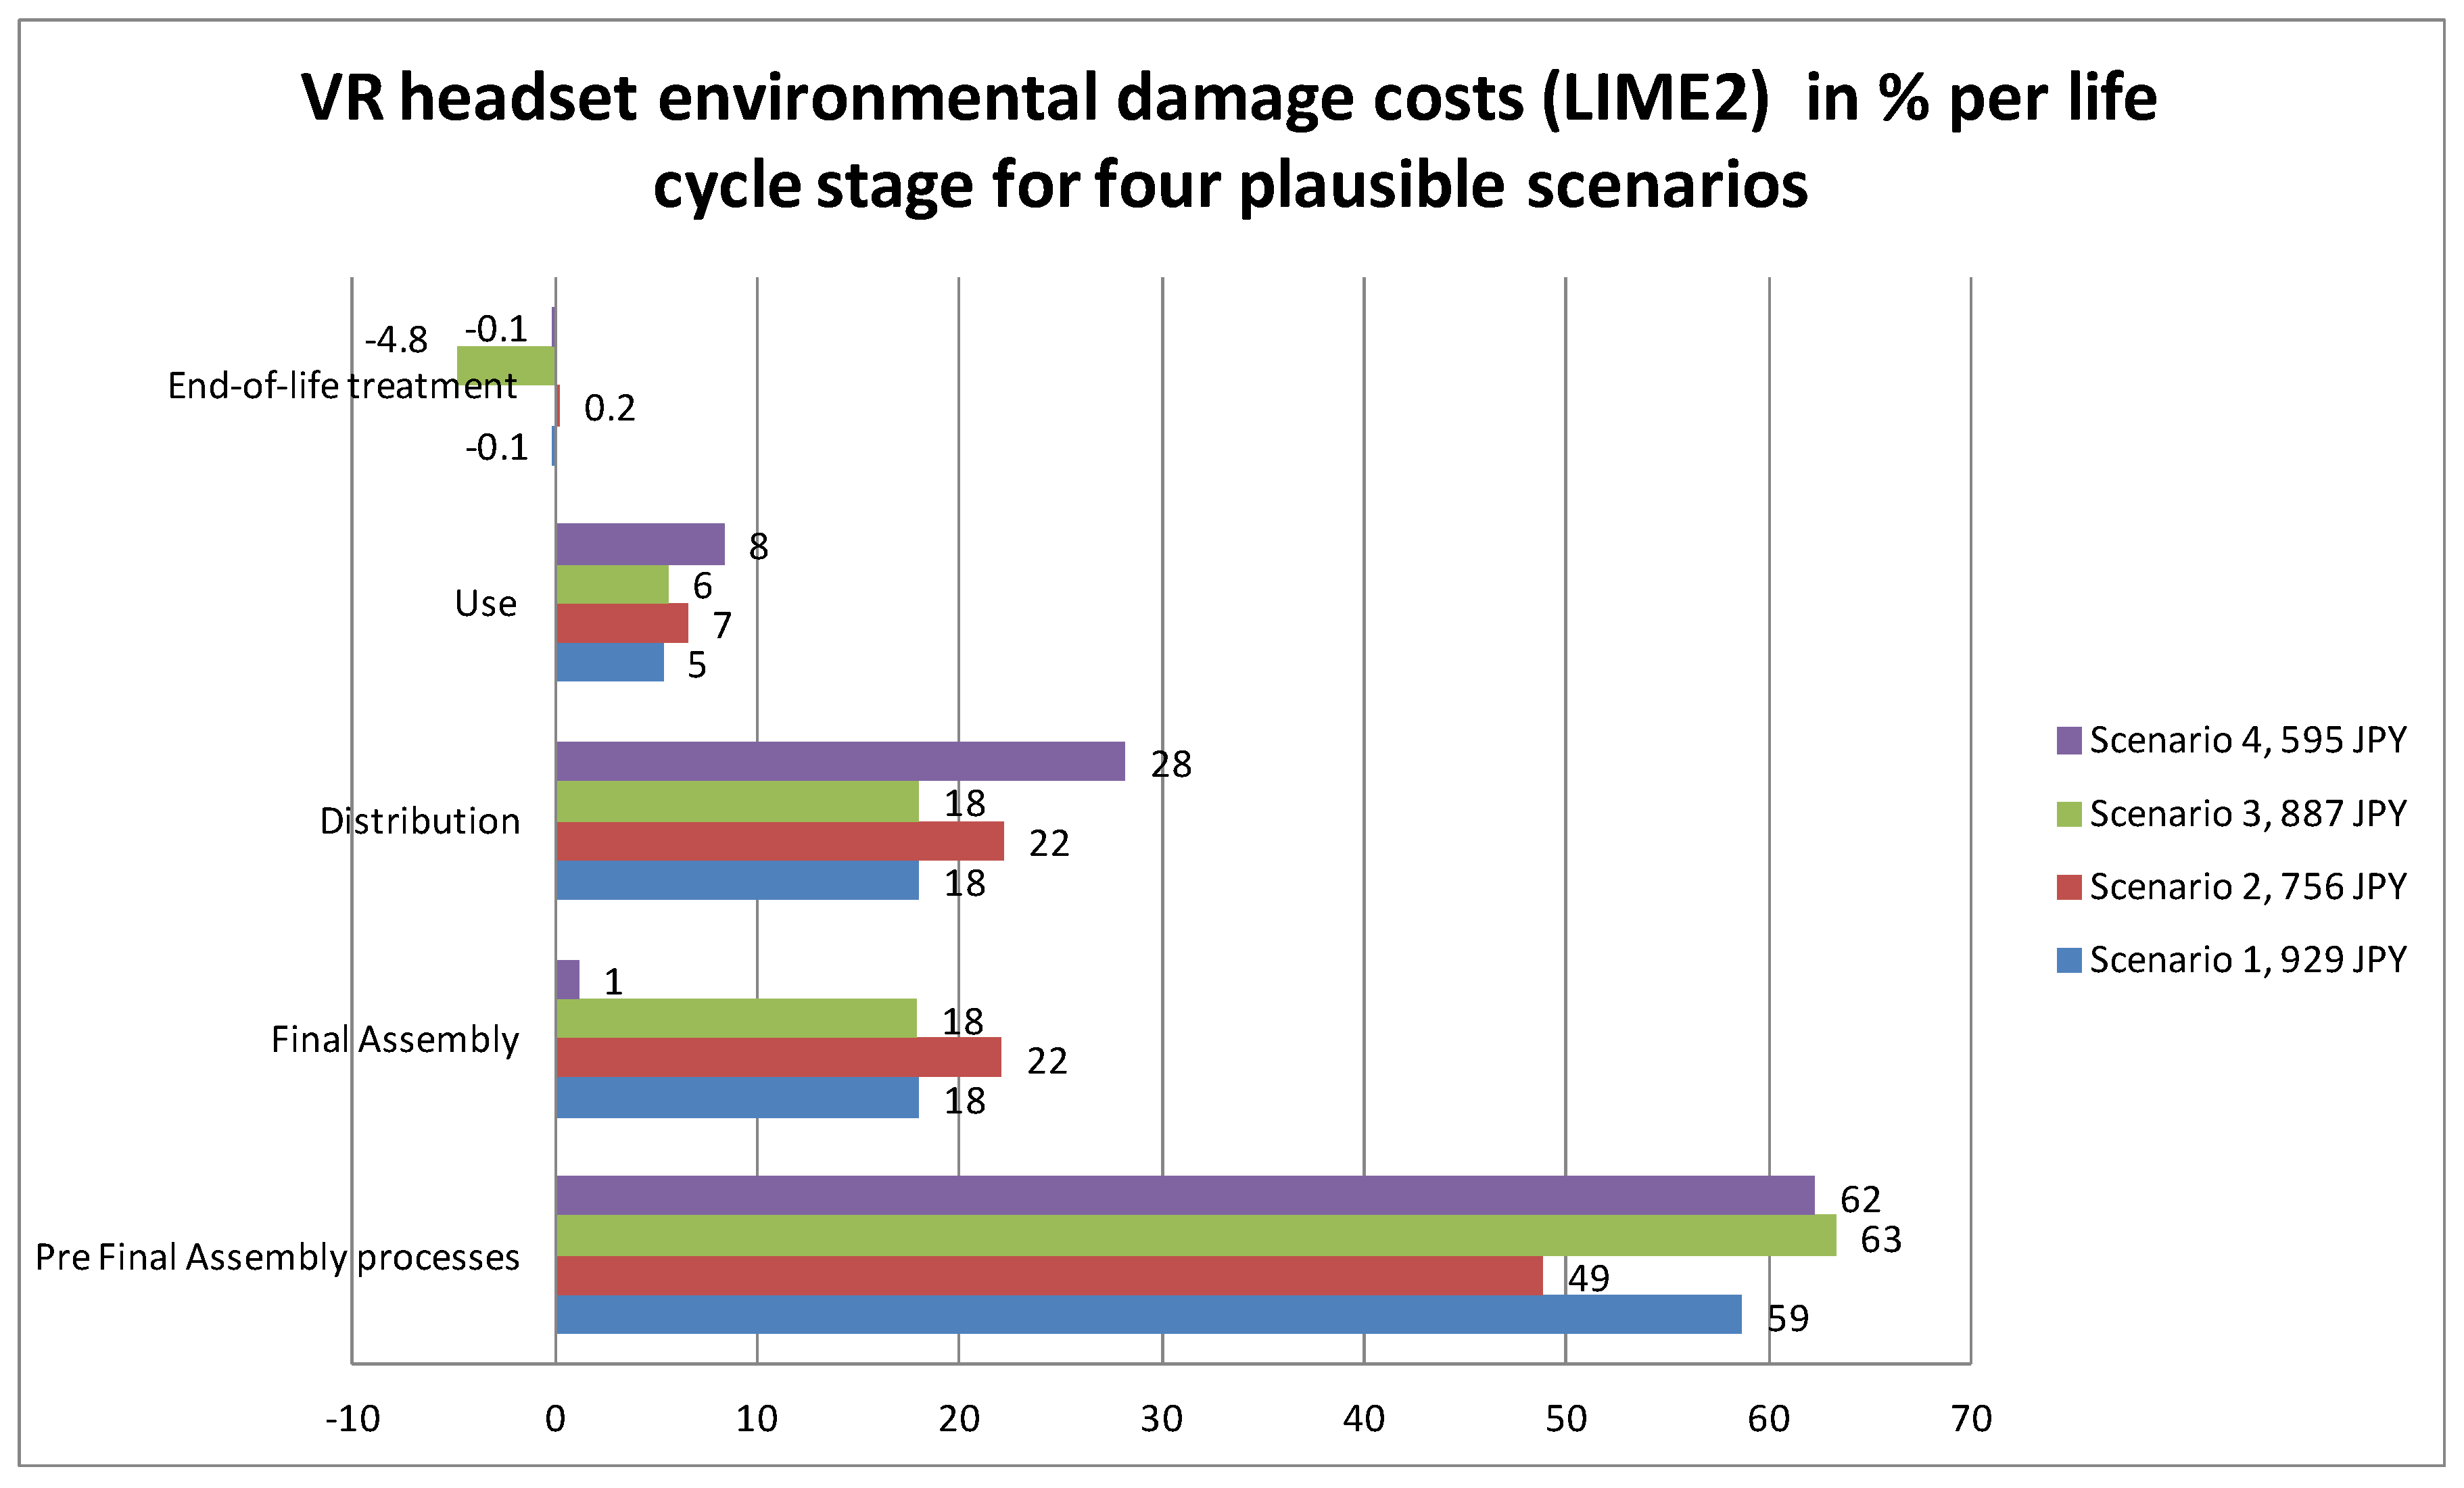
4.4. LIME2 Evaluations
5. Conclusions
6. Next Steps
Acknowledgments
Conflicts of Interest
References
- Andrae, A.S.G.; Edler, T. On electricity usage of communication technology: Trends to 2030. Challenges 2015, 6, 117–157. [Google Scholar] [CrossRef]
- World Input-Output Database. World Input-Output Tables for 2014. Available online: http://www.wiod.org/protected3/data16/wiot_ROW/WIOT2014_Nov16_ROW.xlsb (accessed on 17 May 2017).
- Wood, R.; Stadler, K.; Bulavskaya, T.; Lutter, S.; Giljum, S.; de Koning, A.; Kuenen, J.; Schütz, H.; Acosta-Fernández, J.; Usubiaga, A.; et al. Global sustainability accounting—Developing EXIOBASE for multi-regional footprint analysis. Sustainability 2014, 7, 138–163. [Google Scholar] [CrossRef]
- Pascual-González, J.; Guillén-Gosálbez, G.; Mateo-Sanz, J.M.; Jiménez-Esteller, L. Statistical analysis of global environmental impact patterns using a world multi-regional input-output database. J. Clean. Prod. 2015, 90, 360–369. [Google Scholar] [CrossRef]
- Subramanian, K.; Yung, W.K.C. Review of life cycle assessment on consumer electronic products: Developments and the way ahead. Crit. Rev. Environ. Sci. Technol. 2016, 46, 1441–1497. [Google Scholar] [CrossRef]
- Andrae, A.S.G.; Andersen, O. Life cycle assessments of consumer electronics—Are they consistent? Int. J. Life Cycle Assess. 2010, 15, 827–836. [Google Scholar] [CrossRef]
- Andrae, A.S.G. A review of methodological approaches for life cycle assessment (LCA) of consumer electronics. IEEE Consum. Electron. Mag. 2016, 5, 51–60. [Google Scholar] [CrossRef]
- Itsubo, N.; Inaba, A. A new LCIA method: LIME has been completed. Int. J. Life Cycle Assess. 2003, 8, 305. [Google Scholar] [CrossRef]
- Itsubo, N.; Sakagami, M.; Washida, T.; Kokubu, K.; Inaba, A. Weighting across safeguard subjects for LCIA through the application of conjoint analysis. Int. J. Life Cycle Assess. 2004, 9, 196–205. [Google Scholar] [CrossRef]
- Steen, B. Calculation of monetary values of environmental impacts from emissions and resource use—The case of using the EPS 2015d impact assessment method. J. Sustain. Dev. 2016, 9, 15–33. [Google Scholar] [CrossRef]
- Itsubo, N.; Murakami, K.; Kuriyama, K.; Yoshida, K.; Tokimatsu, K.; Inaba, A. Development of weighting factors for G20 countries—Explore the difference in environmental awareness between developed and emerging countries. Int. J. Life Cycle Assess. 2015. Available online: https://link.springer.com/content/pdf/10.1007%2Fs11367-015-0881-z.pdf (accessed on 17 May 2017). [CrossRef]
- European Commission. Product Environmental Footprint Pilot Guidance—Guidance for the Development of Product Environmental Footprint Category Rules (PEFCRs). Available online: http://ec.europa.eu/environment/eussd/smgp/pdf/Guidance_products.pdf (accessed on 23 May 2017).
- Taheri, S.M.; Matsushita, K.; Sasaki, M. Virtual reality driving simulation for measuring driver behavior and characteristics. J. Transport. Technol. 2017, 7, 123–132. [Google Scholar] [CrossRef]
- European Commission-Joint Research Centre. Recommendations Based on Existing Environmental Impact Assessment Models and Factors for Life Cycle Assessment in European Context. Available online: eplca.jrc.ec.europa.eu/uploads/ILCD-Recommendation-of-methods-for-LCIA-def.pdf (accessed on 17 May 2017).
- Andrae, A.S.G.; Vaija, M.S. To which degree does sector specific standardization make life cycle assessments comparable?—The case of global warming potential of smartphones. Challenges 2014, 5, 409–429. [Google Scholar] [CrossRef]
- Andrae, A.S.G.; Vaija, M.S. Life cycle assessments of an optical network terminal and a tablet: Experiences of the product environmental footprint methodology. In Advances in Environmental Research; Daniels, J.A., Ed.; Nova Science Publishers: Hauppauge, NY, USA, 2017; Volume 55, pp. 31–46. [Google Scholar]
- Steen, B. A systematic approach to environmental priority strategies in product development (EPS). In Version 2000—General System Characteristics Report 1999:4; Swedish Life Cycle Center: Gothenburg, Sweden, 1999; Available online: http://lifecyclecenter.se/publications/ (accessed on 4 July 2017).
- Steen, B. A systematic approach to environmental priority strategies in product development (EPS). In Version 2000—Models and Data of the Default Method Report 1999:5; Swedish Life Cycle Center: Gothenburg, Sweden, 1999; Available online: http://lifecyclecenter.se/publications/ (accessed on 4 July 2017).
- Webb, A.; Mayers, K.; France, C.; Koomey, J. Estimating the energy use of high definition games consoles. Energy Policy 2013, 61, 1412–1421. [Google Scholar] [CrossRef]
- Allacker, K.; Mathieux, F.; Pennington, D.; Pant, R. The search for an appropriate end-of-life formula for the purpose of the European Commission Environmental Footprint initiative. Int. J. Life Cycle Assess. 2017. [Google Scholar] [CrossRef]
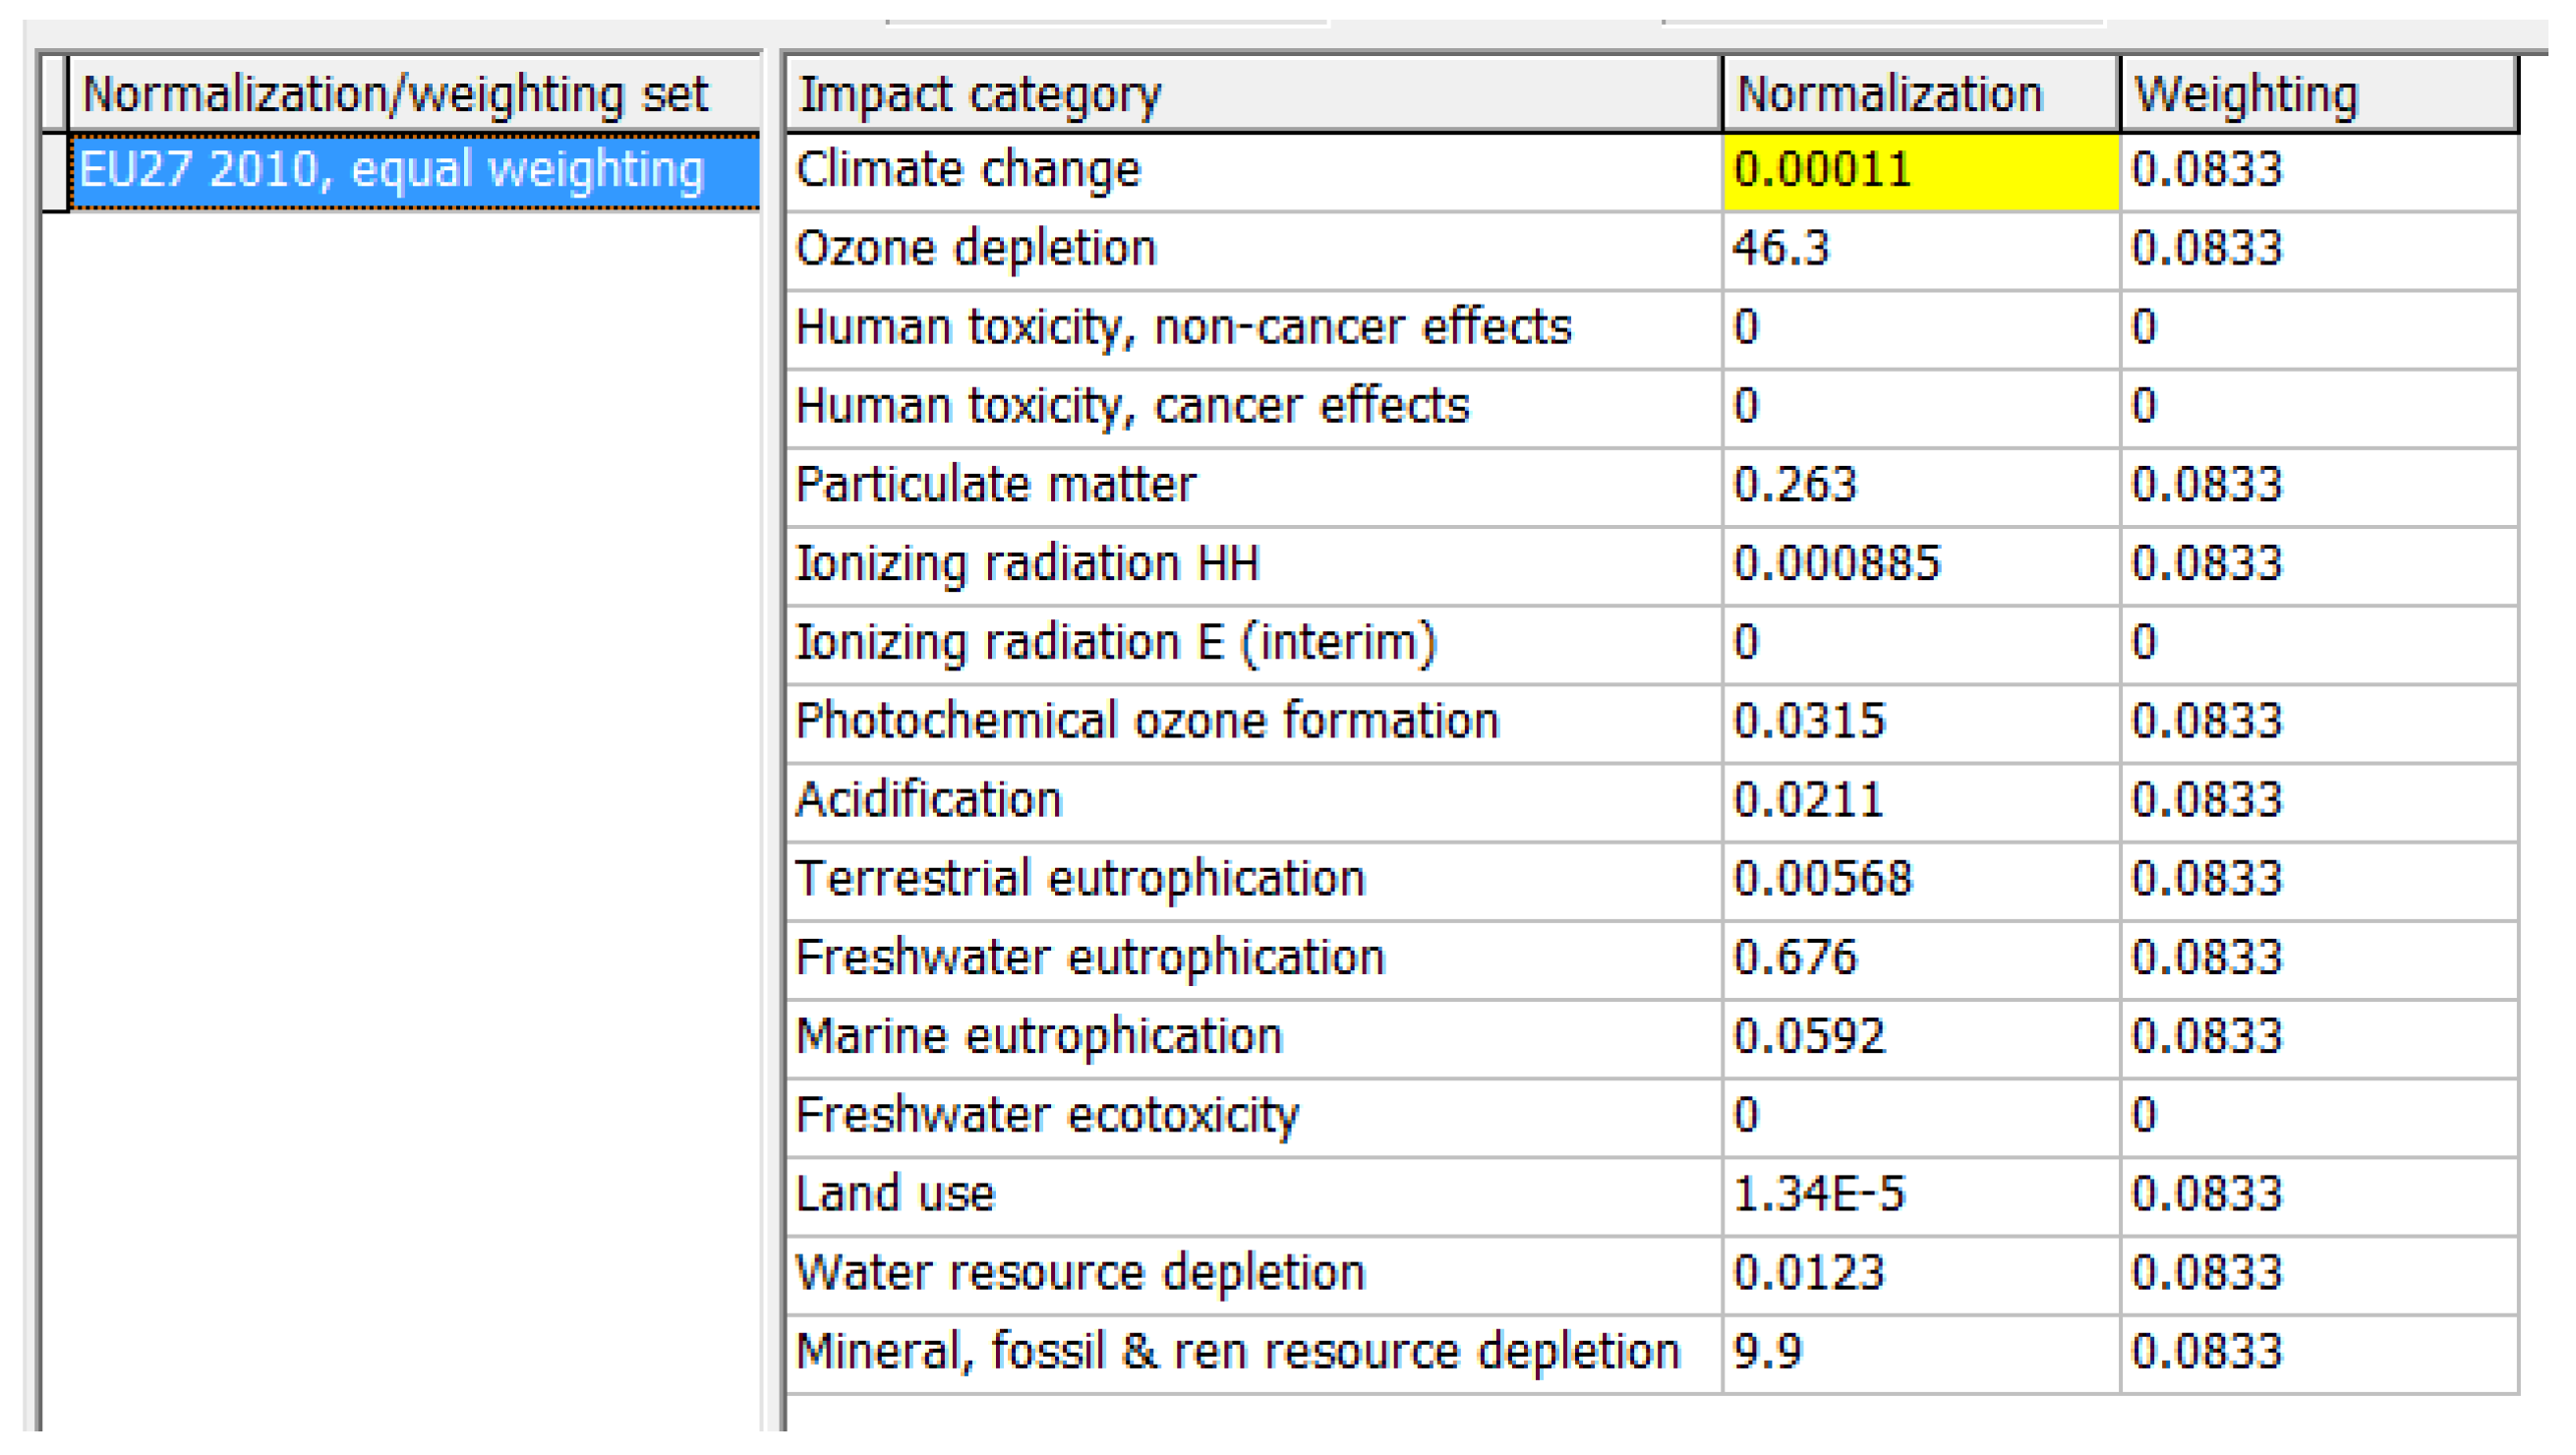
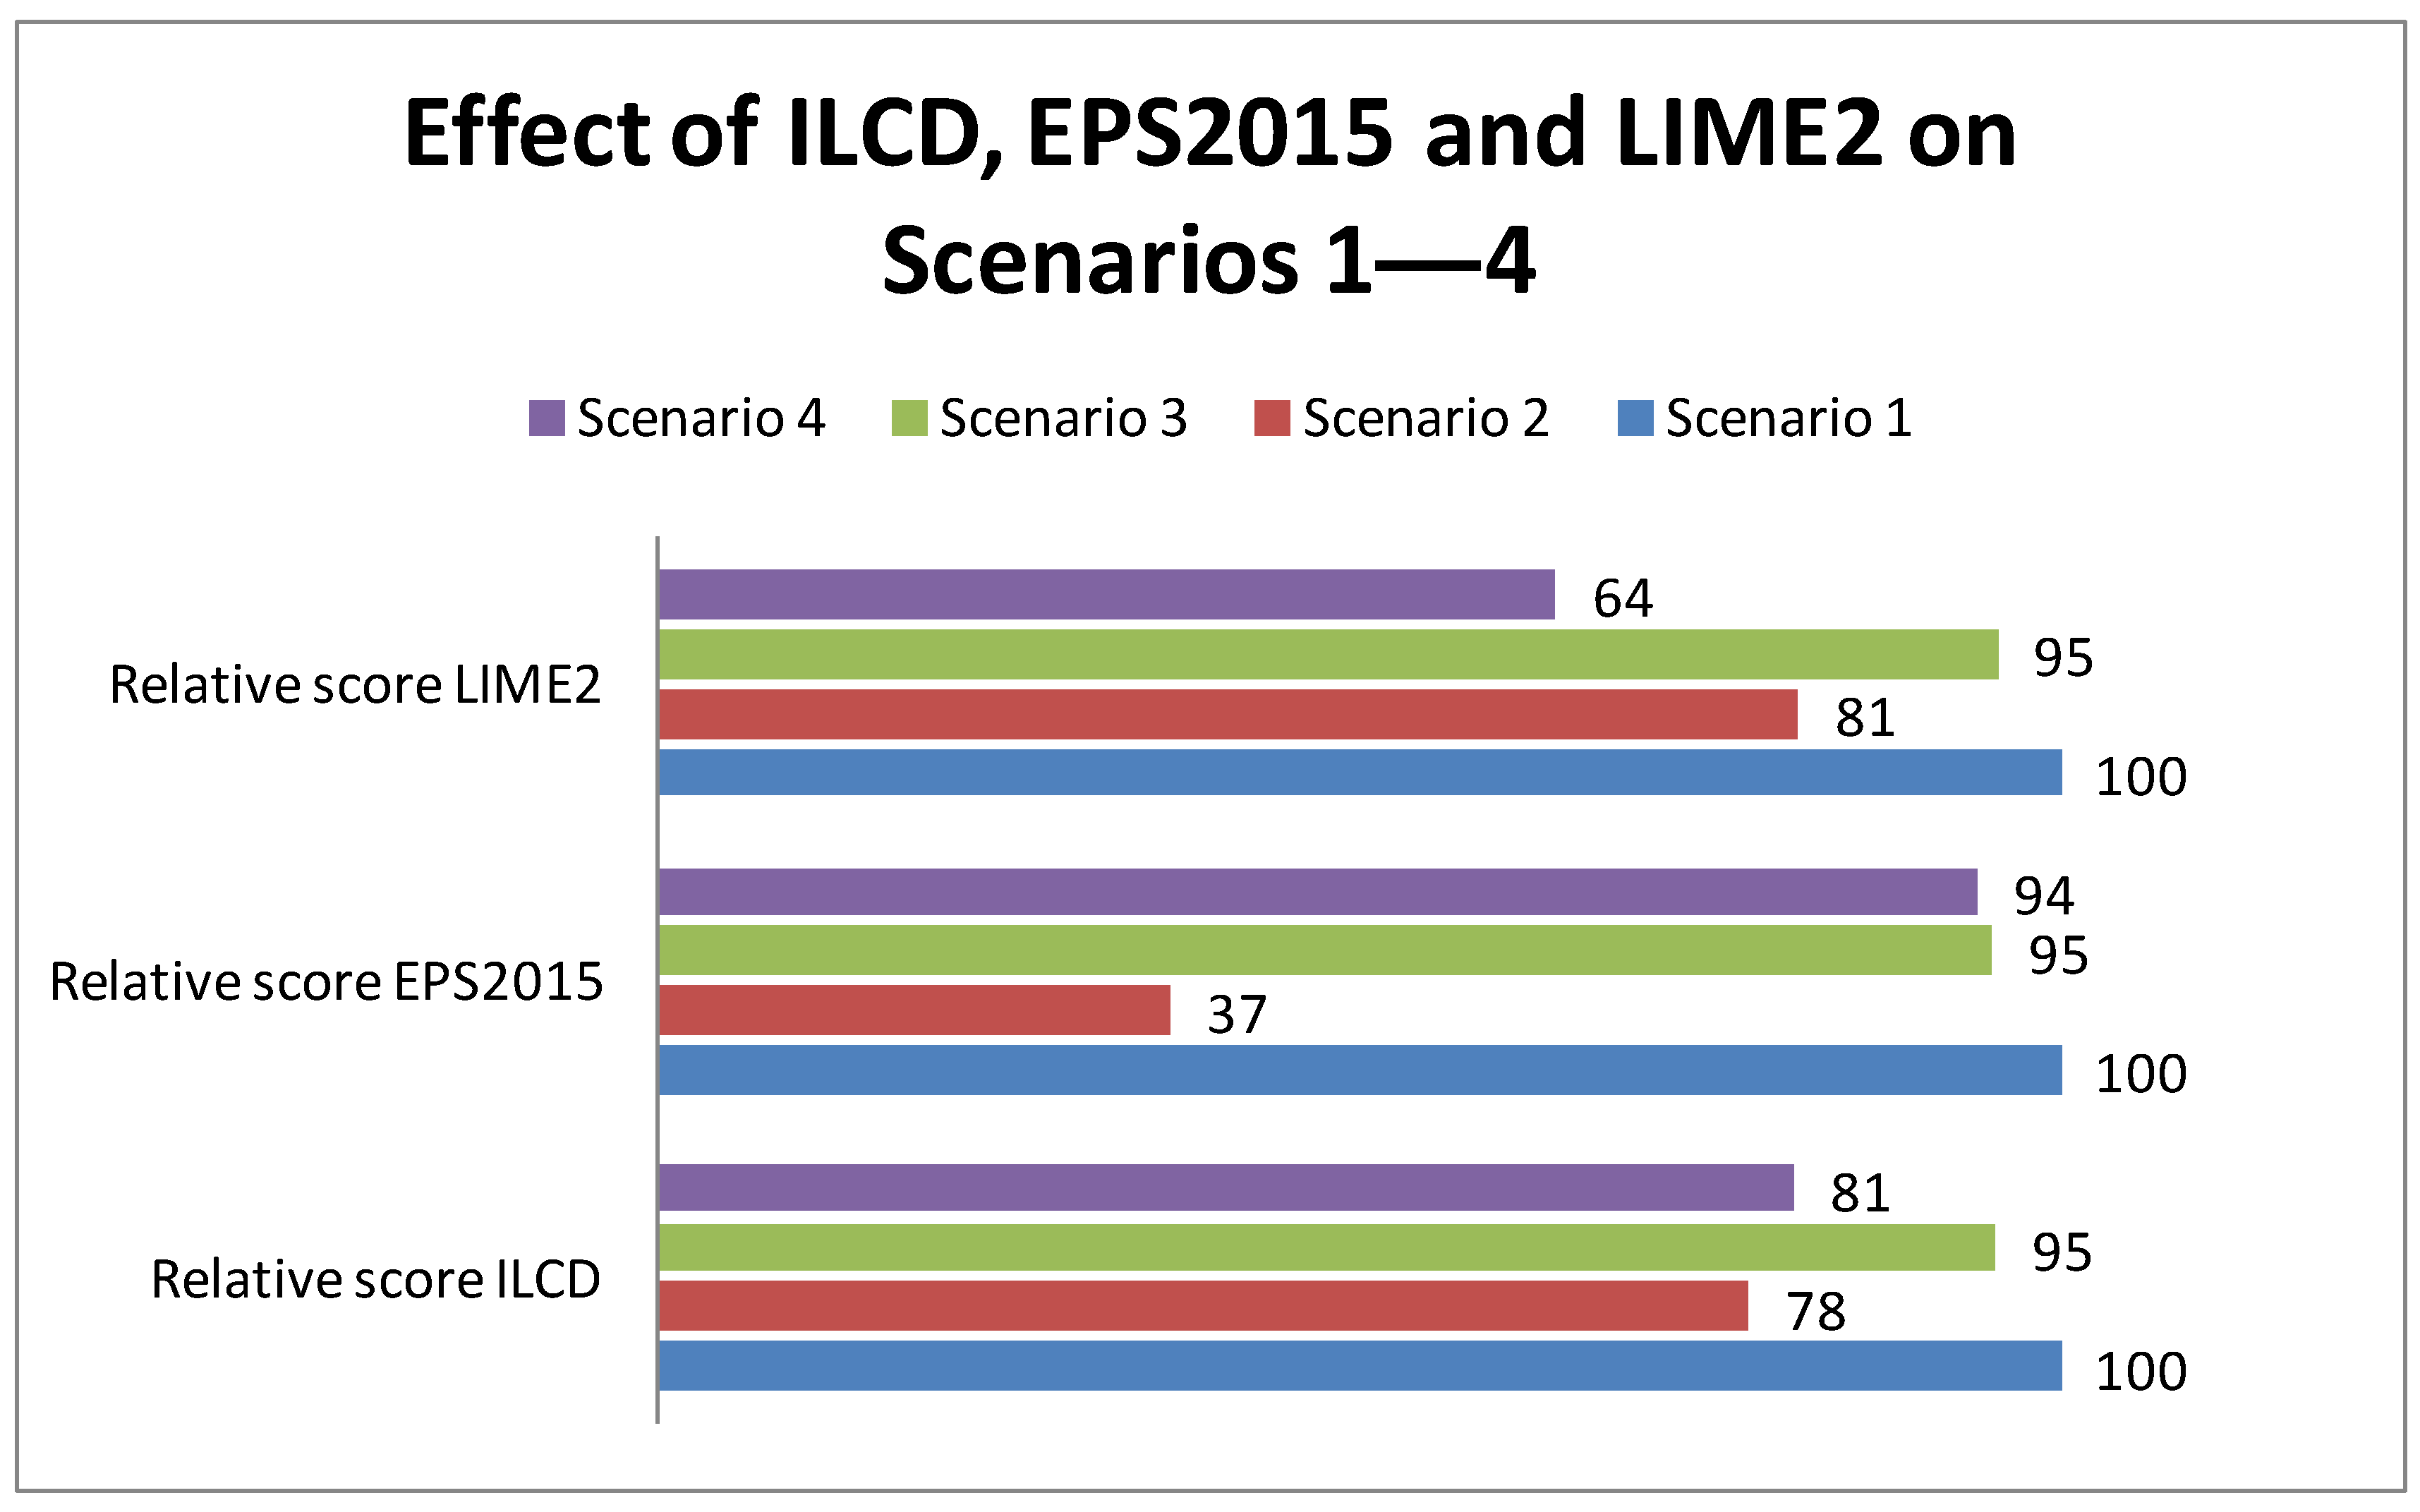
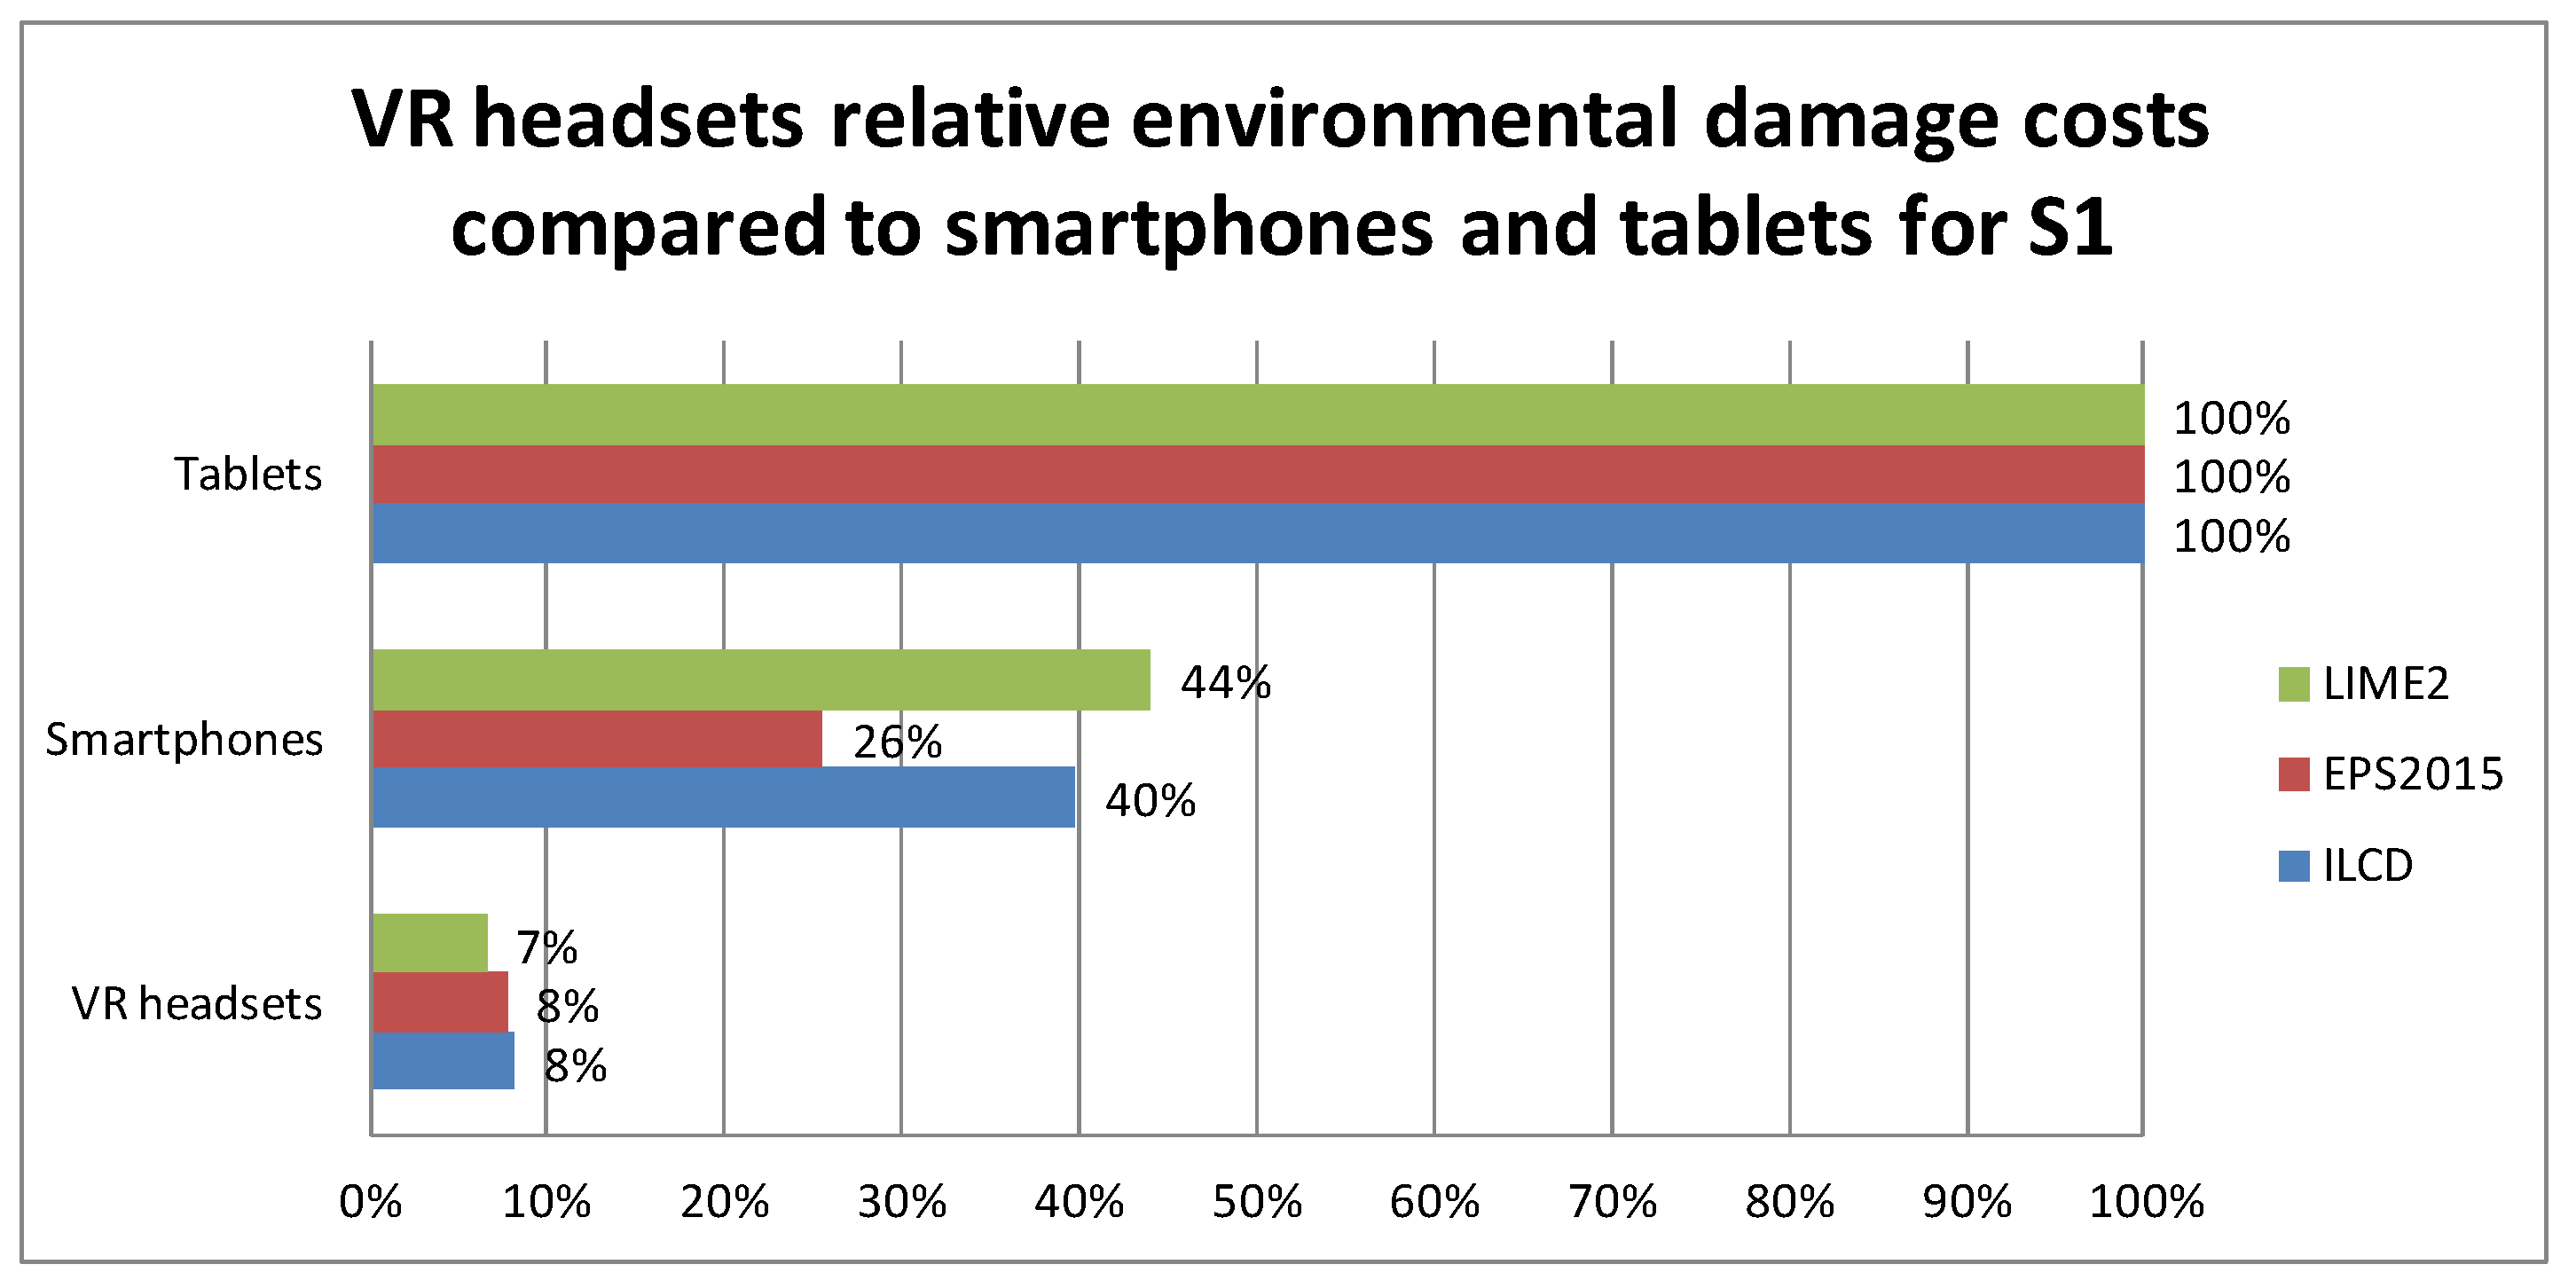
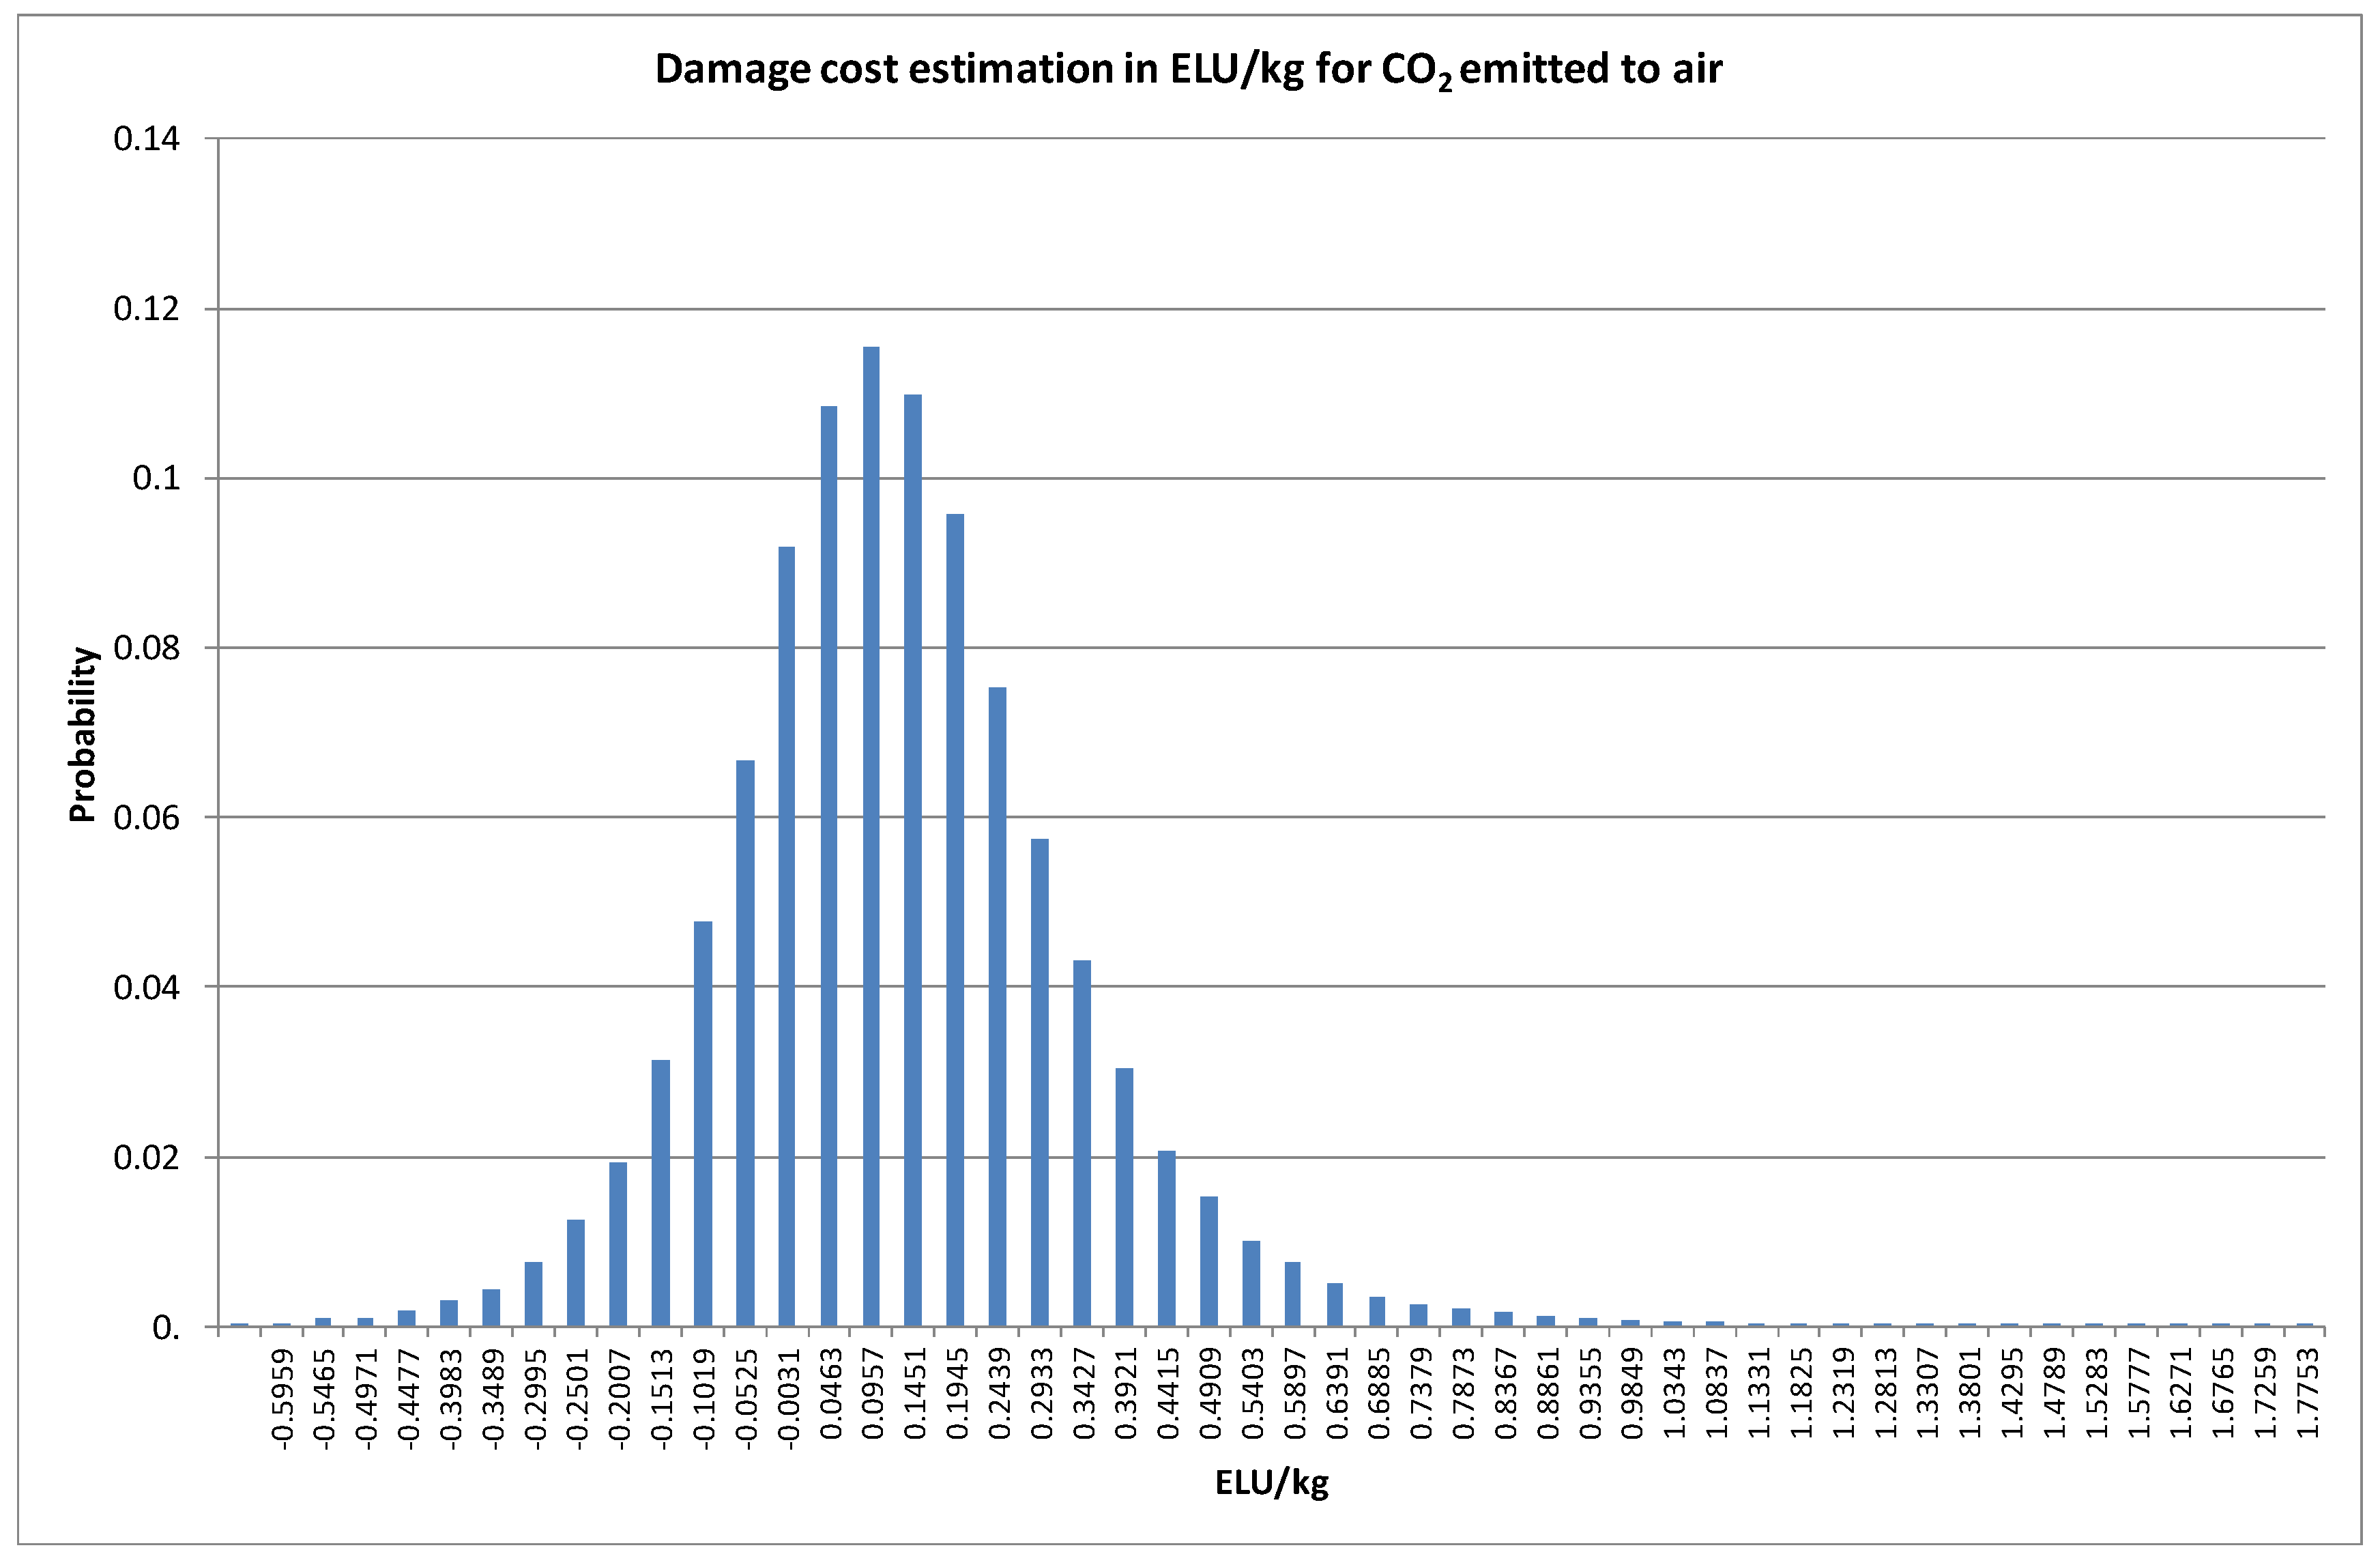
| Scenario 1—Baseline | Scenario 2 | Scenario 3 | Scenario 4 |
|---|---|---|---|
| Only use ore mining of metals | Only use secondary metals (Au, Ag, Cu) | Ore mining of metals | Ore mining of metals |
| High Impact Electric Power (HIEP) for wafer processing (WP), Integrated Circuit (IC) assembly and Printed Circuit Board (PCB) assembly (WP and IC and PCB) | HIEP for WP and IC and PCB | HIEP for WP and IC and PCB | Low Impact Electric Power (LIEP) for WP and IC and PCB |
| HIEP for final assembly (FA) | HIEP for FA | HIEP for FA | LIEP for FA |
| Airplane distribution | Airplane distribution | Airplane distribution | Airplane distribution |
| European average impact electric power (EAIEP) for Use | EAIEP for Use | EAIEP for Use | EAIEP for Use |
| No reuse | No reuse | 5% reuse of entire product | No reuse |
© 2017 by the author. Licensee MDPI, Basel, Switzerland. This article is an open access article distributed under the terms and conditions of the Creative Commons Attribution (CC BY) license (http://creativecommons.org/licenses/by/4.0/).
Share and Cite
Andrae, A.S.G. Life Cycle Assessment of a Virtual Reality Device. Challenges 2017, 8, 15. https://doi.org/10.3390/challe8020015
Andrae ASG. Life Cycle Assessment of a Virtual Reality Device. Challenges. 2017; 8(2):15. https://doi.org/10.3390/challe8020015
Chicago/Turabian StyleAndrae, Anders S. G. 2017. "Life Cycle Assessment of a Virtual Reality Device" Challenges 8, no. 2: 15. https://doi.org/10.3390/challe8020015
APA StyleAndrae, A. S. G. (2017). Life Cycle Assessment of a Virtual Reality Device. Challenges, 8(2), 15. https://doi.org/10.3390/challe8020015


