
On Global Electricity Usage of Communication Technology: Trends to 2030


Abstract
:1. Introduction
- (i)
- (ii)
- (iii)
- thin-client solutions, such as smart-phones and tablet devices [16].
- (i)
- consumer devices, including personal computers, mobile phones, TVs and home entertainment systems;
- (ii)
- network infrastructure;
- (iii)
- data center computation and storage; and lastly
- (iv)
- production of the above categories.
- printers and multi-function devices;
- digital and video cameras;
- music players and similar digital media and stand-alone video player devices;
- network connected white goods;
- smart thermostats;
- home energy management;
- security systems;
- satellites;
- personal drones;
- robots;
- driverless automotives; and
- portable batteries, “power banks”.
2. Materials and Methods—Approach
The Overall Methodological Approach Consists of the Following Steps:
- Setting of the modeling framework leading to total electricity used per year:
- ○
- Consumer devices production and use: A framework is set up that includes the kind of consumer devices to be included, the units of these consumer devices produced each year from 2010 to 2030, their lifetimes, their production electricity per unit, their average annual electricity usage, and the annual electricity efficiency improvements to be achieved year by year in production and use.
- ○
- Fixed access networks (FAN) use: FAN consists of Fixed access wired and Fixed access Wi-Fi. A framework is set up based on the expected annual growth of fixed access wired data traffic and fixed access Wi-Fi data traffic between 2010 and 2030 and the improvements of electricity efficiency to be expected year by year from 2010 to 2030, and assumed known values for the 2010–2012 electricity of the defined FAN scope. The same framework is applied to both fixed access types.
- ○
- Wireless access networks (WAN) use: A framework is set up based on the annual growth of voice traffic; the growth of mobile data traffic; electricity used per traffic unit for each of voice; second-generation (2G) wireless telephone technology data, third generation (3G) data, fourth generation (4G) data and fifth generation (5G) data; share of the before mentioned technologies of the total wireless traffic year by year from 2010 until 2030; and improvements of electricity efficiencies to be achieved year by year.
- ○
- Data centers use: A framework is set up based on expected annual growth of global data center Internet Protocol (IP) traffic between 2010 and 2030, electricity used per traffic unit, and improvements of electricity efficiencies to be achieved year by year.
- ○
- Networks and Data center production: The estimation is based on the share of the use-stage electricity of the life cycle electricity of networks and data centers. The production electricity is correlated fully to the use-stage electricity.
- ○
- Global electricity: The estimation is based on a known starting value for 2010 and an annual growth rate for non-CT electricity. CT electricity (ECT) grows according to the present investigation.
- ○
- Renewable electricity: The estimation is based on known starting value for 2010 and an annual growth rate.
- ○
- GHG intensity of the global electricity mix: The estimation is based on a combination of GHG intensities of (annually changing) shares of non-renewable and renewable electricity.
- ○
- GHG global emissions: The estimation is based on a 2010 starting value of 46 Gigatons and a 2% annual growth rate until 2030, for non-CT GHG emissions. CT electricity GHG emissions grow according to the present investigation.
- Data input: Collecting and extrapolating the data to be inserted in the modeling tool, in this case Microsoft Excel. The details are found in the Supplementary Materials file.
- Data calculation: Produce the numbers and graphs.
- Data analysis: Make a check to determine the reasonableness of the results.
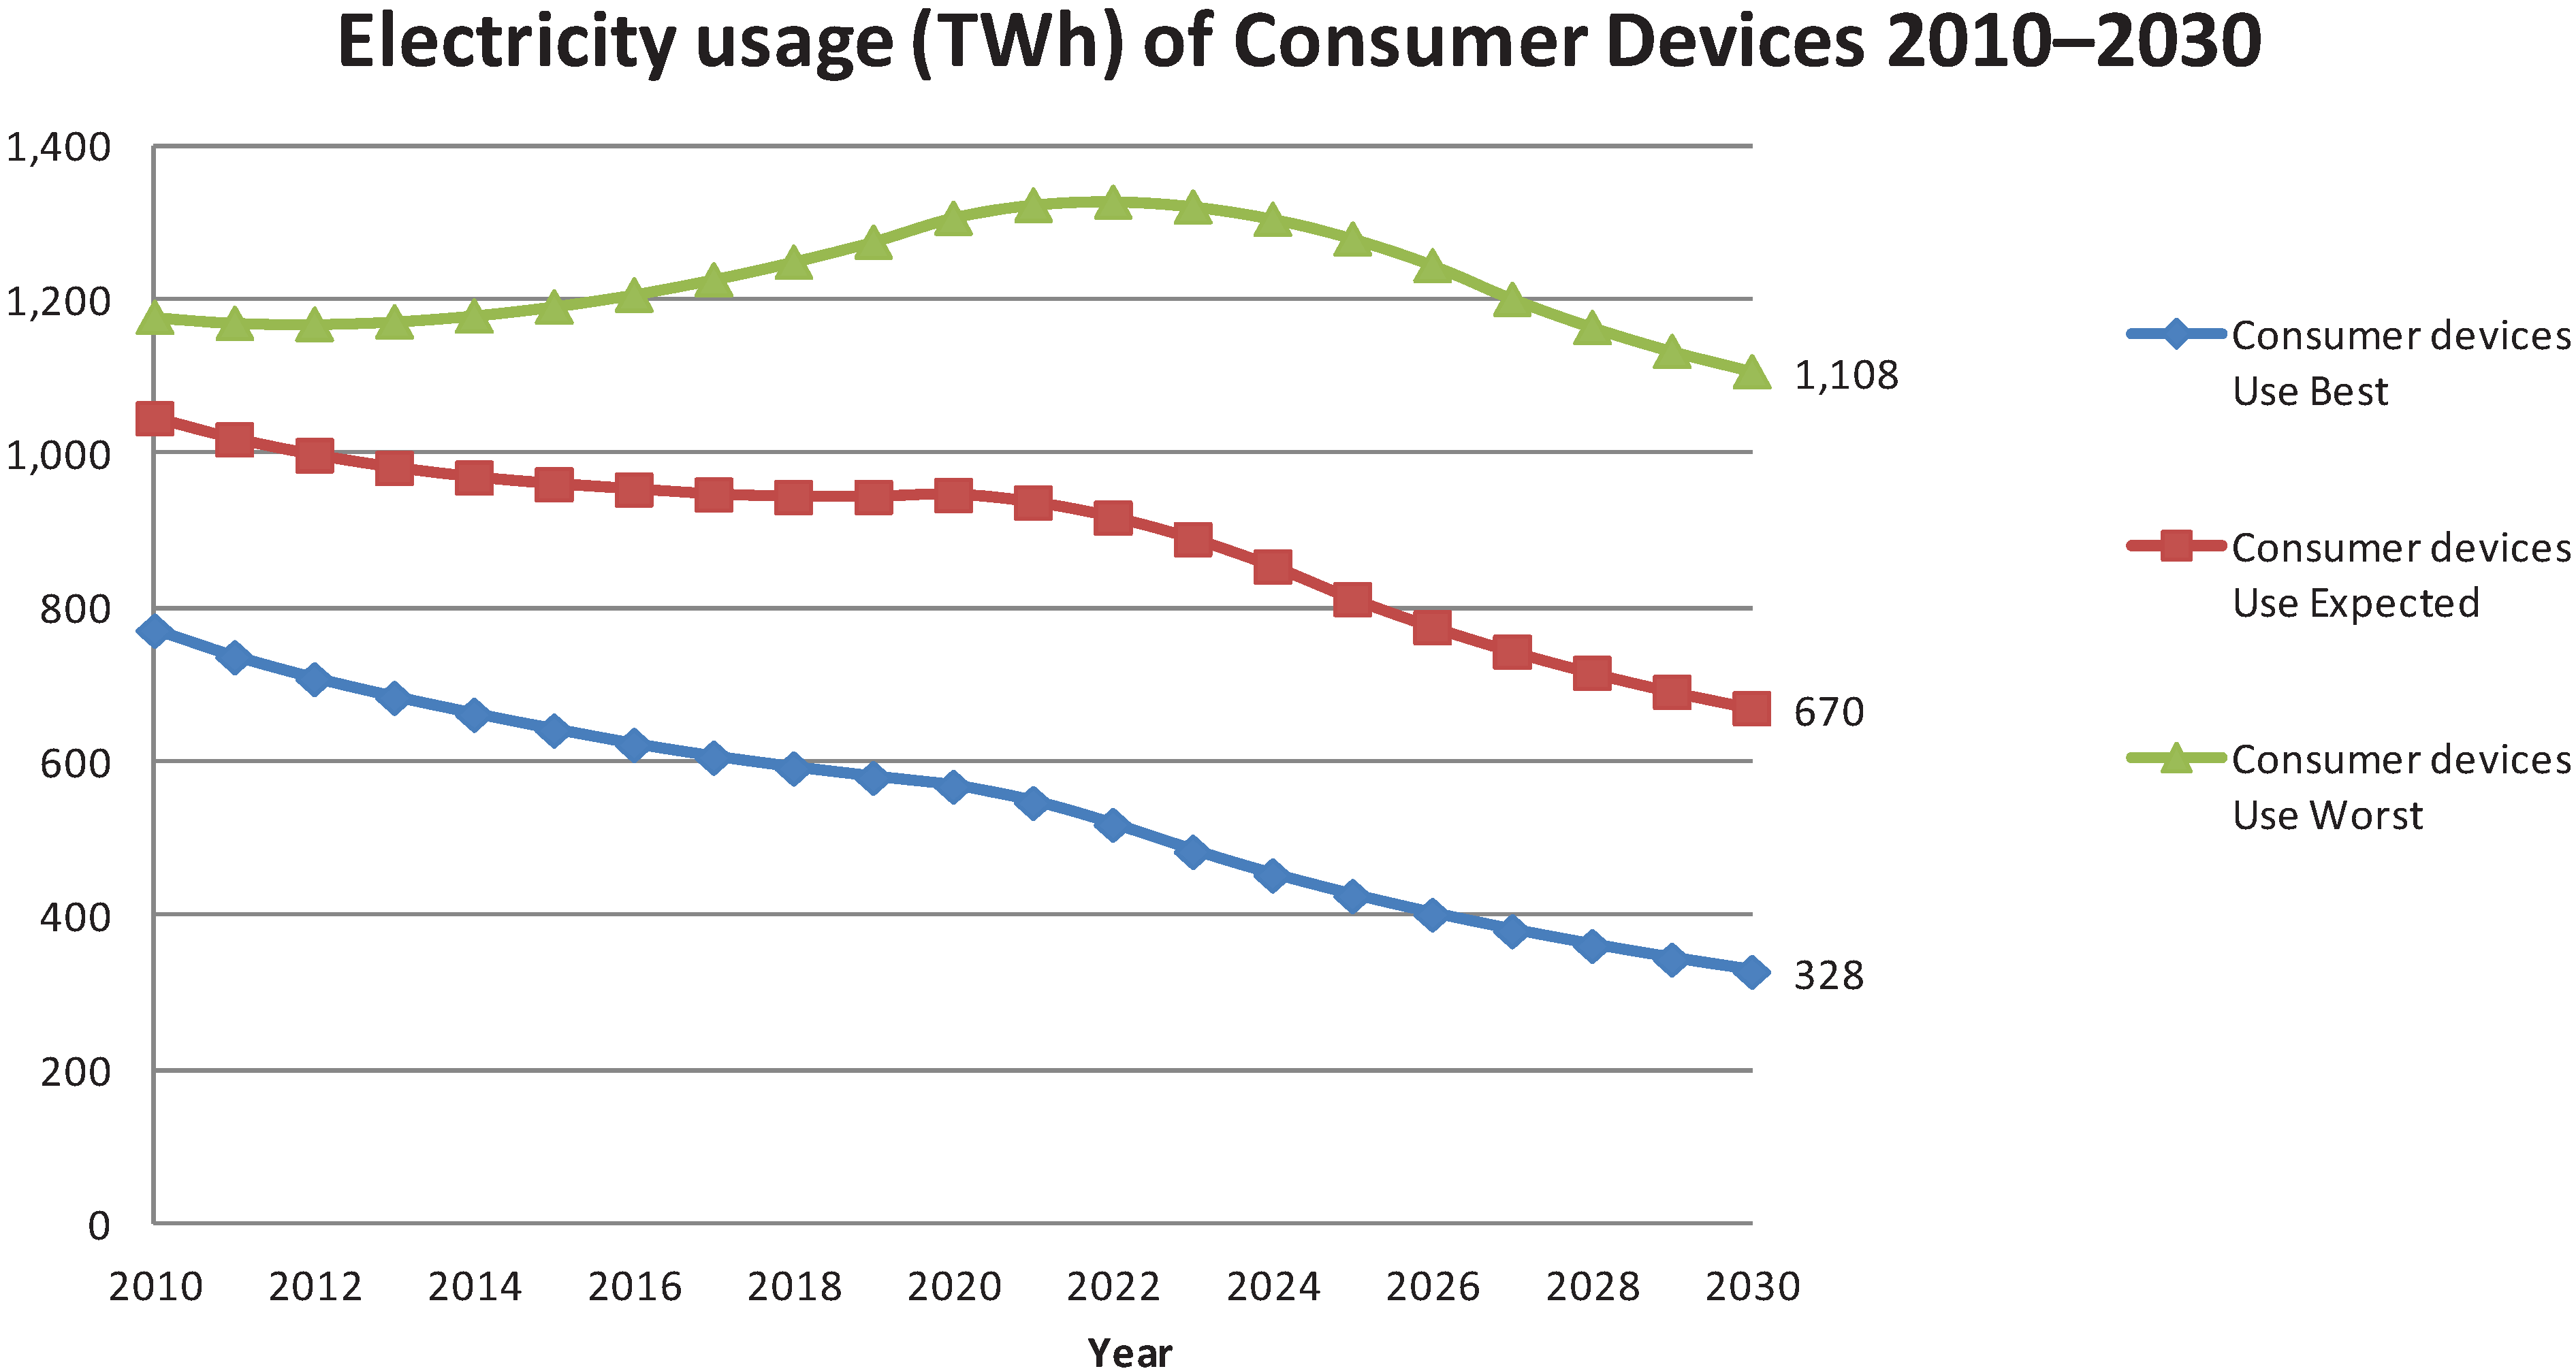
3. Consumer Devices Use Stage—Results
- ECDU,2010 = Total electricity for annual use of a category of consumer devices in 2010, TWh.
- PCD,2010 = Units of a category of consumer device (desktops, monitors, etc.) produced in one year 2010, millions.
- L = lifetime of a category of consumer devices, 1, 2, 3, 5, 7, 8 or 10 years.
- ECDUu,2010 = Average annual electricity used by a category of consumer device in 2010, MWh/unit/year.
- n = 0,…20.
3.1. Desktops, Monitors, Laptops
3.2. Smartphones, Tablets, Ordinary Mobile Phones, Phablets, Mobile Broadband Modems
3.3. TVs
3.4. TV peripherals
4. Networks Use Stage—Results

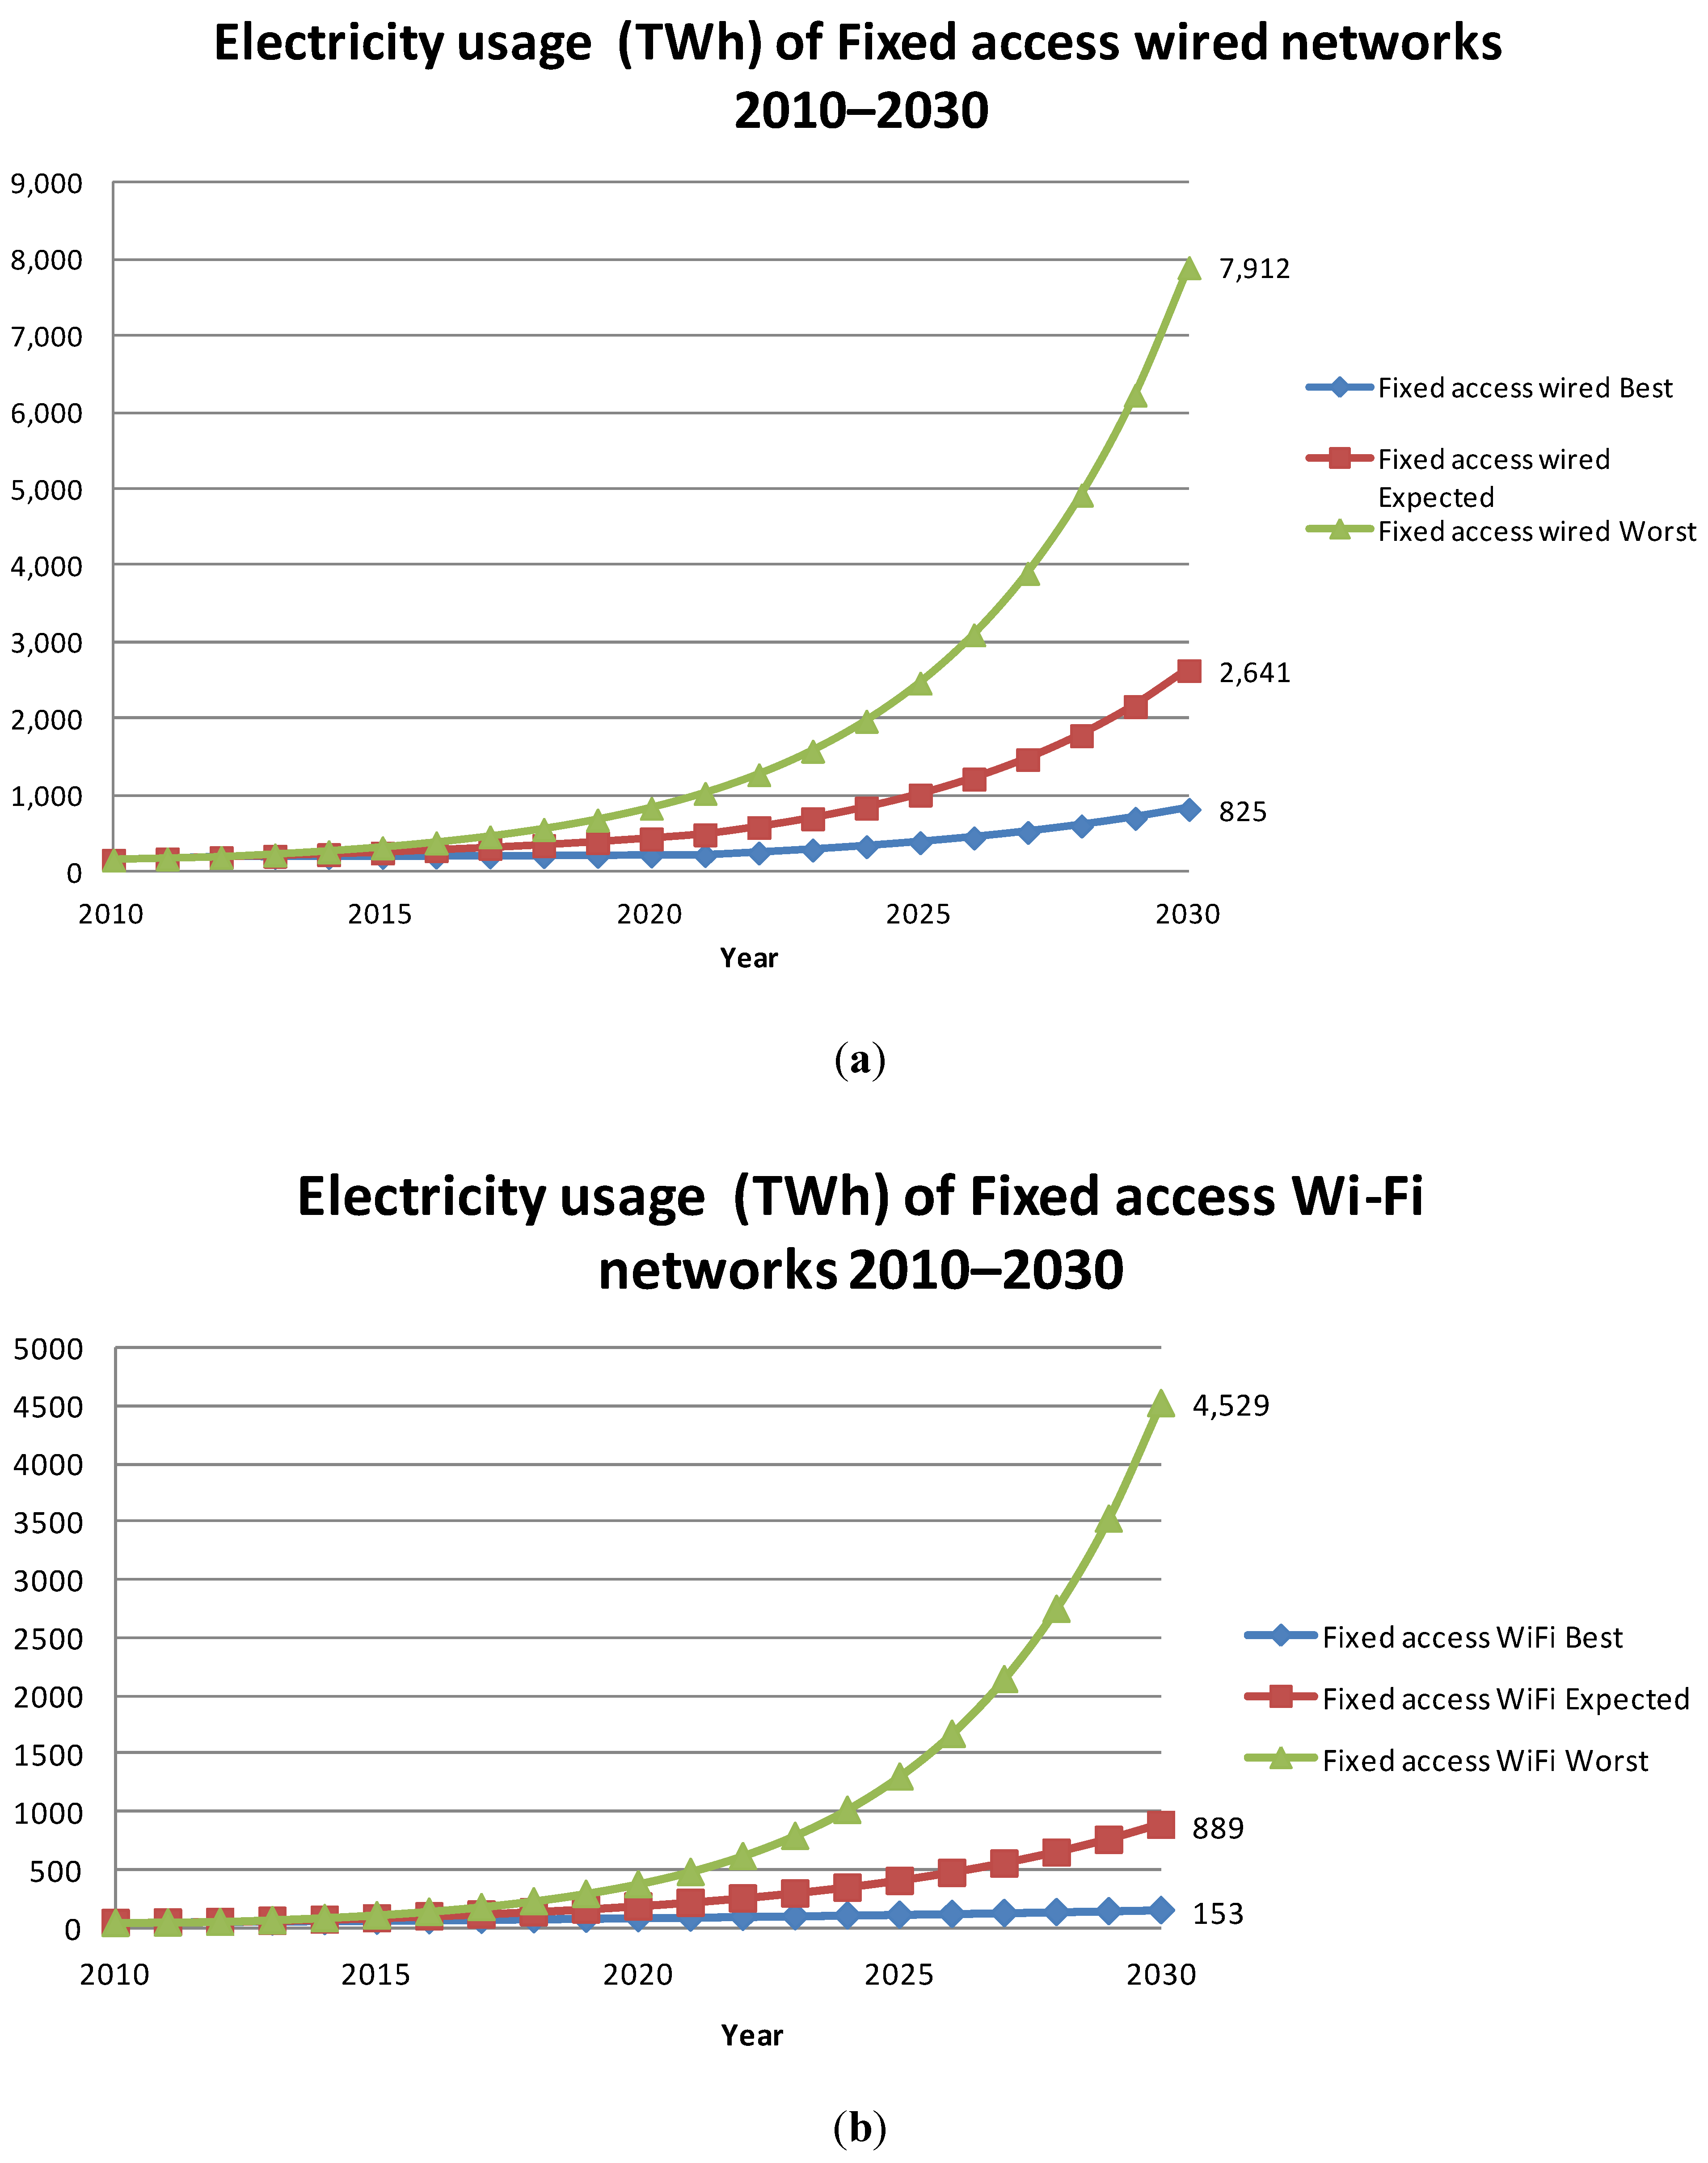
4.1. Fixed Access Wired and Wi-Fi Networks—Results
- EF,2012 = electricity usage fixed access wired or fixed access Wi-Fi networks in 2012, TWh
- EF,2011 = electricity usage fixed access wired or fixed access Wi-Fi networks in 2012, TWh
- TF2012 = fixed access wired + fixed access Wi-Fi data traffic or fixed access Wi-Fi data traffic in 2012, EB
- TF2011 = fixed access wired + fixed access Wi-Fi data traffic or fixed access Wi-Fi data traffic in 2011, EB
- n = 1,2,3…,18
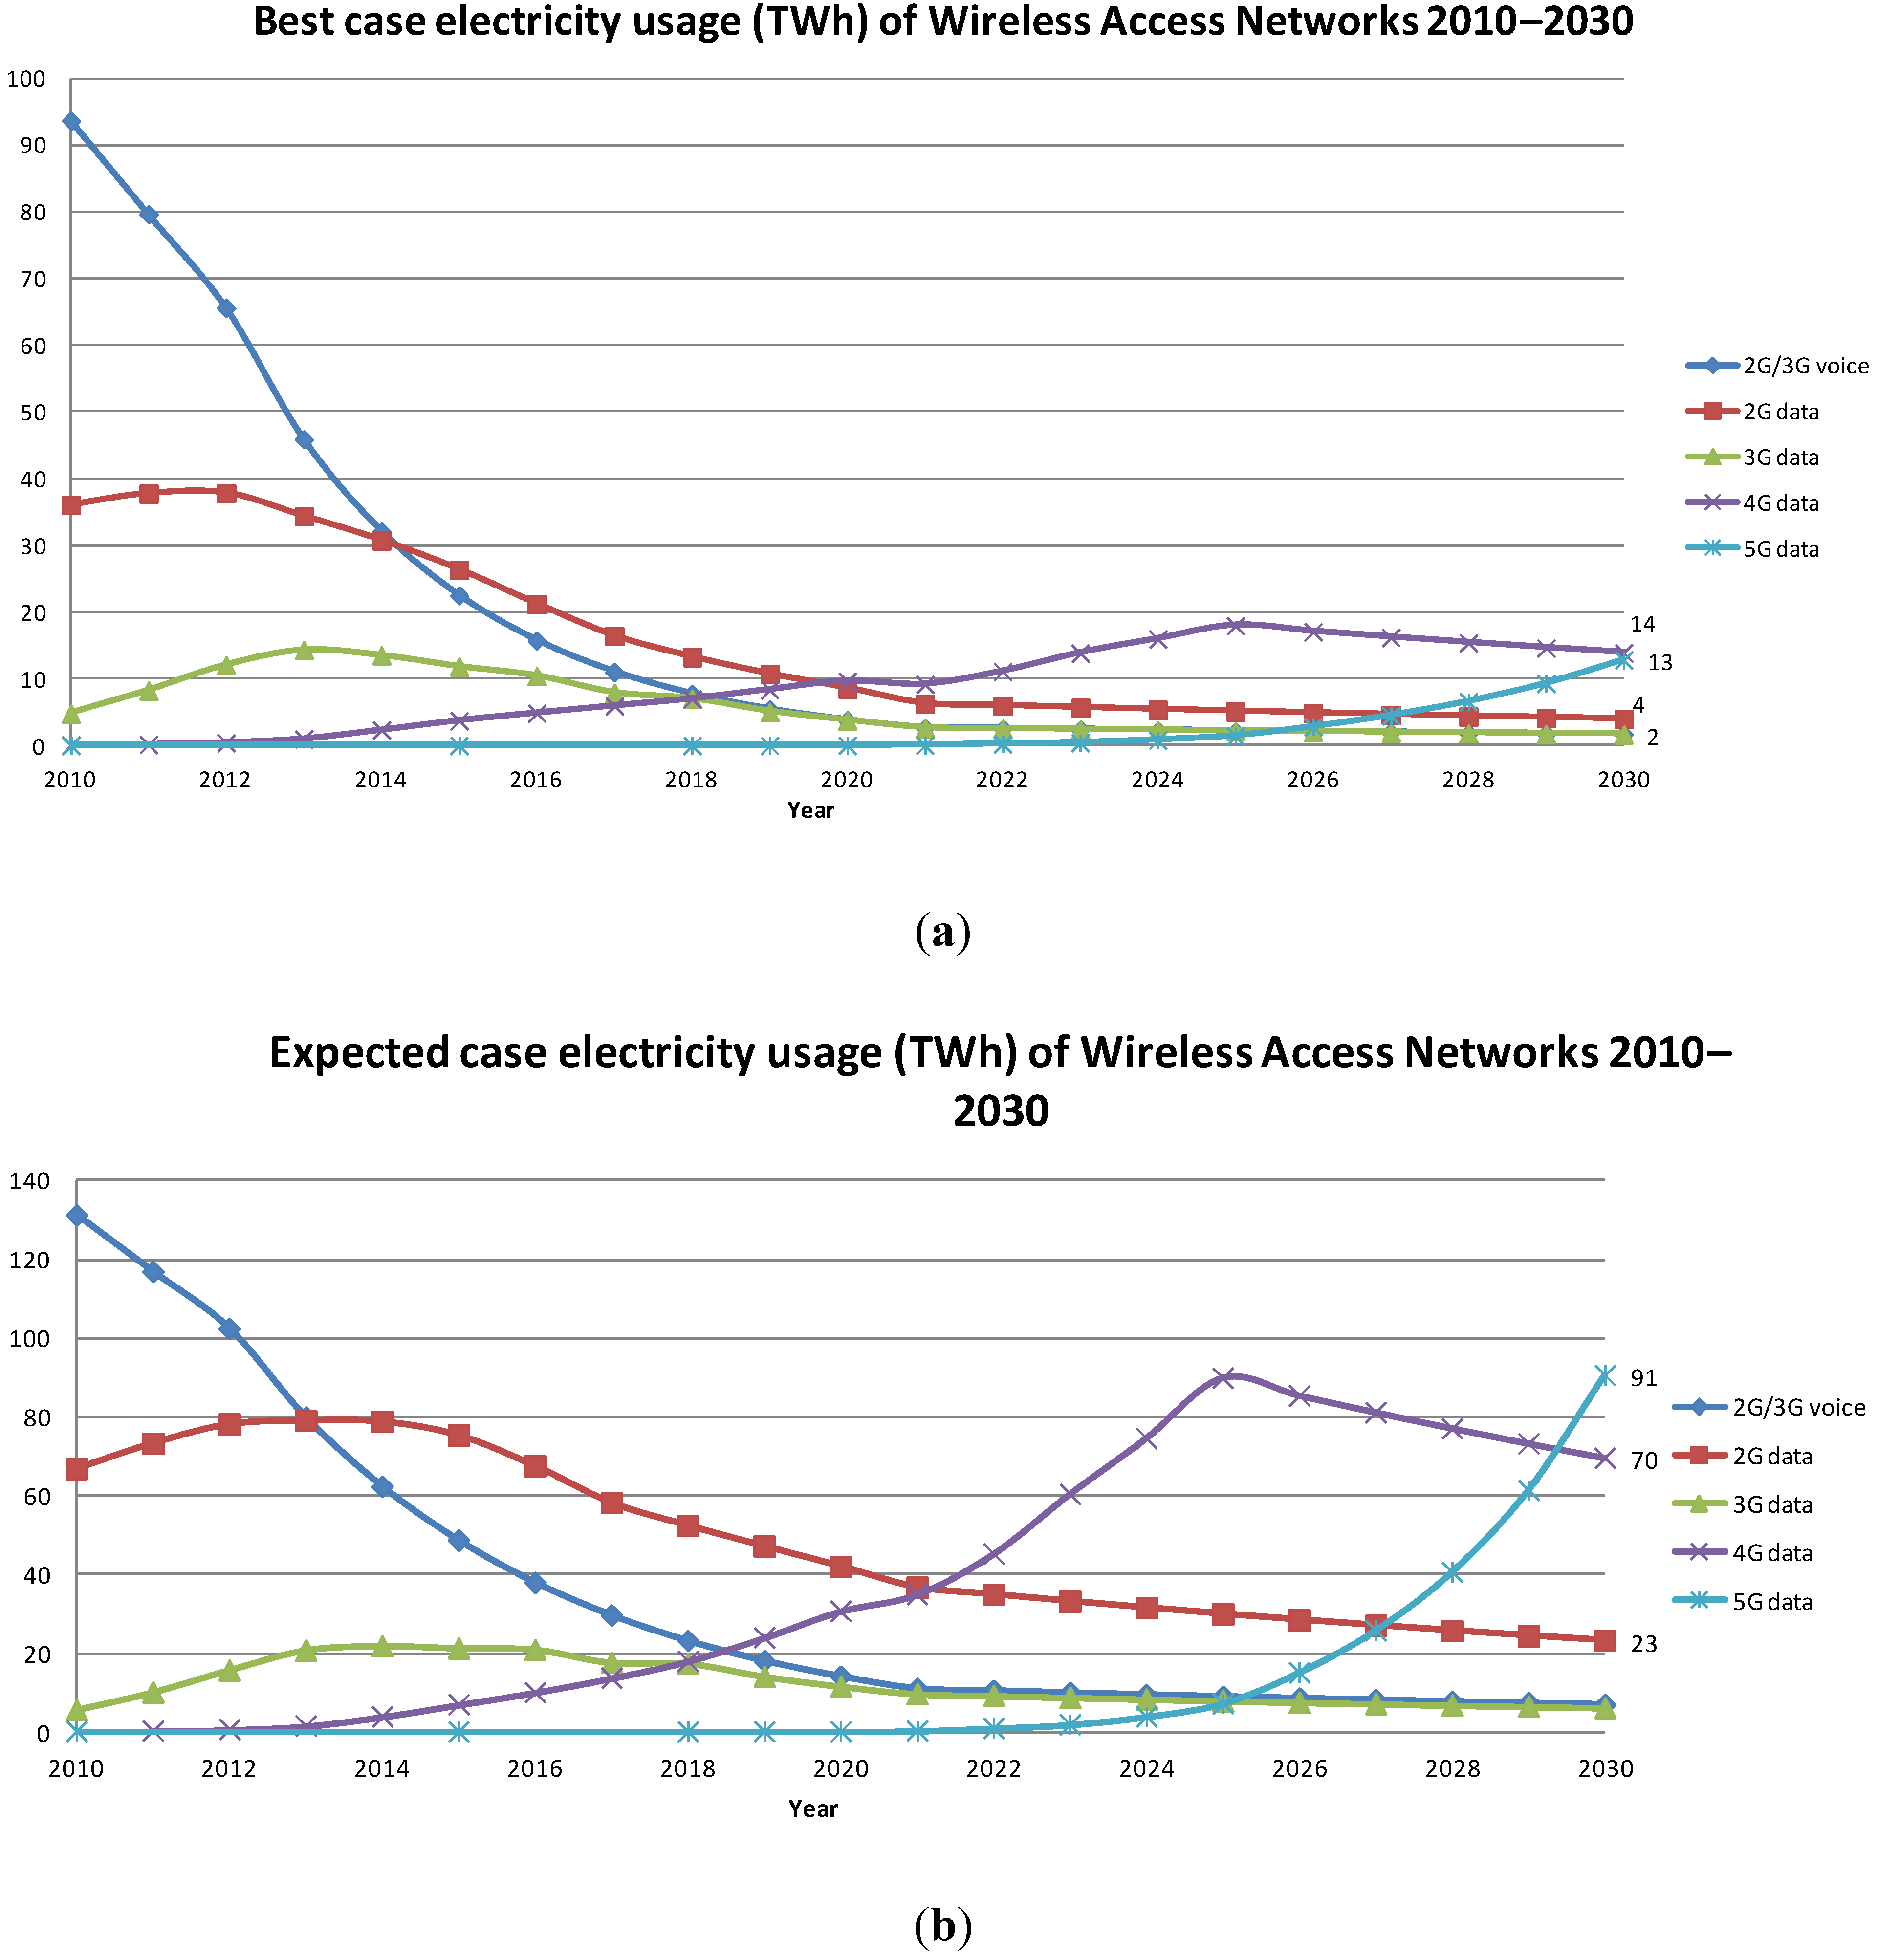
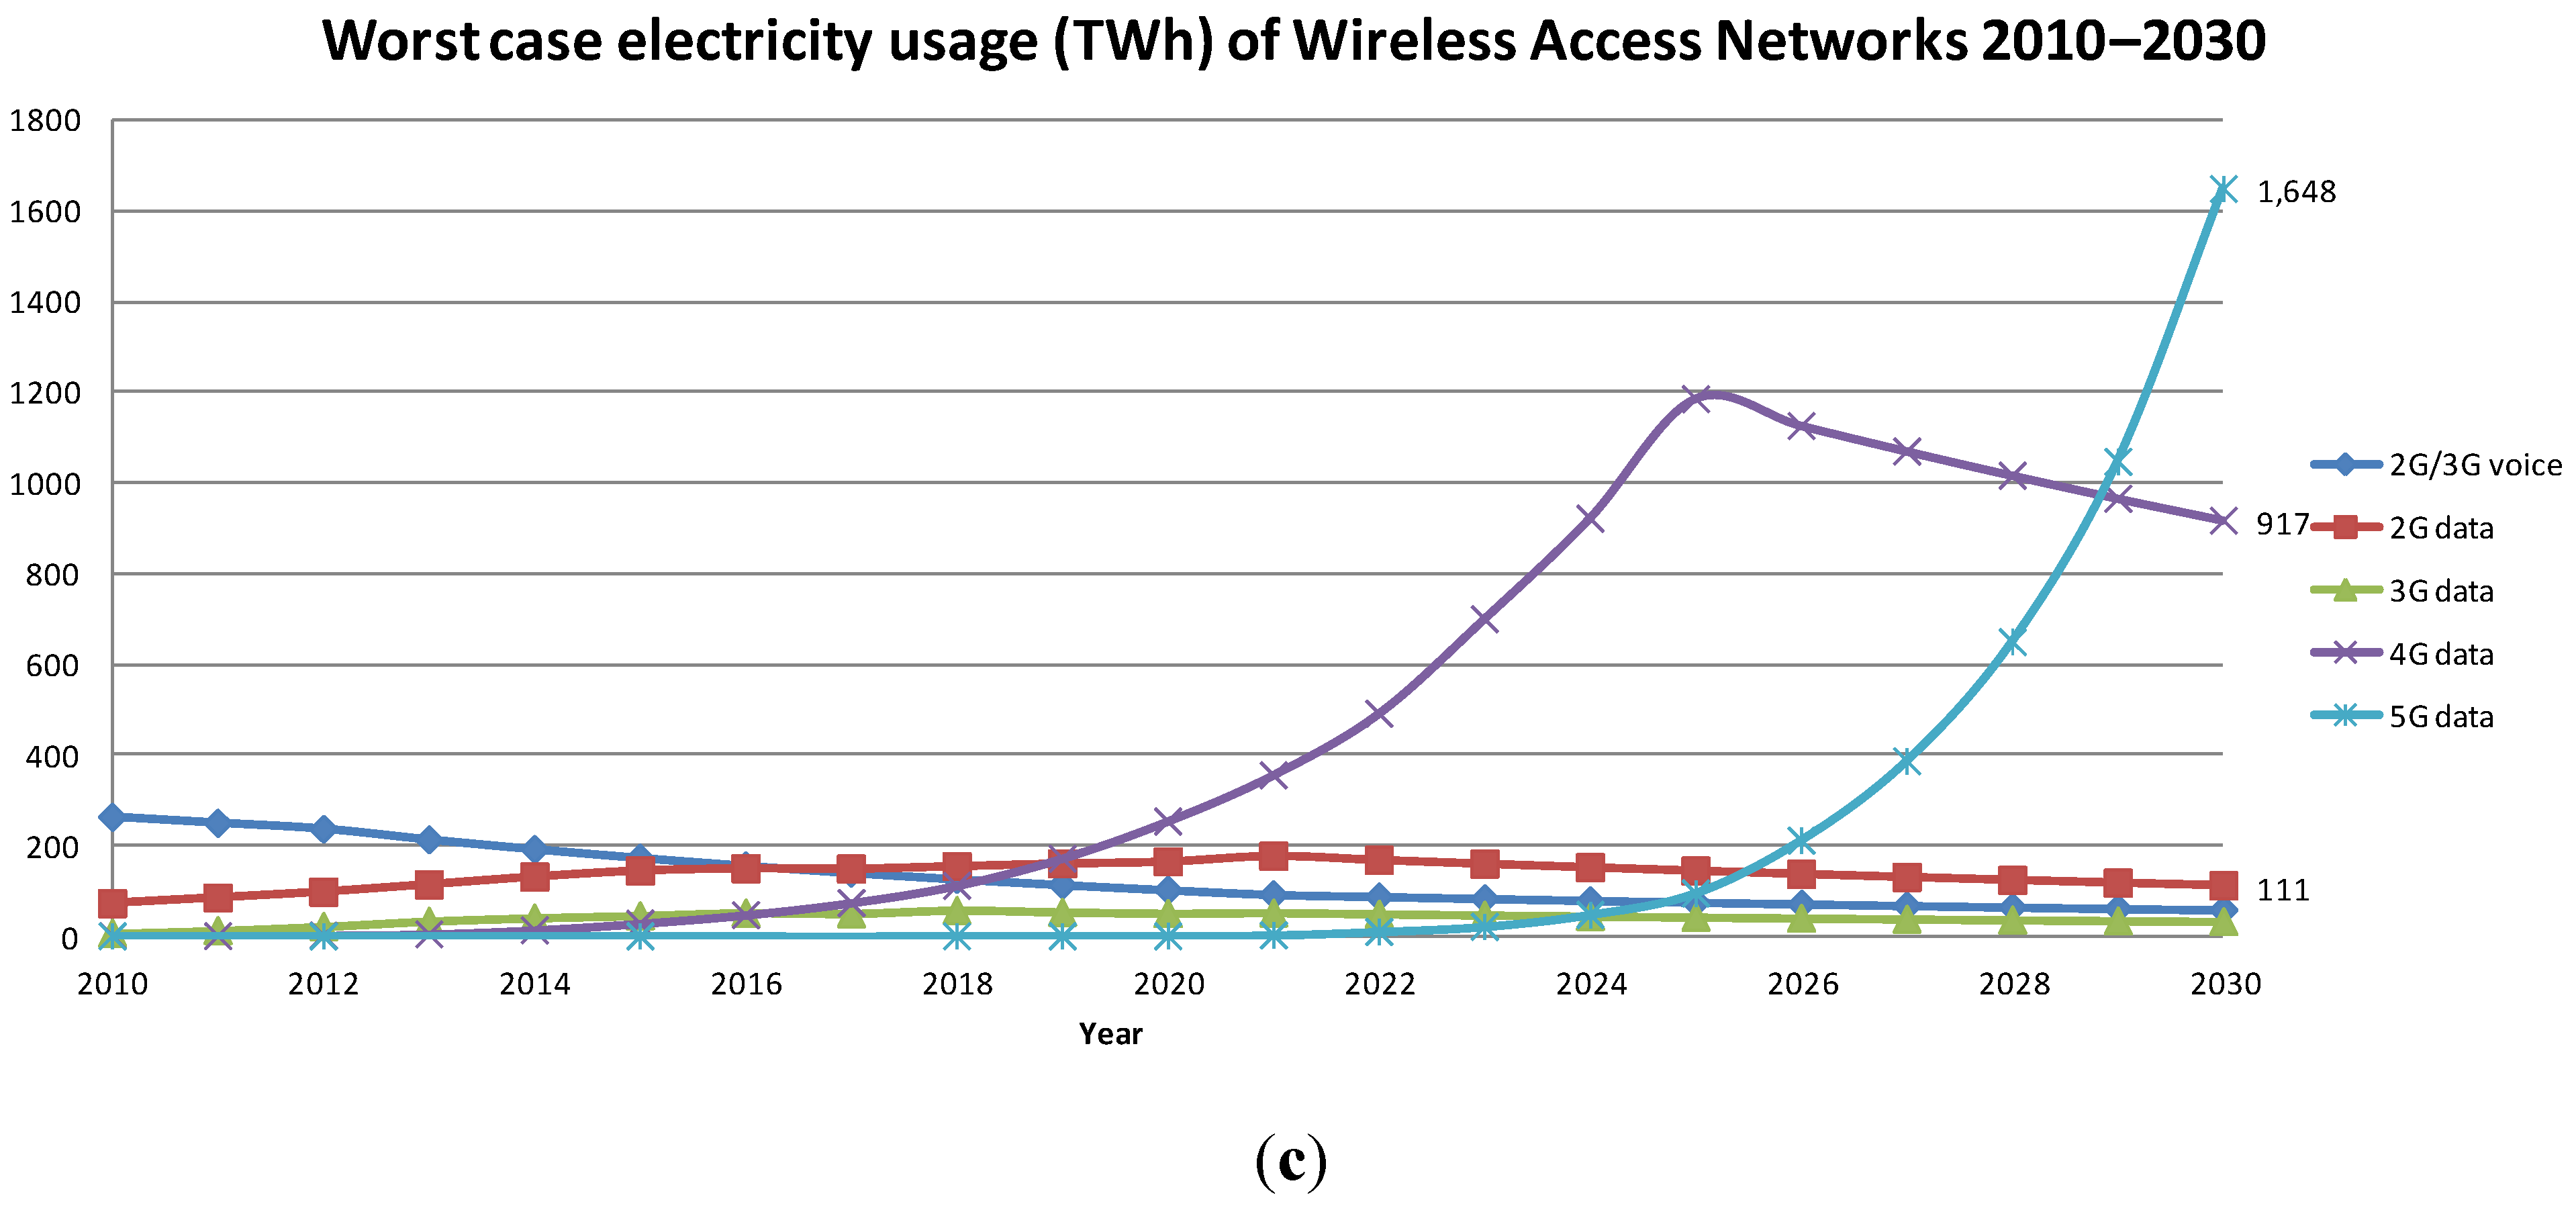
4.2. Wireless Access Networks—Results
4.2.1. 2G/3G Voice Traffic
- EVoice,2010 = electricity usage in 2010, TWh
- VT2010 = voice traffic per month in 2010, EB
- n = 0,1,2,3…,20
- EIV,2010 = electricity intensity voice traffic in 2010, 5 (best),7 (expected),14 (worst), TWh/EB
4.2.2. Mobile Data Traffic
4.3. 2G Mobile
- E2G,2010 = electricity usage for 2G in 2010, TWh
- S2G2010 = share of 2G of total mobile data traffic in 2010, %
- MDT2010 = total mobile data traffic per month in 2010, EB
- n = 0,1,2,3…,20
- EI2G,2010 = electricity intensity 2G mobile data traffic in 2010, 20 (best), 37 (expected) [53], 40 (worst), TWh/EB
4.4. 3G Mobile
- E3G,2010 = electricity usage of 3G in 2010, TWh
- S3G2010 = share of 3G of total mobile data traffic in 2010, %
- MDT2010 = mobile data traffic per month in 2010, EB
- n = 0,1,2,3…,20
- EI3G,2010 = electricity intensity 3G mobile data traffic in 2010, 2.5 (best), 2.9 (expected) [53], 3.5 (worst), TWh/EB
4.5. 4G Mobile
- E4G,2010 = electricity usage 4G in 2010, TWh
- S4G2010 = share of 4G of total mobile data traffic in 2010, %
- MDT2010 = mobile data traffic per month, EB
- n = 0,1,2,3…,20
- EE = annual electricity efficiency improvement, 30% (best) [125], 22% (expected), 10% (worst)
4.6. 5G Mobile
- E5G,2010 = electricity usage 5G in 2010, TWh
- S5G2010 = share of 5G of total mobile data traffic in 2010, %
- MDT2010 = mobile data traffic per month in 2010, EB
- n = 0,1,2,3…,20
- EE = annual electricity efficiency improvement, 30% (best), 22% (expected), 10% (worst)


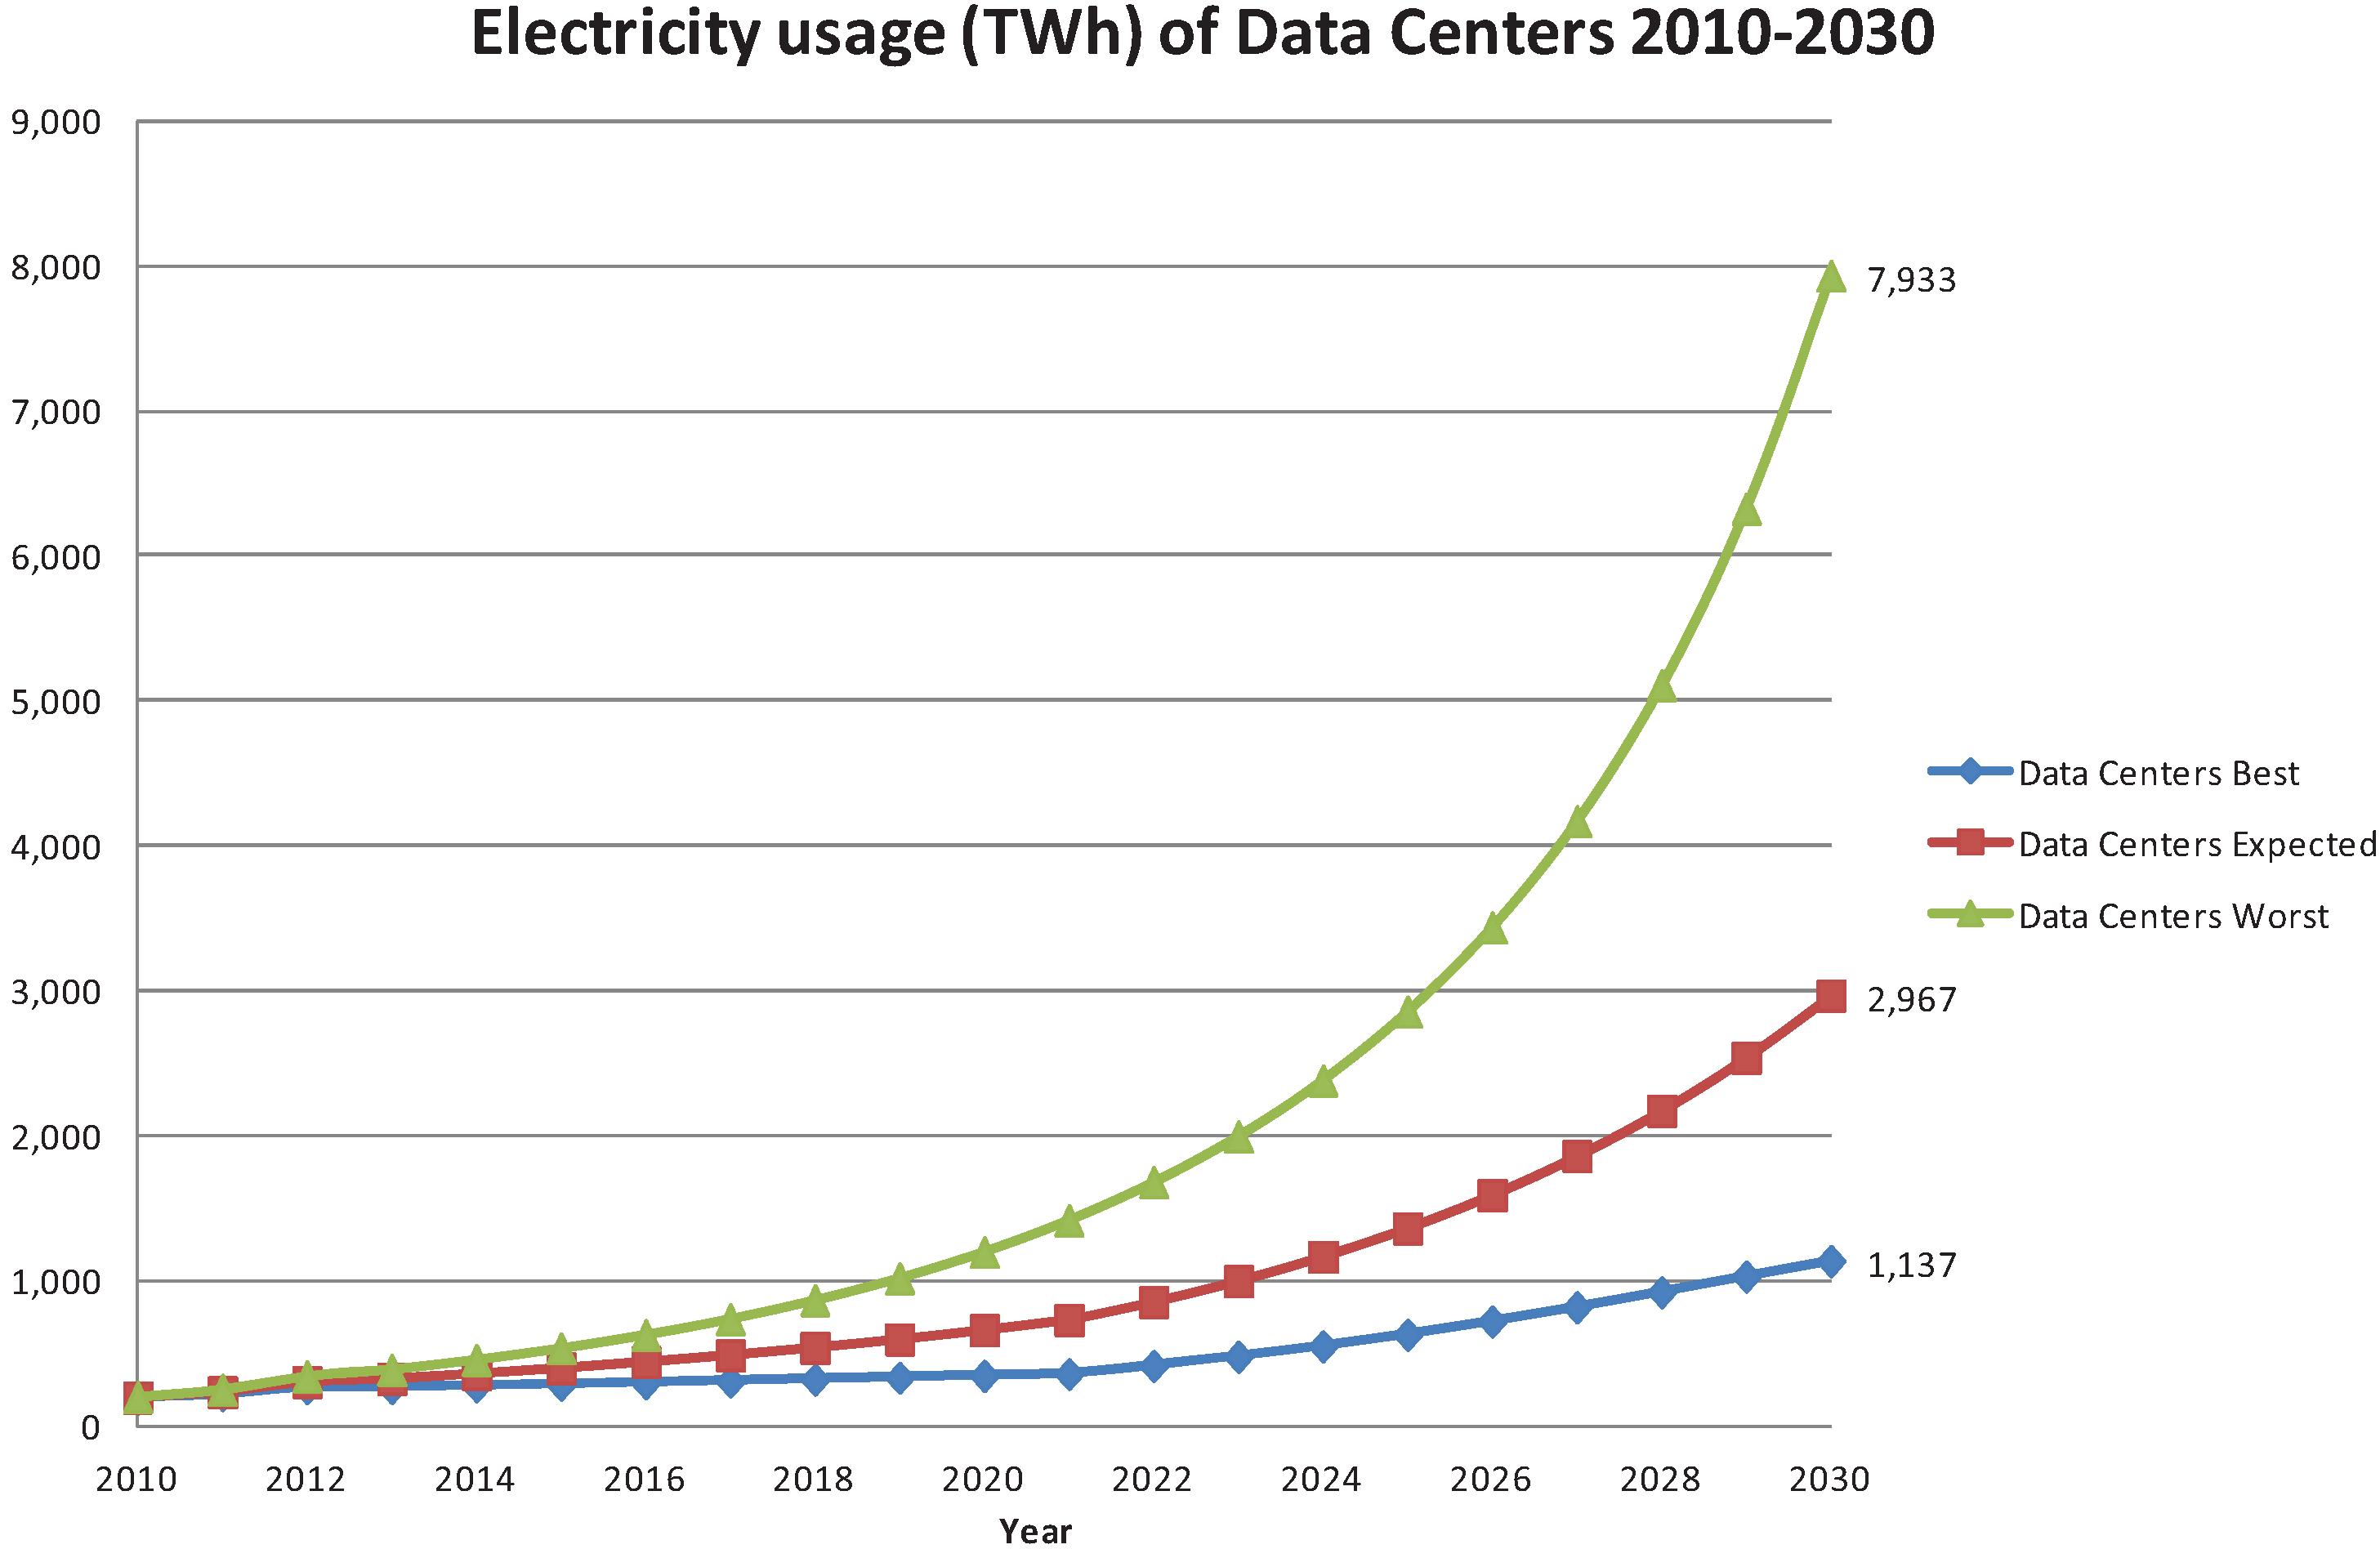
5. Data Centers Use Stage—Results
- EDC,2010 = electricity usage in data centers in 2010, TWh
- EDC,2011 = electricity usage in data centers in 2011, TWh
- TDC2010 = global data center IP traffic in 2010, EB
- TDC2011 = global data center IP traffic in 2011, EB
- n = 0,1,2,3…,19.

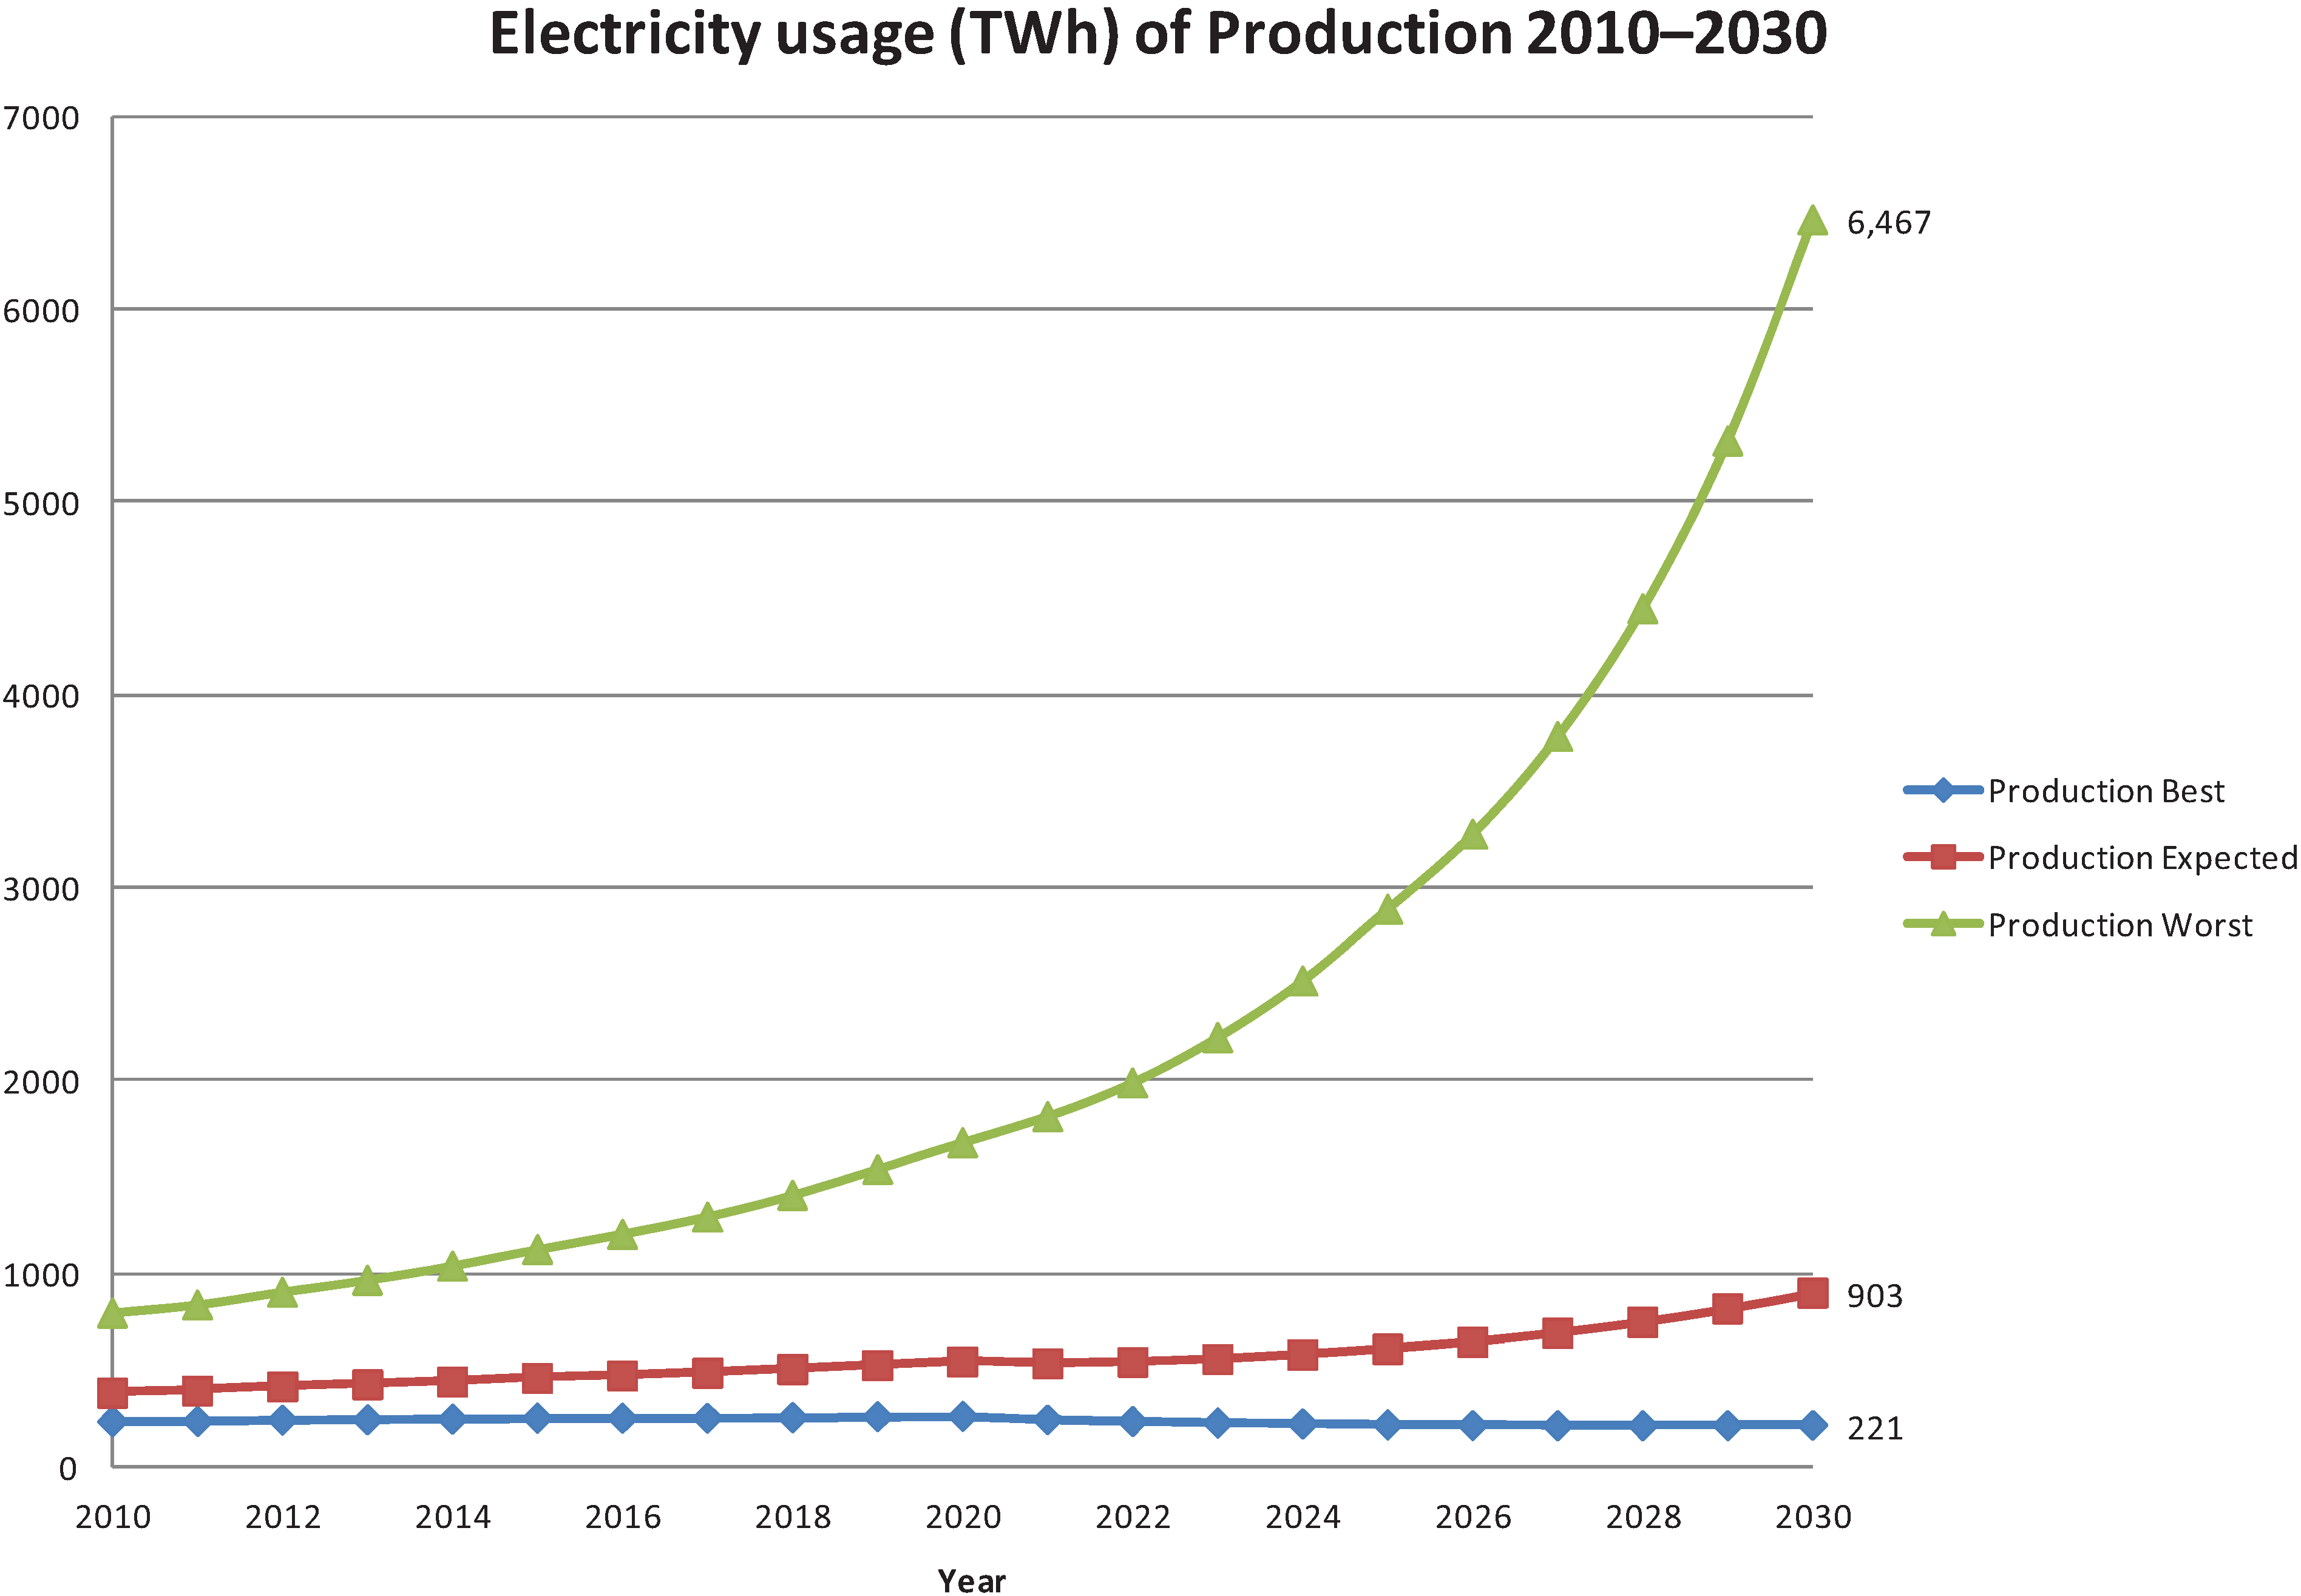
6. Production Electricity for Consumer Devices, Networks and Data Centers—Results
- ECDP,2010 = Electricity for production of a consumer device category in 2010, TWh
- PCD,2010 = produced units of a category of consumer device (desktops, monitors, etc.) in 2010, millions
- ECDPu,2010 = production electricity for a category of consumer devices in 2010, MWh/unit
- n = 0,1,2,3,…20
- EP,networks,2010 = electricity for networks production in 2010, TWh
- EP,DC,2010 = electricity for data centers production in 2010, TWh
- n = 0,1,2,3,…20
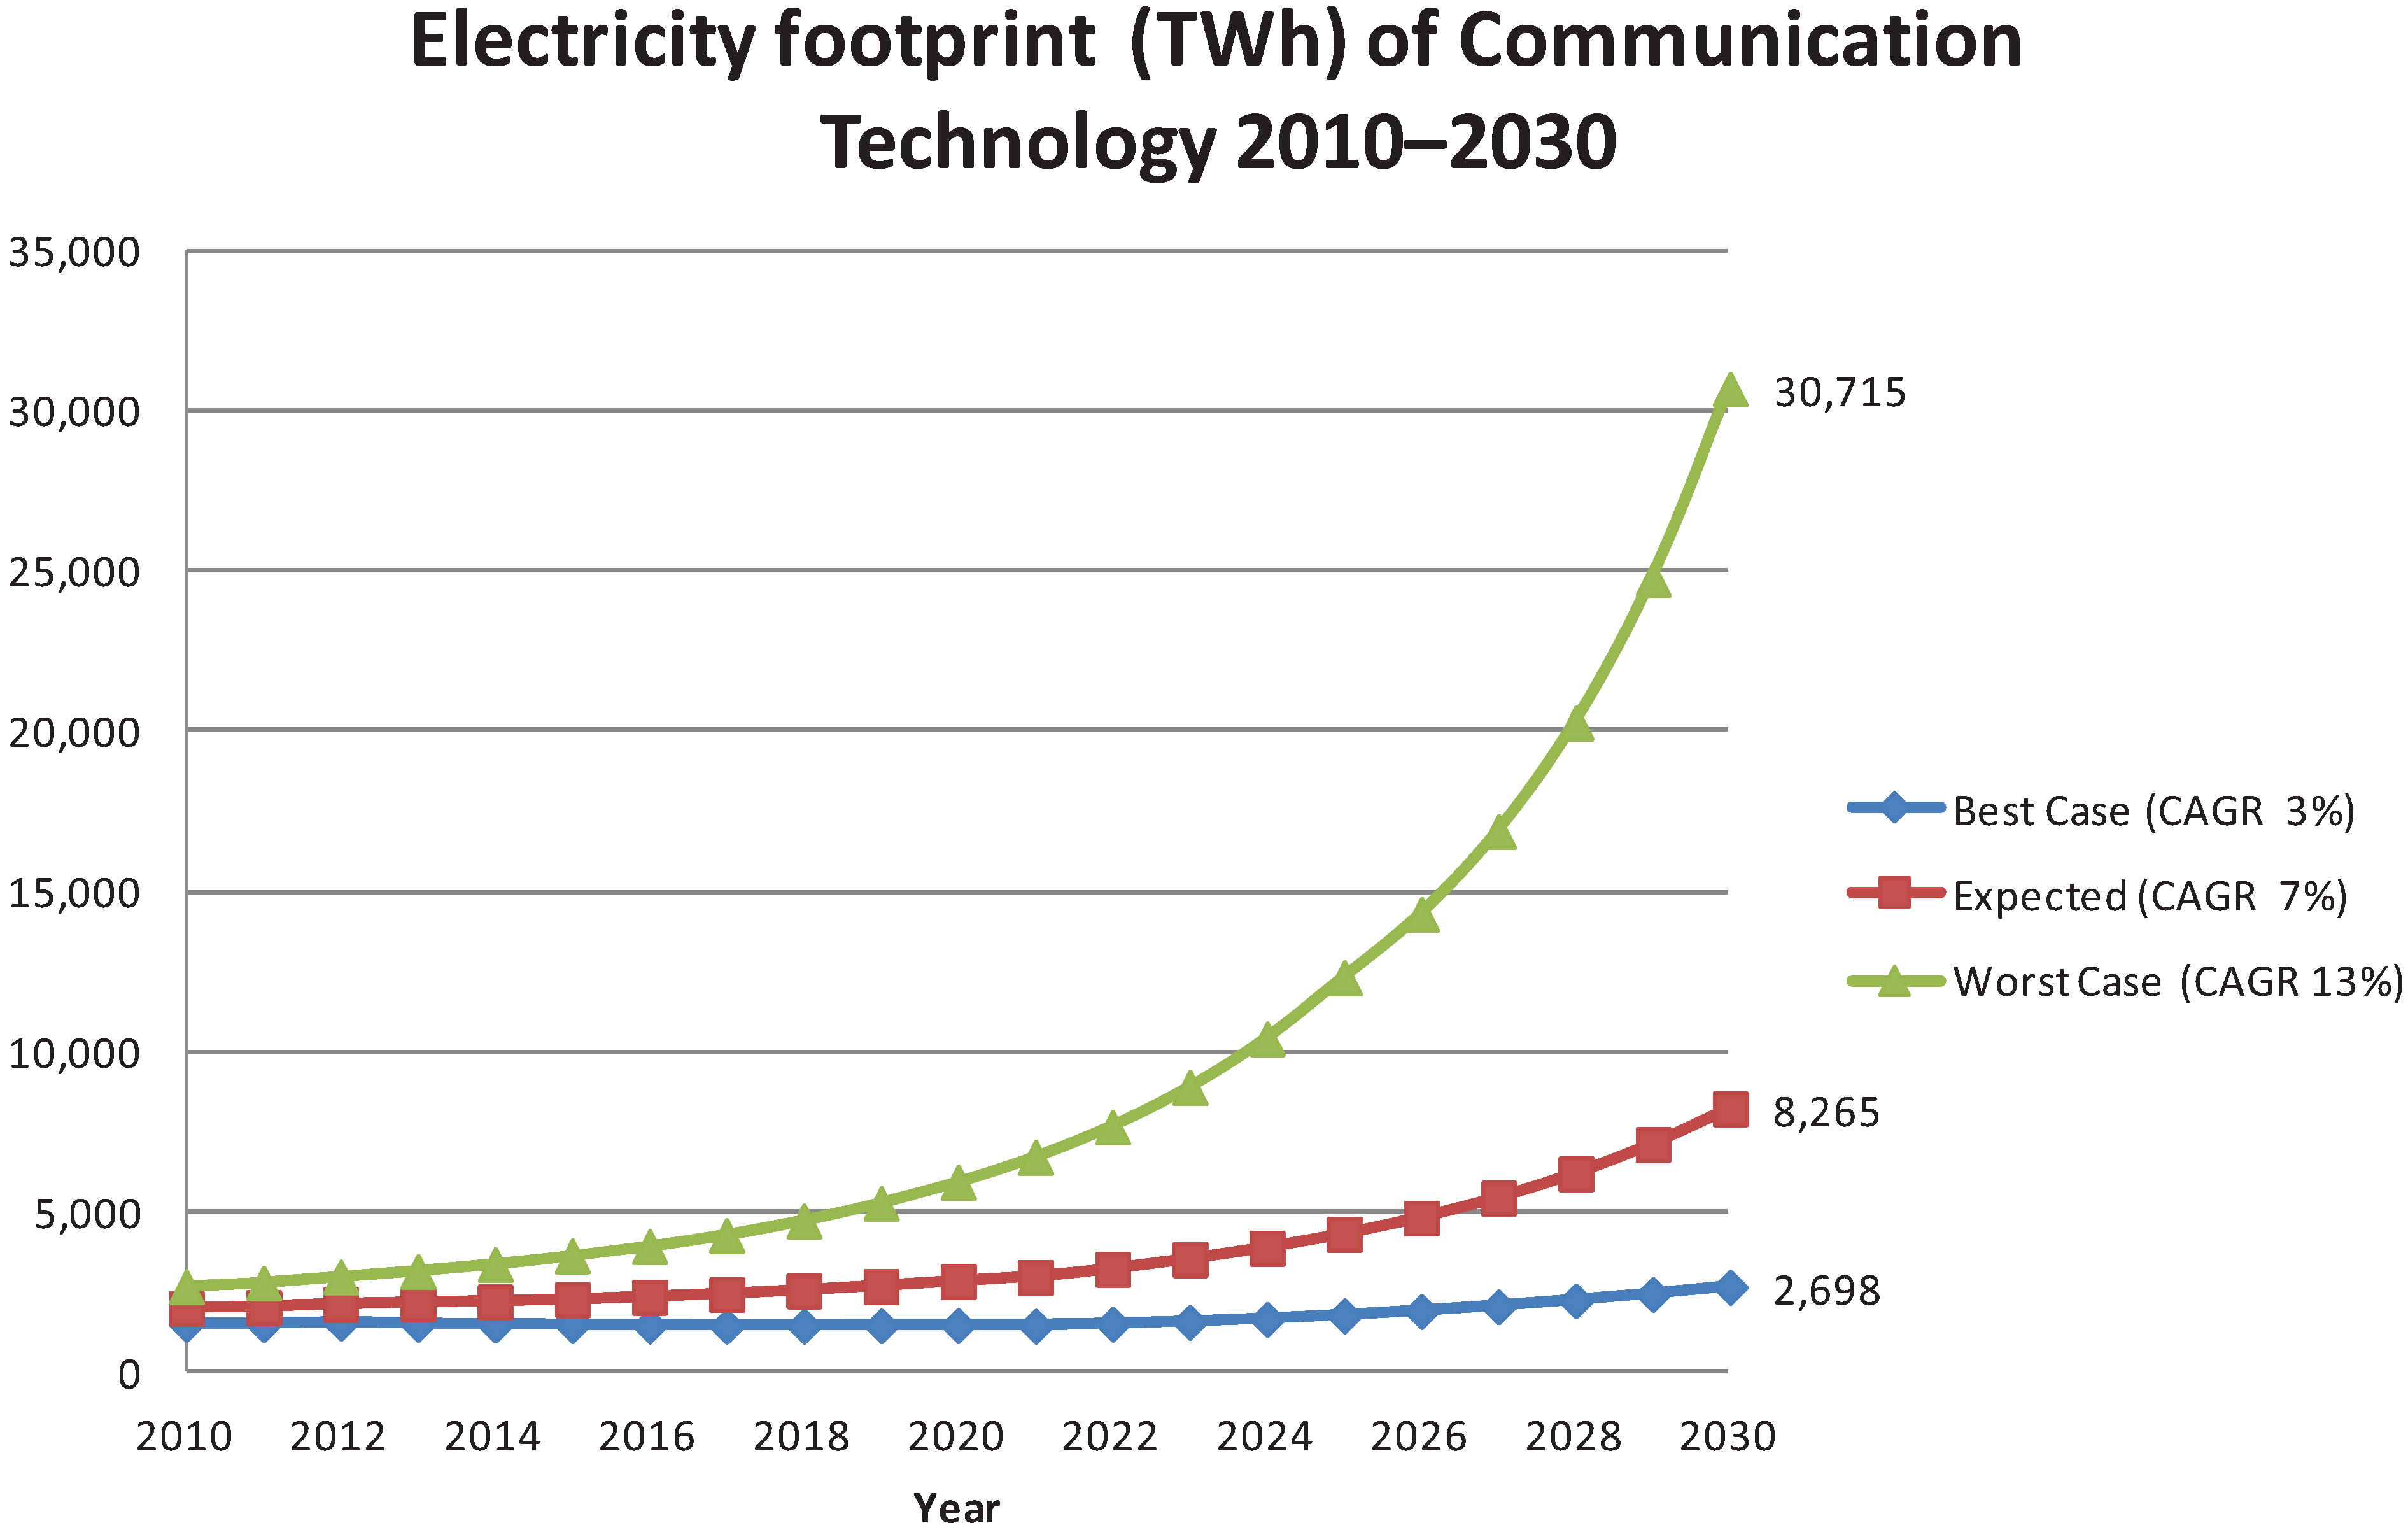
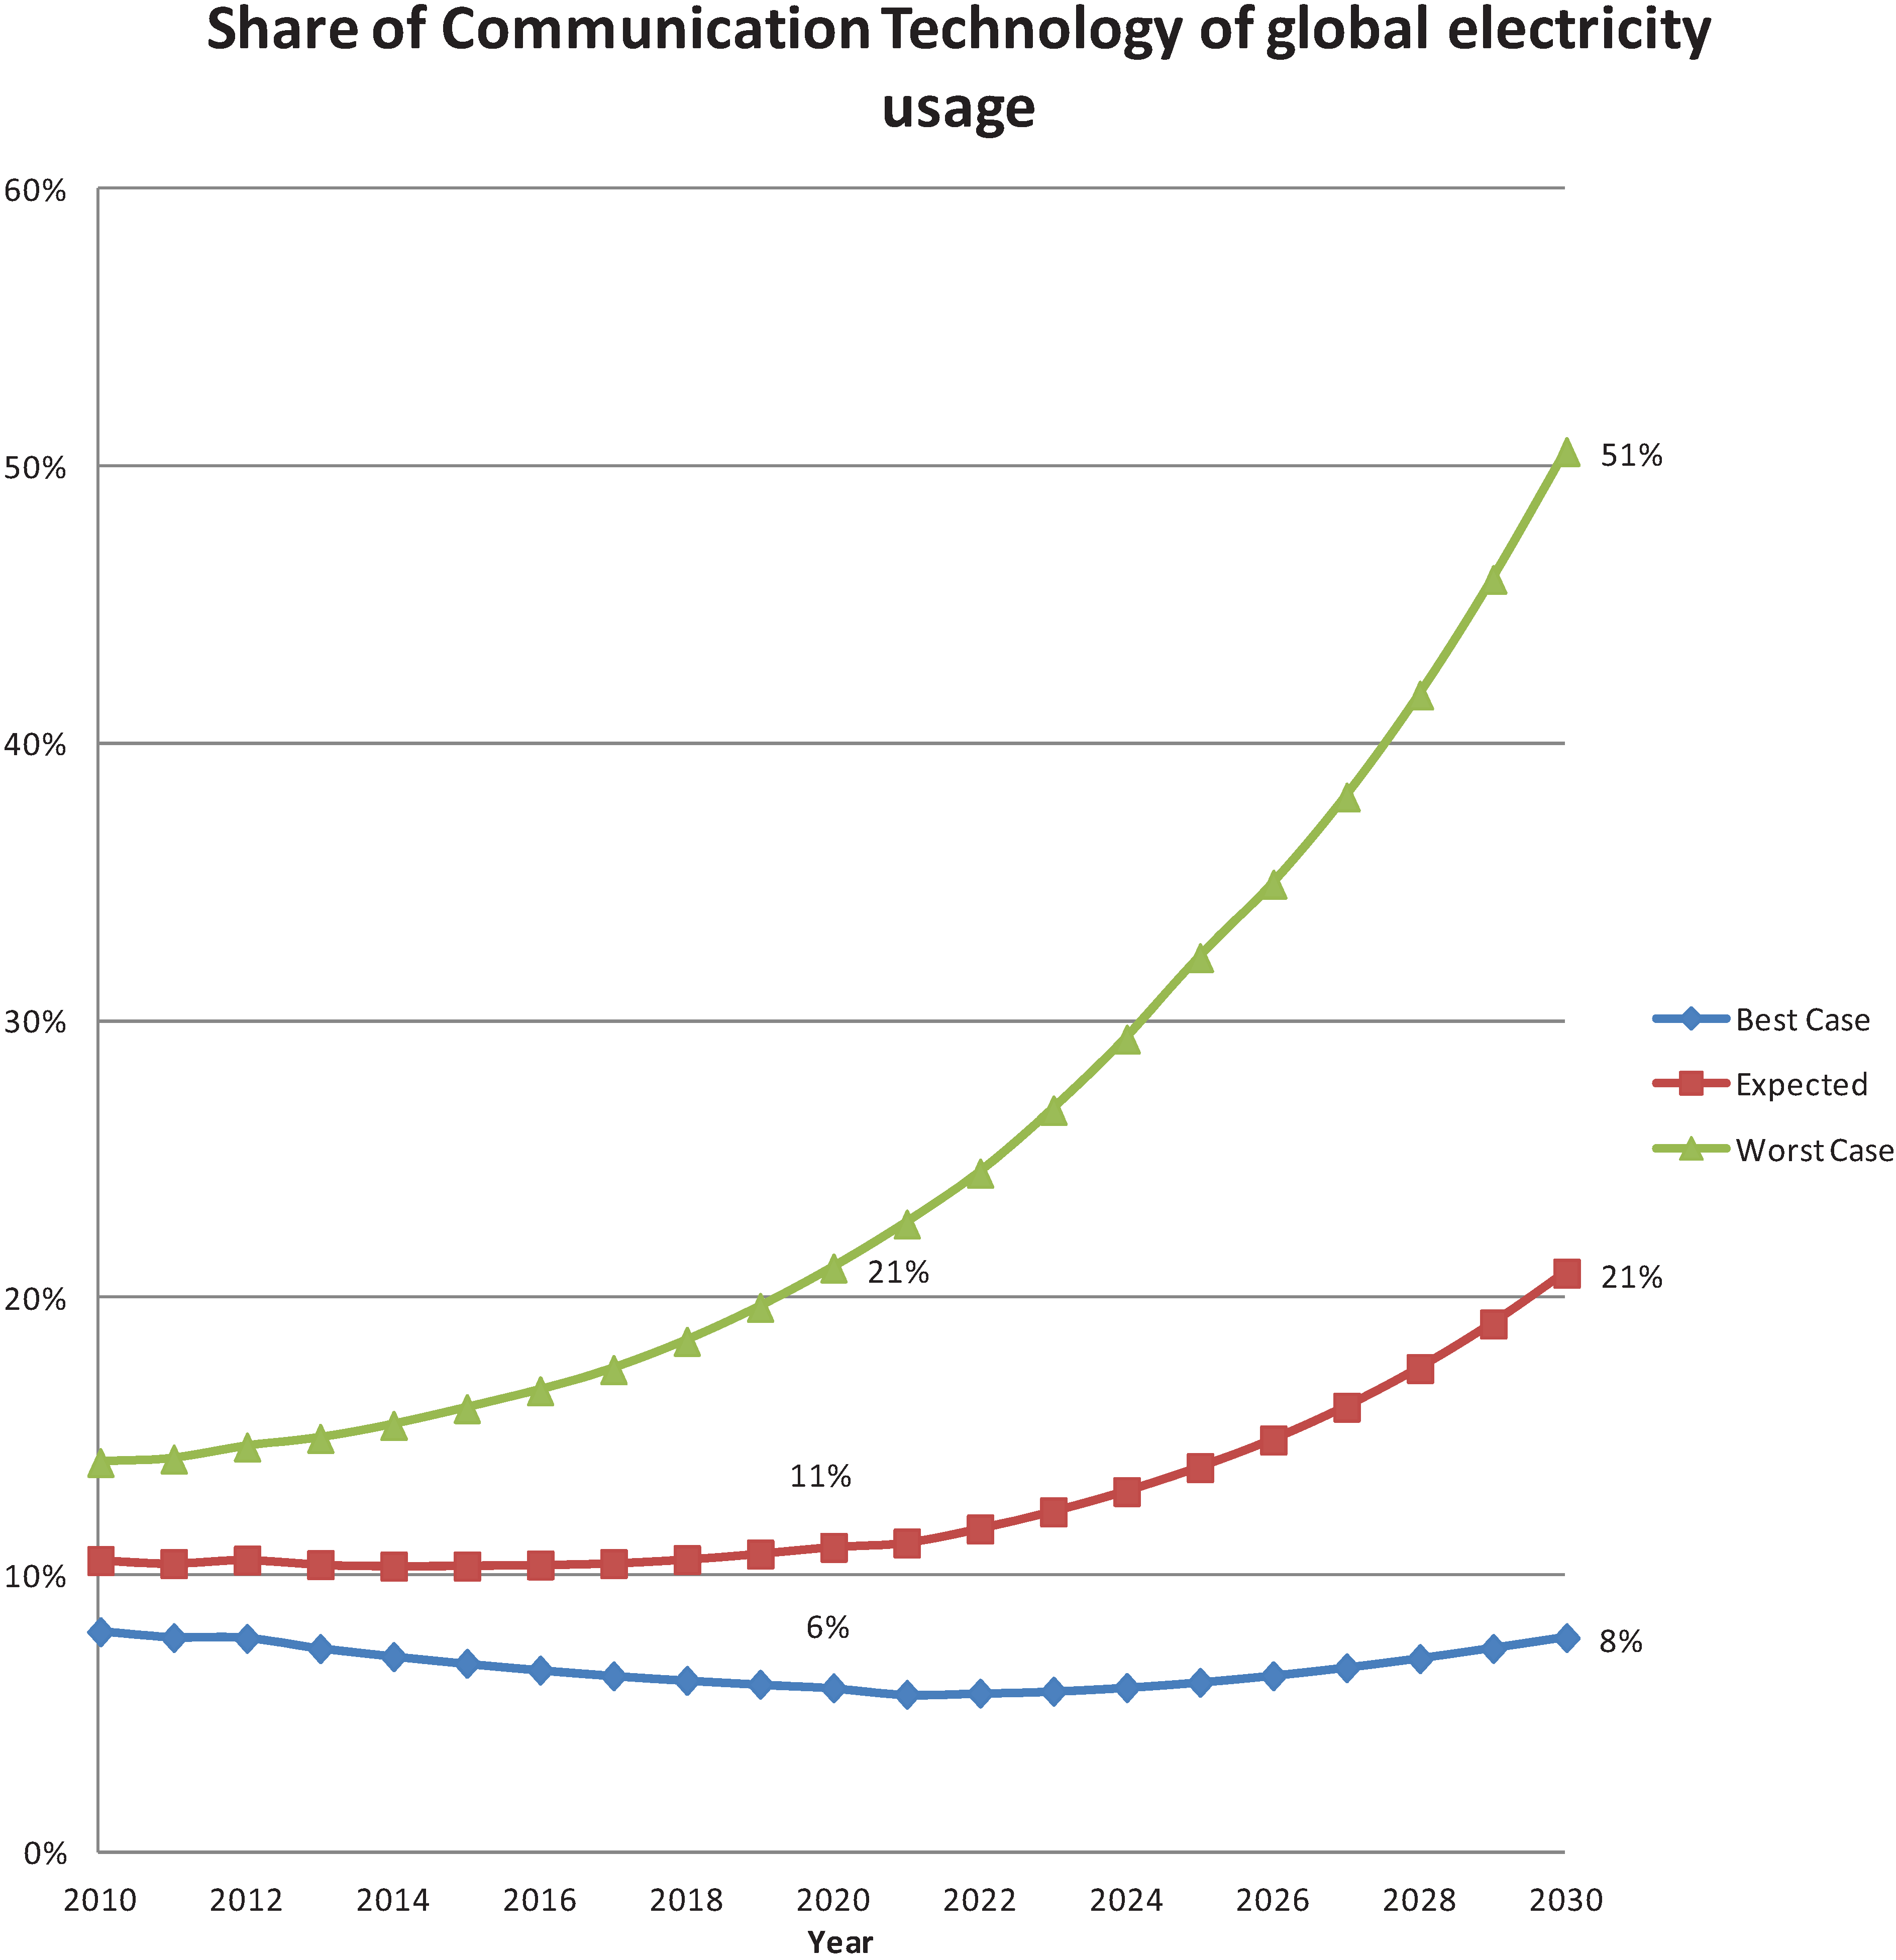
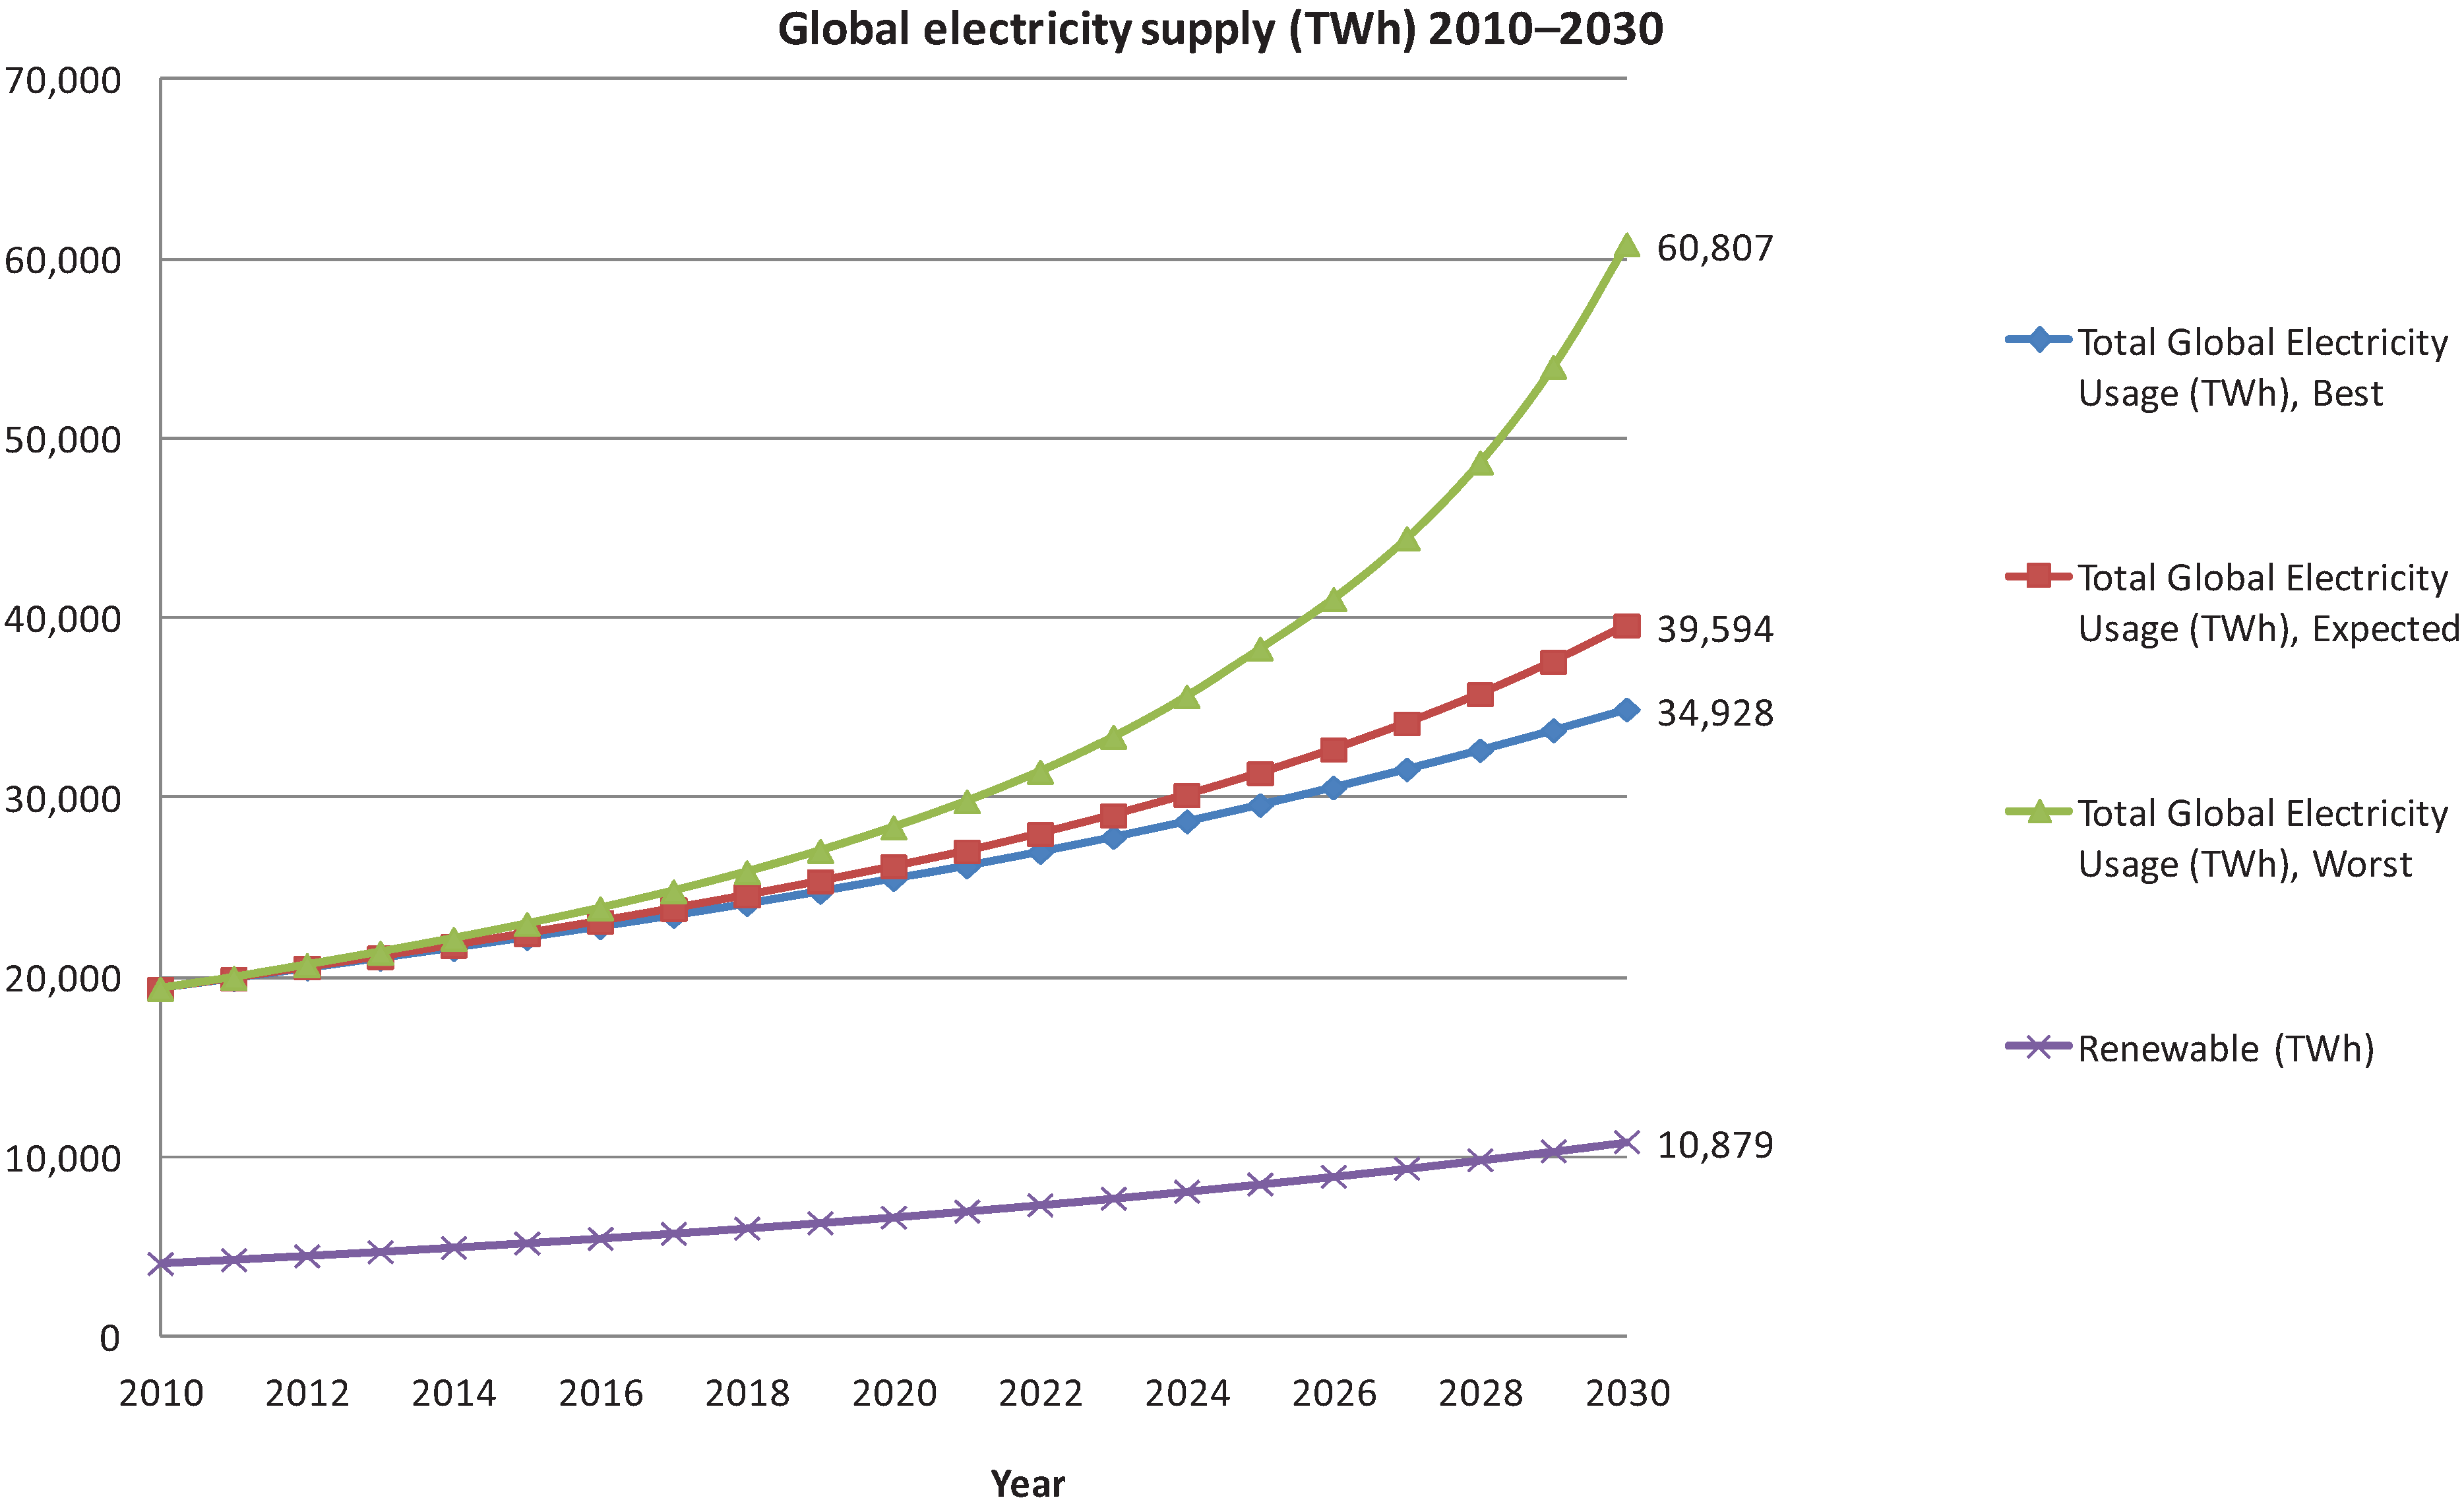
7. Global Electricity Usage
8. Renewable Electricity
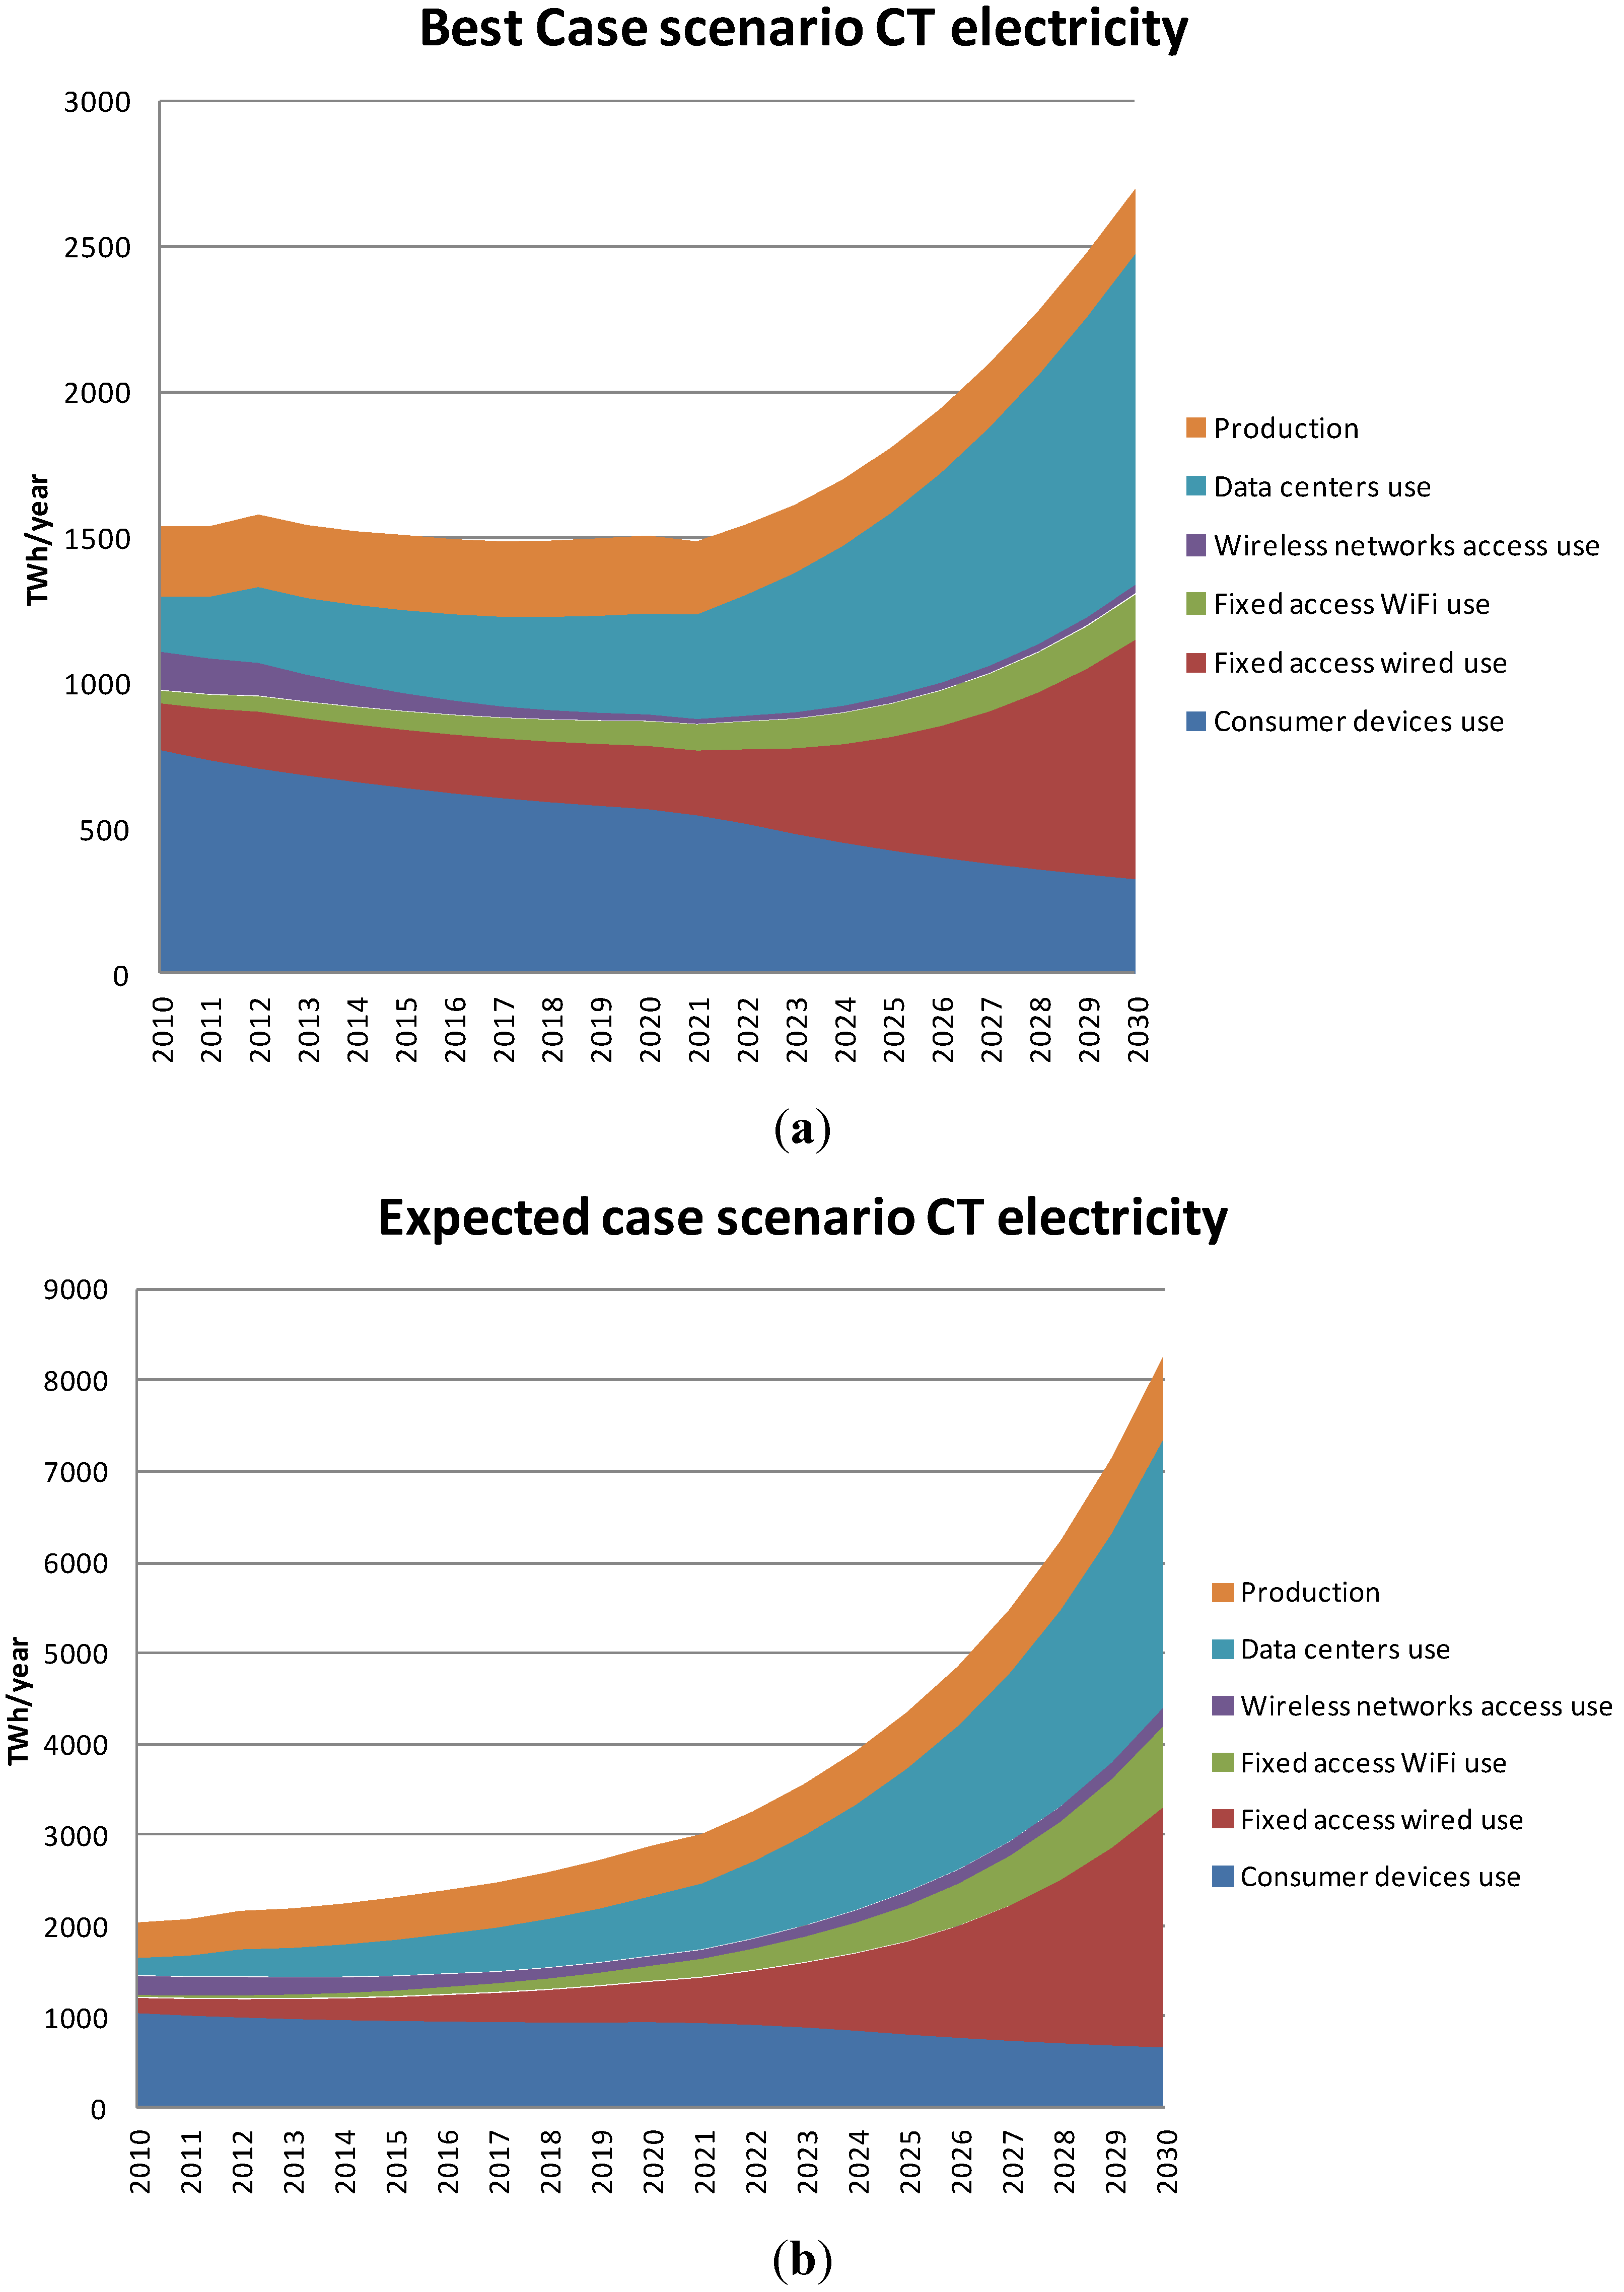
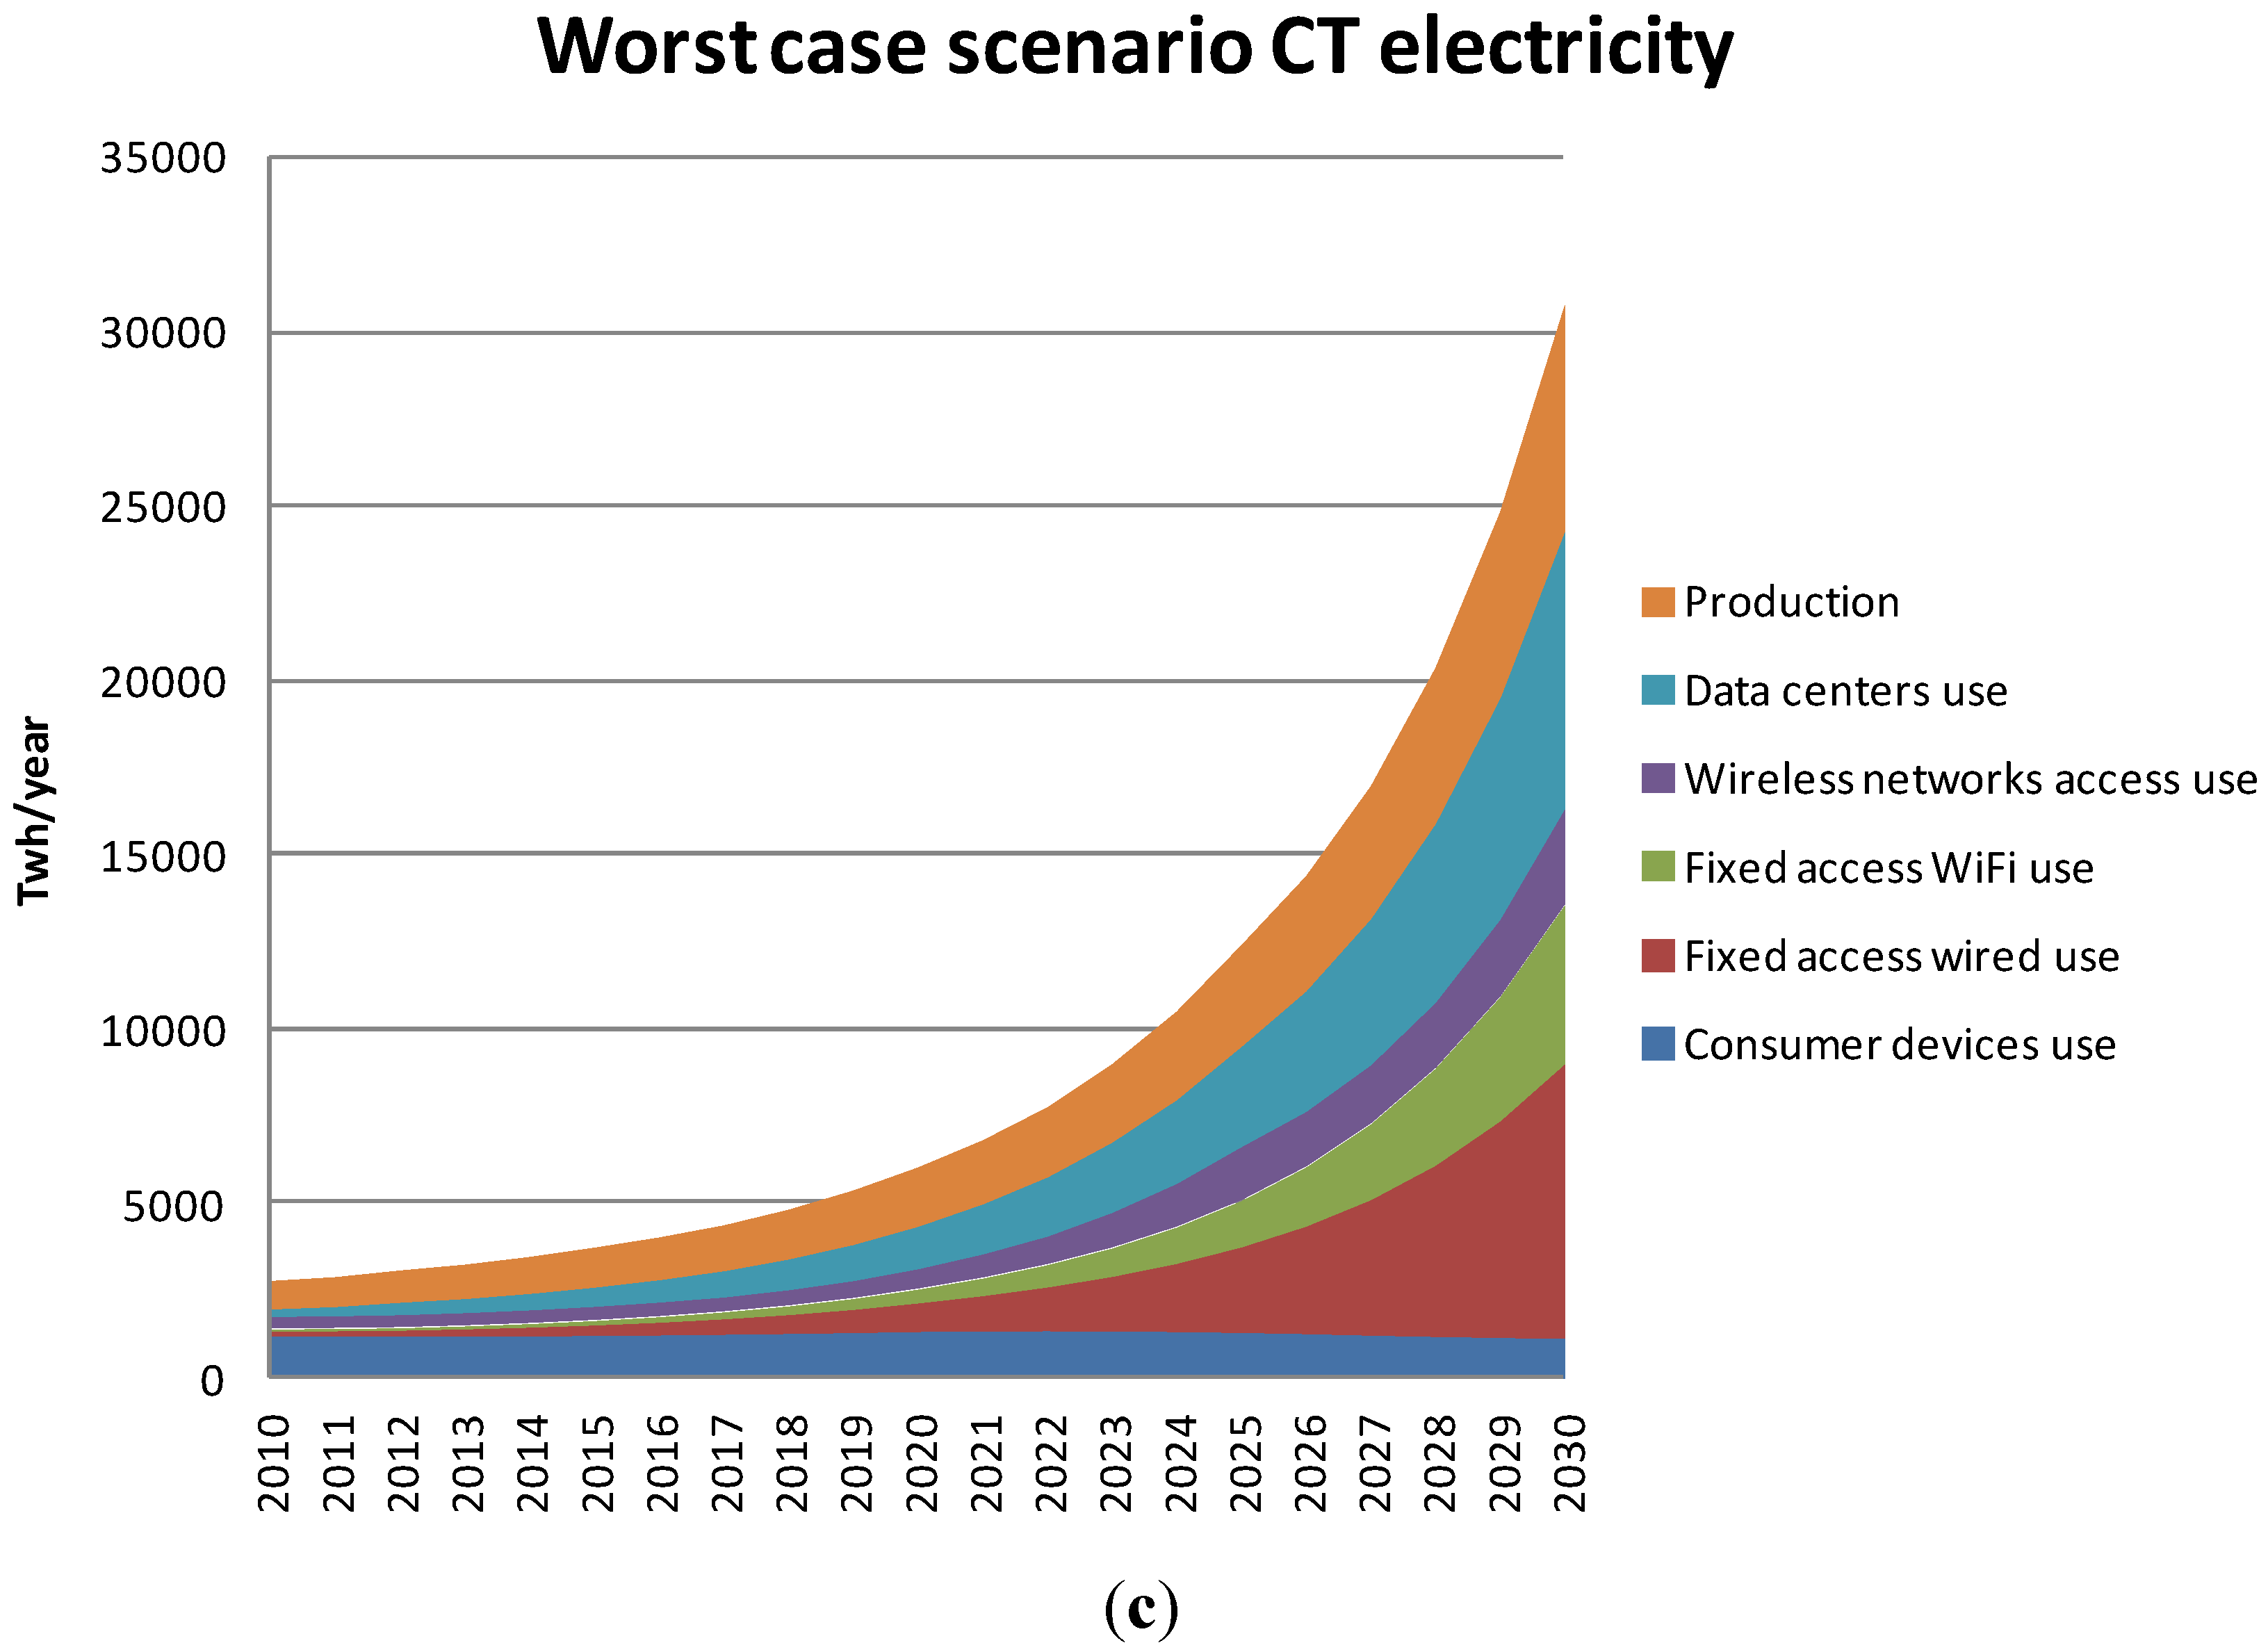
9. Overall Results


10. Discussion
10.1. Battery Electric Vehicles Additional Electricity Usage to the Global Total
10.2. Bottom-Up Estimation of Generated Mobile Data Traffic in 2030
- MDT2030 = global mobile data traffic generated from a consumer device, EB
- SCDS2030 = share of consumer device at hand (e.g. tablet) total mobile consumer devices in use in 2030, %
- TCD2030 = total number of mobile consumer devices in use in 2030, 10.66 billions
- BWS = Bandwidth required for service, Megabits per second
- HCDday = daily hours using service, 1.5 hours.

| Use mode service | SCDS2030 | HCDday | BWS | MDT2030 |
|---|---|---|---|---|
| Tablets for 8K 3D video | 10% | 1.5 | 120 | 28,700 |
| Phablets for 4K 3D video | 30% | 1.5 | 15 | 10,700 |
| Smartphones for 2K video | 10% | 1.5 | 2 | 480 |
| Mobile broadband modems + laptop for 8K 3D video | 2% | 1.5 | 120 | 5,700 |
| Triple play wireless router for 8K 3D video | 2% | 1.5 | 120 | 5,700 |
| SUM | 51,400 EB |
Normalization—Electricity Intensities of Fixed, Wireless and Data Centers
| 2010 (kWh/GB) | 2020 (KWh/GB) | 2030 (KWh/GB) | Reduction of electricity intensity 2030 compared to 2010 | |
|---|---|---|---|---|
| FAN wired | 0.50 | 0.11–0.28 | 0.061–0.17 | 66%–87% |
| FAN Wi-Fi | 0.36 | 0.07–0.17 | 0.014–0.10 | 72%–96% |
| WAN | 6–15 | 0.047–1.04 | 0.002–0.048 | >99% |
| Data centers | 0.13–0.14 | 0.027–0.085 | 0.014–0.051 | 64-89% |
10.3. Improvement of Electricity Efficiency for Electricity Usage and GHG Reduction
- The necessary electricity efficiency for FAN wired in 2030, to keep its electricity usage at the 2015 level, is 0.18 Mbits/J (intensity 0.015 TWh/EB).
- The necessary electricity efficiency for FAN Wi-Fi in 2030, to keep its electricity usage at the 2015 level, is 0.47 Mbits/J (intensity 0.0056 TWh/EB).
- The necessary electricity efficiency for data centers in 2030, to keep the total data center electricity usage at the 2015 level, is 0.66 Mbits/J (intensity 0.004 TWh/EB).
- The necessary electricity efficiency for 5G WAN in 2030, to keep the total wireless electricity usage at the 2020 level, is 2.9 Mbits/J (intensity 8.9 × 10⁻⁴ TWh/EB).
10.4. Renewable Electricity Capacity for Greenhouse Gas Emission Reduction
11. Conclusions
12. Next Steps
- Effect of circular economy business cases, which affect the lifetime of devices.
- Improvement of the production electricity estimation for networks and data centers by using numbers on produced hardware, such as base stations and servers.
- Apart from electricity and climate change, include other indicators for CT, such as primary energy, and eco-environmental impact categories, such as resource depletion and land use.
- Include transportation and end-of-life treatment activities.
- Correlate the findings of this paper with estimations of the amount of electronic waste [204] to be generated until 2030
Acknowledgements
Author Contributions
Conflict of Interest
Supporting Materials
References
- Shapiro, G. America’s comeback starts with American innovators soapbox. IEEE Consum. Electron. Mag. 2012, 1, 19–24. [Google Scholar] [CrossRef]
- Albrecht, K.; Michael, K. Connected: To everyone and everything. IEEE Technol. Soc. Mag. 2013, 32, 31–34. [Google Scholar] [CrossRef]
- Corcoran, P.M.; Desbonnet, J.; Lusted, K. CEBus Network Access via the World-Wide-Web. In Proceedings of IEEE International Conference on Consumer Electronics (ICCE98), Los Angeles, CA, USA, 5–7 June 1998.
- Desbonnet, J.; Corcoran, P.M. System architecture and implementation of a CEBus/Internet gateway. IEEE Trans. Consum. Electron. 1997, 43, 1057–1062. [Google Scholar] [CrossRef] [Green Version]
- Corcoran, P.M. A Three-tier, TCP/IP gateway architecture to link home networks with the Internet. In Proceedings of IEEE International Conference on Consumer Electronics (ICCE98), Los Angeles, CA, United States, 5–7 June 1998.
- Corcoran, P.M. Making home-network appliances to TCP/IP sockets using a three-tiered home gateway architecture. IEEE Trans. Consum. Electron. 1998, 44, 729–736. [Google Scholar] [CrossRef] [Green Version]
- Atzori, L.; Iera, A.; Morabito, G. The internet of things: A survey. Comp. Netw. 2010, 54, 2787–2805. [Google Scholar] [CrossRef]
- Jara, A.J.; Ladid, L.; Skarmeta, A. The Internet of everything through IPv6: An analysis of challenges, solutions and opportunities. J. Wirel. Mob. Netw. Ubiq. Comput. Dependable Appl. 2013, 4, 97–118. [Google Scholar]
- Obaidat, M.; Anpalagan, A.; Woungang, I. (Eds.) Energy-efficient cloud computing—A green migration of traditional IT. In Handbook of Green Information and Communication Systems, 1st ed.; Obaidat, M.; Anpalagan, A.; Woungang, I. (Eds.) Academic Press: Oxford, UK, 2012; pp. 295–329.
- Srikantaiah, S.; Kansal, A.; Zhao, F. Energy aware consolidation for cloud computing. In Proceedings of the Conference on Power aware computing and systems, Berkeley, CA, USA, 7 December 2008.
- Berl, A.; Gelenbe, E.; Di Girolamo, M. Energy-efficient cloud computing. Comp. J. 2010, 53, 1045–1051. [Google Scholar] [CrossRef]
- Greenberg, A.; Hamilton, J. The cost of a cloud: research problems in data center networks. ACM SIGCOMM Comp. Commun. Rev. 2008, 39, 68–73. [Google Scholar] [CrossRef]
- Mcqueen, D. The momentum behind LTE adoption [sG LTE]. IEEE Commun. Mag. 2009, 47, 44–45. [Google Scholar] [CrossRef]
- Marsan, M.A.; Meo, M. Energy efficient wireless Internet access with cooperative cellular networks. Comp. Netw. 2011, 55, 386–398. [Google Scholar] [CrossRef]
- Corcoran, P.M.; Desbonnet, J.; Bigioi, P.; Lupu, I. Home network infrastructure for handheld/wearable appliances. IEEE Trans. Consum. Electron. 2002, 48, 490–495. [Google Scholar] [CrossRef]
- Maga, D.; Hiebel, M.; Knermann, C. Comparison of two ICT solutions: desktop PC versus thin client computing. Int. J. Life Cycle Assess. 2012, 18, 861–871. [Google Scholar] [CrossRef]
- Kudtarkar, P.; DeLuca, T.; Fusaro, V.; Tonellato, P.; Wall, D. Cost-effective cloud computing: A case study using the comparative genomics tool, roundup. Evol. Bioinform. Online 2010, 6, 197. [Google Scholar] [PubMed]
- Mihailescu, M.; Teo, Y. Dynamic resource pricing on federated clouds. In Proceedings of 10th IEEE/ACM International Conference on Cluster, Cloud and Grid Computing (CCGrid), Melbourne, Australia, 17–20 May 2010.
- Buyya, R.; Beloglazov, A.; Abawajy, J. Energy-efficient management of data center resources for cloud computing: A vision, architectural elements, and open challenges. 2010. Available online: http://arxiv.org/abs/1006.0308 (accessed on 9 April 2015).
- Baliga, J.; Ayre, R. Green cloud computing: Balancing energy in processing, storage, and transport. Proc. IEEE 2011, 99, 149–167. [Google Scholar] [CrossRef]
- Global e-Sustainability Initiative. 2012. Available online: http://gesi.org/assets/js/lib/tinymce/jscripts/tiny_mce/plugins/ajaxfilemanager/uploaded/SMARTer 2020 - The Role of ICT in Driving a Sustainable Future - December 2012._2.pdf (accessed on 9 April 2015).
- European Commission. 2014. Available online: http://ec.europa.eu/information_society/newsroom/cf/dae/document.cfm?doc_id = 6917 (accessed on 9 April 2015).
- New Climate Economy. 2014. Available online: http://newclimateeconomy.report/ (accessed on 9 April 2015).
- Kamilaris, A.; Tofis, Y.; Bekara, C.; Pitsillides, A.; Kyriakides, E. Integrating web-enabled energy-aware smart homes to the smart grid. Int. J. Adv. Intell. Syst. 2012, 5, 15–31. [Google Scholar]
- Mirabella, N.; Rigamonti, L.; Scalbi, S. Life cycle assessment of information and communication technology application: A case study of dematerialization in the Italian public administration. J. Clean. Product. 2013, 44, 115–122. [Google Scholar] [CrossRef]
- Ong, D.; Moors, T.; Sivaraman, V. Comparison of the energy, carbon and time costs of videoconferencing and in-person meetings. Comp. Commun. 2014, 50, 86–94. [Google Scholar] [CrossRef]
- Malmodin, J.; Bergmark, P.; Lövehagen, N.; Ercan, M.; Bondesson, A. Considerations for macro-level studies of ICTs enabling potential. In Proceedings of ICT4S, Stockholm, Sweden, 24–27 August 2014.
- Chavanne, X.; Schinella, S.; Marquet, D.; Frangi, J.P.; Le Masson, S. Electricity consumption of telecommunication equipment to achieve a telemeeting. Appl. Energy 2015, 137, 273–281. [Google Scholar] [CrossRef]
- Bianco, C.; Torrelli, A.; Squizzato, V.; Andrae, A.S.G.; Gemma, P. Energy and carbon pay back times for renewable power supply systems for Italian RBS off-grid sites. In Proceedings of IEEE 33rd International Telecommunications Energy Conference (INTELEC), Amsterdam, The Netherlands, 9–13 October 2011.
- Andrae, A.S.G.; Dong, H.; Shudong, L.; Belfqih, M.; Gerber, E. Added value of life cycle assessment to a business case analysis of a photovoltaic/wind radio base site solution in South Africa. In Proceedings of IEEE 34th International Telecommunications Energy Conference (INTELEC), Scottdale, AZ, USA, 30 September–3 October 2012.
- Kultur, B. KTH:s Publikationsdatabas DiVA. 2013. Available online: http://kth.diva-portal.org/smash/get/diva2:645938/FULLTEXT01.pdf (accessed on 9 April 2015).
- Andrae, A.S.G.; Andersen, O. Life cycle assessment of integrated circuit packaging technologies. Int. J. Life Cycle Assess. 2011, 16, 258–267. [Google Scholar] [CrossRef]
- Sikdar, B. A study of the Environ.al impact of wired and wireless local area network access. IEEE Trans. Consum. Electron. 2013, 59, 85–92. [Google Scholar] [CrossRef]
- Sloma, M. Carbon footprint of electronic devices. In Proceedings of SPIE Electron Technology Conference, Ryn, Poland, 16 April 2013; Volume 8902. [CrossRef]
- European Telecommunication Standards Institute. 2011. Available online: http://www.etsi.org/deliver/etsi_ts/103100_103199/103199/01.01.01_60/ts_103199v010101p.pdf (accessed on 9 April 2015).
- European Telecommunication Standards Institute. 2014. Available online: http://www.etsi.org/deliver/etsi_es/203100_203199/203199/01.02.01_60/es_203199v010201p.pdf. (accessed on 9 April 2015).
- Pickavet, M.; Vereecken, W.; Demeyer, S.; Audenaert, P.; Vermeulen, B.; Develder, C.; Colle, D.; Dhoedt, B.; Demeester, P. Worldwide energy needs for ICT: The rise of power-aware networking. In Proceedings of 2nd International Symposium on Advanced Networks and Telecommunication Systems, Mumbai, India, 15–17 December 2008.
- Malmodin, J.; Moberg, Å.; Lundén, D.; Finnveden, G.; Lövehagen, N. Greenhouse gas emissions and operational electricity use in the ICT and entertainment & media sectors. J. Ind. Ecol. 2010, 14, 770–790. [Google Scholar] [CrossRef]
- Fehske, A.; Fettweis, G.; Malmodin, J.; Biczok, G. The global footprint of mobile communications: The ecological and economic perspective. IEEE Commun. Mag. 2011, 49, 55–62. [Google Scholar] [CrossRef]
- Corcoran, P.M. Cloud computing and consumer electronics: A perfect match or a hidden storm? IEEE Consum. Electron. Mag. 2012, 1, 14–19. [Google Scholar] [CrossRef]
- Lambert, S.; Van Heddeghem, W.; Vereecken, W.; Lannoo, B.; Colle, D.; Pickavet, M. Worldwide electricity consumption of communication networks. Opt. Express 2012, 20, B513–B524. [Google Scholar] [CrossRef] [PubMed]
- Tucker, R.S.; Hinton, K.; Ayre, R. University of Melbourne. 2012. Available online: http://people.eng.unimelb.edu.au/rtucker/talks/files/Tucker_ECOC_Tutorial.pdf (accessed on 9 April 2015).
- Corcoran, P.M.; Andrae, A.S.G. Emerging Trends in Electricity Consumption for Consumer ICT. 2013. Available online: http://aran.library.nuigalway.ie/xmlui/handle/10379/3563 (accessed on 9 April 2015).
- Ishii, K.; Okazaki, F.; Kurumida, J.; Mizutani, K.; Takeshita, H.; Kobayashi, K.; Kudoh, T. Unified aroach of top-down and bottom-up methods for estimating network energy consumption. In Proceedings of 39th European Conference and Exhibition on Optical Communication (ECOC 2013), London, UK, 22–26 September 2013.
- Malmodin, J.; Bergmark, P.; Lundén, D. The future carbon footprint of the ICT and E&M sectors. In Proceedings of ICT4S, Zurich, Switzerland, 2–4 February 2013.
- Malmodin, J. European Telecommunication Standards Institute. 2013. Available online: http://docbox.etsi.org/Workshop/2013/201310_EEWORKSHOP/S05_Environ.alImpactAssessmentsofICT/ERICSSON_Malmodin.pdf (accessed on 9 April 2015).
- Mills, M.P. The Cloud Begins With Coal. 2013. Available online: http://www.tech-pundit.com/wp-content/uploads/2013/07/Cloud_Begins_With_Coal.pdf. (accessed on 9 April 2015).
- GreenTouch. Available online: http://www.greentouch.org/uploads/documents/GreenTouch_Green_Meter_Research_Study_26_June_2013.pdf (accessed on 9 April 2015).
- Van Heddeghem, W.; Lambert, S.; Lannoo, B.; Colle, D.; Pickavet, M.; Demeester, P. Trends in worldwide ICT electricity consumption from 2007 to 2012. Comp. Commun. 2014, 50, 64–76. [Google Scholar] [CrossRef]
- Van Heddeghem, W.; Lambert, S.; Vereecken, W.; Lannoo, B.; Colle, D.; Demeester, P.; Pickavet, M. Modelling of the worldwide electricity consumption of ICT. In Proceedings of MMB & DFT, Bamberg, Germany, 17–19 March 2014.
- Kuroda, K.; Kishita, Y.; Yamaguchi, Y.; Umeda, Y.; Hara, M.; Oka, H.; Nakamura, J. Scenario Analysis of the electricity consumption in the Japanese information and communications sector toward green of ICT. In Proceedings of Going Green CARE Innovation, Vienna, Austria, 18–20 November 2014.
- Tucker, R.S. Towards an energy-efficient Internet. In Proceedings of Optical Instrumentation for Energy and Environ.al Applications, Canberra, Australia, 2–5 December 2014.
- Malmodin, J.; Lundén, D.; Moberg, Å.; Andersson, G.; Nilsson, M. Life cycle assesment of ICT: carbon footprint and operational electricity use from the operator, national, and subscriber perspective in Sweden. J. Ind. Ecol. 2014, 18, 829–845. [Google Scholar] [CrossRef]
- Corcoran, P.M.; Andrae, A.S.G. On thin-clients and the cloud; can smartphones and tablets really reduce electricity consumption? In Proccedings of 2014 IEEE International Conference on Consumer Electronics (ICCE); Las Vegas, NA, USA: 10–13 January 2014, 2014. [Google Scholar]
- Alcatel-Lucent. 2015. Available online: https://media-bell-labs-com.s3.amazonaws.com/pages/20150114_1907/GWATT_WhitePaper.pdf (accessed on 9 April 2015).
- Aebischer, B.; Hilty, L.M. The energy demand of ICT: A historical perspective and current methodological challenges. In ICT Innovations for Sustainability, 1st ed.; Aebischer, B., Hilty, L.M., Eds.; Springer International Publishing: Berlin, Germany, 2015; Volume 1, pp. 71–103. [Google Scholar]
- Baliga, J.; Hinton, K.; Ayre, R.; Tucker, R.S. Carbon footprint of the Internet. TeleCommun. J. Austr. 2009, 59, 5.1–5.14. [Google Scholar]
- Hinton, K.; J. Baliga, J.; Feng, M. Power consumption and energy efficiency in the Internet. IEEE Netw. 2011, 25, 6–12. [Google Scholar]
- Dagher, J.C.; Marcellin, M.W.; Neifeld, M.A. A theory for maximizing the lifetime of sensor networks. IEEE Trans. Commun. 2007, 55, 323–332. [Google Scholar] [CrossRef]
- Telecom Italia Group. 2013. Available online: http://www.telecomitalia.com/tit/en/sustainability/sustainability-report.html (accessed on 9 April 2015).
- Telecom Italia Group. 2014. Available online: http://www.telecomitalia.com/content/dam/telecomitalia/en/archive/documents/sustainability/sustainability_reports/2013/Bilancio-Sostenibilita-2013-ENG.pdf (accessed on 9 April 2015).
- Paya, A.; Marinescu, D. Energy-aware load balancing and application scaling for the cloud ecosystem. In Proceedings of 2014 IEEE International Parallel & Distributed Processing Symposium Workshops (IPDPSW), Phoenix, NA, USA, 19–23 May 2014.
- Hischier, R.; Wäger, P.A. The Transition from desktop computers to tablets: A model for increasing resource efficiency? In ICT Innovations for Sustainability, 1st ed.; Aebischer, B., Hilty, L.M., Eds.; Springer International Publishing: Berlin, Germany, 2015; Volume 1, pp. 243–256. [Google Scholar]
- Andrae, A.S.G. Method based on market changes for improvement of comparative attributional life cycle assessments. Int. J. Life Cycle Assess. 2015, 20, 263–275. [Google Scholar] [CrossRef]
- Business Insider. 2012. Available online: http://210.48.31.36/clients/TheFutureOfMobile[DECK].pdf (accessed on 9 April 2015).
- Gartner. 2014. Available online: http://www.gartner.com/newsroom/id/2791017 (accessed on 9 April 2015).
- Somavat, P.; Namboodiri, V. Energy consumption of personal computing including portable communication devices. J. Green Eng. 2011, 1, 447–475. [Google Scholar]
- Consumer Electronics Association. 2011. Available online: http://www.ce.org/CorporateSite/media/Government-Media/Green/Energy-Consumption-of-CE-in-U-S-Homes-in-2010.pdf (accessed on 9 April 2015).
- Consumer Electronics Association. 2014. Available online: http://www.ce.org/CorporateSite/media/Environ./Energy-Consumption-of-Consumer-Electronics.pdf (accessed on 9 April 2015).
- Tasaki, T.; Motoshita, M.; Uchida, H.; Suzuki, Y. Assessing the replacement of electrical home appliances for the Environment. J. Ind. Ecol. 2014, 17, 290–298. [Google Scholar] [CrossRef]
- Andrae, A.S.G.; Andersen, O. Life cycle assessments of consumer electronics—Are they consistent? Int. J. Life Cycle Assess. 2010, 15, 827–836. [Google Scholar] [CrossRef]
- Teehan, P.; Kandlikar, M. Sources of variation in life cycle assessments of desktop computers. J. Ind. Ecol. 2012, 16, S182–S194. [Google Scholar] [CrossRef]
- Andrae, A.S.G. Comparative micro life cycle assessment of physical and virtual desktops in a cloud computing network with consequential, efficiency, and rebound considerations. J. Green Eng. 2013, 3, 193–218. [Google Scholar]
- Andrae, A.S.G.; Vaija, M.S. To which degree does sector specific standardization make life cycle assessments comparable?—The case of global warming potential of smartphones. Challenges 2014, 5, 409–429. [Google Scholar] [CrossRef]
- Moberg, Å.; Borggren, C.; Ambell, C.; Finnveden, G.; Guldbrandsson, F.; Bondesson, A.; Malmodin, J.; Bergmark, P. Simplifying a life cycle assessment of a mobile phone. Int. J. Life Cycle Assess. 2014, 19, 979–993. [Google Scholar] [CrossRef]
- Displaysearch. 2013. Available online: http://www.displaysearch.com/cps/rde/xchg/displaysearch/hs.xsl/121023_global_tv_demand_expected_to_be_flat_in_2013.asp (accessed on 9 April 2015).
- Park, W.Y.; Phadke, A.; Shah, N.; Letschert, V. Efficiency improvement opportunities in TVs: Implications for market transformation programs. Energy Policy 2013, 59, 361–372. [Google Scholar] [CrossRef]
- Osman, N.I.; El-Gorashi, T.; Krug, L.; Elmirghani, J.M. Energy-efficient future high-definition TV. J. Lightwave Technol. 2014, 32, 2364–2381. [Google Scholar] [CrossRef]
- Hischier, R. Life cycle assessment study of a field emission display television device. Int. J. Life Cycle Assess. 2015, 20, 61–73. [Google Scholar] [CrossRef]
- Huulgaard, R.D.; Dalgaard, R.; Merciai, S. Ecodesign requirements for televisions—Is energy consumption in the use phase the only relevant requirement? Int. J. Life Cycle Assess. 2013, 18, 1098–1105. [Google Scholar] [CrossRef]
- Webb, A.; Mayers, K.; France, C.; Koomey, J. Estimating the energy use of high definition games consoles. Energy Policy 2013, 61, 1412–1421. [Google Scholar] [CrossRef]
- Hittinger, E.; Mullins, K.A.; Azevedo, I.L. Electricity consumption and energy savings potential of video game consoles in the United States. Energy Effic. 2012, 5, 531–545. [Google Scholar] [CrossRef]
- Effenberger, F.J.; Kani, J.I.; Maeda, Y. Standardization trends and prospective views on the next generation of broadband optical access systems. IEEE J. Sel. Areas Commun. 2010, 28, 773–780. [Google Scholar] [CrossRef]
- Vereecken, W.; Van Heddeghem, W.; Deruyck, M.; Puype, B.; Lannoo, B.; Joseph, W.; Demeester, P. Power consumption in telecommunication networks: overview and reduction strategies. IEEE Commun. Mag. 2011, 49, 62–69. [Google Scholar] [CrossRef]
- Baliga, J.; Ayre, R. Energy consumption in wired and wireless access networks. IEEE Commun. Mag. 2011, 49, 70–77. [Google Scholar] [CrossRef]
- Kilper, D.C.; Atkinson, G.; Korotky, S.K.; Goyal, S.; Vetter, P.; Suvakovic, D.; Blume, O. Power trends in communication networks. IEEE J. Sel. Top. Quantum Electron. 2011, 17, 275–284. [Google Scholar] [CrossRef]
- Aleksic, S. Analysis of power consumption in future high-capacity network nodes. IEEE/OSA J. Opt. Commun. Netw. 2009, 1, 245–258. [Google Scholar] [CrossRef]
- Cisco. 2013. Available online: http://newsroom.cisco.com/release/1197391/ (accessed on 9 April 2015).
- Dharmaweera, M.N.; Parthiban, R.; Sekercioglu, Y.A. Towards a power-efficient backbone network: The state of research. IEEE Commun. Surv. Tutor. 2014, 99, 1–30. [Google Scholar]
- Addis, B.; Capone, A.; Carello, G.; Gianoli, L.G.; Sansò, B. On the energy cost of robustness and resiliency in IP networks. Comp. Netw. 2014, 75, 239–259. [Google Scholar] [CrossRef]
- Tzanakaki, A.; Katrinis, K.; Politi, T.; Stavdas, A.; Pickavet, M.; Van Daele, P.; Simeonidou, D.; O'Mahony, M.; Aleksic?, S.; Wosinska, L.; Monti, P. Dimensioning the future pan-European optical network with energy efficiency considerations. J. Opt. Commun. Netw. 2011, 3, 272–280. [Google Scholar] [CrossRef]
- Zhang, Y.; Chowdhury, P.; Tornatore, M.; Mukherjee, B. Energy efficiency in telecom optical networks. IEEE Commun. Surv. Tutor. 2010, 12, 441–458. [Google Scholar] [CrossRef]
- Baliga, J.; Ayre, R.; Hinton, K.; Sorin, W.V.; Tucker, R.S. Energy consumption in optical IP networks. J. Lightwave Technol. 2009, 27, 2391–2403. [Google Scholar] [CrossRef]
- Van Heddeghem, W.; Idzikowski, F.; Vereecken, W.; Colle, D.; Pickavet, M.; Demeester, P. Power consumption modeling in optical multilayer networks. Photonic Netw. Commun. 2012, 24, 86–102. [Google Scholar] [CrossRef]
- Shi, L. Saving energy in long-reach broadband access networks: architectural aroaches. IEEE Commun. Mag. 2013, 51, S16–S21. [Google Scholar] [CrossRef]
- Hinton, K.; Jalali, F.; Matin, A. Energy consumption modelling of optical networks. Photonic Netw. Commun. 2015, 29, 1–13. [Google Scholar] [CrossRef]
- Van Heddeghem, W.; Lannoo, B.; Colle, D.; Pickavet, M.; Demeester, P. A quantitative survey of the power saving potential in IP-over-WDM backbone networks. IEEE Commun. Surv. Tutor. 2014, 99. [Google Scholar] [CrossRef]
- Malmodin, J.; Lundén, D.; Nilsson, M.; Andersson, G. LCA of data transmission and IP core networks. In Proceedings of Electronics Goes Green 2012+(EGG), Berlin, Germany, 4–7 September 2012.
- Coroama, V.C.; Hilty, L.M.; Heiri, E.; Horn, F.M. The direct energy demand of internet data flows. J. Ind. Ecol. 2013, 17, 680–688. [Google Scholar]
- Verizon Communications. 2012. Available online: http://www.verizon.com/about/sites/default/files/2012-verizon-corporate-responsibility-supplement.pdf (accessed on 9 April 2015).
- Schien, D.; Preist, C. Approaches to energy intensity of the internet. IEEE Commun. Mag. 2014, 52, 130–137. [Google Scholar] [CrossRef]
- PCWorld. 2015. Available online: http://www.pcworld.com/article/2887275/intel-moores-law-will-continue-through-7nm-chips.html (accessed on 9 April 2015).
- Time. 2012. Available online: http://techland.time.com/2012/05/01/the-collapse-of-moores-law-physicist-says-its-already-happening/ (accessed on 9 April 2015).
- Gozalvez, J. Wireless connections surpass 6 billion mark. IEEE Vehicular Technol. Mag. 2012, 7, 13–17. [Google Scholar] [CrossRef]
- Ericsson. 2014. Available online: http://www.ericsson.com/res/docs/2014/ericsson-mobility-report-june-2014.pdf (accessed on 9 April 2015).
- METIS. 2014. Available online: https://www.metis2020.com/wp-content/uploads/deliverables/METIS_D6.2_v1.pdf (accessed on 9 April 2015).
- Cisco. 2014. Available online: http://www.cisco.com/c/en/us/solutions/collateral/service-provider/visual-networking-index-vni/white_paper_c11-520862.html (accessed on 9 April 2015).
- Bonvoisin, J.; Lelah, A.; Mathieux, F.; Brissaud, D. Environ.al impact assessment model for wireless sensor networks. In Glocalized Solutions for Sustainability in Manufacturing, 1st ed.; Hesselbach, J., Herrmann, C., Eds.; Springer: Berlin, Germany, 2011; Volume 1, pp. 124–129. [Google Scholar]
- Yang, M.; Li, Y.; Li, B.; Jin, D.; Chen, S. Service oriented 5G network architecture: an end-to-end software defining approach. Int. J. Commun. Syst. 2015. [Google Scholar] [CrossRef]
- Sood, M. Software defined network—Architectures. In Proceedings of 2014 International Conference on Parallel, Distributed and Grid Computing (PDGC), Himachal Pradesh, India, 11–13 December 2014.
- Deruyck, M.; Vereecken, W.; Tanghe, E.; Joseph, W.; Pickavet, M.; Martens, L.; Demeester, P. Power consumption in wireless access network. In Proceedings of 2010 European Wireless Conference (EW), Lucca, Italy, 12–15 April 2010.
- Zhang, Q.; Cheng, L.; Boutaba, R. Cloud computing: State-of-the-art and research challenges. J. Internet Serv. Appl. 2010, 1, 7–18. [Google Scholar] [CrossRef]
- Kumar, K.; Lu, Y.H. Cloud computing for mobile users: Can offloading computation save energy? Computer 2010, 4, 51–56. [Google Scholar] [CrossRef]
- Beloglazov, A.; Abawajy, J.; Buyya, R. Energy-aware resource allocation heuristics for efficient management of data centers for cloud computing. Future Gener. Comp. Syst. 2012, 28, 755–768. [Google Scholar]
- Huang, J.; Qian, F.; Gerber, A.; Mao, Z.M.; Sen, S.; Spatscheck, O. A close examination of performance and power characteristics of 4G LTE networks. In Proceedings of the 10th international conference on Mobile systems, applications, and services (MobiSys’12), New York, NY, USA, 2012.
- Centre for Energy-Efficient Telecommunications. 2013. Available online: http://www.ceet.unimelb.edu.au/publications/downloads/ceet-white-paper-wireless-cloud.pdf (accessed on 9 April 2015).
- Auer, G.; Gódor, I.; Hévizi, L.; Imran, M.A.; Malmodin, J.; Fazekas, P.; Tafazolli, R. Enablers for energy efficient wireless networks. In Proceedings of 2010 IEEE 72nd Vehicular Technology Conference Fall (VTC 2010-Fall), Ottawa, Canada, 6–9 September 2010.
- Frenger, P.; Moberg, P.; Malmodin, J.; Jading, Y.; Gódor, I. Reducing energy consumption in LTE with cell DTX. In Proceedings of 2011 IEEE 73rd Vehicular Technology Conference (VTC Spring), Yokohama, Japan, 15–18 May 2011.
- Cheng, J.F.; Koorapaty, H.; Frenger, P.; Larsson, D.; Falahati, S. energy efficiency performance of LTE dynamic base station downlink DTX operation. In Proccedings of 2014 IEEE 79th Vehicular Technology Conference (VTC Spring); Seoul, South Korea: 18–21 May 2014, 2014. [Google Scholar]
- Zhang, J.; la Roche, G.D. Femtocells: Technologies and Deployment, 1st ed.; Wiley-Blackwell: New York, NY, USA, 2009; pp. 1–13. [Google Scholar]
- Knisely, D. Standardization of femtocells in 3G. IEEE Commun. Mag. 2009, 47, 68–75. [Google Scholar] [CrossRef]
- Gur, G.; Bayhan, S.; Alagoz, F. Cognitive femtocell networks: an overlay architecture for localized dynamic spectrum access [dynamic spectrum management]. IEEE Wirel. Commun. 2010, 17, 62–70. [Google Scholar] [CrossRef]
- Lu, Z.; Bansal, T.; Sinha, P. Achieving user-level fairness in open-access femtocell-based architecture. IEEE Trans. Mob. Comp. 2010, 12, 1943–1954. [Google Scholar]
- Kaufman, B.; Lilleberg, J.; Aazhang, B. Femtocell Architectures with Spectrum Sharing for Cellular Radio Networks. 2013. Available online: http://arxiv.org/abs/1301.7245 (accessed on 9 April 2015).
- Frenger, P.; Jading, Y.; Turk, J. A case study on estimating future radio network energy consumption and CO2 emissions. In Proceedings of 2013 IEEE 24th International Symposium on Personal, Indoor and Mobile Radio Communications (PIMRC Workshops), London, UK, 8–9 September 2013.
- Bjornson, E.; Kountouris, M.; Debbah, M. Massive MIMO and small cells: Improving energy efficiency by optimal soft-cell coordination. In Proceedings of 2013 IEEE 20th International Conference onTelecommunications (ICT), Casablanca, Morocco, 6–8 May 2013.
- Deruyck, M.; Vereecken, W.; Tanghe, E.; Joseph, W.; Pickavet, M.; Martens, L.; Demeester, P. Comparison of power consumption of mobile WiMAX, HSPA and LTE access networks. In Proceedings of 2010 9th Conference on Telecommunications Internet and Media Techno Economics (CTTE), Ghent, Belgium, 7–9 June 2010.
- Lange, C.; Kosiankowski, D.; Weidmann, R.; Gladisch, A. Energy consumption of telecommunication networks and related improvement options. IEEE J. Sel. Top. Quantum Electron. 2011, 17, 285–295. [Google Scholar] [CrossRef]
- Correia, L.M.; Zeller, D.; Blume, O.; Ferling, D.; Jading, Y.; Gódor, I.; Van Der Perre, L. Challenges and enabling technologies for energy aware mobile radio networks. IEEE Commun. Mag. 2010, 48, 66–72. [Google Scholar] [CrossRef]
- Scheck, H.O. European Telecommunication Standards Institute. 2013. Available online: http://docbox.etsi.org/Workshop/2013/201310_EEWORKSHOP/S04_EE_ApplicationofMethodologies/NSN_SCHECK.pdf (accessed on 9 April 2015).
- Aleksic, S. Energy, entropy and exergy in communication networks. Entropy 2013, 15, 4484–4503. [Google Scholar] [CrossRef]
- Auer, G.; Giannini, V.; Desset, C. How much energy is needed to run a wireless network? IEEE Trans. Wirel. Commun. 2011, 18, 40–49. [Google Scholar] [CrossRef]
- Cisco. 2013. Available online: http://newsroom.cisco.com/documents/10157/1142732/Cisco_VNI_Mobile_Data_Traffic_Forecast_2012_2017_white_paper.pdf (accessed on 9 April 2015).
- Zhang, S.; Xu, X.; Wu, Y.; Lu, L. 5G: Towards energy-efficient, low-latency and high-reliable communications networks. In Proceedings of 2014 IEEE International Conference on Communication Systems (ICCS), Macau, China, 19–21 November 2014.
- Chin, W.H.; Fan, Z.; Haines, R. Emerging technologies and research challenges for 5G wireless networks. IEEE Wirel. Commun. 2014, 21, 106–112. [Google Scholar] [CrossRef]
- Mertikopoulos, P.; Moustakas, A.L. In an Uncertain World: Distributed Optimization in MIMO Systems with Imperfect Information. Available online: http://arxiv.org/abs/1502.01653 (accessed on 9 April 2015).
- Olsson, M. European Telecommunication Standards Institute. 2013. Available online: http://docbox.etsi.org/Workshop/2013/201310_EEWORKSHOP/S07_RESEARCH/5GrEEn_Olsson.pdf (accessed on 9 April 2015).
- Cisco. Cisco Global Cloud Index: Forecast and Methodology 2013–2018 White Paper. 2014. Available online: http://www.cisco.com/en/US/solutions/collateral/ns341/ns525/ns537/ns705/ns1175/Cloud_Index_White_Paper.html (accessed on 9 April 2015).
- Koomey, J. Worldwide electricity used in data centers. Environ. Res. Lett. 2008, 3, 1–8. [Google Scholar]
- Garimella, S.V.; Persoons, T.; Weibel, J.; Yeh, L.T. Technological drivers in data centers and telecom systems: Multiscale thermal, electrical, and energy management. Appl. Energy 2013, 107, 66–80. [Google Scholar] [CrossRef]
- Arjona, J.; Chatzipapas, A.; Anta, A.F.; Mancuso, V. 2014. Available online: http://arxiv.org/abs/1402.0804 (accessed on 9 April 2015).
- Arjona, J.; Chatzipapas, A.; Fernández Anta, A.; Mancuso, V. A measurement-based analysis of the energy consumption of data center servers. In Proceedings of the 5th international conference on Future energy system (e-Energy’14), New York, NY, USA, 11 June 2014.
- Doctorow, C. Big data: Welcome to the petacentre. Nature 2008, 455, 16–21. [Google Scholar] [CrossRef] [PubMed]
- Buyya, R.; Yeo, C.S.; Venugopal, S.; Broberg, J.; Brandic, I. Cloud computing and emerging IT platforms: Vision, hype, and reality for delivering computing as the 5th utility. Future Gener. Comp. Syst. 2009, 25, 599–616. [Google Scholar] [CrossRef]
- Barroso, L.; Dean, J.; Holzle, U. Web search for a planet: The Google cluster architecture. IEEE Micro 2003, 23, 22–28. [Google Scholar] [CrossRef]
- Armbrust, M.; Fox, A.; Griffith, R. A view of cloud computing. Commun. ACM 2010, 53, 50–58. [Google Scholar] [CrossRef]
- Jin, Y.; Wen, Y.; Chen, Q.; Zhu, Z. An empirical investigation of the impact of server virtualization on energy efficiency for green data center. Comp. J. 2013, 56, 977–990. [Google Scholar] [CrossRef]
- Beloglazov, A.; Buyya, R. Energy efficient allocation of virtual machines in cloud data centers. In Proceedings of 2010 10th IEEE/ACM International Conference on Cluster, Cloud and Grid Computing (CCGrid), Melbourne, Australia, 17–20 May 2010.
- Koutitas, G. Challenges for energy efficiency in local and regional data centers. 2010. Available online: http://researchwebshelf.com/uploads/104_article1_1.pdf (accessed on 9 April 2015).
- Lin, M.; Wierman, A. Dynamic right-sizing for power-proportional data centers. IEEE/ACM Trans. Netw. 2013, 21, 1378–1391. [Google Scholar] [CrossRef]
- Ahmad, F.; Vijaykumar, T.N. Joint optimization of idle and cooling power in data centers while maintaining response time. ACM Sigplan Not. 2010, 45, 243–256. [Google Scholar] [CrossRef]
- Chun, B.G.; Iannaccone, G.; Iannaccone, G.; Katz, R.; Lee, G.; Niccolini, L. An energy case for hybrid datacenters. ACM SIGOPS Oper. Syst. Rev. 2010, 44, 76–80. [Google Scholar] [CrossRef]
- Szalay, A.S.; Bell, G.C.; Huang, H.H.; Terzis, A.; White, A. Low-power amdahl-balanced blades for data intensive computing. ACM SIGOPS Oper. Syst. Rev. 2010, 44, 71–75. [Google Scholar] [CrossRef]
- Enos, J; Steffen, C. Quantifying the impact of GPUs on performance and energy efficiency in HPC clusters. In Proceedings of 2010 International Green Computing Conference, Chicago, IL, USA, 15–18 August 2010.
- Johnsson, L. Efficiency, Energy Efficiency and Programming of Accelerated HPC Servers: Highlights of PRACE Studies. In GPU Solutions to Multi-scale Problems in Sci. and Engineering, 1st ed.; Yuen, D.A., Wang, L., Chi, X., Johnsson, J., Ge, W., Shi, Y., Eds.; Springer: Berlin, Germany, 2013; Volume 1, pp. 33–78. [Google Scholar]
- Uddin, M.; Memon, J.; Rozan, M.Z.A.; Alsaqour, R.; Rehman, A. Virtualised load management algorithm to reduce CO2 emissions in the data centre industry. Int. J. Glob. Warm. 2015, 7, 3–20. [Google Scholar] [CrossRef]
- Goiri, Í.; Haque, M.E.; Le, K.; Beauchea, R.; Nguyen, T.D.; Guitart, J.; Bianchini, R. Matching renewable energy supply and demand in green datacenters. Ad Hoc Netw. 2015, 25, 520–534. [Google Scholar] [CrossRef]
- Oró, E.; Depoorter, V.; Garcia, A.; Salom, J. Energy efficiency and renewable energy integration in data centres. Strategies and modelling review. Renew. Sustain. Energy Rev. 2015, 42, 429–445. [Google Scholar] [CrossRef]
- Vasan, A.; Sood, B.; Pecht, M. Carbon footprinting of electronic products. Appl. Energy 2014, 136, 636–648. [Google Scholar] [CrossRef]
- Teehan, P.; Kandlikar, M. Comparing embodied greenhouse gas emissions of modern computing and electronics products. Environ. Sci. Technol. 2013, 47, 3997–4003. [Google Scholar] [CrossRef] [PubMed]
- Zhu, Y.; Andrae, A.S.G. World Intellectual Property Organization Patentscope. 2014. Available online: https://patentscope.wipo.int/search/en/detail.jsf?docId = WO2014012590 (accessed on 9 April 2015).
- Aoe, T.; Michiyasu, T.; Matsuoka, Y.; Shikata, N. Case study for calculation of Factor X (Eco-Efficiency)-comparing CRT TV, PDP TV and LCD TV. In Proceedings of 2003 3rd International Symposium on Environ.ally Conscious Design and Inverse Manufacturing, EcoDesign’03, Tokyo, Japan, 8–11 December 2003.
- Feng, C.; Ma, X.Q. The energy consumption and Environ.al impacts of a color TV set in China. J. Clean. Product. 2009, 17, 13–25. [Google Scholar] [CrossRef]
- Hischier, R.; Baudin, I. LCA study of a plasma television device. Int. J. Life Cycle Assess. 2010, 15, 428–438. [Google Scholar] [CrossRef]
- Thomson Technicolor. 2009. Available online: http://www.technicolor.com/download/file/fid/2767?file = sustainability_2008.pdf (accessed on 9 April 2015).
- Yang, Q. ResearchGate. 2007. Available online: https://www.researchgate.net/publication/265617116_Life_cycle_assessment_in_sustainable_product_design (accessed on 9 April 2015).
- Gartner. 2013. Available online: http://www.gartner.com/newsroom/id/2351518 (accessed on 9 April 2015).
- Fichter, K.; Hintemann, R. Beyond energy. The quantities of materials present in the equipment of data centers. J. Ind. Ecol. 2014, 18, 846–858. [Google Scholar] [CrossRef]
- Honée, C.; Hedin, D. Environ.al performance of data centres: A case study of the Swedish national insurance administration. In Proceedings of Electronics Goes Green 2012+, Berlin, Germany, 9–12 September 2012.
- Stutz, M.; O’Connell, S.; Pflueger, J. Carbon Footprint of a Dell Rack Server. In Proceedings of Electronics Goes Green 2012+, Berlin, Germany, 9–12 September 2012.
- Goldey, C.; Kuester, E. Lifecycle assessment of the Environ.al benefits of remanufactured telecommunications product within a ‘green’ supply chain. In Proceedings of IEEE International Symposium on Sustainable Systems and Technology (ISSST), Arlington, VA, USA, 17–19 May 2010.
- Kumar, A.; Singh, T.; Khanna, R.; Liu, Y. Life Cycle Assessment of Wireless BTS to reduce Carbon Footprints. Energy Procedia 2014, 52, 120–125. [Google Scholar] [CrossRef] [Green Version]
- United Kingdom Government. 2012. Available online: https://www.gov.uk/government/uploads/system/uploads/attachment_data/file/65602/6927-energy-efficiency-strategy--the-energy-efficiency.pdf (accessed on 9 April 2015).
- Alliance to Save Energy. 2013. Available online: http://www.ase.org/sites/ase.org/files/resources/Media%20browser/commission_manufacturing_2-7-13.pdf (accessed on 9 April 2015).
- Andrae, A.S.G. European LCA standardisation of ICT: Equipment, networks, and services. In Towards Life Cycle Sustainability Management, 1st ed.; Finkbeiner, M., Ed.; Springer Netherlands: Dordrecht, The Netherlands, 2011; pp. 483–493. [Google Scholar]
- Andrae, A.S.G. The effect of revised characterization indices for N2O and CO2 in life cycle assessment of optical fiber networks—The case of ozone depletion and aquatic acidification. J. Green Eng. 2012, 3, 12–32. [Google Scholar]
- Scharnhorst, W.; Hilty, L.M.; Jolliet, O. Life cycle assessment of second generation (2G) and third generation (3G) mobile phone networks. Environ. Int. 2006, 32, 656–675. [Google Scholar] [CrossRef] [PubMed]
- Whitehead, B.; Andrews, D.; Shah, A. The life cycle assessment of a UK data centre. Int. J. Life Cycle Assess. 2015. [Google Scholar] [CrossRef]
- Greenhouse Gas Protocol. 2011. Available online: http://www.ghgprotocol.org/files/ghgp/public/Telecommunications Network Services guide.pdf (accessed on 9 April 2015).
- Criqui, P.; Kouvaritakis, N. World energy projections to 2030. Int. J. Glob. Energy Issues 2000, 14, 116–136. [Google Scholar] [CrossRef]
- International Energy Agency. 2013. Available online: http://www.worldenergyoutlook.org/media/weowebsite/2013/iew2013/presentations/parallelsessions/e/E1paperBollen.pdf (accessed on 9 April 2015).
- Hoang, A.; Do, P.; Iung, B. Integrating energy efficiency-based prognostic approaches into energy management systems of base stations. In Proceedings of 2014 International Conference on Advanced Technologies for Communications (ATC), Hanoi, Vietnam, 15–17 October 2014.
- De Almeida, A.; Fonseca, P.; Schlomann, B.; Feilberg, N. Characterization of the household electricity consumption in the EU, potential energy savings and specific policy recommendations. Energy Build. 2011, 43, 1884–1894. [Google Scholar] [CrossRef]
- Kamilaris, A.; Kalluri, B.; Kondepudi, S.; Kwok Wai, T. A literature survey on measuring energy usage for miscellaneous electric loads in offices and commercial buildings. Renew. Sustain. Energy Rev. 2014, 34, 536–550. [Google Scholar] [CrossRef]
- International Energy Agency. 2012. Available online: http://www.iea.org/publications/freepublications/publication/ElecClimate2012_free.pdf (accessed on 9 April 2015).
- International Energy Agency. 2010. Available online: http://www.worldenergyoutlook.org/media/weo2010.pdf (accessed on 9 April 2015).
- Ecometrica. 2015. Available online: http://ecometrica.com/assets/Electricity-specific-emission-factors-for-grid-electricity.pdf (accessed on 9 April 2015).
- Global Energy Network Institute. 2011. Available online: http://www.geni.org/globalenergy/research/renewable-energy-potential-of-france/Renewable%20Energy%20in%20France.%20PBM%20final.pdf (accessed on 9 April 2015).
- Shehabi, A.; Walker, B.; Masanet, E. The energy and greenhouse-gas implications of internet video streaming in the United States. Environ. Res. Lett. 2014, 9, 054007. [Google Scholar] [CrossRef]
- Wards Auto. 2011. Available online: http://wardsauto.com/ar/world_vehicle_population_110815 (accessed on 9 April 2015).
- Automotive World. 2013. Available online: http://www.automotiveworld.com/analysis/world-2050-9-billion-people-2-billion-cars-congested-megacities/ (accessed on 9 April 2015).
- IPS News. 2011. Available online: http://www.ipsnews.net/2011/06/bike-vs-car-on-a-hot-planet/ (accessed on 9 April 2015).
- International Transport Forum. 2011. Available online: http://www.internationaltransportforum.org/pub/pdf/11Outlook.pdf (accessed on 9 April 2015).
- Transport Evolved. 2014. Available online: https://transportevolved.com/2014/04/16/number-electric-cars-world-doubled-past-year-say-academics/ (accessed on 9 April 2015).
- European Commission. 2009. Available online: http://ec.europa.eu/transport/themes/strategies/consultations/doc/2009_03_27_future_of_transport/20090408_eabev_(scientific_study).pdf (accessed on 9 April 2015).
- United Kingdom Government. 2012. Available online: https://www.gov.uk/government/uploads/system/uploads/attachment_data/file/243957/nts2012-01.pdf (accessed on 9 April 2015).
- Canadian Automobile Association. 2013. Available online: http://www.caa.ca/wp-content/uploads/2012/06/CAA_Driving_Cost_English_2013_web.pdf (accessed on 9 April 2015).
- Roy Morgan Research. 2013. Available online: http://www.roymorgan.com/findings/australian-moterists-drive-average-15530km-201305090702 (accessed on 9 April 2015).
- Unites States Department of Transportation. 2015. Available online: http://www.fhwa.dot.gov/ohim/onh00/bar8.htm (accessed on 9 April 2015).
- American Center for Life Cycle Assessment. 2013. Available online: http://lcacenter.org/lcaxiii/final-presentations/921.pdf (accessed on 9 April 2015).
- The Guardian. Available online: http://www.theguardian.com/Environ./2014/sep/18/world-population-new-study-11bn-2100 (accessed on 9 April 2015).
- Teehan, P. 2014. Available online: https://circle.ubc.ca/bitstream/handle/2429/47025/ubc_2014_september_teehan_paul.pdf?sequence = 1 (accessed on 9 April 2015).
- Bouhafs, F.; Mackay, M.; Merabti, M. Overview of the Smart Grid. In Communication Challenges and Solutions in the Smart Grid, 1st ed.; Bouhafs, F., Mackay, M., Merabti, M., Eds.; Springer: New York, NY, USA, 2014; pp. 1–12. [Google Scholar]
- Ongondo, F.O.; Williams, I.D.; Cherrett, T.J. How are WEEE doing? A global review of the management of electrical and electronic wastes. Waste Manag. 2011, 31, 714–730. [Google Scholar] [CrossRef] [PubMed]
© 2015 by the authors; licensee MDPI, Basel, Switzerland. This article is an open access article distributed under the terms and conditions of the Creative Commons Attribution license (http://creativecommons.org/licenses/by/4.0/).
Share and Cite
Andrae, A.S.G.; Edler, T. On Global Electricity Usage of Communication Technology: Trends to 2030. Challenges 2015, 6, 117-157. https://doi.org/10.3390/challe6010117
Andrae ASG, Edler T. On Global Electricity Usage of Communication Technology: Trends to 2030. Challenges. 2015; 6(1):117-157. https://doi.org/10.3390/challe6010117
Chicago/Turabian StyleAndrae, Anders S. G., and Tomas Edler. 2015. "On Global Electricity Usage of Communication Technology: Trends to 2030" Challenges 6, no. 1: 117-157. https://doi.org/10.3390/challe6010117
APA StyleAndrae, A. S. G., & Edler, T. (2015). On Global Electricity Usage of Communication Technology: Trends to 2030. Challenges, 6(1), 117-157. https://doi.org/10.3390/challe6010117