
In Silico Epitope-Based Vaccine Prediction against Fungal Infection Aspergillosis

Abstract
1. Introduction
2. Materials and Methods
- a.
- Retrieval of Afu5g08030 protein sequence
- b.
- Determination of protein antigenicity
- c.
- Primary and secondary structure prediction of putative expansin protein (Afu5g08030) from organism Aspergillus fumigatus
- d.
- Modeling and validation of 3D homology modeled structure
- e.
- Estimation of the quality of modeled protein structure
- f.
- Prediction of putative epitopes of B cells
- g.
- Potential T-cell epitope Identification
- h.
- Docking analysis of epitopes of B cells and T cells
3. Results & Discussion
- A.
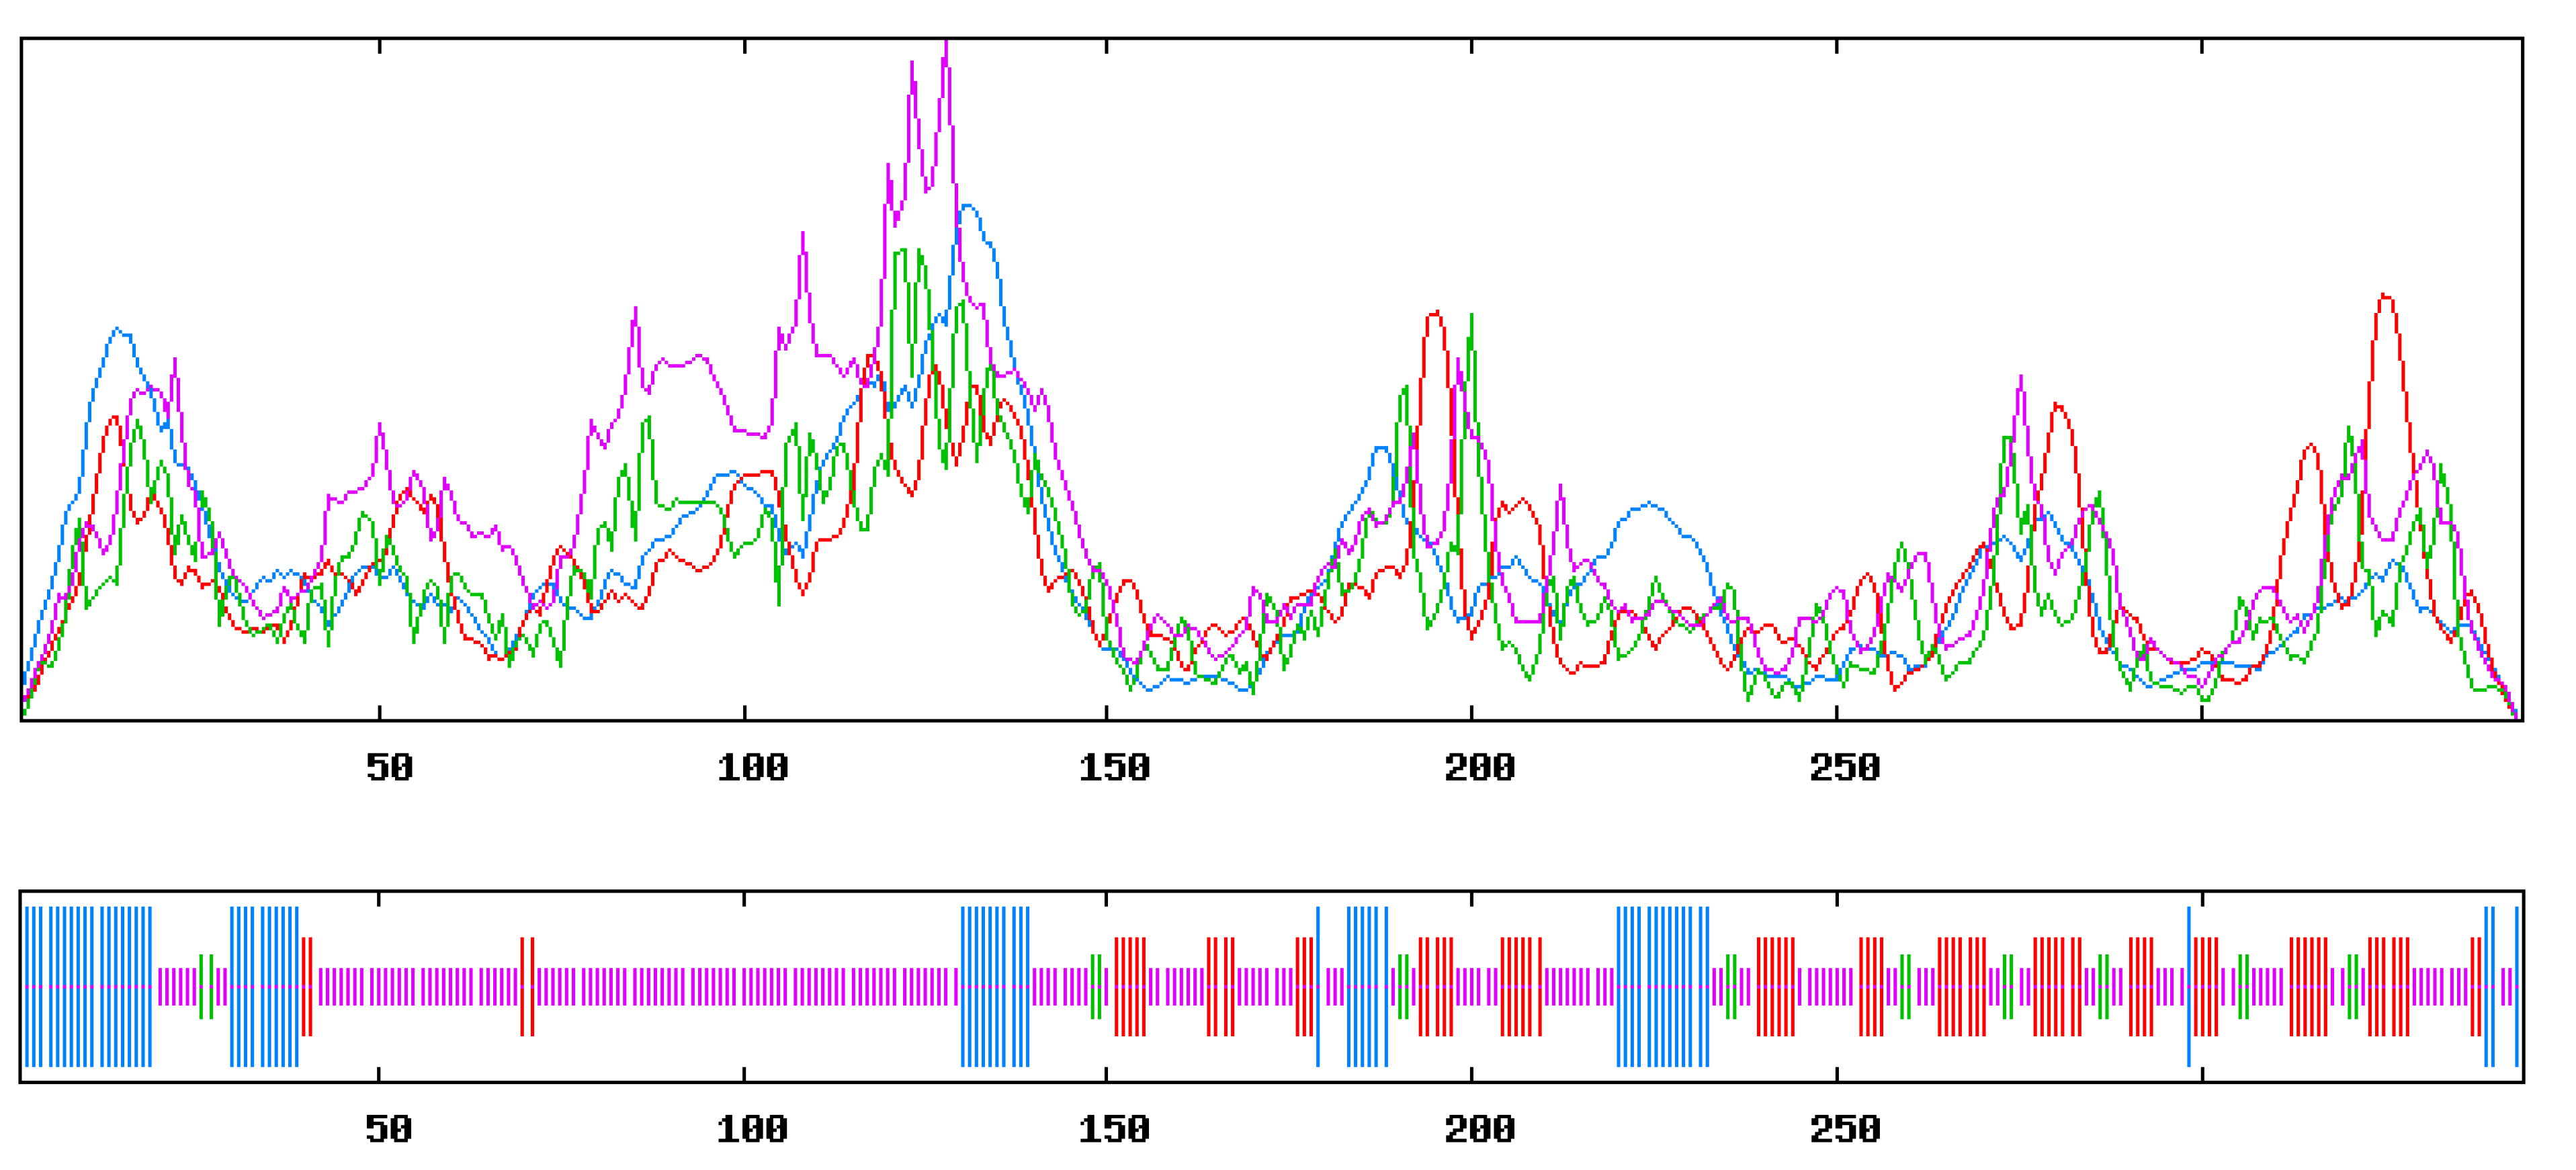
- Primary and secondary structure prediction of putative expansin protein (Afu5g08030) from organism Aspergillus fumigatus
- B.
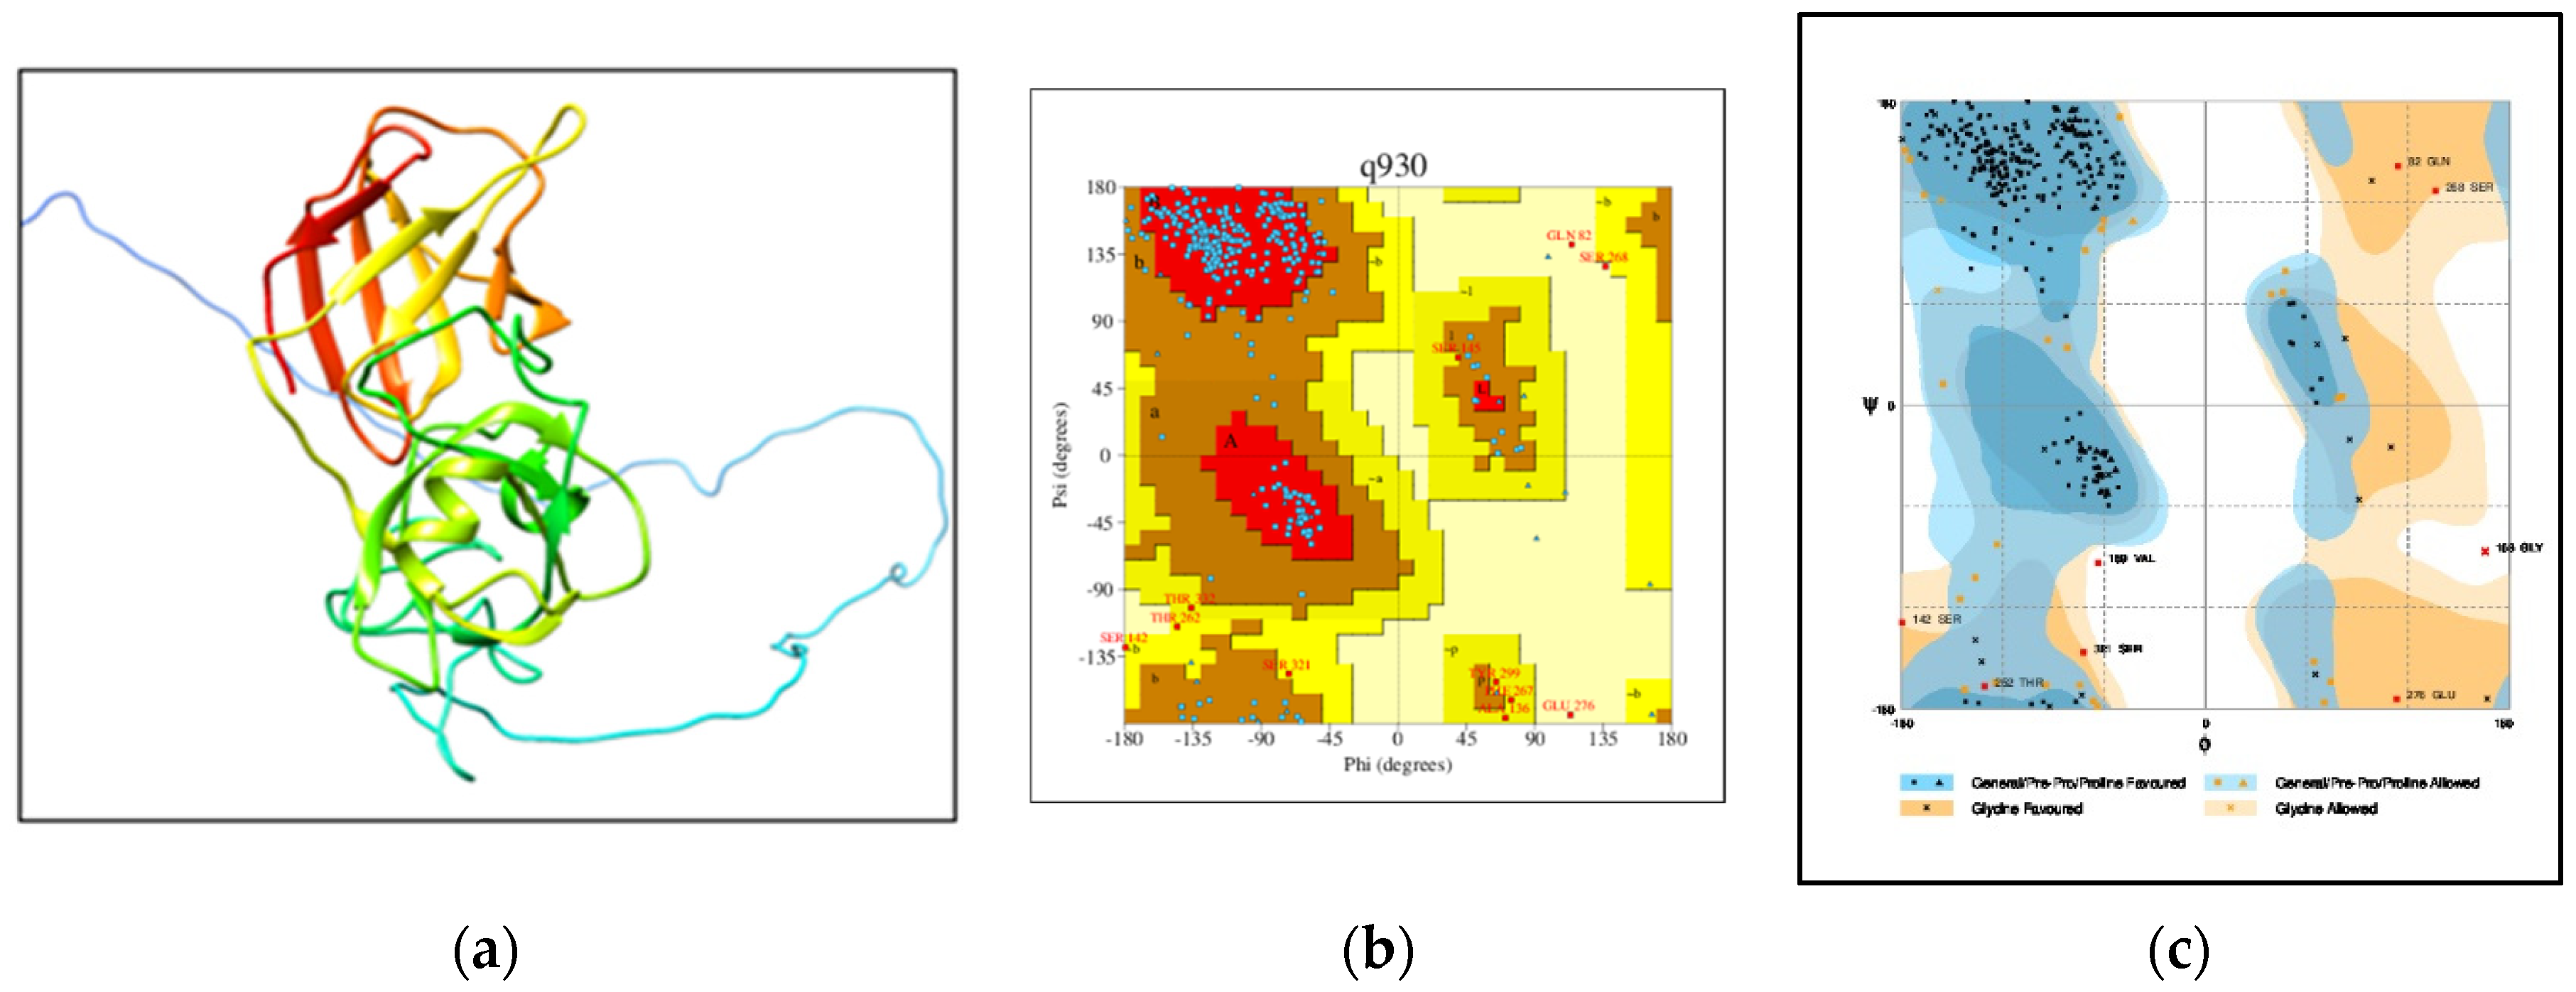
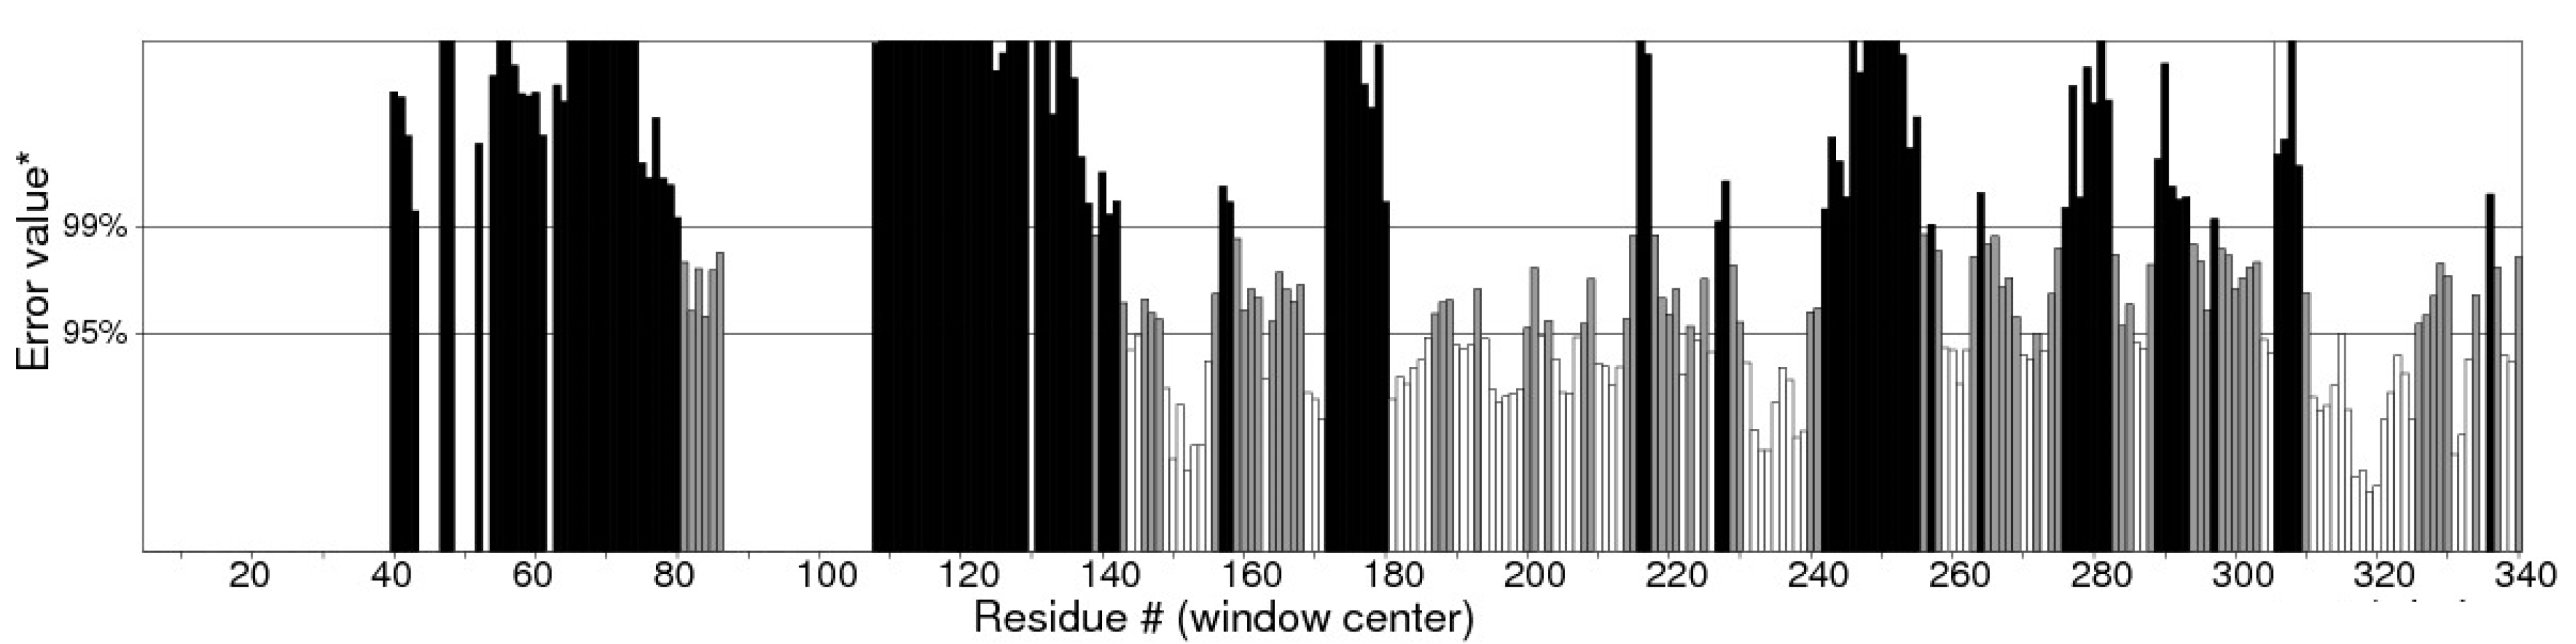
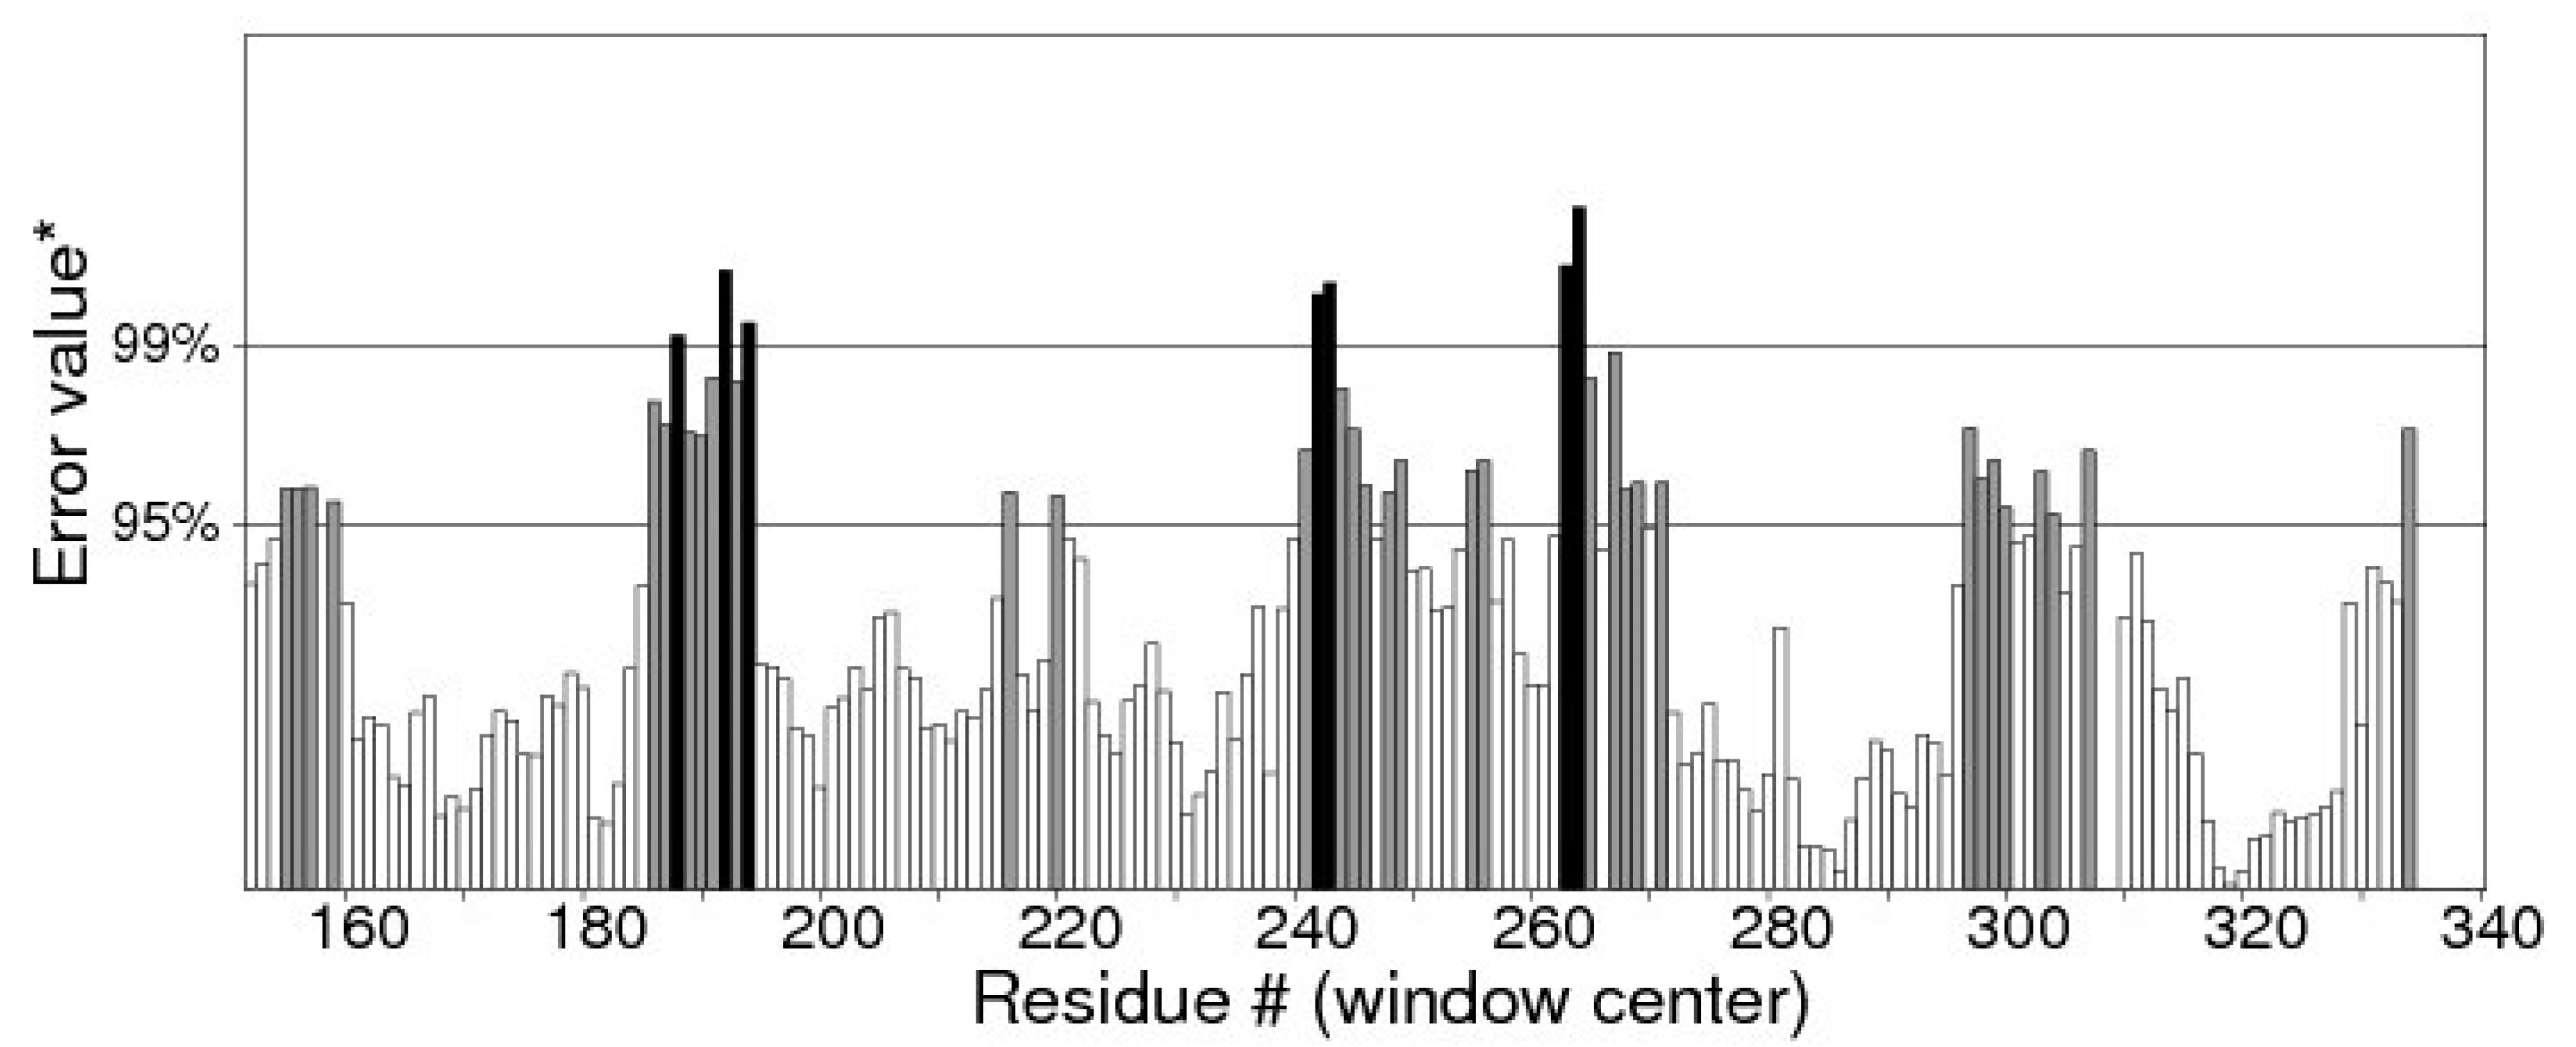
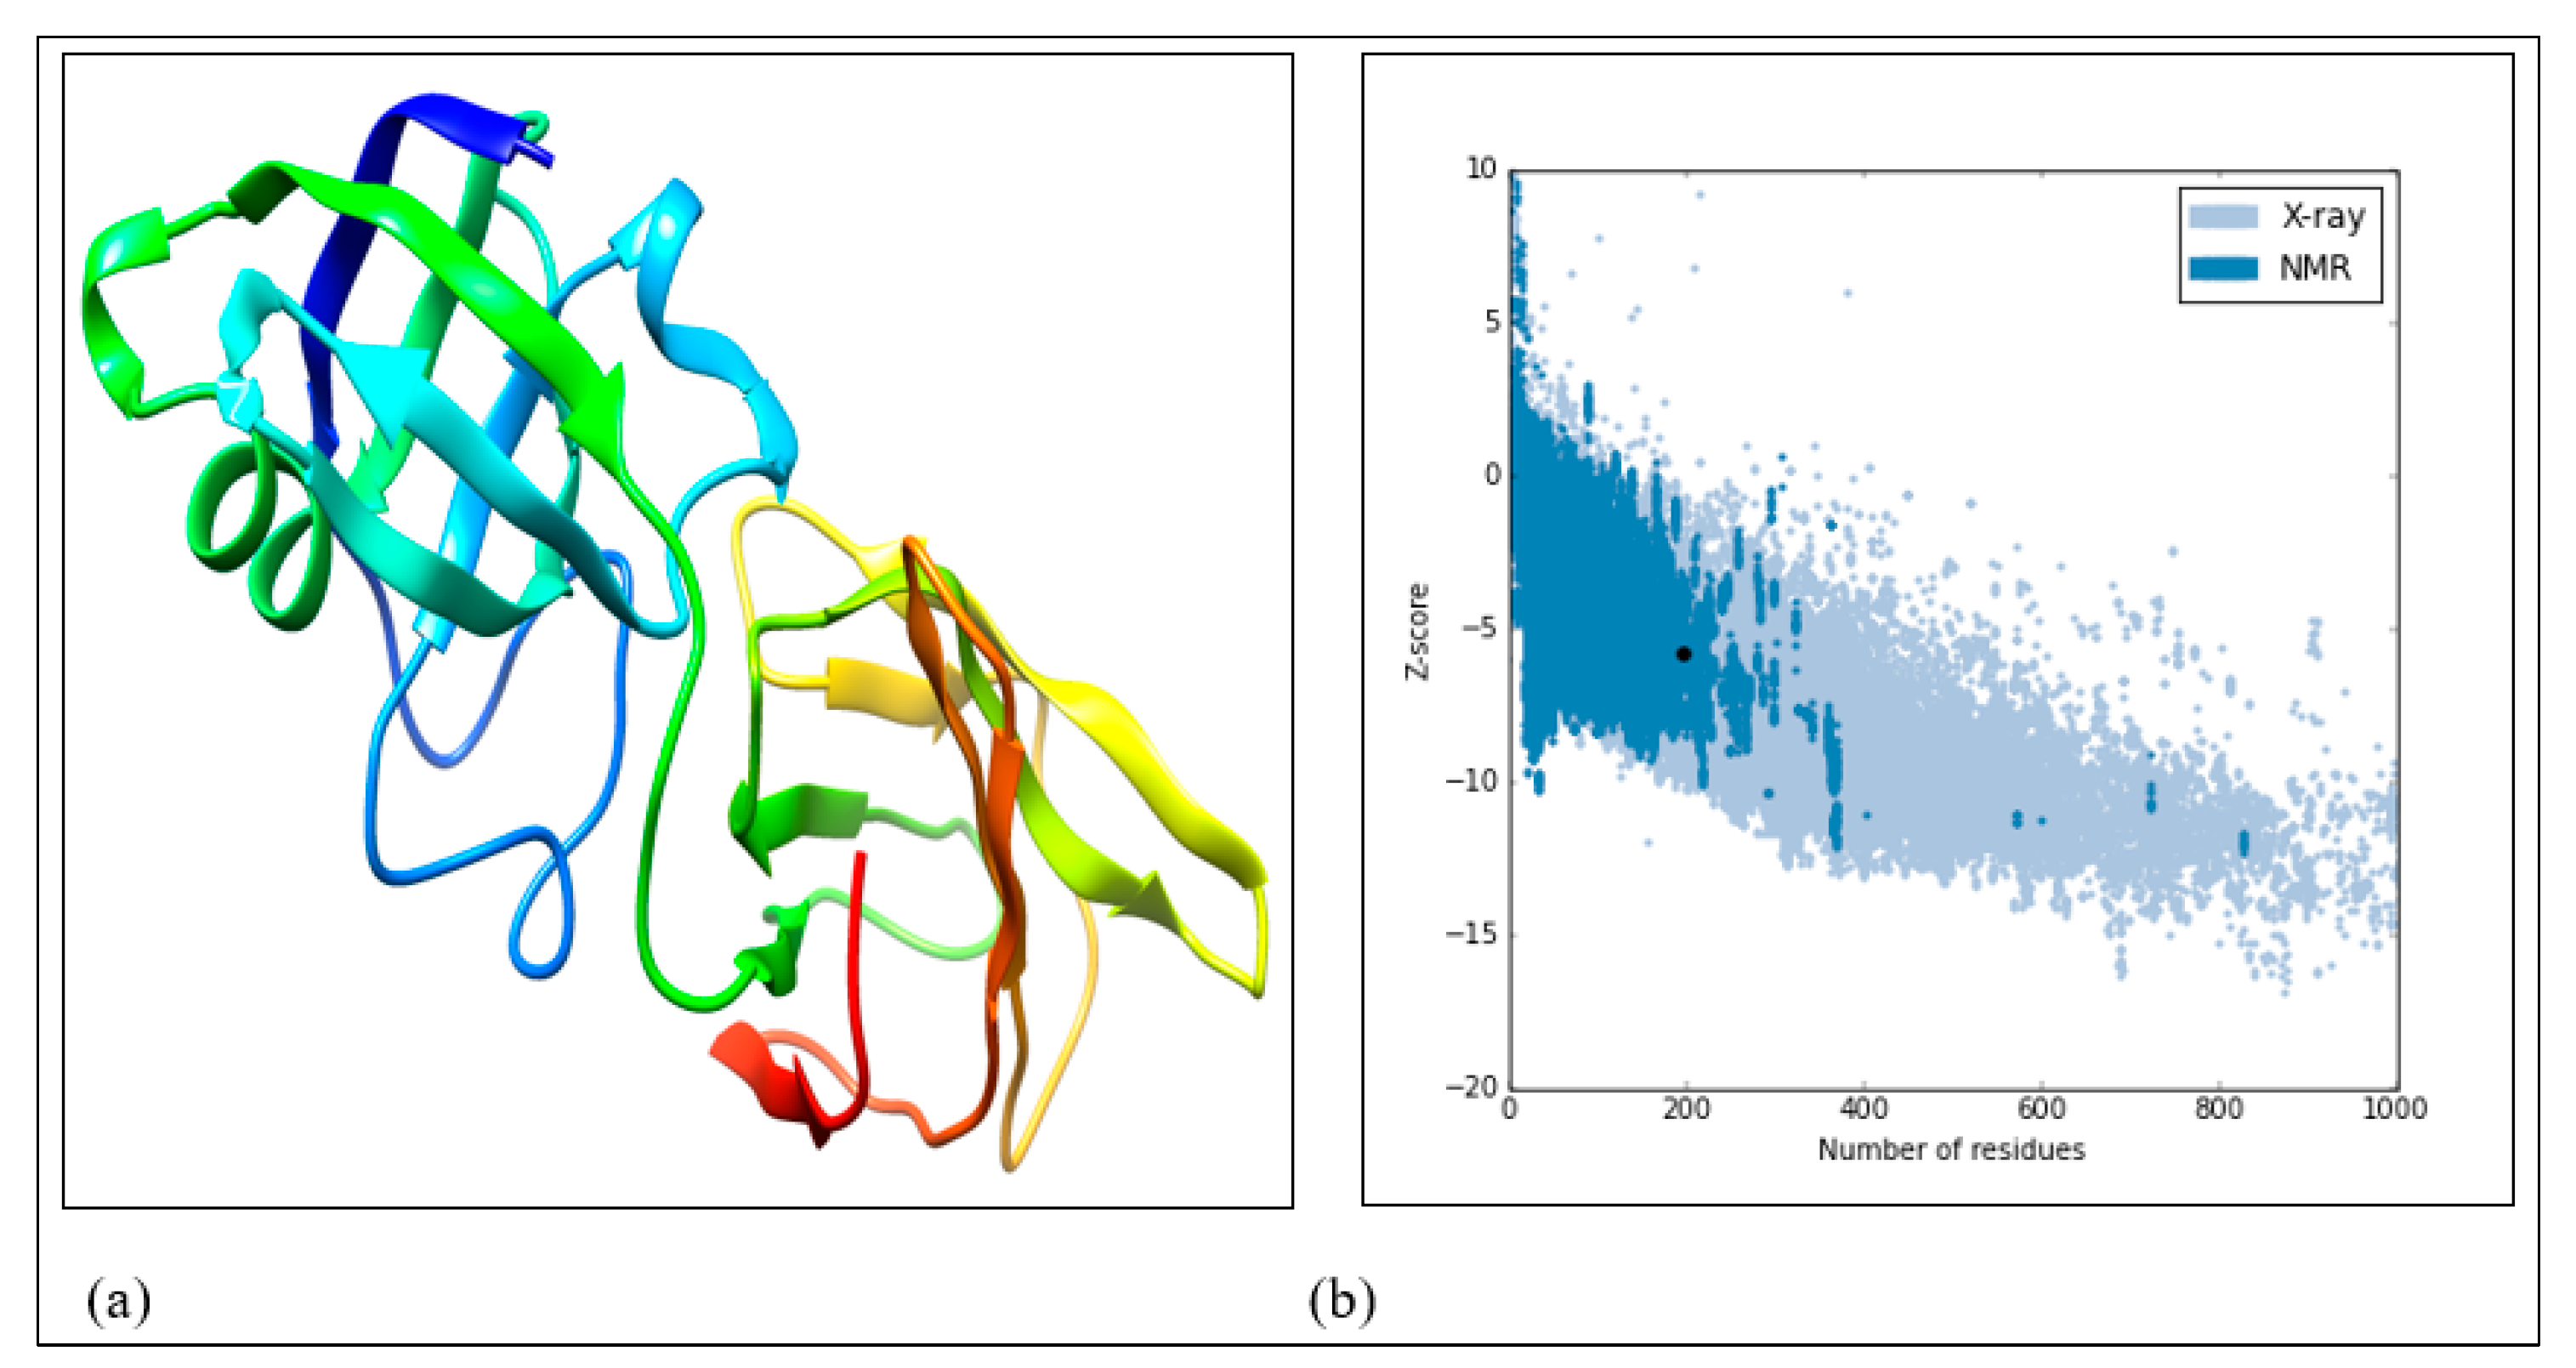
- Homology modeling and validation of 3D homology modeled structure
- C.
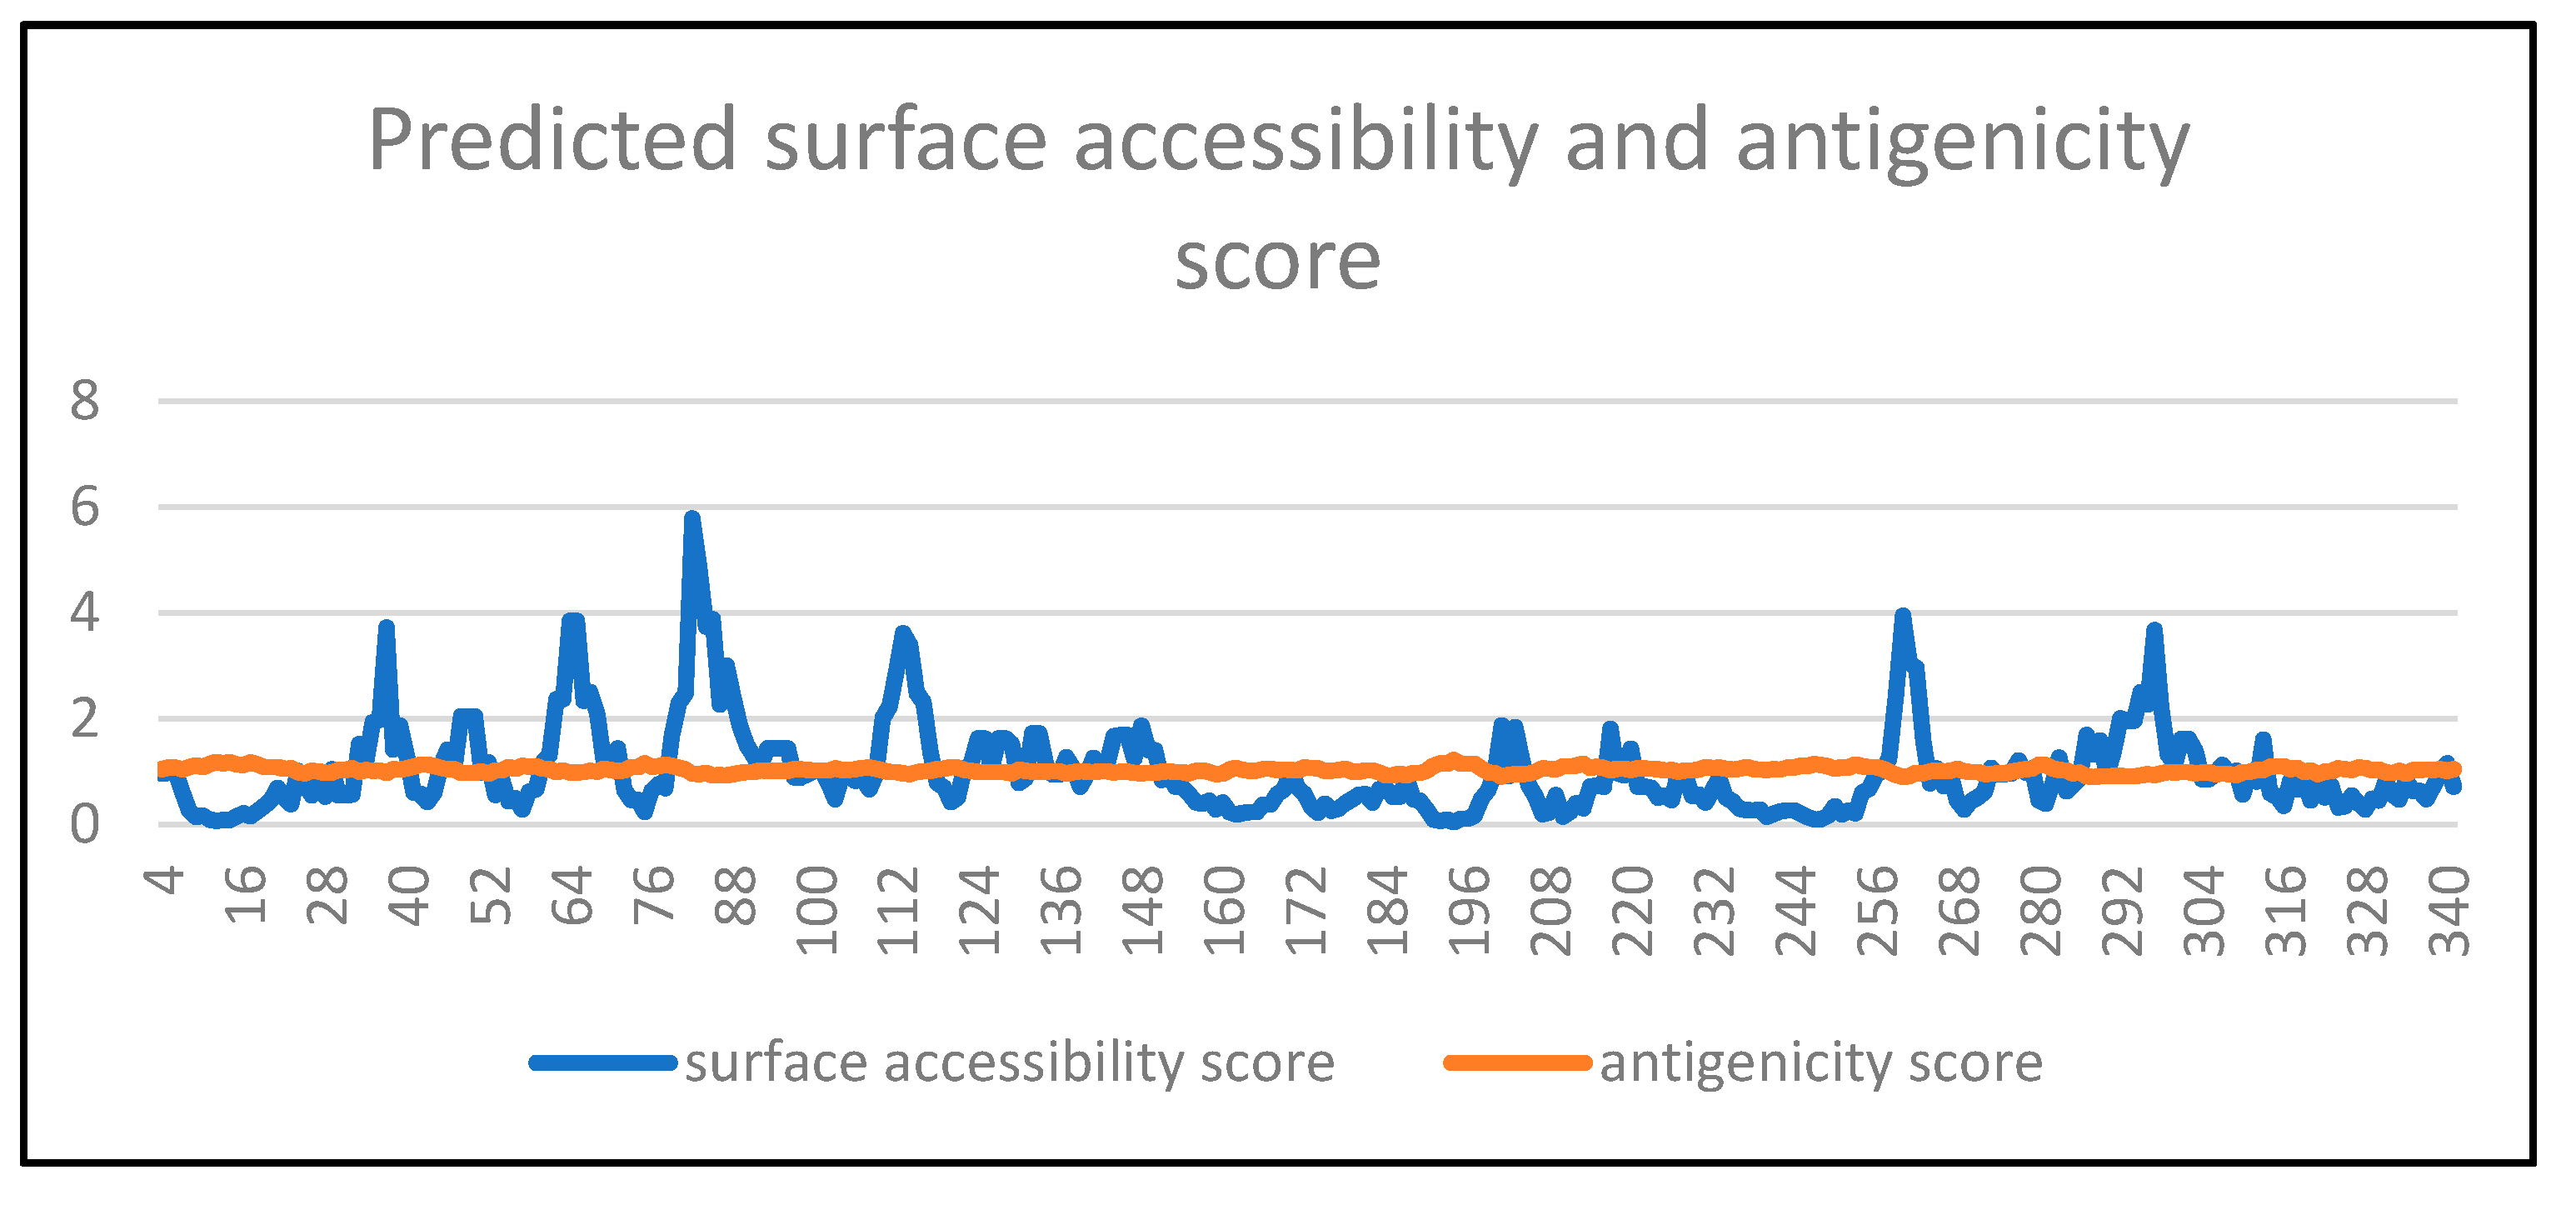
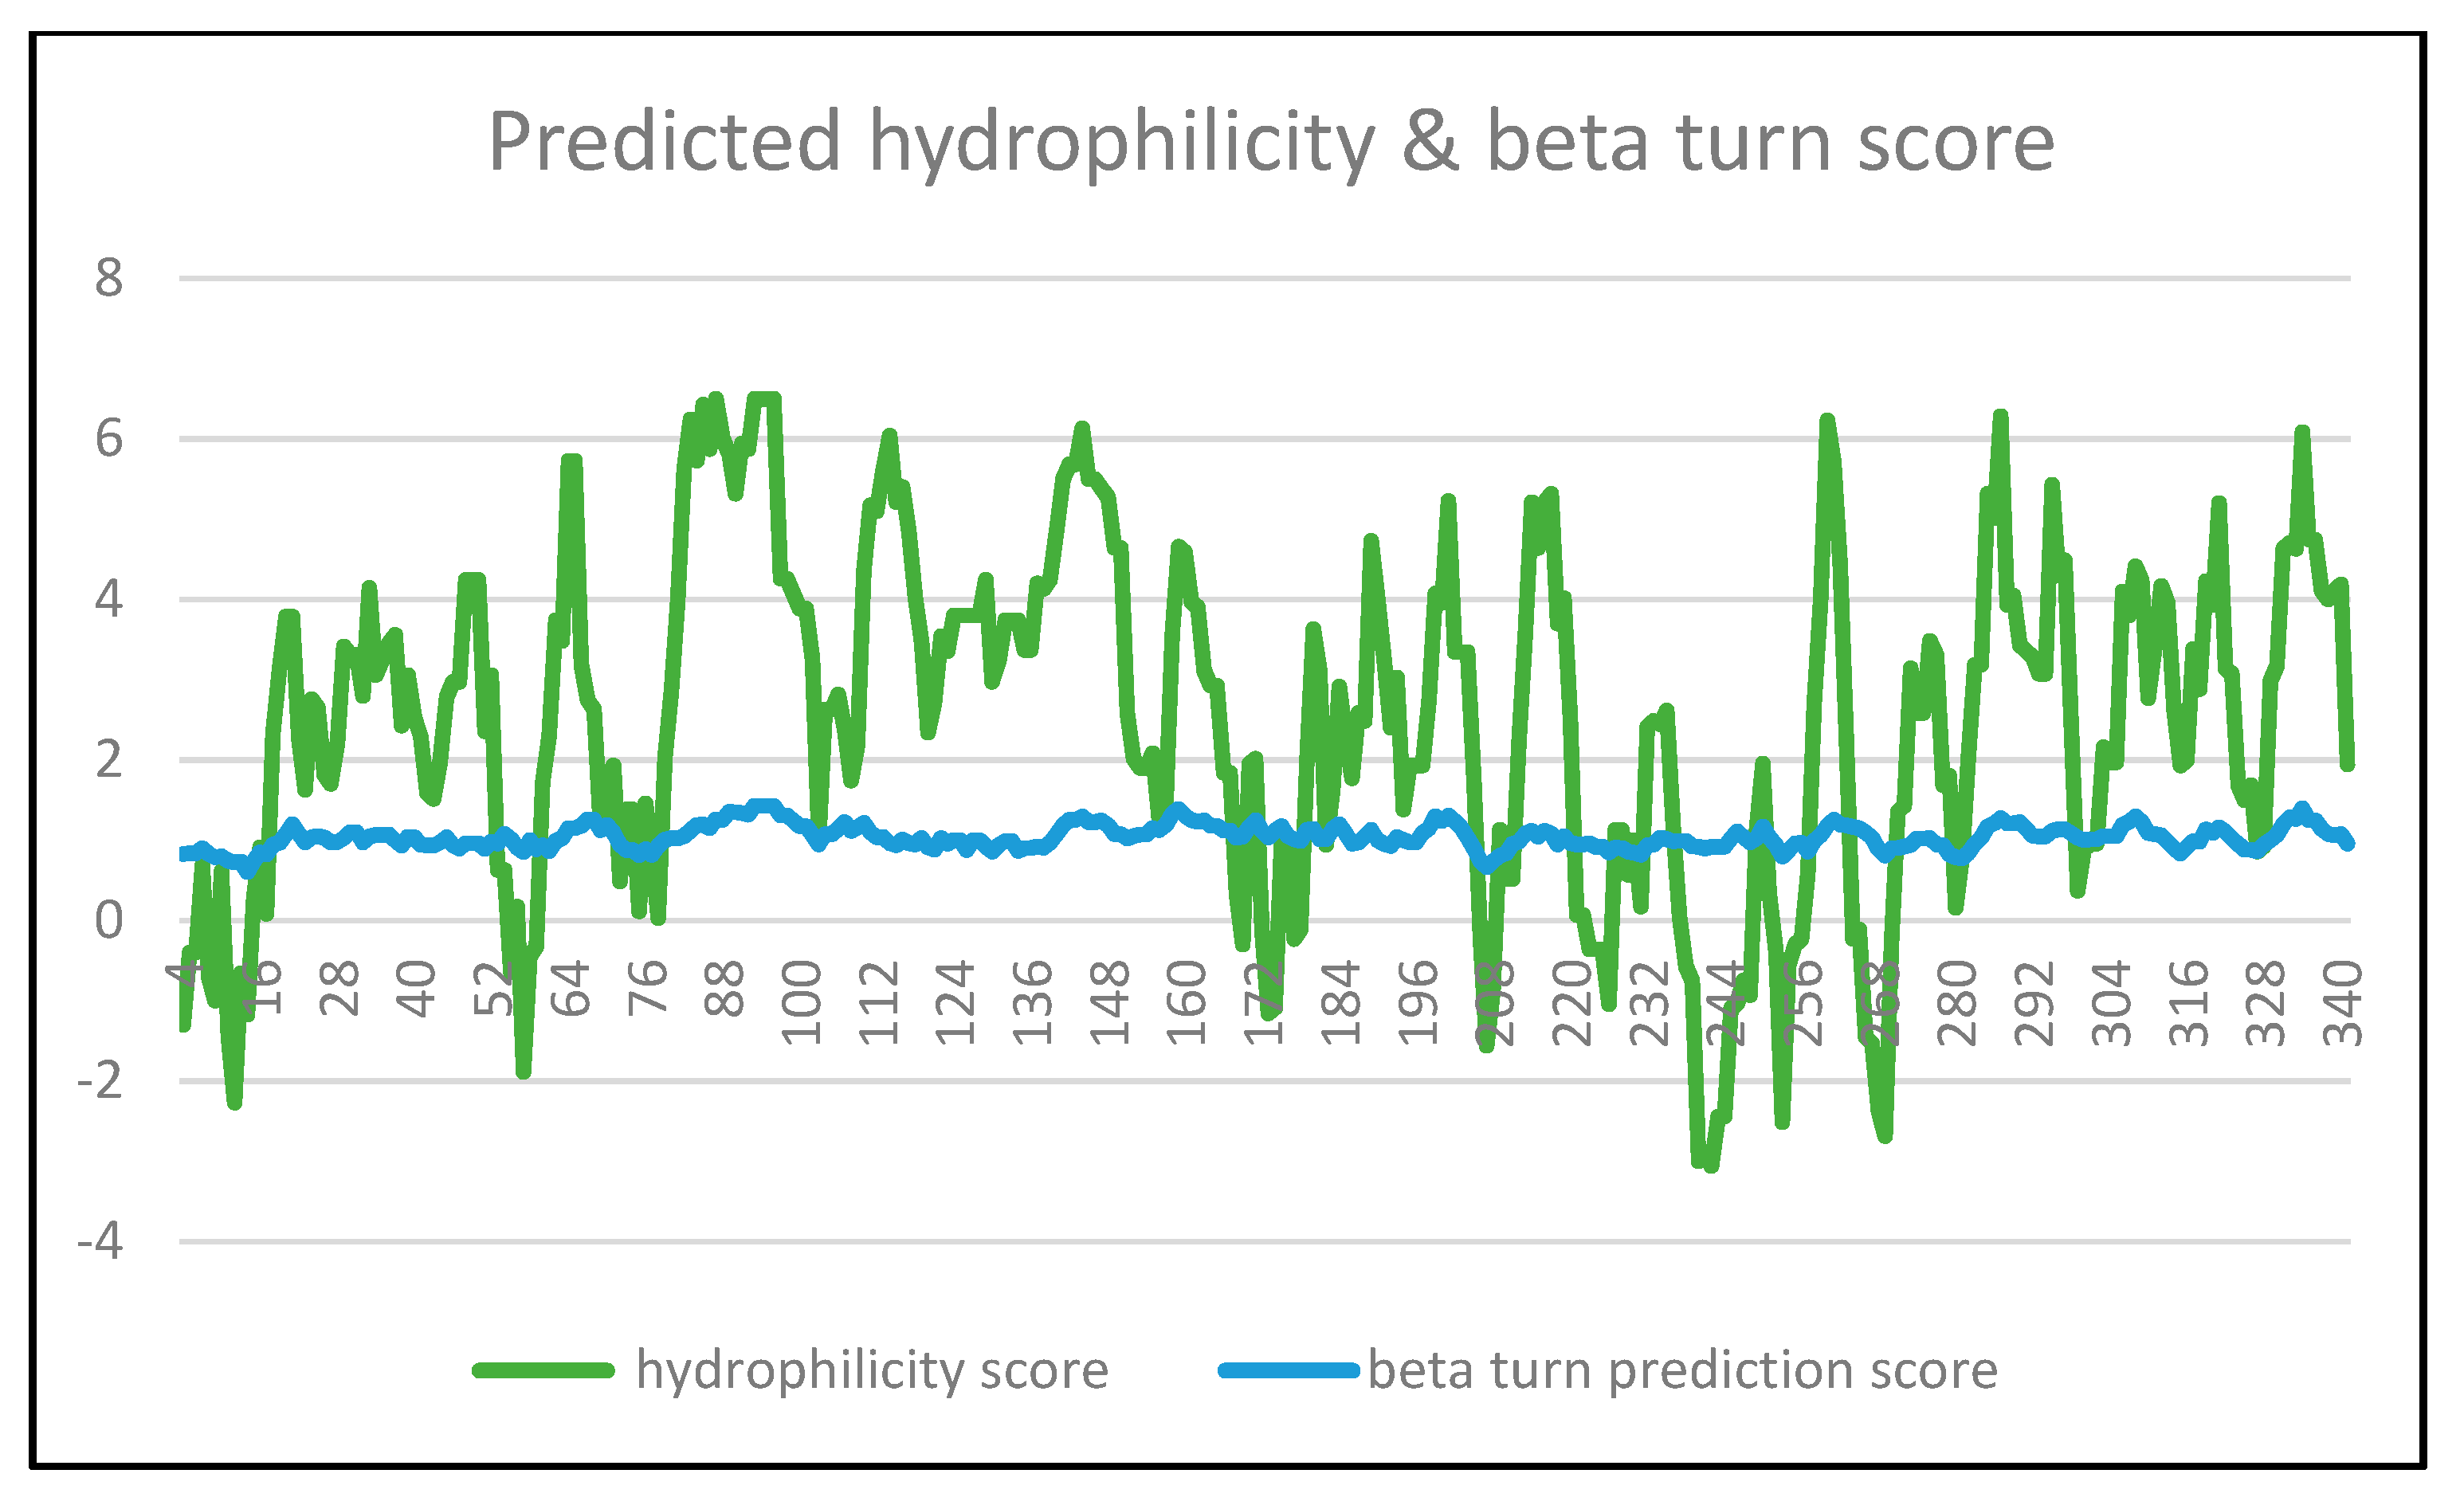
- Prediction of putative B cell epitope
- D.
- Prediction of putative T cell epitope
- E.
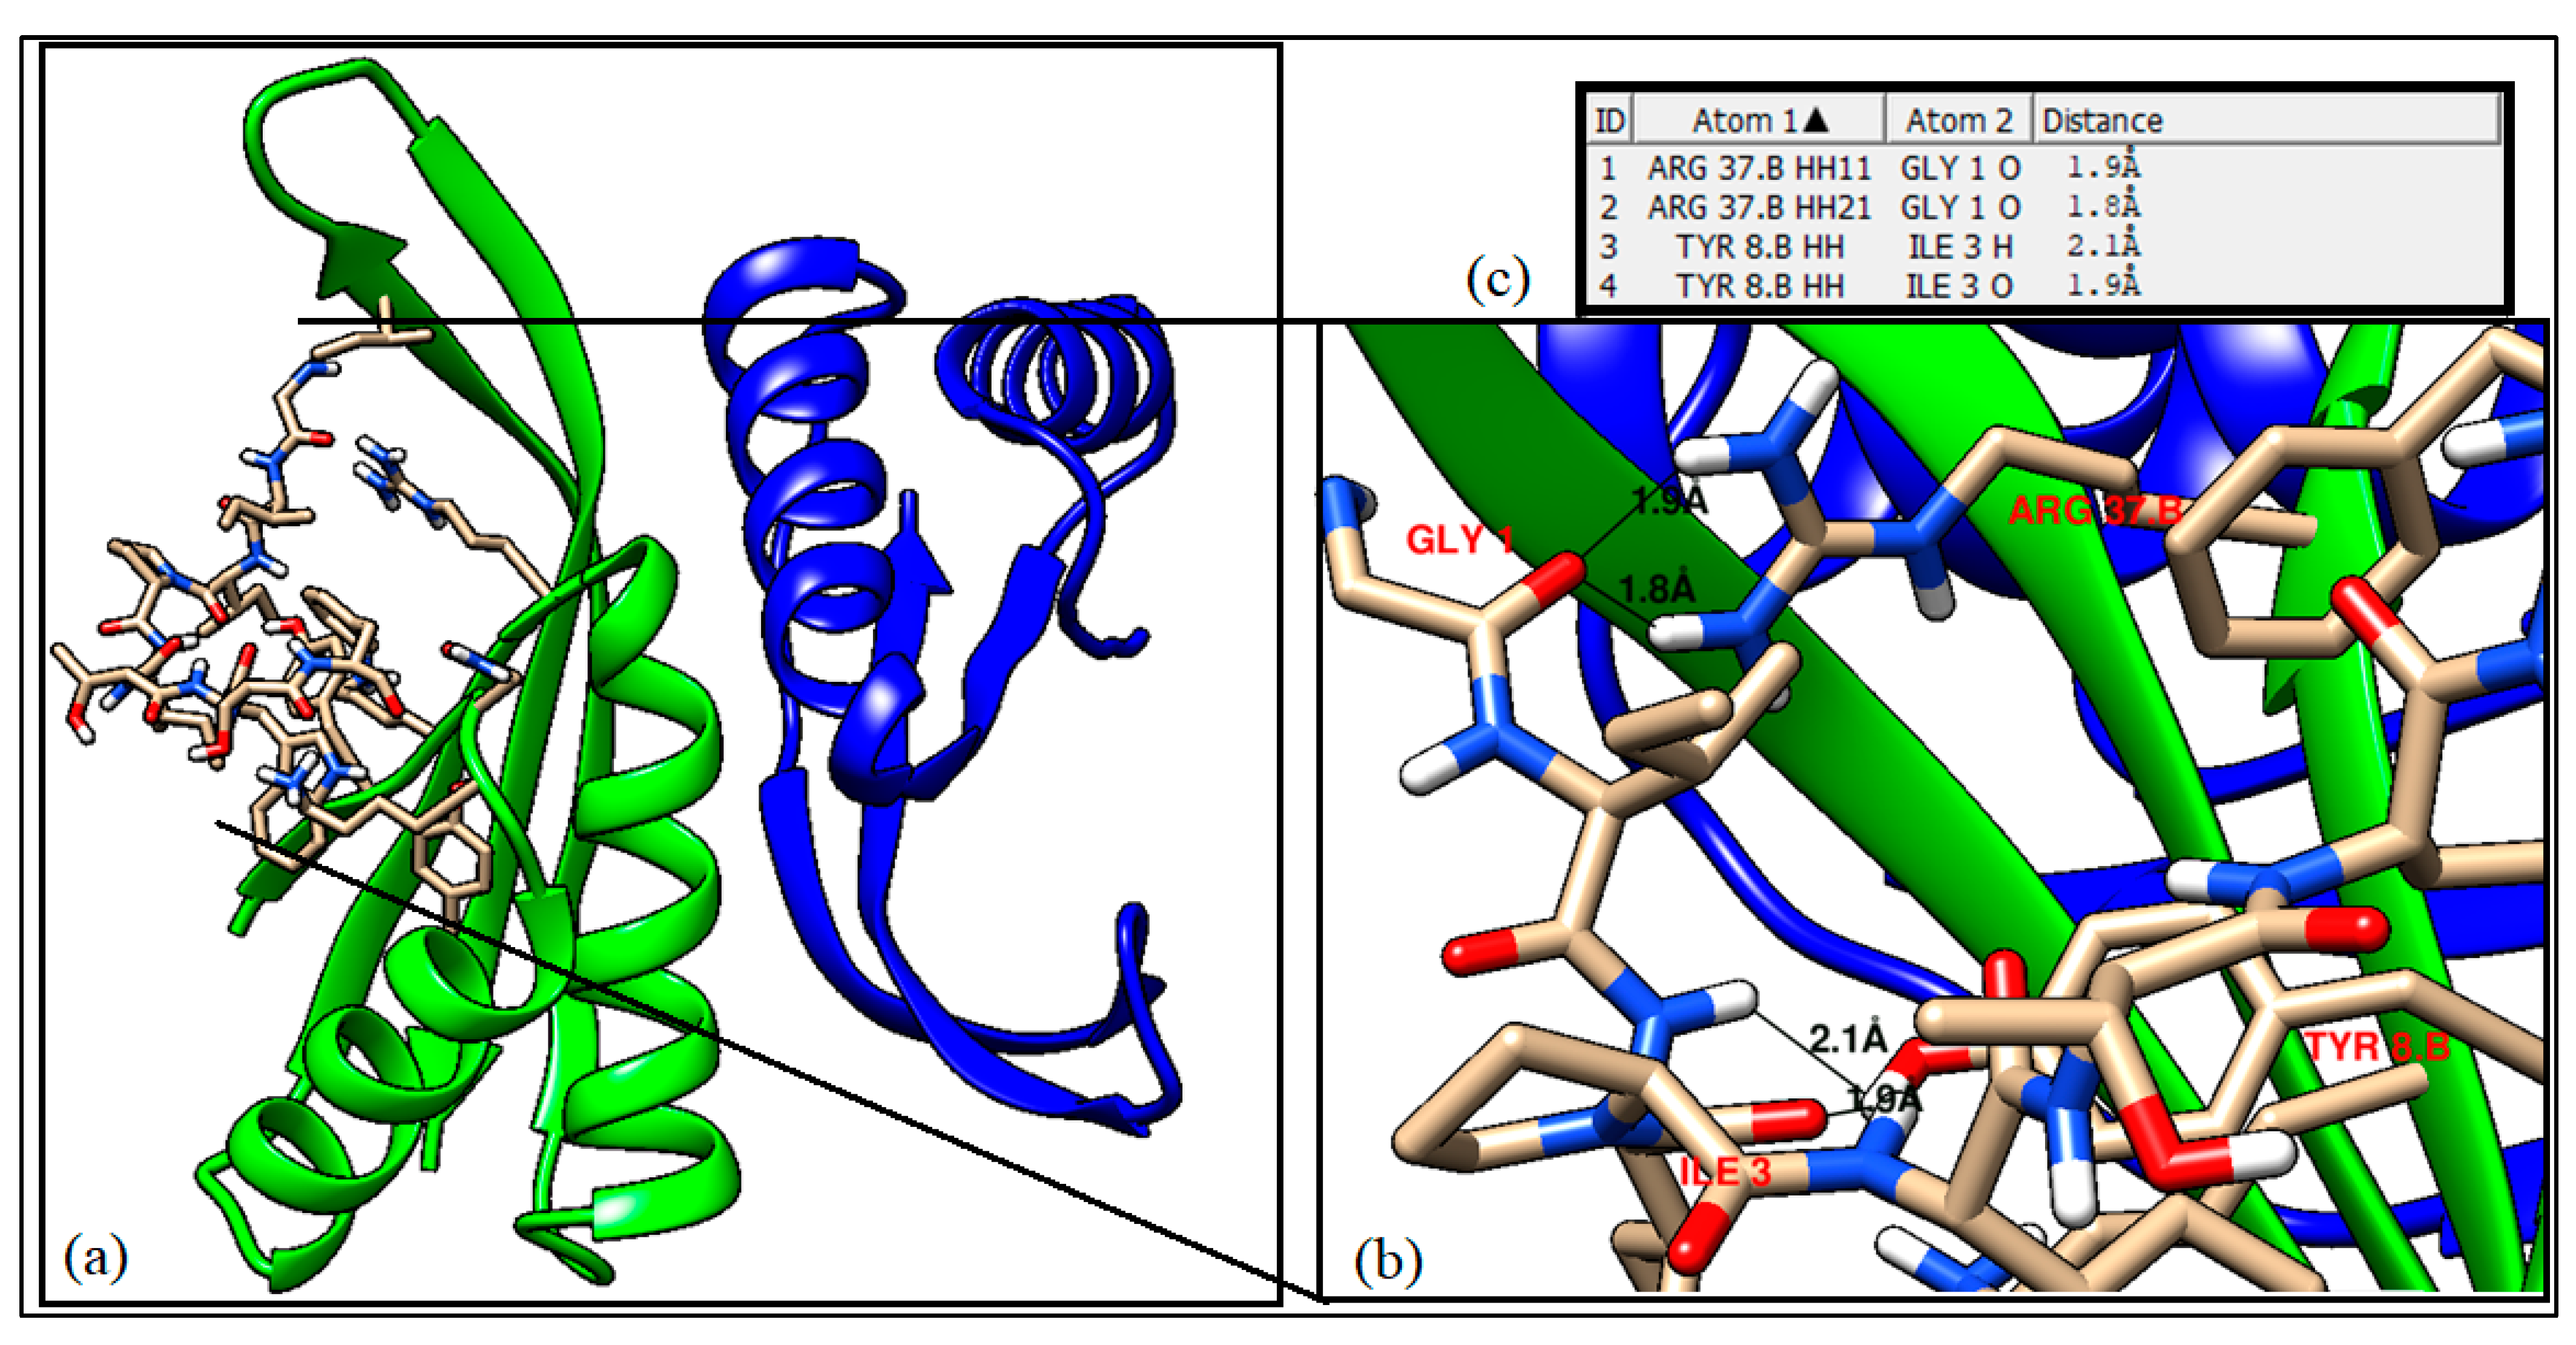
- Molecular docking results for the identified B cell and T cell epitopes
4. Conclusions
Supplementary Materials
Funding
Institutional Review Board Statement
Informed Consent Statement
Data Availability Statement
Conflicts of Interest
References
- Denning, D.W.; Pleuvry, A.; Cole, D.C. Global burden of allergic bronchopulmonary aspergillosis with asthma and its complication chronic pulmonary aspergillosis in adults. Med. Mycol. 2013, 51, 361–370. [Google Scholar] [CrossRef] [PubMed]
- Özdemir, Ö.; Pop, S.; Engin, M.M.N. COVID-19 in an Allergic Bronchopulmonary Aspergillosis Patient: A Case Report. Turk. Arch. Pediatr. 2021, 56, 396. [Google Scholar]
- Arastehfar, A.; Carvalho, A.; van de Veerdonk, F.L.; Jenks, J.D.; Koehler, P.; Krause, R.; Cornely, O.A.; Perlin, D.S.; Lass-Flörl, C.; Hoenigl, M.; et al. COVID-19 associated pulmonary aspergillosis (CAPA)—From immunology to treatment. J. Fungi 2020, 6, 91. [Google Scholar] [CrossRef] [PubMed]
- Feys, S.; Almyroudi, M.P.; Braspenning, R.; Lagrou, K.; Spriet, I.; Dimopoulos, G.; Wauters, J. A visual and comprehensive review on COVID-19-associated pulmonary aspergillosis (CAPA). J. Fungi 2021, 7, 1067. [Google Scholar] [CrossRef]
- Georgelis, N.; Nikolaidis, N.; Cosgrove, D.J. Bacterial expansins and related proteins from the world of microbes. Appl. Microbiol. Biotechnol. 2015, 99, 3807–3823. [Google Scholar] [CrossRef]
- Galli, S.J.; Tsai, M.; Piliponsky, A.M. The development of allergic inflammation. Nature 2008, 454, 445–454. [Google Scholar] [CrossRef]
- Thakur, R.; Shankar, J. In silico Identification of Potential Peptides or Allergen Shot Candidates Against Aspergillus fumigatus. BioResearch Open Access 2016, 5, 330–341. [Google Scholar] [CrossRef]
- Rabe, U. Are Fungal Spores Relevant Outdoor Allergens? Laryngo-Rhino-Otologie 2020, 99, 292. [Google Scholar]
- Nierman, W.C.; Pain, A.; Anderson, M.J.; Wortman, J.R.; Kim, H.S.; Arroyo, J.; Berriman, M.; Abe, K.; Archer, D.B.; Bermejo, C.; et al. Genomic sequence of the pathogenic and allergenic filamentous fungus Aspergillus fumigatus. Nature 2005, 438, 1151. [Google Scholar] [CrossRef]
- Available online: http://www.uniprot.org/uniprot/Q4WUD1 (accessed on 22 September 2017).
- Da Silva, L.B.R.; Taborda, C.P.; Nosanchuk, J.D. Advances in Fungal Peptide Vaccines. J. Fungi 2020, 6, 119. [Google Scholar] [CrossRef]
- Kardani, K.; Bolhassani, A.; Namvar, A. An overview of in silico vaccine design against different pathogens and cancer. Expert Rev. Vaccines 2020, 19, 699–726. [Google Scholar] [CrossRef] [PubMed]
- Poland, G.A.; Ovsyannikova, I.G.; Kennedy, R.B. Personalized vaccinology: A review. Vaccine 2018, 36, 5350–5357. [Google Scholar] [CrossRef] [PubMed]
- Whitaker, J.A.; Ovsyannikova, I.G.; Poland, G.A. Adversomics: A new paradigm for vaccine safety and design. Expert Rev. Vaccines 2015, 14, 935–947. [Google Scholar] [CrossRef] [PubMed]
- Nugent, T.; Jones, D.T. Transmembrane protein topology prediction using support vector machines. BMC Bioinform. 2009, 10, 159. [Google Scholar] [CrossRef]
- Doytchinova, I.A.; Flower, D.R. VaxiJen: A server for prediction of protective antigens, tumour antigens and subunit vaccines. BMC Bioinform. 2007, 8, 4. [Google Scholar] [CrossRef] [PubMed]
- Gasteiger, E.; Hoogland, C.; Gattiker, A.; Wilkins, M.R.; Appel, R.D.; Bairoch, A. Protein identification and analysis tools on the ExPASy server. In The Proteomics Protocols Handbook; Humana Press: Humana Totowa, NJ, USA, 2005; pp. 571–607. [Google Scholar]
- Geourjon, C.; Deleage, G. SOPMA: Significant improvements in protein secondary structure prediction by consensus prediction from multiple alignments. Bioinformatics 1995, 11, 681–684. [Google Scholar] [CrossRef] [PubMed]
- Waterhouse, A.; Bertoni, M.; Bienert, S.; Studer, G.; Tauriello, G.; Gumienny, R.; Heer, F.T.; de Beer, T.A.P.; Rempfer, C.; Bordoli, L.; et al. SWISS-MODEL: Homology modelling of protein structures and complexes. Nucleic Acids Res. 2018, 46, W296–W303. [Google Scholar] [CrossRef]
- Van Gunsteren, W.F.; Berendsen, H.J. Algorithms for macromolecular dynamics and constraint dynamics. Mol. Phys. 1977, 34, 1311–1327. [Google Scholar] [CrossRef]
- Buchan, D.W.; Minneci, F.; Nugent, T.C.; Bryson, K.; Jones, D.T. Scalable web services for the PSIPRED Protein Analysis Workbench. Nucleic Acids Res. 2013, 41, W349–W357. [Google Scholar] [CrossRef]
- Jones, D.T.; Swindells, M.B. Getting the most from PSI-BLAST. Trends Biochem. Sci. 2002, 27, 161–164. [Google Scholar] [CrossRef]
- Martin, A.C. Mapping PDB chains to UniProtKB entries. Bioinformatics 2005, 21, 4297–4301. [Google Scholar] [CrossRef] [PubMed]
- Lobley, A.; Sadowski, M.I.; Jones, D.T. pGenTHREADER and pDomTHREADER: New methods for improved protein fold recognition and superfamily discrimination. Bioinformatics 2009, 25, 1761–1767. [Google Scholar] [CrossRef] [PubMed]
- Remmert, M.; Biegert, A.; Hauser, A.; Söding, J. HHblits: Lightning-fast iterative protein sequence searching by HMM-HMM alignment. Nat. Methods 2012, 9, 173–175. [Google Scholar] [CrossRef]
- Webb, B.; Sali, A. Comparative protein structure modeling using MODELLER. Curr. Protoc. Bioinform. 2016, 54, 5–6. [Google Scholar] [CrossRef] [PubMed]
- Benkert, P.; Künzli, M.; Schwede, T. QMEAN server for protein model quality estimation. Nucleic Acids Res. 2009, 37 (Suppl. S2), W510–W514. [Google Scholar] [CrossRef] [PubMed]
- Laskowski, R.A.; MacArthur, M.W.; Thornton, J.M. (2006). PROCHECK: Validation of protein-structure coordinates. Int. Tables Crystallogr. 2006, F, 722–725. [Google Scholar]
- Lovell, S.C.; Davis, I.W.; Arendall, W.B.; de Bakker PI, W.; Word, J.M.; Prisant, M.G.; Richardson, J.S.; Richardson, D.C. Structure validation by Calpha geometry: Phi, psi and Cbeta deviation. Proteins 2003, 50, 437–450. [Google Scholar] [CrossRef]
- Lengths, M.; Angles, M. Limitations of structure evaluation tools errata. Quick Guidel. Comput. Drug Des. 2018, 16, 75. [Google Scholar]
- Rodrigues, J.P.; Levitt, M.; Chopra, G. KoBaMIN: A knowledge-based minimization web server for protein structure refinement. Nucleic Acids Res. 2012, 40, W323–W328. [Google Scholar] [CrossRef]
- Fieser, T.M.; Tainer, J.A.; Geysen, H.M.; Houghten, R.A.; Lerner, R.A. Influence of protein flexibility and peptide conformation on reactivity of monoclonal anti-peptide antibodies with a protein alpha-helix. Proc. Natl. Acad. Sci. USA 1987, 84, 8568–8572. [Google Scholar] [CrossRef]
- Dhanda, S.K.; Mahajan, S.; Paul, S.; Yan, Z.; Kim, H.; Jespersen, M.C.; Jurtz, V.; Andreatta, M.; Greenbaum, J.A.; Marcatili, P.; et al. IEDB-AR: Immune epitope database—Analysis resource in 2019. Nucleic Acids Res. 2019, 47, W502–W506. [Google Scholar] [CrossRef] [PubMed]
- Kolaskar, A.S.; Tongaonkar, P.C. A semi-empirical method for prediction of antigenic determinants on protein antigens. FEBS Lett. 1990, 276, 172–174. [Google Scholar] [CrossRef]
- Parker, J.M.R.; Guo, D.; Hodges, R.S. New hydrophilicity scale derived from high-performance liquid chromatography peptide retention data: Correlation of predicted surface residues with antigenicity and X-ray-derived accessible sites. Biochemistry 1986, 25, 5425–5432. [Google Scholar] [CrossRef] [PubMed]
- Emini, E.A.; Hughes, J.V.; Perlow, D.; Boger, J. Induction of hepatitis A virus-neutralizing antibody by a virus-specific synthetic peptide. J. Virol. 1985, 55, 836–839. [Google Scholar] [CrossRef]
- Larsen JE, P.; Lund, O.; Nielsen, M. Improved method for predicting linear B-cell epitopes. Immunome Res. 2006, 2, 1–7. [Google Scholar] [CrossRef] [PubMed][Green Version]
- Karplus, P.A.; Schulz, G.E. Prediction of chain flexibility in proteins. NW 1985, 72, 212–213. [Google Scholar] [CrossRef]
- Chou, P.Y.; Fasman, G.D. Prediction of the secondary structure of proteins from their amino acid sequence. Adv. Enzym. 1978, 47, 45–147. [Google Scholar]
- Larsen, M.V.; Lundegaard, C.; Lamberth, K.; Buus, S.; Lund, O.; Nielsen, M. Large-scale validation of methods for cytotoxic T-lymphocyte epitope prediction. BMC Bioinform. 2007, 8, 424. [Google Scholar] [CrossRef]
- Nielsen, M.; Lundegaard, C.; Worning, P.; Lauemøller, S.L.; Lamberth, K.; Buus, S.; Brunak, S.; Lund, O. Reliable prediction of T-cell epitopes using neural networks with novel sequence representations. Protein Sci. 2003, 12, 1007–1017. [Google Scholar] [CrossRef]
- Peters, B.; Sette, A. Generating quantitative models describing the sequence specificity of biological processes with the stabilized matrix method. BMC Bioinform. 2005, 6, 132. [Google Scholar] [CrossRef]
- Maupetit, J.; Derreumaux, P.; Tuffery, P. PEP-FOLD: An online resource for de novo peptide structure prediction. Nucleic Acids Res. 2009, 37 (Suppl. S2), W498–W503. [Google Scholar] [CrossRef] [PubMed]
- Shen, Y.; Maupetit, J.; Derreumaux, P.; Tufféry, P. Improved PEP-FOLD approach for peptide and mini protein structure prediction. J. Chem. Theory Comput. 2014, 10, 4745–4758. [Google Scholar] [CrossRef] [PubMed]
- Kozakov, D.; Hall, D.R.; Xia, B.; Porter, K.A.; Padhorny, D.; Yueh, C.; Beglov, D.; Vajda, S. The ClusPro web server for protein-protein docking. Nat. Protoc. 2017, 12, 255. [Google Scholar] [CrossRef] [PubMed]
- Kozakov, D.; Hall, D.R.; Beglov, D.; Brenke, R.; Comeau, S.R.; Shen, Y.; Li, K.; Zheng, J.; Vakili, P.; Paschalidis, I.C.; et al. Achieving reliability and high accuracy in automated protein docking: ClusPro, PIPER, SDU, and stability analysis in CAPRI rounds 13–19. Proteins Struct. Funct. Bioinform. 2010, 78, 3124–3130. [Google Scholar] [CrossRef] [PubMed]
- Janeway, C.A., Jr.; Travers, P.; Walport, M.; Shlomchik, M.J. The interaction of the antibody molecule with specific antigen. In Immunobiology: The Immune System in Health and Disease, 5th ed.; Garland Science: Bethesda, MD, USA, 2001. [Google Scholar]
- Buchan, D.W.; Jones, D.T. The PSIPRED protein analysis workbench: 20 years on. Nucleic Acids Res. 2019, 47, W402–W407. [Google Scholar] [CrossRef]
- Bienert, S.; Waterhouse, A.; De Beer, T.A.; Tauriello, G.; Studer, G.; Bordoli, L.; Schwede, T. The SWISS-MODEL Repository—new features and functionality. Nucleic Acids Res. 2017, 45, D313–D319. [Google Scholar] [CrossRef]
- Eisenberg, D.; Lüthy, R.; Bowie, J.U. [20] VERIFY3D: Assessment of protein models with three-dimensional profiles. Methods Enzymol. 1997, 277, 396–404. [Google Scholar]
- Bui, H.H.; Sidney, J.; Dinh, K.; Southwood, S.; Newman, M.J.; Sette, A. Predicting population coverage of T-cell epitope-based diagnostics and vaccines. BMC Bioinform. 2006, 7, 153. [Google Scholar] [CrossRef]
- Santos, K.B.; Guedes, I.A.; Karl, A.L.; Dardenne, L.E. Highly Flexible Ligand Docking: Benchmarking of the DockThor Program on the LEADS-PEP Protein–Peptide Data Set. J. Chem. Inf. Modeling 2020, 60, 667–683. [Google Scholar] [CrossRef]
- Sharma, A.; Hofmeyr, A.; Bansal, A.; Thakkar, D.; Lam, L.; Harrington, Z.; Bhonagiri, D. COVID-19 associated pulmonary aspergillosis (CAPA): An Australian case report. Med. Mycol. Case Rep. 2021, 31, 6–10. [Google Scholar] [CrossRef]
- Salmanton-García, J.; Sprute, R.; Stemler, J.; Bartoletti, M.; Dupont, D.; Valerio, M.; Garcia-Vidal, C.; Falces-Romero, I.; Machado, M.; de la Villa, S.; et al. COVID-19–associated pulmonary aspergillosis, March–August 2020. Emerg. Infect. Dis. 2021, 27, 1077. [Google Scholar] [CrossRef] [PubMed]
- Skok, K.; Vander, K.; Setaffy, L.; Kessler, H.H.; Aberle, S.; Bargfrieder, U.; Trauner, M.; Lax, S.F. COVID-19 autopsies: Procedure, technical aspects and cause of fatal course. Experiences from a single center. Pathol.-Res. Pract. 2021, 217, 153305. [Google Scholar] [CrossRef] [PubMed]
- Verweij, P.E.; Brüggemann, R.J.; Azoulay, E.; Bassetti, M.; Blot, S.; Buil, J.B.; Calandra, T.; Chiller, T.; Clancy, C.J.; Cornely, O.A.; et al. Taskforce report on the diagnosis and clinical management of COVID-19-associated pulmonary aspergillosis. Intensive Care Med. 2021, 47, 819–834. [Google Scholar] [CrossRef] [PubMed]


| Template | NetScore | p-Value | PairE | SolvE | Alignment Score | Alignment Length | Structure Length | Sequence Length |
|---|---|---|---|---|---|---|---|---|
| 3D3O-A | 72.732 | 2 × 10⁻⁶ | −186.3 | −15.0 | 340.0 | 197 | 208 | 344 |
| 1n10-A | 58.550 | 6 × 10⁻⁵ | −92.5 | −6.1 | 272.0 | 201 | 228 | 344 |
| 2HCZ-X | 58.548 | 6 × 10⁻⁵ | −144.3 | −7.8 | 256.0 | 213 | 242 | 344 |
| Template | Sequence Identity | Found by | Method | Resolution | Sequence Similarity | Coverage |
|---|---|---|---|---|---|---|
| 3D3O-A | 31.61 | HHblits | X-ray | 1.90 Å | 0.36 | 0.56 |
| 1n10-A | 18.78 | HHblits | X-ray | 2.90 Å | 0.31 | 0.57 |
| 2HCZ-X | 19.42 | HHblits | X-ray | 2.75 Å | 0.37 | 0.56 |
| Model No. | KB Energy (Kcal/mol) | RMSD (Initial) | RMSD (Reference) | GDT-TS (Reference) | GDT-HA (Reference) | Time Spent (s) |
|---|---|---|---|---|---|---|
| Model 1 | −2708.3279 | 2.663 | 2.663 | 0.785 | 0.624 | 281 |
| Model 2 | −3235.077 | 0.379 | 0.379 | 1.000 | 0.971 | 50 |
| PEPTIDE | Karplus and Schulz Flexibility Prediction (Threshold Value = 1.018) | Parker Hydrophilicity Prediction (Threshold Value = 2.505) | Emini Surface Accessibility Prediction (Threshold Value = 1.000) | Chou and Fasman Beta-Turn Prediction (Threshold Value = 1.039) |
|---|---|---|---|---|
| 80K | 1.048 | 2.857 | 2.295 | 1.029 |
| P | 1.056 | 3.986 | 2.478 | 1.02 |
| Q | 1.059 | 5.629 | 5.783 | 1.054 |
| A | 1.059 | 6.243 | 4.829 | 1.119 |
| D | 1.062 | 5.729 | 3.734 | 1.191 |
| E | 1.06 | 6.429 | 3.883 | 1.197 |
| D | 1.053 | 5.871 | 2.265 | 1.151 |
| P | 1.046 | 6.5 | 3.005 | 1.261 |
| N | 1.046 | 6 | 2.411 | 1.257 |
| A | 1.061 | 5.814 | 1.866 | 1.356 |
| S | 1.087 | 5.314 | 1.497 | 1.351 |
| S | 1.12 | 5.943 | 1.298 | 1.339 |
| S | 1.146 | 5.871 | 1.081 | 1.32 |
| S | 1.161 | 6.5 | 1.435 | 1.43 |
| S | 1.169 | 6.5 | 1.435 | 1.43 |
| S | 1.169 | 6.5 | 1.435 | 1.43 |
| 96S | 1.61 | 6.5 | 1.435 | 1.43 |
| PEPTIDE | Karplus and Schulz Flexibility Prediction (Threshold Value = 1.018) | Parker Hydrophilicity Prediction (Threshold Value = 2.505) | Emini Surface Accessibility Prediction (Threshold Value = 1.000) | Chou and Fasman Beta-Turn Prediction (Threshold Value = 1.039) |
|---|---|---|---|---|
| 286D | 1.077 | 5.014 | 0.868 | 1.211 |
| G | 1.095 | 6.286 | 1.687 | 1.277 |
| G | 1.09 | 3.929 | 1.324 | 1.210 |
| K | 1.072 | 4.043 | 1.589 | 1.213 |
| T | 1.055 | 3.429 | 0.941 | 1.227 |
| W | 1.039 | 3.357 | 1.373 | 1.141 |
| Q | 1.045 | 3.286 | 2.002 | 1.056 |
| G | 1.060 | 3.071 | 1.961 | 1.047 |
| T | 1.067 | 3.071 | 1.961 | 1.047 |
| T | 1.071 | 5.429 | 2.499 | 1.114 |
| R | 1.058 | 4.300 | 2.261 | 1.137 |
| T | 1.038 | 4.486 | 3.674 | 1.137 |
| 298S | 1.013 | 2.429 | 2.204 | 1.086 |
| Sl. No. | Peptide Sequence | Start Position | Interacting MHC II Alleles | Percentile Rank |
|---|---|---|---|---|
| 1. | LDLFQNAFTQLADVS | 221 | HLA-DPA1*01:01 HLA-DPA1*02:01 HLA-DQA1*01:02 HLA-DRB1*04:01 HLA-DRB1*04:05 HLA-DRB1*08:02 HLA-DPA1*02:01 HLA-DRB1*11:01 HLA-DRB1*15:01 HLA-DPA1*01:03 HLA-DPB3*02:02 HLA-DPA1*03:01 HLA-DRB1*01:01 HLA-DRB5*01:01 HLA-DRB1*12:01 | 0.16 1 1.68 1.83 2.40 2.96 3.01 3.84 5.37 6.05 6.20 6.44 6.65 7.08 7.93 |
| 2. | TQEQDTVSAAPAEPT | 112 | HLA-DQA1*04:01 HLA-DQA1*03:01 HLA-DQA1*05:01 HLA-DQA1*05:01 | 0.33 1.12 12.46 14.01 |
| 3. | WQGTRTSYNFFEKS | 291 | HLA-DPA1*01:01 HLA-DPA1*02:01 HLA-DPA1*02:01 HLA-DRB1*11:01 | 0.73 5.63 7.77 15.78 |
| 4. | WPTVDEIVPVKKPQA | 69 | HLA-DRB1*11:01 HLA-DRB1*08:02 HLA-DRB1*09:01 HLA-DRB5*01:01 HLA-DRB1*03:01 | 0.61 1.92 5.40 11.11 11.43 |
| 5. | FGTAYSGAAWNNAAE | 176 | HLA-DRB1*09:01 HLA-DRB1*04:01 HLA-DRB5*01:01 HLA-DQA1*05:01 | 0.66 8.36 10.53 13.58 |
| Sl No. | Identified Peptide Sequences | Starting Position | Core Sequence | Interacting Allele | IC50 Value | Population Coverage |
|---|---|---|---|---|---|---|
| 1. | LDLFQNAFTQLADVS | 221 | FQNAFTQLA | HLA-DRB1*01:01 | 18.70 | 99.03% |
| 2. | TQEQDTVSAAPAEPT | 112 | VSAAPAEPT | HLA-DRB1*01:01 | 1148.22 | 75.22% |
| 3. | WQGTRTSYNFFEKS | 291 | TRTSYNFFE | HLA-DRB1*04:05 | 1908.57 | 68.35% |
| 4. | WPTVDEIVPVKKPQA | 69 | IVPVKKPQA | HLA-DRB1*11:01 | 931.14 | 29.43% |
| 5. | FGTAYSGAAWNNAAE | 176 | YSGAAWNNA | HLA-DRB1*01:01 | 304.21 | 30.76% |
| Sl No. | Atom 1 | Atom 2 | Distance (Å) |
|---|---|---|---|
| 1. | ARG 37.B HH11 | GLY 1 O | 1.919 |
| 2. | ARG 37.B HH21 | GLY 1 O | 1.774 |
| 3. | TYR 8.B OH | ILE 3 H | 2.086 |
| 4. | TYR 8.B HH | ILE 3 O | 1.883 |
Publisher’s Note: MDPI stays neutral with regard to jurisdictional claims in published maps and institutional affiliations. |
© 2022 by the author. Licensee MDPI, Basel, Switzerland. This article is an open access article distributed under the terms and conditions of the Creative Commons Attribution (CC BY) license (https://creativecommons.org/licenses/by/4.0/).
Share and Cite
Basu, A. In Silico Epitope-Based Vaccine Prediction against Fungal Infection Aspergillosis. Challenges 2022, 13, 29. https://doi.org/10.3390/challe13020029
Basu A. In Silico Epitope-Based Vaccine Prediction against Fungal Infection Aspergillosis. Challenges. 2022; 13(2):29. https://doi.org/10.3390/challe13020029
Chicago/Turabian StyleBasu, Anamika. 2022. "In Silico Epitope-Based Vaccine Prediction against Fungal Infection Aspergillosis" Challenges 13, no. 2: 29. https://doi.org/10.3390/challe13020029
APA StyleBasu, A. (2022). In Silico Epitope-Based Vaccine Prediction against Fungal Infection Aspergillosis. Challenges, 13(2), 29. https://doi.org/10.3390/challe13020029