Review

Soiling Losses: A Barrier for India’s Energy Security Dependency from Photovoltaic Power

1
Environmental and Sustainability Institute, University of Exeter, Penryn, Cornwall TR10 9FE, UK
2
College of Engineering, Mathematics and Physical Sciences, Renewable Energy, University of Exeter, Cornwall TR10 9FE, UK
Challenges 2020, 11(1), 9; https://doi.org/10.3390/challe11010009
Submission received: 30 March 2020 / Revised: 21 May 2020 / Accepted: 22 May 2020 / Published: 28 May 2020

Abstract

:
Worldwide photovoltaic power generation is affected by deposited dust on photovoltaic (PV) systems, which creates soiling losses. In this work, factors that have a detrimental influence on dust deposition and an impact on PV systems performance were reviewed. The different ways that dust deposition can be a barrier for India’s energy security plan involving PV were also discussed. Different available cleaning techniques were also introduced. The nature, size, and morphology of dust particles vary with geographical location. Any increase of the PV tilt angle, or high wind speed and heavy rain showers reduce dust deposition. Deposited dust reduces the incident transmitted light on the PV, which has an adverse impact on the reduction of short circuit current. However, the open-circuit voltage has a reduced effect due to dust deposition. The enhancement of temperature caused by dust-covered PVs is still a debatable area. A universal cleaning technique is required to eliminate the soiling losses from PV. India has a solar mission to generate 100 GW of PV power by 2022. However, India’s poor air quality can undermine efforts to achieve this target.

1. Introduction

Energy security entails access to energy resources at an affordable price and without interruptions. The term energy security was first developed during the 1970 oil crisis period, and for the last 40 years, the international community has tried to create a uniform definition for energy security. The energy security term is associated with both the countries that face exporting energy issues and the countries that face importing energy issues. For a country that imports energy, energy security is obtained by importing low price energy to meet the required demand in a timely manner, while countries that export energy obtain energy security by selling their produced energy at an adequate price [1].
Historically, global energy security for different countries came from coal [2] and crude oil [3]. However, these energy sources produce energy by polluting the environment. Additionally, importing and exporting these energy resources can be an obstacle because of global socio-political turmoil. The world has faced such situation previously after the 1973 oil crisis, the 1979 energy crisis, and the 1990 spike in oil prices, which forced every country to think about their own independent energy resources. In addition, natural hazards, which include earthquakes, floods, hurricanes, ice storms, landslides, tornados, typhoons, volcanic eruptions, and wildfires, can cause issues due to the prolonged recovery time needed [4]. Thus, alternative and self-sufficient energy sources are essential to fully address energy demand. In addition, global electricity demand is expected to be twice as high in 2050 than it is at present. The growing uptake of electric vehicles (EVs) [5], higher living standards in non-OECD (Organization for Economic Co-operation and Development) countries, and further enhanced electrification in various industries are the root causes of this enhanced energy demand [6]. Currently, renewable energy sources are sustainable energy sources, which will not only contribute through the energy sector to help countries become energy secure nations, but will also help to abate global warming by preventing temperatures from rising above 1.5 °C above pre-industrial levels [7,8,9,10,11]. In 2018, electricity generation from renewables reached close to 450 terawatt-hours (TWh) [12]. Globally, renewables now account for over 25% of electricity generation and are expected to increase to over two-thirds of global generation by 2040, with solar photovoltaic (PV) and wind alone accounting for 40% of the total. By 2040, global solar energy generation is expected to be 7200 TWh [12].
The major benefits of using renewable solar sources are benign and noise-free power generation from PV systems, low greenhouse gas (GHG) emissions, and the increasing energy security of a country in a sustainable way [13,14,15,16,17,18,19]. At the end of 2018, global installed solar photovoltaic (PV) capacity exceeded 500 GW, and an additional 500 GW of PV capacity will be installed by 2022–2023, bringing us into the era of TW-scale PV [20]. Photovoltaic power output largely depends on local climatic conditions and the orientation of PV devices [21,22,23,24,25]. For local climate conditions, the major variables are the incident solar radiation, number of sunshine hours, and ambient temperature. Long term soiled (dust) cover on the top of the PV module is also another major influential factor affecting PV performance [26]. Often, soiling losses are underestimated from a soiled cover PV system. In the field, irradiance sensors also suffer from similar types of soil that cover PV systems. Hence, the reduced value of measured irradiance creates an overall performance ratio error from PV power generation. In 2018, solar power production was reduced by 3%–4%, which in turn caused 3–5 billion euros of revenue losses. It is expected that another 4–7 billion euros of revenue losses from soiled PV will be caused by 2023 [27]. Non-ignorable dust deposition factors limit PV power generation by creating a shielding effect on PVs, which decreases solar transmission through the PV surface glass [28]. Dust includes mineral dust in a desert area (Figure 1A), bird droppings (Figure 1B), algae (Figure 1C), pollen in wet and moderate climates (Figure 1D), engine exhaust from industrial areas (Figure 1E), agricultural emissions (Figure 1F), as well as human/animal cells, bacteria, carpet, textile, fibres, sand, clay, and limestone [29]. Based on the particle diameter, dust particles can also be called particulate matter (PM), which are currently a subject of extensive research for the atmospheric science community, medical community, and photovoltaic community. The general term for any PM less than 500 mm in diameter is dust [30]. PM affects air quality and, in turn, human and ecosystem well-being and has an important role in the Earth’s climate system. PM is generated from various sources such as oil-driven vehicles and construction equipment. The presence of PM in the atmosphere has two impacts on the performance of PV devices [31,32,33,34]. First, the presence of PM on a PV module restricts the solar radiation incident on the PV. These particles often scatter the light in either a forward or backward direction, and a fraction of the forward scattering again reaches the PV. Secondly, PM modifies the cloud albedo [35]. Deposited dust has clearly reduced the annual PV power production outcomes by over 10% in various regions, particularly Saharan Africa, the Arabian Peninsula, and the northern parts of India and China [36,37,38].
Through the Jawaharlal Nehru National Solar Mission (JNNSM), India has developed a plan to generate 100 GW of PV power by 2022, which will help the country to become an energy secure country. However, due to the pollution level and soiling on PVs, this target may not be reached. In this work, factors that influence the accumulation of dust on PVs, the power losses from PVs due to dust accumulation, and different removal methods were reviewed. How dust on PV systems degrades the power generation of India, which was intended to be secured by PV generation, was also reviewed.

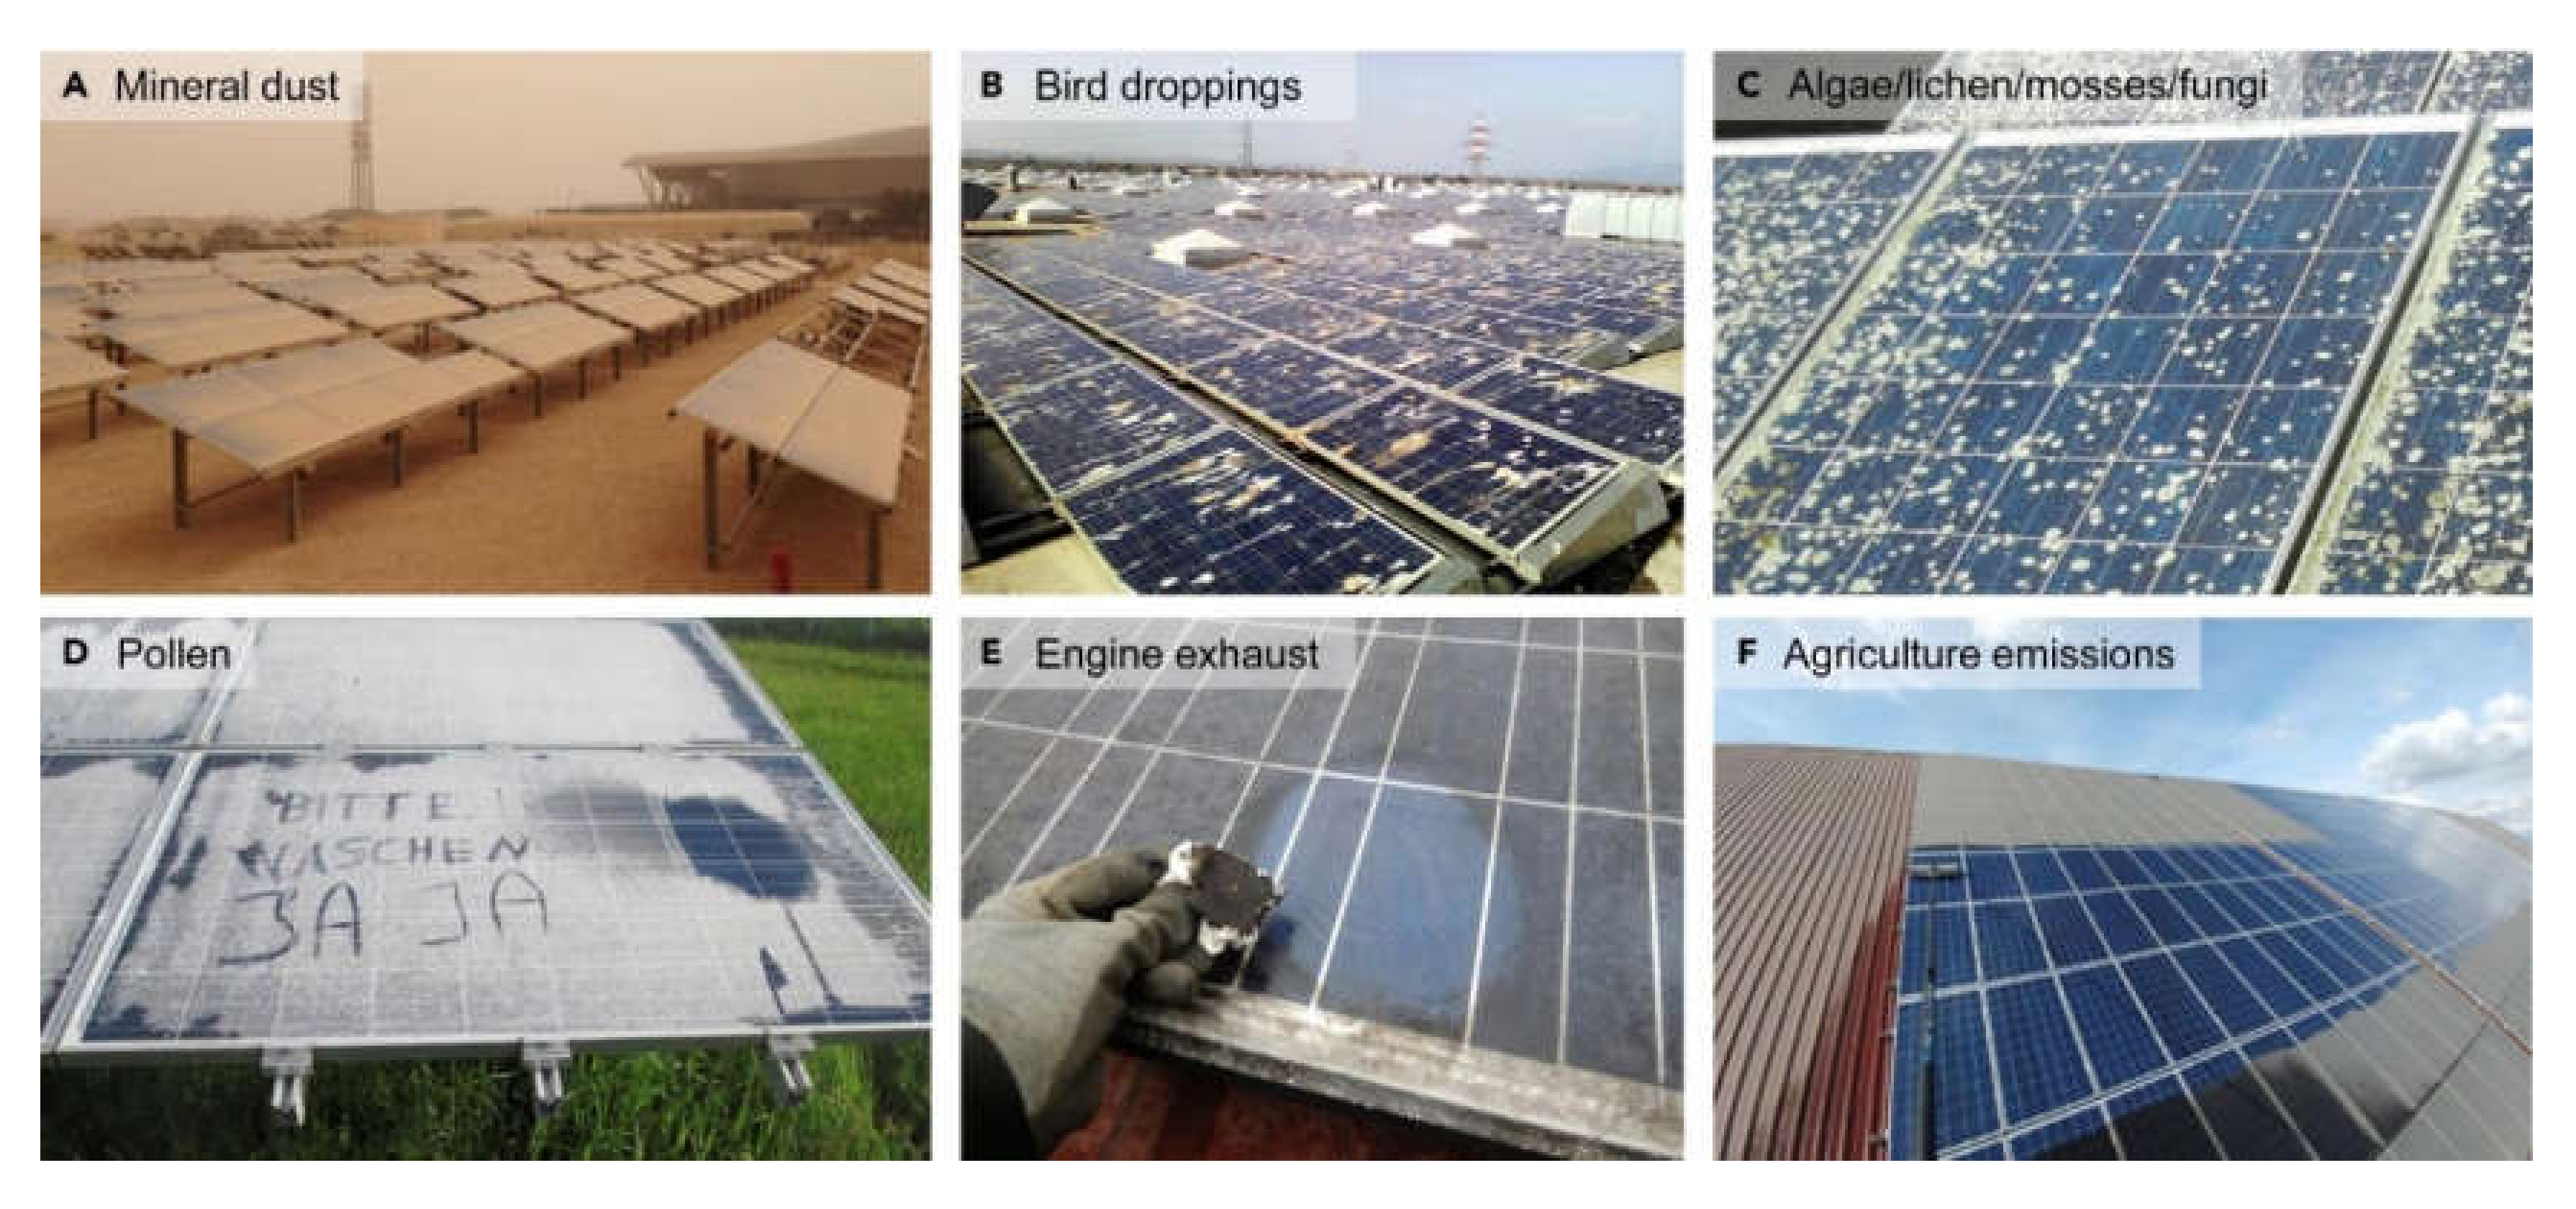
2. Factors Affecting Accumulation of Soiling on PVs

Properties of dust particles vary with location. Electrostatically attracted inorganic materials are common in dry desert locations, while for the coastal area, salts and rain-driven dirt are prevalent. Industrial and cooler locations are affected by windblown organic dirt, deposits from evaporated rain, and atmospheric pollutants from fossil fuels. The Middle East, North Africa, India, and China have the worst soiling accumulation zones in the world, where peak losses can vary between 10% and 70% [40,41]. In Europe, the annual soiling losses can vary from 1% to 7% [42,43,44]. The UK, which is the cleanest region in the world, also suffers from soiling effect, which reduces the transmitted solar intensity by 5%–6% after one-month of continuous exposure [45]. African dust consists of earth crust components such as metal oxides (SiO2, Al2O3, FeO, Fe2O3, CaO) and carbonate (CaCO3, MgCO3). Saharan desert dust contains arsenic, chromium, iron, lead, manganese, nickel, and vanadium [43]. Table 1 summarises the different dust particle properties in different continents. In this section, factors affect the soiling accumulation on PV are summarised.

2.1. Effect of Particle Size

Natural processes and human activities generate dust, which is present in the air in the form of solid suspended particulate matter (PM). Deposited particulate sizes on PV surfaces mostly lie within the 1–50 micron range [51]. Dust particle diameters less than 10 micron and less than 2.5 micron represent PM10 and PM2.5, respectively. Smaller particles, due to lower weight, travel longer distances than PM10 [34]. Particulate ranges between PM2.5 and PM10 never get washed away, even after a heavy rain shower, which reduces the transmission. Smaller PMs are distributed more uniformly compared to larger dust particles due to higher specific surface area. Thus, the voids created between two large particles can be covered with smaller particles and reduce the light transmission in higher order [47]. Particle sizes larger than PM10 are highly localized and have a greater tendency to deposit than a smaller one [52]. However, they have a greater chance of being washed off after a heavy rain shower [53]. Field studies from Chicago [52] and Qatar [54] showed that the majority of the particles sizes were higher than PM10. In most Indian cities, PM10 concentration ranges are between 100 to 400 μg/m3, which exceed the standard limit of 100 μg/m3. Reflectance, scattering, and absorption of incident light on PV cells significantly depend on particle size. Even at moderate wind speed, larger particles tend to be resuspended, while smaller-size dust particles accumulate [55].

2.2. Effect of Wind

Wind speed and direction both have an influence on the dust deposition of PV surfaces. High wind speed has the potential to remove dust from the PV surface, while low wind speed promotes dust accumulation [56]. Sedimentological effect of the wind on PV cell performance is small but systematic [57]. An investigation of dust deposition on a PV collector was conducted using wind tunnel simulations and field experiments, and the authors concluded that wind direction and orientation of the collector have an influential impact on dust deposition. Wind speeds above 2 m/s has less effect on the deposition of dust distribution [58]. At a speed of 25 m/s and relative humidity of 40%, wind can remove approximately 80% dust particles with a diameter of ≥50 μm, about 50% of 25 μm particles, and <5% of 10 μm particles [59]. In another work, it was demonstrated that particles of a size of 10 µm and smaller could only be removed when air velocities were above 25 m/s (~55 miles per hour). Wind with a speed of 0.57 m/s could attach 1334 μg/cm2 of dust to the PV surface with an inclination of 29° and direction of north 10° east. For Libya, minimum wind speed was 6.5 m/s to lift dust from PV surfaces [60].

2.3. Effect of Rain and Moisture

The presence of moisture on a PV module’s surface creates a cohesive force between particles, which causes the particles to adhere to the PV surface [61,62]. Dust deposition and accumulation are highly influenced when adhesion force between PV surfaces and dust elements are strong enough. These include gravitational, capillary, electrostatic, and Van der Waal’s adhesion forces. The presence of humidity in the atmosphere promotes high adhesion forces. Under high humidity, capillary forces contribute 98% of adhesion. For a dry atmosphere, Van der Wall’s forces predominate. Enhancement of humidity from 40% to 80% increases the adhesion by about 80% [63]. Moisture in the atmosphere absorbs solar radiation, which drastically reduces the direct normal incident solar radiation. Places near the ocean experience dense fog in the early morning; hence, the solar radiation is reduced significantly [64]. Moisture content in the air is reduced when wind speeds are high [65,66].
Light rainfall significantly promotes the process of dust deposition. However, heavy rain has the potential to remove soiling from the PV surface. The amount of rainfall may vary from place to place. It was found that below 20 mm of rainfall, the PV surface was not adequately cleaned off in a dry California climate (based on the Köppen–Geiger climate classification) [67,68,69]. Light drizzle type rainfall enhanced dust adhesion on the module, which converted this dust into mud, which was hard to remove without any mechanical cleaning methods [70]. In general, rainy and cloudy conditions enhance the moisture content in the atmosphere, which decreases the PV performance [71].

2.4. Effect on PV Module Top Surface Material

The top surface of the PV module includes glass for traditional modules and different transparent polymer-based acrylics for lightweight structures. Acrylic material has higher dust accumulation than a glass cover [49]. Vertically mounting acrylic glazing showed 16% higher deposition in an experiment conducted in Thar (India) [72]. It was also reported that a PV module surface made with glass attracted less dust than one made with Tedlar [43]. In India, at the Central Building Research Institute in Roorkee, Garg investigated the effect of dust on transmitted solar radiation through different glass and plastic films for inclined angles ranging from 0° to 90°. Transmission of horizontal and vertical glass after 30 days exposure became 66% and 2.2% lower compared to the initial state. Transmission loss was 8% for the glass plate tilted at 45° after an exposure period of 10 days [73]. On very smooth surfaces, adhesion forces between dust particles and the surface are extremely strong, and even very high wind velocities (up to 100 km/h and more) may be unable to remove fine particles from such surfaces [74].

2.5. Effect of Tilt Angle

An increase of the PV module tilt angle affects the stability of the dust particles. For a perfect spherical configuration, up to a 23.4° critical angle, stability is possible, and above this angle, the avalanche process occurs [61,62]. For a fixed period of exposure, an increase in tilt angle reduces the deposited dust density. At a constant tilt angle, dust deposition density increases with the number of exposure days [28,75]. PV power output loss due to soiling at various tilt angles from 0° to 35°, with a 5° increment, was measured at Bahir Dar city, Ethiopia. The highest losses were at 0° and gradually decreased as the tilt angle was increased [76]. Non-uniformity of dust distribution was investigated for 30°, 0°, and 15° tilt angles. The non-uniform distribution between the top, middle, and bottom was 4.4% for a 30° tilt, while they were 2% and 1% for 0° and 15°, respectively [44]. Various tilt angles from 0° to 40° were investigated in Mesa, Arizona (hot, dry climate). The study showed that a 0° tilt offered 2.02% soiling losses, whereas a 33° tilt offered 0.96%. In that experiment, bird droppings were not considered, as the researchers cleaned the bird droppings [77]. For a dusty environment, where the local latitude angle is less than 15°, the optimum tilt angle for decreasing soiling loss is 15°. Experimental work from Egypt showed a 71% dust density reduction, while the tilt angle changed from 0° to 90° [44]. For the autumn season in Lahore (31.52° N, 74.35° E), 51° was the optimal tilt angle to generate PV power, which changed to 55° when the PV system was dust-covered [78]. Average soiling losses decreased from 1.11% to 0.11% when the PV system tilt angle changed from 0° to 90° for urban locations in South Asia and Middle East regions [79]. This established that dust accumulation diminishes with increasing tilt angle. Thus, a vertical plane bifacial PV will contribute higher power than a monofacial and horizontally placed PV system. However, the cost of cleaning can be higher for this type of PV [80]. The tilted tracking PV system has a low angle of incident losses compared to the horizontal PV system. A soil covered tracking PV system shows only up to 6% losses, while a non-tracking horizontally placed PV can experience up to 10% losses [81].

3. Soiling Effect on PV Performance

Soiling has a negative impact on PV performance by affecting the optical, thermal, and electrical characteristics of the PV module [82]. Most often, spectral losses due to soiling occur in the range of 450–500 nm wavelength compared to other wavelengths. Thus, the adverse impact on PV due to soiling is higher for wider bandgap absorber PVs. For 4.25 mg/cm2 dust concentration, a-Si and CdTe showed a 33% reduction, while c-Si and CIGS showed 28.6% and 28.5% reductions, respectively [44]. Up to 0.6% of daily performance losses are possible from a soiled PV system under soiling [83,84].

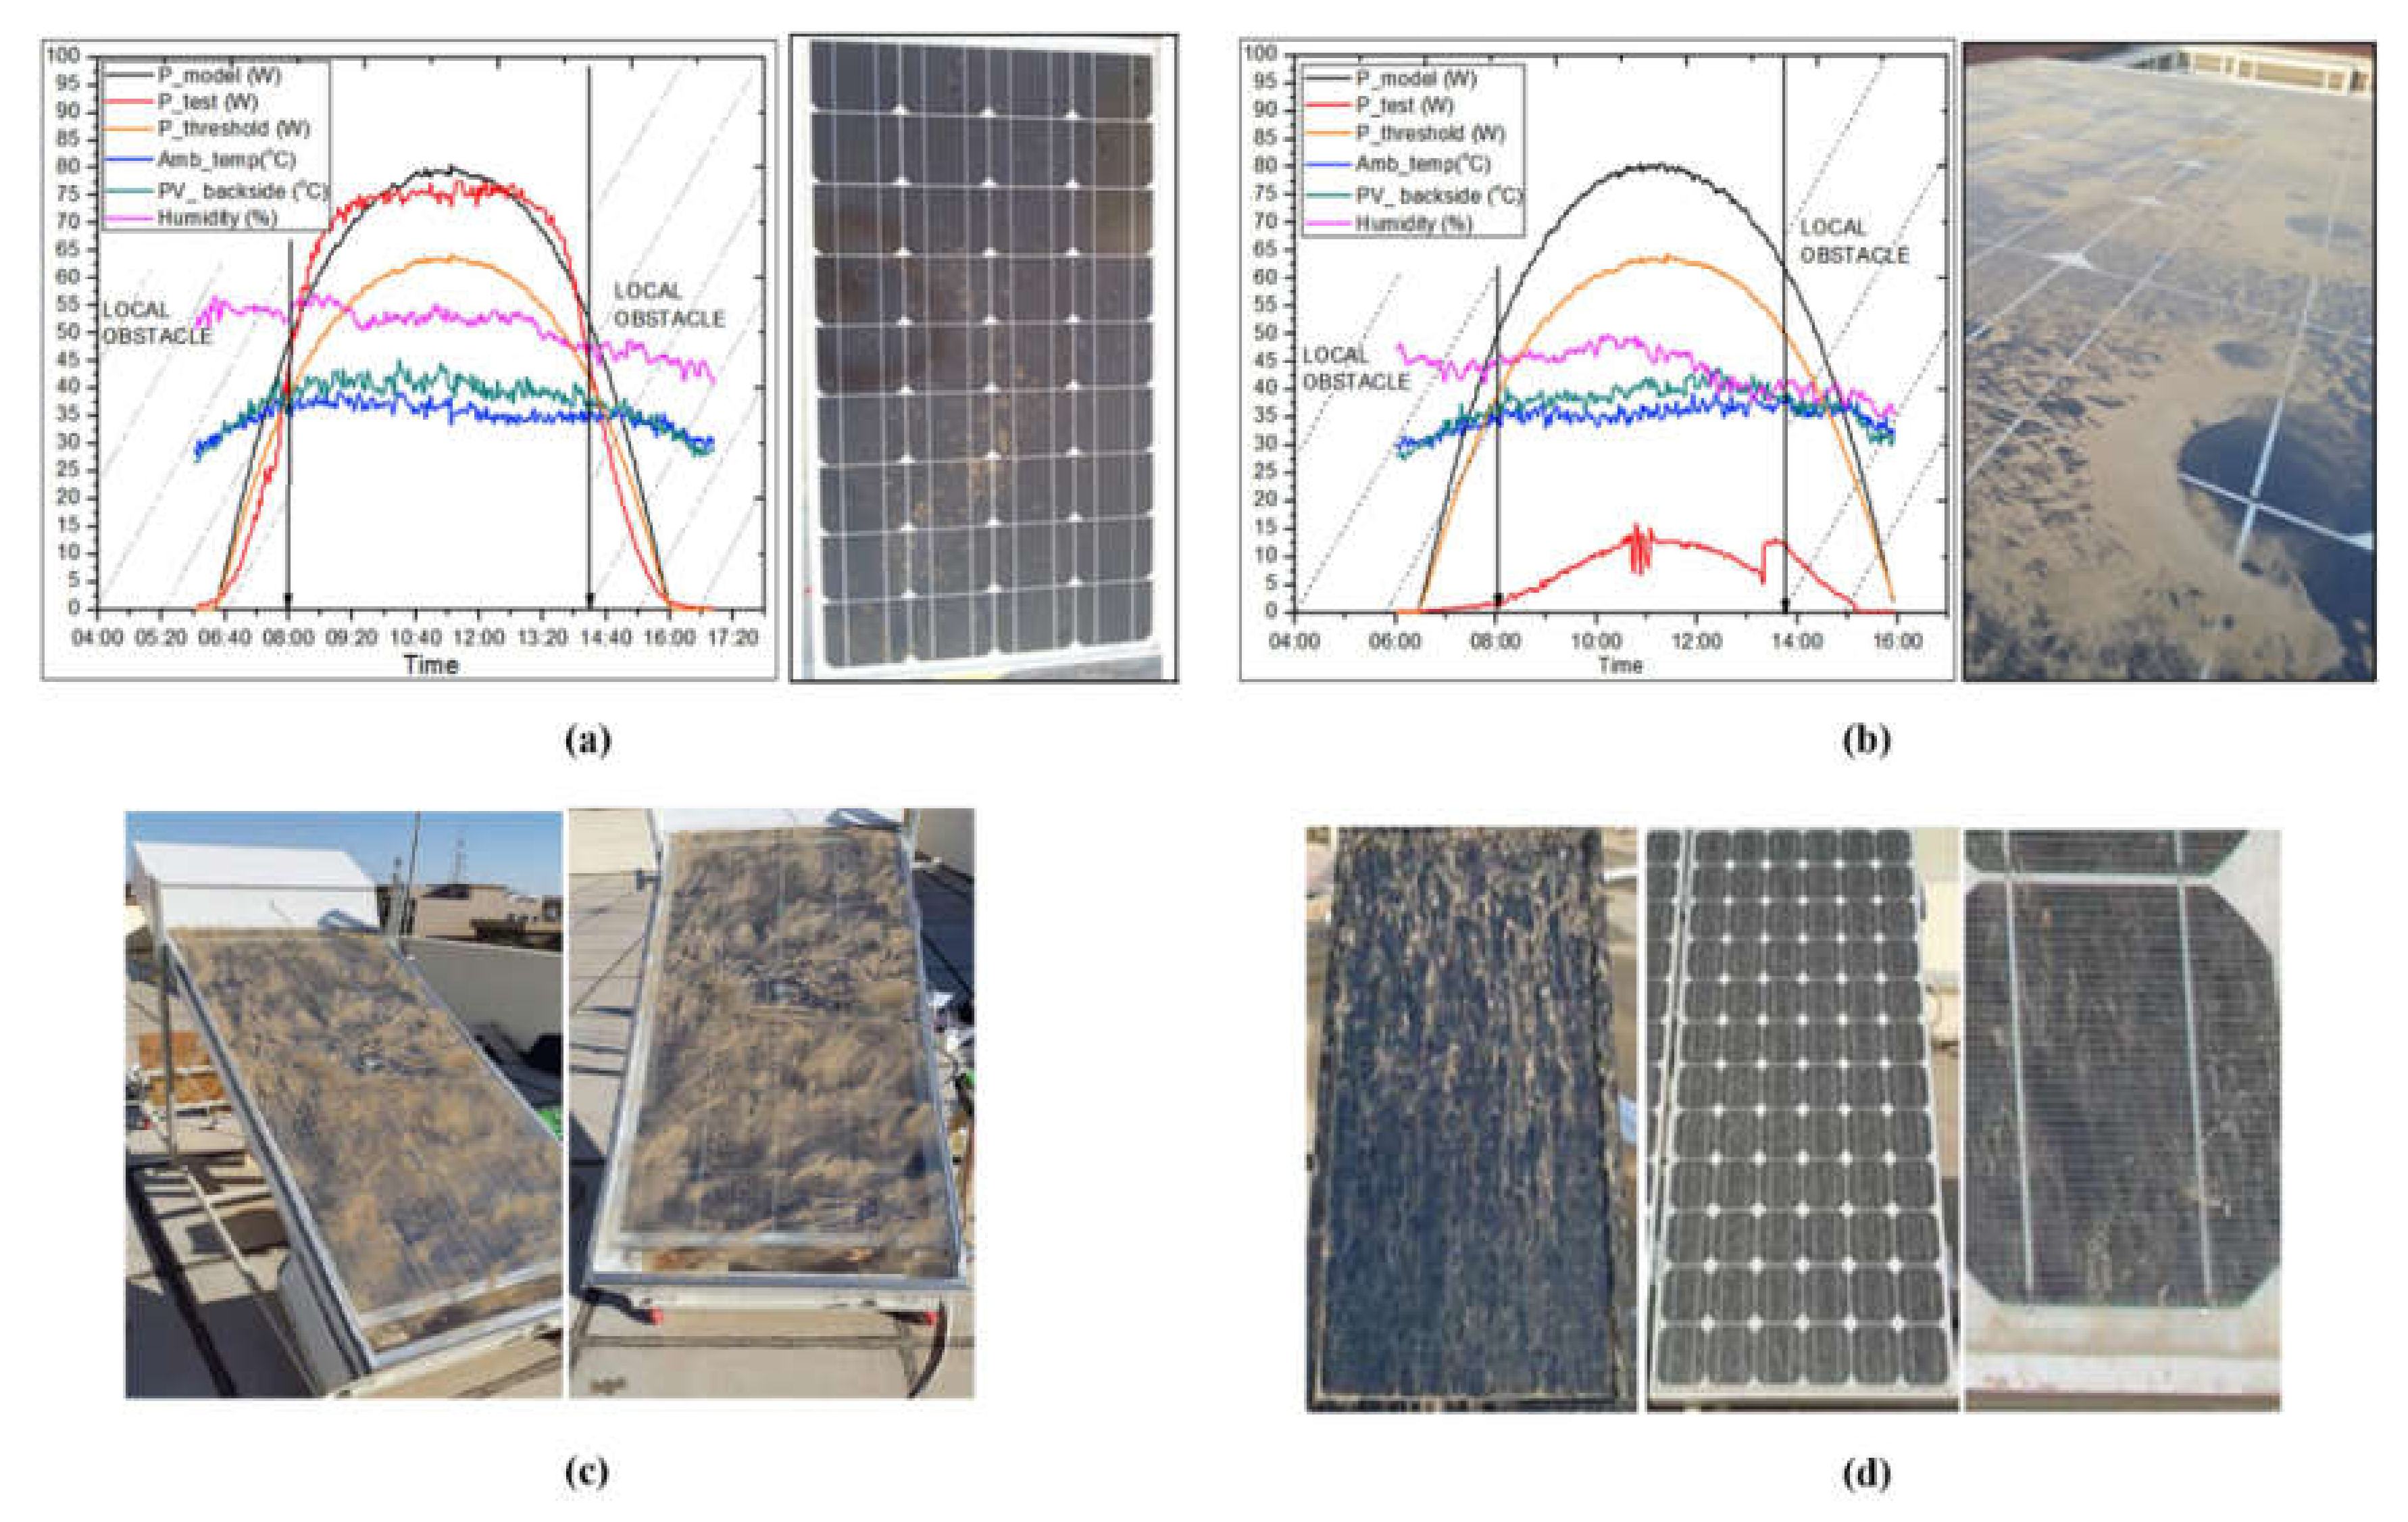
3.1. Effect on PV Power Output

Incident solar radiation, short circuit current, open-circuit voltage, and fill factor are the four parameters that decide the PV power output. Mainly, deposited dust reduces the light transmission, and hence the incident solar radiation decrease. Short circuit current is directly proportional to the incident light. Hence, power reduction is obvious from dust-covered PVs. Reduced incident radiation may slow down the temperature enhancement of the PV system; thus, the open-circuit voltage is not much affected. For heavy ash content, such as 0.4 mg/cm2, ash deposition density on poly-Si PV surfaces reduced power output by 30% compared to a similar clear PV panel in Greece. Relatively small ash deposition (i.e., 0.06 mg/cm2) reduced 2.5% of the generated power output [85]. In Belgium, the soiling effect of PV modules was conducted by monitoring five weeks of outdoor exposure; a constant power loss between 3% and 4% was obtained. Bird droppings, fallen leaves, chemicals, and growth of moss were not included in the study. The proposed large particles were washed away after every shower; however, small dust particles (2–10 μm) were affected very little by rainfall. The soiling effect on 28 crystalline silicon wafer-based photovoltaic modules in Ispra, Italy was evaluated after 30 years of exposures. This location has a moderate temperature range between −10 °C and +35 °C, generally less than 90% relative humidity, over 1550 mm of annual rainfall, and a yearly average wind speed of 2.2 m/s. After cleaning, the improvement of average power output was 9.8%. The author concluded that low soiling rate was due to average heavy rainfall in that location and presence of low dust in the environment. The impact of soiling density or annual or monthly accumulation of dust on the PV was not evaluated in this work [86]. After one week of PV module exposure on the third floor in the Politeknik Elektronika Negeri building in Surabaya, Indonesia (longitude of 112.533° and latitude of 7.2361°) during the dry season and the beginning of the rainy season from August to November 2014, a decrease of 2.05% power output was experienced compared to a clean module. After two weeks, the reduction was 9.25%; however, this went to 87.29% reduction when a short period of drizzle occurred [71], as shown in Figure 2a,b. Figure 2c shows the dust deposition on a south facing and 35° tilt photovoltaic–thermal (PV/T) system in the north of Iraq (35.46°N, 44.39°E) [87]. Figure 2d shows the dust deposited PV module in Kuwait.
An experiment showed that the module efficiency of a mono-crystalline silicon (mc-Si), polycrystalline silicon (pc-Si), and amorphous silicon (a-Si) PV cell based system was decreased by 26% as dust deposition increased from 0 to 22 g/m2 [88]. Thermal efficiency reduction up to 13.4% was possible for a PVT system due to the presence of dust on the outer surface of the collector. The highest and lowest electrical efficiencies were 10.24% (cleaned) and 5.67% (dust accumulated). A total of 17.5% efficiency reduction of this combined system occurred compared to a cleaned collector [87]. Power reduction of 4.84% was achieved for a 100 W Sanyo PV module when 20 g/m2 white sand was sprayed on it. An increase of dust concentration from 40 g/m2 to 60 g/m2 decreased the power by close to 16% [53]. Power output from a soiled concentrating PV system is more adversely affected, as incident solar light scatters in a different direction and a large number of rays are therefore lost and are not being received. Concentrating systems, after four months of exposure in Madrid and Canberra locations, reached up to 26% losses [89].

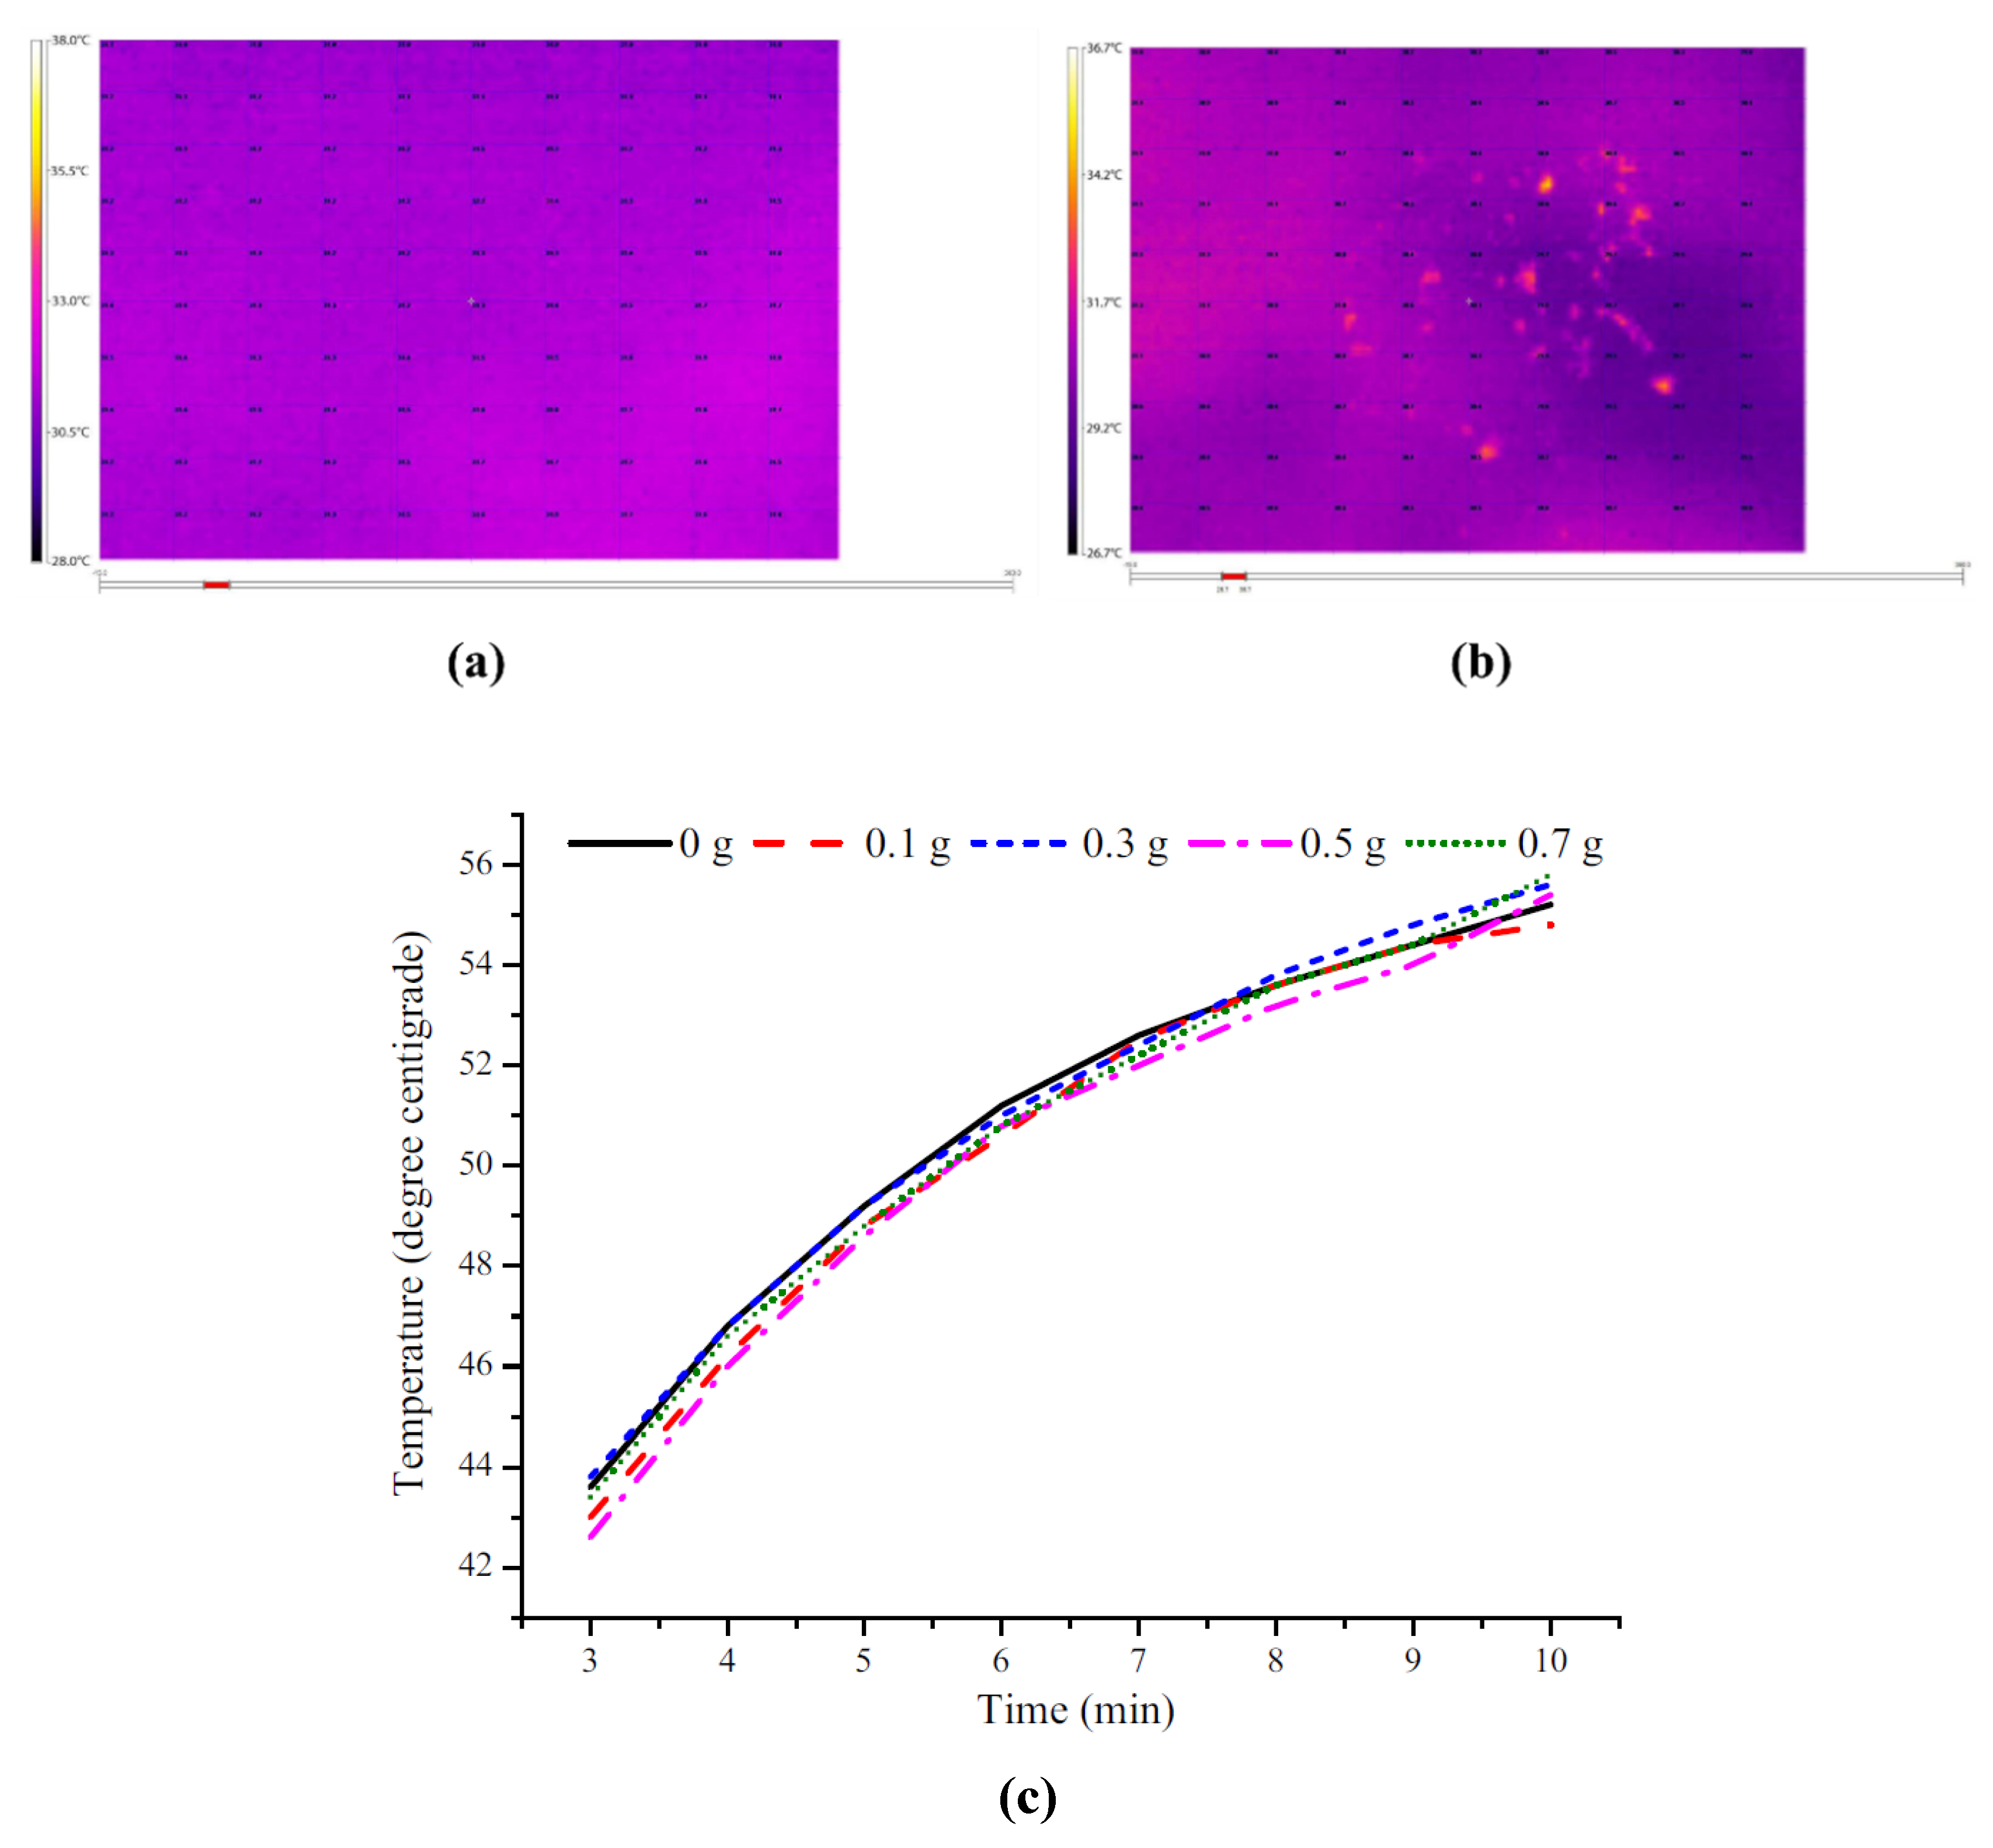
3.2. Effect on PV Temperature

The effect on temperature due to dust deposition is a rare area of investigation. However, it is one of the interesting research areas, as dust covered PV receives lower radiation and is expected to have a lower temperature than a clear PV. On the other hand, the higher thermal resistance of dust compared to glass results in weaker heat dissipation, which increases the temperature of the shielded area. Thus, it is necessary to know the temperature effect. Dust deposition on the PV surface causes a temperature difference up to 10 °C [91], as shown in Figure 3a,b. Figure 3a shows the thermal profile for a clean PV system, while Figure 3b shows bird dropping dust deposited on the PV. Hence, enhanced PV cell temperature decreased the open circuit voltage and increased the short circuit current slightly. A similar temperature difference was found when the experiment was performed at the Algerian outdoor climate [92]. In Qatar, the efficiency of mono crystalline PV systems decreased by 10% after 100 days of dust accumulation. PV power decreased less for amorphous type PV panels than mono-crystalline PVs when an equal quantity of dust was deposited on the top of them, which is explained by the temperature rise due to dust settlement on the panels [93]. High PV surface temperature due to dust cover was also reported by [94,95], who performed an experiment in tropical regions in Tanzania and Bangalore, India. However, the opposite result was found when indoor characterisation was performed. PV cells that are blocked by dust particles such as bird droppings, leaves, and dirt spots create a hot spot that can harm the PV module [96]. The effect of dust deposition on the PV temperature was investigated using indoor characterisation. Under 30 W/m2 of intensity, different weights of soil were distributed, and the temperature was measured, as shown in Figure 3c. A negligible temperature effect was found due to dust deposition on the PV module [28].

3.3. Soiling Issues on Concentrating PVs (CPVs)

For concentrating photovoltaic technology, soiling losses is more adverse. Concentrating PV (CPV) systems consist of an optical system, which collects primarily the direct sunlight and focuses it onto the PV cells. Due to soiling on the top of collector surfaces, a significant proportion of the incident solar light becomes a scattered type, which is not focused onto the PV cell. Non-concentrating PVs, which are capable of collecting both direct and diffuse sunlight, works better even when scattered light (forward scattering) is created from dust particles. Hence, the CPV system works inefficiently under soiling conditions compared to its non-concentrating counterpart [89]. A similar amount of dust deposition possesses 8 to 14 times higher soiling loss for concentrating solar power (CSP) compared to PV technologies [97].

4. Cleaning of Soiled PVs

Removal of dust from PVs is essential to enhance the power output. Removal can be natural, mechanical, or chemical [98]. Natural ways to remove dust from PV rely on wind power, gravitation, and scouring of rainwater. Rainfalls are seasonally volatile and free of cost. Lack of rainfall and intensive soiling can make this method non-reliable [99]. In Belgium, it was reported and advised to use water with hardness level <150f for the cleaning of solar panels. However, after cleaning, surface rinsing and drying of the glass is required, otherwise it will become an ideal dust particle deposition surface, with its transmission instead of improved [53]. In the early morning, late evening, night, and on a rainy day, the PV module can be turned to a vertical or oblique position for dust removal; however, these methods are not very effective. In addition, rotation of a PV array is not a feasible concept [100]. Brushing, blowing, vibrating, and ultrasonic driving are the mechanical methods to remove dust from PVs. A broom or brush is generally employed for the brushing method, which is driven by some machine [101]. For its small size and the strong adhesivity of the dust, this method is not very efficient. For blowing methods, wind from the blower is employed. However, this needs high energy to operate.

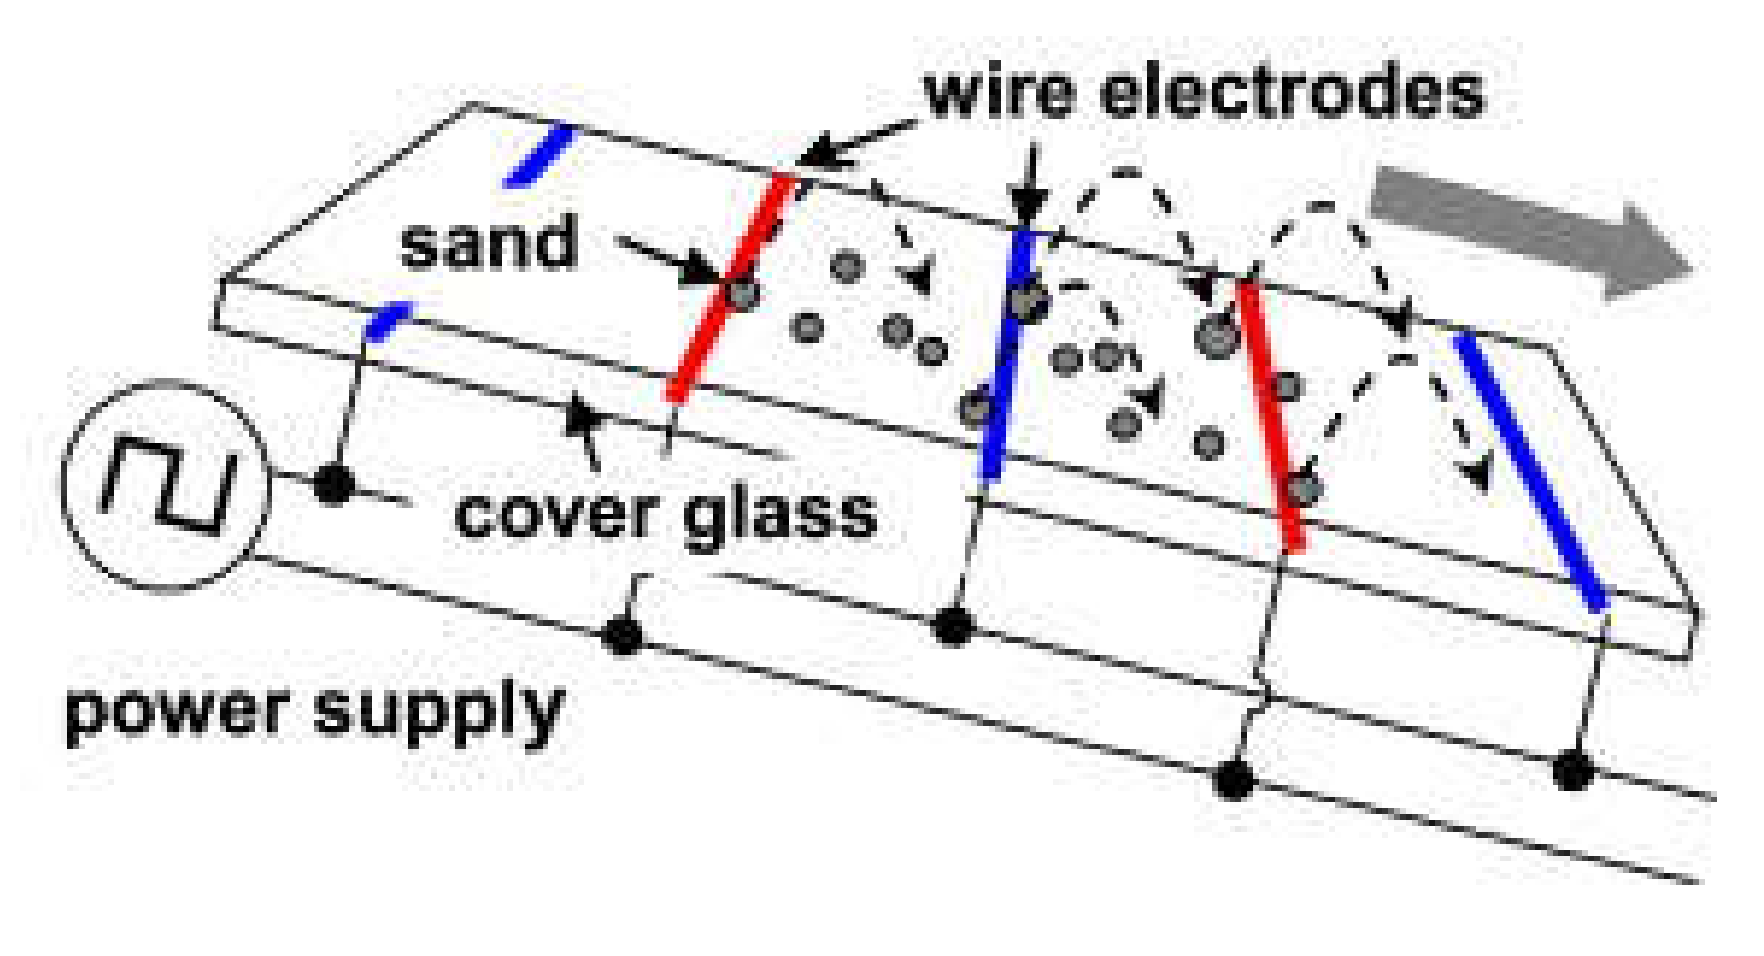
4.1. Electrodynamic Screen (EDS)

Transporting dust particles from the PV system using electrostatic force is another approach. This approach was first introduced by Masuda et al. [102]; later, this was introduced in several other applications including control of bubbles in a dielectric liquid, movement of blood cells in liquid, dust removal from solar panels and solar hydrogen generators, and the cleaning of lunar dust on solar panels for space exploration [103]. The basic electrodynamic screen (EDS) consists of a transparent or thin layer of electrodes, which are straight lines or complex shape, fabricated on a substrate. Electrodes are covered with a transparent dielectric thin sheet, which is bonded with electrodes by adhesive to isolate the electrodes from the air. EDSs are activated by using alternating high voltages applied to the electrodes. Both standing or travelling waves can be applied on EDS. Standing-waves move the dust upward and downward, while travelling-waves move the dust horizontally. The travelling-waves-based system requires a complex electrical circuit and high voltage (>800 V). For utility-scale PV power generation, a standing-wave based design is suitable [104,105]. It has been demonstrated that 98% of the dust from a transparent conveyer consisting of transparent indium tin oxide electrodes printed on a glass plate could be removed using this approach, while electrostatic travelling waves were generated by a four-phase rectangular applied voltage [104]. To replace costly indium tin oxide, a sand-repelling glass plate and high-voltage single-phase rectangular voltage power supply-based system was later employed. This system generated a flip–flop motion of the sand particles, which were transported downward by gravity, as shown in Figure 4 [105]. In Qatar, an outdoor field study using a two-phase standing-wave EDS integrated into a PV showed soiling loss reduction potential up to 16%–33% when activation voltage was 9 kVpp. However, below 6 kVpp, it had no impact on soiling reduction [106]. Both indoors and outdoors, both experiments showed that the performance efficiency of the EDS approach could be lowered over time and, if operated in a cyclic manner, at low dust loading levels [107,108]. Dust particles, which are deposited for a more extended period of time on PV systems, are less responsive to the EDS removal process [109].

4.2. Robotic Cleaning

Robotic cleaning uses an object-based sensor that has the ability to remove dust from PV systems in order to maximize solar PV output. PVCleaner Robot V1.0. T. is the first robotized cleaning device for PV systems [55]. The E4-Water Free dust cleaning robot (DCR) (Ecoppia Empowering Solar, Herzliya, Israel) has the potential to clean 99% of soiling. This water-free airflow-microfiber wipes clean the PV module surface, and the downward movement of this DCR depends on gravity. The E4-Energy Independent DCR (made by Ecoppia Empowering Solar) is energy independent as it takes power from batteries during the cleaning process. DCRs work well with a tilt angle between 5° and 35°. The SMR-640AD model (Miraikikai Inc, Hayashi-cho, Takamatsu, Kagawa, Japan) which is portable, can move to any direction, is simple to handle, and is powered with a Li-ion battery, has the potential to reduce 80% of the cleaning cost. The PV-ROB12 (Zero One Mechatronics) uses air and water as media and requires an AC power supply to operate [110]. They all are suitable for traditional PV systems but are crucial for vertical building integrated photovoltaic (BIPV) facades. For UAE locations, a water-free robotic dust cleaning system was developed. This robot had its own battery, which was charged from solar panels to operate. This system consisted of soft microfiber brushes on the extreme ends, four wheels, hail detecting sensor, controlling system and a three stepper motor [111].

4.3. Anti-Soiling Coating (Self-Cleaning)

Hydrophobic and hydrophilic are the two types of self-cleaning coatings available for anti-soiling purposes to protect the PV system from dust deposition. Water contact angle (WCA) higher than 90° is known as hydrophobic and lower than 90° is hydrophilic [112]. WCA higher than 150° is known as super hydrophobic [113], while lower than 5° is super hydrophilic. High surface energy materials possess wettability properties and are suitable for hydrophilic/super hydrophilic surfaces. Low surface energy materials such as silanes, silicones, nanoparticles, and polymers are being used due to their water-repelling properties for hydrophobic surfaces. Hydrophilic coatings diminish the dirt through photo catalytic reaction, while super hydrophobic coatings allow water droplets to roll down and remove dirt from the surface. Self-cleaning activity is predominant in nature. For example, lotus leaves [114], rice leaves [115], and butterfly wings [116] show super hydrophobicity while pitcher plant [117], shark skin, fish scale, and snail shell have super hydrophilic properties [118].
A popular super hydrophilic film is TiO2, which has hydrophilicity and photocatalytic activity. However, TiO2 reduces the glass transmittance, and it rapidly loses hydrophilicity, re-establishing the water contact angle in dark environments. TiO2/SiO2 composite films can overcome all these limitations [119]. Using a KH550 and titanium ethoxide-based super hydrophilic coating (WCA 10°, transmittance > 85%) energy production from PV panels can be increased by up to 4.3% [120]. Theoretically, TiO2-based self-cleaning coated GaAs and c-Si PV systems were evaluated, which showed a 4% efficiency improvement for c-Si and a 5% improvement for GaAs [121]. Morphologically different ZnO was found to possess super hydrophilic properties [122].
The presence of hydrophobic silica-coated glass can reduce only 8.55% of the PV efficiency, while dust deposited bare glass shows a 15.8% PV efficiency reduction. Glass coated by hydrophobic silica solution, glass coated by ethanol solution with SiO2 nano-particles, and glass-coated by silica sol with SiO2 nano-particles showed 6.1% and 5.7% efficiency reduction, respectively [123]. A hydrophobic coating was exposed to coastal location in Denmark for 24 weeks to understand the degradation from intense UV exposure, humidity, temperature cycling, sub-zero temperatures, hail, and abrasion. Only after two weeks of exposure, this hydrophobic coating lost its hydrophobicity [124]. Long term stability under harsh outdoor condition is an obstacle for anti-soiling coatings.

5. Impacts of Dust on India’s PV Generation and Barriers for Energy Security

India lies between 8°4′ to 37°6′ north latitude and 68°7′ to 97°25’ east longitude and is the 7th largest country in the world, with a landmass of 2.9 million km2. It is within the tropical region and receives an annual average of direct normal irradiance of 4.5–5.0 kWh/m2/day, while the global horizontal irradiance average is 5.5 kWh/m2/day. Figure 5a shows the annual average solar intensity for different parts of India. India experiences about 300 sunny clear days in a year. Cold and cloudy, composite, hot and dry, warm and humid, moderate and cold, and sunny are the typical climates of India [125,126]. Ambient temperature varies from 4 °C in winter to 45 °C in summer [127,128].
India’s population currently is 1.31 billion, which is expected to grow to 1.7 billion by 2050; 70% of India’s total population is living in the rural area, and 244 million people do not have access to electricity. Connecting rural areas with the national power grid is not cost-effective. On the other hand, after the 1991 liberalization, India’s economic growth rate became 7%–8% annually. Additionally, India is experiencing a rapid increase in human population, urbanization, and modernization. Hence, energy demand and greenhouse emissions from the urban sector is alarming in India. India has set a growth rate target of 9%, which would place India on a trajectory towards a USD 5 trillion economy by 2024–2025. In 2016, India consumed 724 million tonnes of oil equivalent (Mtoe), and it is expected that with a growth rate of 4.2%/annum, it will reach 1921 Mtoe by 2040 [129]. India’s projected electricity demand in 2047 is expected to be 5518 TWh. Energy security is in high demand in India to maintain its growth. Around 750 million people in India gained access to electricity between 2000 and 2019, reflecting reliable and effective policy implementation. India’s total installed capacity of power generation (to 31 March 2020), including renewables and non-renewables, is 370,106 MW. Currently, significant sources of energy in India come from coal, oil, and natural gas. India’s commercial energy demand was met by 55% from coal, 32% from oil, and 8% from gas [130,131]. Industry, residential, and transport are the three primary energy consumption sectors, which consumed 56%, 29%, and 17% of the total consumption in 2017, respectively. In 2017, India accounted for 881,945 ktoe of primary energy in the Asia–Pacific region, following China and Indonesia [132]. Now, 74% of energy demand in India comes from oil and coal in the form of electricity. In 2017–2018, India imported 213 million tons of coal. Being the third-largest producer of coal in the world, India still requires coal imports, because the available coal has low calorific value and ash content up to 50% [133,134]. Hence, Indian thermal power plants that are run by coal are the most inefficient ones.
India is the world’s third-largest consumer of oil, the fourth-largest oil refiner, and a net exporter of refined products. Limited oil reserves compel India to be dependent on oil imports, and in 2018 this import was above 80%, which will increase significantly in the coming decades. Based on the present use of oil, it is projected that by 2030, India will import 90% of its oil. Thus, this 70% of crude oil importing dependency is also a significant issue and a barrier for India to be an energy secured country [135]. Nigeria is India’s most valued source of oil, which supplies 20% of India’s oil import demands, as its crude is ideally matched for Indian refineries [136]. Other oil-rich countries from which India imports oil include Sudan, Syria, and Iran. However, because of their internal troubles, India can face oil-importing issue in the future. In terms of GHG emissions in India, the electric power generation sector (40% GHG emissions) is in second position after the transport sector.
India is committed to reducing GHG emissions intensities by 33%–35% from 2005 levels and to a 40% power generation capacity from non-fossil sources by 2030 [137,138]. Therefore, India is engaged to build its energy security, particularly its electricity generation sector, through sustainable methods [139]. Hence, dependency on renewable energy sources is indispensable for India. India has a National Action Plan on Climate Change, stating that 175 GW of energy will be produced from renewable energy, including 100 GW from solar energy, 10 GW from bio-power, 60 GW from wind power, and 5 GW from small hydropower plants by the year 2022 [140,141,142,143]. This 100 GW of solar power generation includes power generation from rooftop PVs (40 GW) [144] and solar parks [145] through the Jawaharlal Nehru National Solar Mission (JNNSM) by 2022. Currently, the cost of solar power cost is also very low, as in 2018 it was recorded at 1.38 INR (1.86 US cents) per kWh in India [146], while in Jan 2020, it recorded the lowest bid of 1.6 US cents/kWh [147]. Hence, to become an energy-secured country and independent from oil-imports, India should focus on its solar PV power potential. However, backup power supplies from fossil fuel-generated kerosene oil lamps, diesel generators, etc., can still be supplied at low cost in India [148].
The main objective of the JNNSM program is to promote grid-connected rooftop PV and small-scale standalone PV power generating plants among residential, community, institutional, industrial, and commercial establishments. This program will be applicable to all parts of India with a minimum capacity installation of 1 kW and a maximum capacity installation of 500 kWp. Figure 5b shows the distribution of installed solar rooftop PVs in different states of India until September 2016. The cumulative installed capacity of the solar rooftop was 1020 MW by September 2016. Concentrating solar power (CSP) is also another source of green power for India. India has a CSP capacity of 1000 GW, and installations are mostly happening in the states of Rajasthan, Gujrat, and Andhra Pradesh [149]. There is a total installed CSP plant capacity of 475 MW in Rajasthan [149]. As of 31 March 2017, a total of 12,288.83 MW CSP was installed in India [149].
Table 2 indicates India’s major PV installations in five different states. All the major installations are commissioned in the western, central, and southern parts of India.
India’s solar mission and its plan to be an energy secured country will only be successful if all the resources are available at the right time in the right location; this is applicable for any successful energy policy [152]. To attain this high solar mission and continuous power generation from PVs, project design plays a crucial role. From PV power plant to rooftop installation design requires accurate solar radiation data. Secure bankability from PV power projects depends on the accuracy of the solar resources and other ambient parameters such as temperature and atmospheric conditions. Soiling on a PV system is currently an issue worldwide, and India is no different.
The presence of suspended particles, which is the root cause of air pollution, is very high in the Indian atmosphere. India is in second position in terms of air pollution, just after China. Agricultural burning [153], industrial emissions, and road vehicles create these suspended particles in the air. The presence of dust particles has the potential to modify the atmospheric direct solar radiation, which is an influential parameter to generate power from PV, while deposited dust on the PV reduces the incoming incident light and further generates low power [154]. It was reported that air pollution levels reduce the solar power yield by 17%–25% in India [155]. During festival time (in October to November) and post-monsoon, India suffers from an excessive amount of suspended particles in the air, particularly in the northern part of India, which possess exceptionally high (766 μg/m3) PM2.5 concentrations, about 19 times higher than the standard limit [156]. The Himalayas are a natural barrier in the northern part of India for cleaning up the air. Cold air from the Himalayas prevents hot air dispersion from the northern part of India to Tibet. Burning of crops in October and November and slow wind speeds accelerate the suspended particles in the northern part of India. Road dust samples from different active areas in Delhi city confirmed the manifest presence of Ba, Co, Cr, Cu, Fe, Mn, Ni, Pb, and Zn [157], which enhances the scattering and diffusion of sunlight and reduces the direct solar radiation [158]. According to the solar consultancy Bridge to India, rooftop panels in Delhi produce 30% less power compared to a similarly rated power plant 40 km away. The Shekhawati region in India receives high annual direct normal radiation and has a low population density, which makes it a suitable location for large scale PV installations. However, dusty conditions during summers reduce the installed plant efficiency due to soiling losses [159]. The western part of India, e.g., Gujrat and Rajasthan state, receive on average more than 6.5 kWh per sq. meter of GHI (global horizontal incidence). In September 2016, India’s total installed PV power capacity was 8.6 GW, of which Rajasthan contributed 1.29 GW and Gujarat contributed 1.13 GW [160]. However, the presence of the desert in these locations can create soiling issues. The Thar desert occupies the maximum area in the state of Rajasthan and extends to the Rann of Kutch in the state of Gujarat in India. Dust storms from these locations also transport dust to some parts of the states of Punjab and Haryana. As the desert remains mostly dry all year, it is subjected to high wind erosion containing fine sand, which is more likely to be deposited on solar photovoltaic (PV) panels [161]. Dust accumulation for eight weeks at this location can reduce the incident solar radiation transmission up to 50%, which reduces the system efficiency by 44% [162]. The northwestern part of India receives a large quantity of dust from the surrounding arid/semi-arid region. Eastern parts of India, such as Bihar and West Bengal, also experience high atmospheric suspended particulate matter in the atmosphere. Soiling losses of a 20 kW rooftop solar power plant at the National Institute of Wind Energy, Chennai, in the southern part of India (13.07° N, 80.26° E), showed 1.36% to 3.67% losses between June 2018 and June 2019 [163]. At present, in India, soiling can cause 25% losses, which in turn create loss amounts of 3900 MW from solar plants, equivalent to a gigantic field of 2.5 million panels [164].
Regular cleaning of the PV system is essential in India to maintain and meet the PV power generation target set by the ministry. There is a dearth of universally recommended cleaning methods, because the effectiveness of cleaning methods changes with local conditions, available resources, and cleaning frequencies. Northern India can experience losses from 17% to 25%, or even more if cleaning is only performed on a monthly basis, and over 35% if cleaning is done once every two months. Performance of a 10 MW grid-connected photovoltaic power plant at Ramagundam (18.75° N, 79.51° E) was evaluated using PVSYST simulation tool. This site received an average solar radiation of 4.97 kW h/m2/day and an average temperature of about 27.3 °C. PV power output suffered from 2.1% soiling losses; however, no conclusion was made for this low soiling loss [165]. An automated cleaning system was investigated by [166], which was an integrated solar tracking and cleaning system. This system consisted of a stepper motor, gearbox (40:1), shaft, and sliding rod solar PV modules and circular metal rings. Sliding brushes cleaned the module twice a day, while PV panels made a 360° rotation every day. Using just a tracking system, improvement of the PV power output was 15%, and with the cleaning mechanism, 30% improvement was possible compared to a horizontally placed uncleaned PV system [166]. Commercial players are also now active in the Indian PV market to clean soiled PV systems. An automatic, waterless, robotic cleaner system from Indisolar has the ability to clean 2–6 metre widths of a PV array, and an inbuilt rechargeable Li-ion battery can be charged from the PV system itself. This system employs soft, helically wound nylon brushes, which are 100% scratch-free. Cleaning systems for the different worldwide climatic zones were proposed by [40], which can be used for different Indian climatic zones, as presented in Figure 6.

6. Conclusions

India’s energy demand was primarily met from fossil fuels, but is now being partially replaced by renewable energy generation so as to become a self-sufficient energy secured nation by not polluting the environment. Harvesting benign solar power by photovoltaics is gaining much attention because India is blessed with high solar radiation and over 300 clear sunny days. The Indian Government has set an ambitious plan to generate 100 GW PV power generation by 2022 through the Jawaharlal Nehru National Solar Mission (JNNSM) scheme. However, this target is seeming not to be attainable due to poor air quality in India which, creates an adverse soiling effect on the PV system. Due to soiling, India can lose 20%–25% of PV system-generated energy and reduction of total incident solar intensity. Dust particles can vary from the micrometre to nanometre range, while smaller particles are more damaging for the PV system, as cleaning them off from the PV surface is a cumbersome task. Larger particle size is beneficial, compared to a smaller size, as they can be cleaned off from PV panels through any of the following conditions: higher tilted angle, higher wind speed, low air moisture content, and heavy rainfall. Glass PV covers are preferable to acrylic plastic PV covers for reducing dust deposition. To enhance the energy security from PVs, low-cost cleaning systems and the purification of air quality is essential in India, as soiling losses act as a barrier for India’s energy security from PV power generation.

Funding

This research received no external funding.

Conflicts of Interest

The author declares no conflict of interest.

References

  1. Zhiznin, S.Z.; Timohov, V.M.; Dineva, V. Energy security: Theoretical interpretations and quantitative evaluation. Int. J. Energy Econ. Policy 2020, 10, 390–400. [Google Scholar] [CrossRef]
  2. Miller, B.G. Coal and energy security. Clean Coal Eng. Technol. 2011, 585–612. [Google Scholar] [CrossRef]
  3. Speight, J.G. Energy security and the environment. Nat. Gas 2019, 361–390. [Google Scholar] [CrossRef]
  4. Jakstas, T. What Does Energy Security Mean? Elsevier Inc.: Amsterdam, The Netherlands, 2019; ISBN 9780128176887. [Google Scholar]
  5. Ghosh, A. Possibilities and challenges for the inclusion of the Electric Vehicle (EV) to reduce the carbon footprint in the transport sector: A review. Energies 2020, 13, 2602. [Google Scholar] [CrossRef]
  6. McKinsey & Company. Global Energy Perspective 2019: Reference Case; Energy Insights: New York, NY, USA, 2019; p. 31. [Google Scholar]
  7. Mills, A.D.; Levin, T.; Wiser, R.; Seel, J.; Botterud, A. Impacts of variable renewable energy on wholesale markets and generating assets in the United States: A review of expectations and evidence. Renew. Sustain. Energy Rev. 2020, 120, 109670. [Google Scholar] [CrossRef] [Green Version]
  8. Ogbonnaya, C.; Abeykoon, C.; Damo, U.M.; Turan, A. The current and emerging renewable energy technologies for power generation in Nigeria: A review. Therm. Sci. Eng. Prog. 2019, 13, 100390. [Google Scholar] [CrossRef]
  9. Vakulchuk, R.; Overland, I.; Scholten, D. Renewable energy and geopolitics: A review. Renew. Sustain. Energy Rev. 2020, 122, 109547. [Google Scholar] [CrossRef]
  10. Xu, R.; Song, Z.; Tang, Q.; Yu, Z. The cost and marketability of renewable energy after power market reform in China: A review. J. Clean. Prod. 2018, 204, 409–424. [Google Scholar]
  11. Bourcet, C. Empirical determinants of renewable energy deployment: A systematic literature review. Energy Econ. 2020, 85, 104563. [Google Scholar] [CrossRef]
  12. IEA. World Energy Outlook 2019; IEA: Paris, France, 2019. [Google Scholar]
  13. Ghosh, A.; Sundaram, S.; Mallick, T.K. Investigation of thermal and electrical performances of a combined semi- transparent PV-vacuum glazing. Appl. Energy 2018, 228, 1591–1600. [Google Scholar] [CrossRef]
  14. Ghosh, A.; Selvaraj, P.; Sundaram, S.; Mallick, T.K. The colour rendering index and correlated colour temperature of dye-sensitized solar cell for adaptive glazing application. Sol. Energy 2018, 163, 537–544. [Google Scholar] [CrossRef]
  15. Alrashidi, H.; Ghosh, A.; Issa, W.; Sellami, N.; Mallick, T.K.; Sundaram, S. Evaluation of solar factor using spectral analysis for CdTe photovoltaic glazing. Mater. Lett. 2019, 237, 332–335. [Google Scholar] [CrossRef] [Green Version]
  16. Selvaraj, P.; Ghosh, A.; Mallick, T.K.; Sundaram, S. Investigation of semi-transparent dye-sensitized solar cells for fenestration integration. Renew. Energy 2019, 141, 516–525. [Google Scholar] [CrossRef]
  17. Ghosh, A.; Sarmah, N.; Sundaram, S.; Mallick, T.K. Numerical studies of thermal comfort for semi-transparent building integrated photovoltaic ( BIPV )-vacuum glazing system. Sol. Energy 2019, 190, 608–616. [Google Scholar] [CrossRef]
  18. Roy, A.; Ghosh, A.; Bhandari, S.; Selvaraj, P.; Sundaram, S.; Mallick, T.K. Color Comfort evaluation of Dye-Sensitized Solar Cell (DSSC) based Building-Integrated Photovoltaic (BIPV) glazing after 2 years of ambient exposure. J. Phys. Chem. C 2019, 123, 23834–23837. [Google Scholar] [CrossRef] [Green Version]
  19. Ghosh, A.; Bhandari, S.; Sundaram, S.; Mallick, T.K. Carbon counter electrode mesoscopic ambient processed & characterised perovskite for adaptive BIPV fenestration. Renew. Energy 2020, 145, 2151–2158. [Google Scholar]
  20. Haegel, N.M.; Atwater, H.; Barnes, T.; Breyer, C.; Burrell, A.; Chiang, Y.-M.; De Wolf, S.; Dimmler, B.; Feldman, D.; Glunz, S.; et al. Terawatt-scale photovoltaics: Transform global energy. Science 2019, 364, 836–838. [Google Scholar] [CrossRef] [Green Version]
  21. Ghosh, A.; Sundaram, S.; Mallick, T.K. Colour properties and glazing factors evaluation of multicrystalline based semi-transparent Photovoltaic-vacuum glazing for BIPV application. Renew. Energy 2019, 131, 730–736. [Google Scholar] [CrossRef]
  22. Alrashidi, H.; Issa, W.; Sellami, N.; Ghosh, A.; Mallick, T.K.; Sundaram, S. Performance assessment of cadmium telluride-based semi-transparent glazing for power saving in façade buildings. Energy Build. 2020, 215, 109585. [Google Scholar] [CrossRef]
  23. Karthick, A.; Kalidasa Murugavel, K.; Ghosh, A.; Sudhakar, K.; Ramanan, P. Investigation of a binary eutectic mixture of phase change material for building integrated photovoltaic (BIPV) system. Sol. Energy Mater. Sol. Cells 2020, 207, 110360. [Google Scholar] [CrossRef]
  24. Karthick, A.; Ramanan, P.; Ghosh, A.; Stalin, B.; Kumar, R.V.; Baranilingesan, I. Performance enhancement of copper indium diselenide photovoltaic module using inorganic phase change material. Asia-Pac. J. Chem. Eng. 2020, e2480. [Google Scholar] [CrossRef]
  25. Alrashidi, H.; Ghosh, A.; Issa, W.; Sellami, N.; Mallick, T.K.; Sundaram, S. Thermal performance of semitransparent CdTe BIPV window at temperate climate. Sol. Energy 2020, 195, 536–543. [Google Scholar] [CrossRef]
  26. Smestad, G.P.; Germer, T.A.; Alrashidi, H.; Fernández, E.F.; Dey, S.; Brahma, H.; Sarmah, N.; Ghosh, A.; Sellami, N. Modelling photovoltaic soiling losses through optical characterization. Sci. Rep. 2020, 10, 1–13. [Google Scholar] [CrossRef] [PubMed] [Green Version]
  27. Ilse, K.K.; Figgis, B.W.; Werner, M.; Naumann, V.; Hagendorf, C.; Pöllmann, H.; Bagdahn, J. Comprehensive analysis of soiling and cementation processes on PV modules in Qatar. Sol. Energy Mater. Sol. Cells 2018, 186, 309–323. [Google Scholar] [CrossRef]
  28. Xu, R.; Ni, K.; Hu, Y.; Si, J.; Wen, H.; Yu, D. Analysis of the optimum tilt angle for a soiled PV panel. Energy Convers. Manag. 2017, 148, 100–109. [Google Scholar] [CrossRef]
  29. Conceição, R.; Silva, H.G.; Mirão, J.; Collares-Pereira, M. Organic soiling: The role of pollen in PV module performance degradation. Energies 2018, 11, 294. [Google Scholar] [CrossRef] [Green Version]
  30. Sarver, T.; Al-Qaraghuli, A.; Kazmerski, L.L. A comprehensive review of the impact of dust on the use of solar energy: History, investigations, results, literature, and mitigation approaches. Renew. Sustain. Energy Rev. 2013, 22, 698–733. [Google Scholar] [CrossRef]
  31. Micheli, L.; Caballero, J.A.; Fernandez, E.F.; Smestad, G.P.; Nofuentes, G.; Mallick, T.; Almonacid, F. Correlating photovoltaic soiling losses to waveband and single-value. Energy 2019, 180, 376–386. [Google Scholar] [CrossRef] [Green Version]
  32. Micheli, L.; Deceglie, M.G.; Muller, M. Interpolation techniques. IEEE J. Photovolt. 2018. [Google Scholar] [CrossRef]
  33. Micheli, L.; Fernandez, E.F.; Smestad, G.P.; Alrashidi, H.; Sarmah, N.; Sellami, N.; Hassan, I.A.I.; Kasry, A.; Nofuentes, G.; Sood, N.; et al. A unified global investigation on the spectral effects of soiling losses of PV glass substrates: Preliminary results. In Proceedings of the 2017 IEEE 44th Photovoltaic Specialist Conference (PVSC), Washington, DC, USA, 25–30 June 2017; pp. 2858–2863. [Google Scholar]
  34. Micheli, L.; Muller, M. An investigation of the key parameters for predicting PV soiling losses. Prog. Photovolt. Res. Appl. 2017, 25, 291–307. [Google Scholar] [CrossRef]
  35. Bergin, M.H.; Ghoroi, C.; Dixit, D.; Schauer, J.J.; Shindell, D.T. Large reductions in solar energy production due to dust and particulate air pollution. Environ. Sci. Technol. Lett. 2017, 4, 339–344. [Google Scholar] [CrossRef] [Green Version]
  36. Costa, S.C.S.; Diniz, A.S.A.C.; Kazmerski, L.L. Solar energy dust and soiling R&D progress: Literature review update for 2016. Renew. Sustain. Energy Rev. 2018, 82, 2504–2536. [Google Scholar]
  37. Figgis, B.; Ennaoui, A.; Ahzi, S.; Rémond, Y. Review of PV soiling particle mechanics in desert environments. Renew. Sustain. Energy Rev. 2017, 76, 872–881. [Google Scholar] [CrossRef]
  38. Gupta, V.; Sharma, M.; Pachauri, R.K.; Dinesh Babu, K.N. Comprehensive review on effect of dust on solar photovoltaic system and mitigation techniques. Sol. Energy 2019, 191, 596–622. [Google Scholar] [CrossRef]
  39. Ilse, K.; Micheli, L.; Figgis, B.W.; Lange, K.; Daßler, D.; Hanifi, H.; Wolfertstetter, F.; Naumann, V.; Hagendorf, C.; Gottschalg, R.; et al. Techno-economic assessment of soiling losses and mitigation strategies for solar power generation. Joule 2019, 3, 2303–2321. [Google Scholar] [CrossRef] [Green Version]
  40. Ghazi, S.; Sayigh, A.; Ip, K. Dust effect on flat surfaces—A review paper. Renew. Sustain. Energy Rev. 2014, 33, 742–751. [Google Scholar] [CrossRef]
  41. Chanchangi, Y.N.; Ghosh, A.; Sundaram, S.; Mallick, T.K. Dust and PV performance in Nigeria: A review. Renew. Sustain. Energy Rev. 2020, 121, 109704. [Google Scholar] [CrossRef]
  42. Pavan, A.M.; Tessarolo, A.; Barbini, N.; Mellit, A.; Lughi, V. The effect of manufacturing mismatch on energy production for large-scale photovoltaic plants. Sol. Energy 2015, 117, 282–289. [Google Scholar] [CrossRef] [Green Version]
  43. Kalogirou, S.A.; Agathokleous, R.; Panayiotou, G. On-site PV characterization and the effect of soiling on their performance. Energy 2013, 51, 439–446. [Google Scholar] [CrossRef]
  44. Qasem, H.; Betts, T.R.; Mullejans, H.; AlBusairi, H.; Gottschalg, R. Dust-induced shading on photovoltaic modules. Prog. Photovolt. Res. Appl. 2014, 22, 218–226. [Google Scholar] [CrossRef] [Green Version]
  45. Ghazi, S.; Ip, K.; Sayigh, A. Preliminary study of environmental solid particles on solar flat surfaces in the UK. Energy Procedia 2013, 42, 765–774. [Google Scholar] [CrossRef] [Green Version]
  46. Chen, J.; Pan, G.; Ouyang, J.; Ma, J.; Fu, L.; Zhang, L. Study on impacts of dust accumulation and rainfall on PV power reduction in East China. Energy 2020, 194, 116915. [Google Scholar] [CrossRef]
  47. Tanesab, J.; Parlevliet, D.; Whale, J.; Urmee, T.; Pryor, T. The contribution of dust to performance degradation of PV modules in a temperate climate zone. Sol. Energy 2015, 120, 147–157. [Google Scholar] [CrossRef] [Green Version]
  48. Hachicha, A.A.; Al-Sawafta, I.; Said, Z. Impact of dust on the performance of solar photovoltaic (PV) systems under United Arab Emirates weather conditions. Renew. Energy 2019, 141, 287–297. [Google Scholar] [CrossRef]
  49. Elminir, H.K.; Ghitas, A.E.; Hamid, R.H.; El-Hussainy, F.; Beheary, M.M.; Abdel-Moneim, K.M. Effect of dust on the transparent cover of solar collectors. Energy Convers. Manag. 2006, 47, 3192–3203. [Google Scholar] [CrossRef]
  50. Klugmann-Radziemska, E. Degradation of electrical performance of a crystalline photovoltaic module due to dust deposition in northern Poland. Renew. Energy 2015, 78, 418–426. [Google Scholar] [CrossRef]
  51. Weber, B.; Quiñones, A.; Almanza, R.; Duran, M.D. Performance reduction of PV systems by dust deposition. Energy Procedia 2014, 57, 99–108. [Google Scholar] [CrossRef] [Green Version]
  52. Lin, J.J.; Noll, K.E.; Holsen, T.M. Dry deposition velocities as a function of particle size in the ambient atmosphere. Aerosol Sci. Technol. 1994, 20, 239–252. [Google Scholar] [CrossRef] [Green Version]
  53. Appels, R.; Lefevre, B.; Herteleer, B.; Goverde, H.; Beerten, A.; Paesen, R.; De Medts, K.; Driesen, J.; Poortmans, J. Effect of soiling on photovoltaic modules in Norway. Sol. Energy 2013, 96, 283–291. [Google Scholar] [CrossRef]
  54. Javed, W.; Wubulikasimu, Y.; Figgis, B.; Guo, B. Characterization of dust accumulated on photovoltaic panels in Doha, Qatar. Sol. Energy 2017, 142, 123–135. [Google Scholar] [CrossRef]
  55. Anderson, M.; Grandy, A.; Hastie, J.; Sweezey, A.; Ranky, R.; Mavroidis, C.; Markkopoulous, Y.P. Robotic device for cleaning photovoltaic panel arrays. Mobile Robotics 2009, 366–367. [Google Scholar]
  56. Said, S.A.M.; Hassan, G.; Walwil, H.M.; Al-Aqeeli, N. The effect of environmental factors and dust accumulation on photovoltaic modules and dust-accumulation mitigation strategies. Renew. Sustain. Energy Rev. 2018, 82, 743–760. [Google Scholar] [CrossRef]
  57. Goossens, D.; Van Kerschaever, E. Aeolian dust deposition on photovoltaic solar cells: The effects of wind velocity and airborne dust concentration on cell performance. Sol. Energy 1999, 66, 277–289. [Google Scholar] [CrossRef]
  58. Goossens, D.; Offer, Z.Y.; Zangvil, A. Wind tunnel experiments and field investigations of eolian dust deposition on photovoltaic solar collectors. Sol. Energy 1993, 50, 75–84. [Google Scholar] [CrossRef]
  59. Cuddihy, E.F. Theoretical considerations of soil retention. Sol. Energy Mater. 1980, 3, 21–33. [Google Scholar] [CrossRef]
  60. O’Hara, S.L.; Clarke, M.L.; Elatrash, M.S. Field measurements of desert dust deposition in Libya. Atmos. Environ. 2006, 40, 3881–3897. [Google Scholar] [CrossRef]
  61. Albert, R.; Albert, I.; Hornbaker, D.; Schiffer, P.; Barabási, A.L. Maximum angle of stability in wet and dry spherical granular media. Phys. Rev. E-Stat. Phys. Plasmas Fluids Relat. Interdiscip. Top. 1997, 56, R6271–R6274. [Google Scholar] [CrossRef] [Green Version]
  62. Beattie, N.S.; Moir, R.S.; Chacko, C.; Buffoni, G.; Roberts, S.H.; Pearsall, N.M. Understanding the effects of sand and dust accumulation on photovoltaic modules. Renew. Energy 2012, 48, 448–452. [Google Scholar] [CrossRef] [Green Version]
  63. Mekhilef, S.; Saidur, R.; Kamalisarvestani, M. Effect of dust, humidity and air velocity on efficiency of photovoltaic cells. Renew. Sustain. Energy Rev. 2012, 16, 2920–2925. [Google Scholar] [CrossRef]
  64. Sayyah, A.; Horenstein, M.N.; Mazumder, M.K. Energy yield loss caused by dust deposition on photovoltaic panels. Sol. Energy 2014, 107, 576–604. [Google Scholar] [CrossRef]
  65. Park, N.C.; Oh, W.W.; Kim, D.H. Effect of temperature and humidity on the degradation rate of multicrystalline silicon photovoltaic module. Int. J. Photoenergy 2013, 2013, 1–9. [Google Scholar] [CrossRef] [Green Version]
  66. Kazem, H.A.; Chaichan, M.T. Effect of humidity on photovoltaic performance based on experimental study. Int. J. Appl. Eng. Res. 2015, 10, 43572–43577. [Google Scholar]
  67. Kimber, A.; Mitchell, L.; Nogradi, S.; Wenger, H. The effect of soiling on large grid-connected photovoltaic systems in California and the Southwest Region of the United States. In Proceedings of the Conference Record of the 2006 IEEE 4th World Conference Photovoltaic Energy Conversion, WCPEC-4, Waikoloa, HI, USA, 7–12 May 2006; Volume 2, pp. 2391–2395. [Google Scholar]
  68. Ascencio-Vásquez, J.; Kaaya, I.; Brecl, K.; Weiss, K.A.; Topič, M. Global climate data processing and mapping of degradation mechanisms and degradation rates of PV modules. Energies 2019, 12, 4749. [Google Scholar] [CrossRef] [Green Version]
  69. Ascencio-Vásquez, J.; Brecl, K.; Topič, M. Methodology of Köppen-Geiger-Photovoltaic climate classification and implications to worldwide mapping of PV system performance. Sol. Energy 2019, 191, 672–685. [Google Scholar] [CrossRef]
  70. Bethea, R.M.; Barriger, M.T.; Williams, P.F.; Chin, S. Environmental effects on solar concentrator mirrors. Sol. Energy 1981, 27, 497–511. [Google Scholar] [CrossRef]
  71. Ramli, M.A.M.; Prasetyono, E.; Wicaksana, R.W.; Windarko, N.A.; Sedraoui, K.; Al-Turki, Y.A. On the investigation of photovoltaic output power reduction due to dust accumulation and weather conditions. Renew. Energy 2016, 99, 836–844. [Google Scholar] [CrossRef]
  72. Nahar, N.M.; Gupta, J.P. Effect of dust on transmittance of glazing materials for solar collectors under arid zone conditions of India. Sol. Wind Technol. 1990, 7, 237–243. [Google Scholar] [CrossRef]
  73. Garg, H.P. Effect of dirt on transparent covers in flat-plate solar energy collectors. Solar Energy. 1974, 15, 299–302. [Google Scholar] [CrossRef]
  74. Bangold, R. The Physics of Blown Snad and Desert Dunes; Springer: Dordrecht, Switzerland, 1941. [Google Scholar]
  75. Hegazy, A.A. Effect of dust accumulation on solar transmittance through glass covers of plate-type collectors. Renew. Energy 2001, 22, 525–540. [Google Scholar] [CrossRef]
  76. Negash, T. Experimental investigation of the effect of tilt angle on the dust photovoltaic module. Int. J. Energy Power Eng. 2015, 4, 227. [Google Scholar] [CrossRef]
  77. Cano, J.; John, J.J.; Tatapudi, S.; Tamizhmani, G. Effect of tilt angle on soiling of photovoltaic modules. In Proceedings of the IEEE 40th Photovoltaic Specialists Conference PVSC 2014, Denver, CO, USA, 8–13 June 2014; pp. 3174–3176. [Google Scholar]
  78. Ullah, A.; Imran, H.; Maqsood, Z.; Butt, N.Z. Investigation of optimal tilt angles and effects of soiling on PV energy production in Pakistan. Renew. Energy 2019, 139, 830–843. [Google Scholar] [CrossRef]
  79. Ullah, A.; Amin, A.; Haider, T.; Saleem, M.; Butt, N.Z. Investigation of soiling effects, dust chemistry and optimum cleaning schedule for PV modules in Lahore, Pakistan. Renew. Energy 2020, 150, 456–468. [Google Scholar] [CrossRef]
  80. Luque, E.G.; Antonanzas-Torres, F.; Escobar, R. Effect of soiling in bifacial PV modules and cleaning schedule optimization. Energy Convers. Manag. 2018, 174, 615–625. [Google Scholar] [CrossRef]
  81. García, M.; Marroyo, L.; Lorenzo, E.; Pérez, M. Soiling and other optical losses in solar-tracking PV plants in navarra. Prog. Photovolt. Res. Appl. 2011, 19, 211–217. [Google Scholar] [CrossRef] [Green Version]
  82. Chanchangi, Y.N.; Ghosh, A.; Sundaram, S.; Mallick, T.K. An analytical indoor experimental study on the effect of soiling on PV, focusing on dust properties and PV surface material. Sol. Energy 2020, 203, 46–68. [Google Scholar] [CrossRef]
  83. Urrejola, E.; Antonanzas, J.; Ayala, P.; Salgado, M.; Ramírez-Sagner, G.; Cortés, C.; Pino, A.; Escobar, R. Effect of soiling and sunlight exposure on the performance ratio of photovoltaic technologies in Santiago, Chile. Energy Convers. Manag. 2016, 114, 338–347. [Google Scholar] [CrossRef]
  84. Cordero, R.R.; Damiani, A.; Laroze, D.; MacDonell, S.; Jorquera, J.; Sepúlveda, E.; Feron, S.; Llanillo, P.; Labbe, F.; Carrasco, J.; et al. Effects of soiling on photovoltaic (PV) modules in the Atacama Desert. Sci. Rep. 2018, 8, 1–14. [Google Scholar] [CrossRef] [Green Version]
  85. Kaldellis, J.K.; Fragos, P. Ash deposition impact on the energy performance of photovoltaic generators. J. Clean. Prod. 2011, 19, 311–317. [Google Scholar] [CrossRef]
  86. Lopez-Garcia, J.; Pozza, A.; Sample, T. Long-term soiling of silicon PV modules in a moderate subtropical climate. Sol. Energy 2016, 130, 174–183. [Google Scholar] [CrossRef]
  87. Ahmed, O.K.; Mohammed, Z.A. Dust effect on the performance of the hybrid PV/Thermal collector. Therm. Sci. Eng. Prog. 2017, 3, 114–122. [Google Scholar] [CrossRef]
  88. Jiang, H.; Lu, L.; Sun, K. Experimental investigation of the impact of airborne dust deposition on the performance of solar photovoltaic (PV) modules. Atmos. Environ. 2011, 45, 4299–4304. [Google Scholar] [CrossRef]
  89. Vivar, M.; Herrero, R.; Antón, I.; Martínez-Moreno, F.; Moretón, R.; Sala, G.; Blakers, A.W.; Smeltink, J. Effect of soiling in CPV systems. Sol. Energy 2010, 84, 1327–1335. [Google Scholar] [CrossRef] [Green Version]
  90. Qasem, H.; Betts, T.R.; Mullejans, H.; AlBusairi, H.; Gottschalg, R. Dust effect on pv modules. In Proceedings of the PVSAT-7: 7th Photovoltaic Science, Applications and Technology Conference, Edinburgh, Scotland, UK, 6–8 April 2011. [Google Scholar]
  91. Dorobantu, L.; Popescu, M.O.; Popescu, C.I.; Craciunescu, A. The effect of surface impurities on photovoltaic panels. Renew. Energy Power Qual. J. 2011, 1, 622–626. [Google Scholar] [CrossRef]
  92. Abderrezek, M.; Fathi, M. Experimental study of the dust effect on photovoltaic panels’ energy yield. Sol. Energy 2017, 142, 308–320. [Google Scholar] [CrossRef]
  93. Touati, F.; Massoud, A.; Abu-Hamad, J.; Saeed, S. Effects of environmental and climatic conditions on PV efficiency in qatar. Renew. Energy Power Qual. J. 2013, 1, 275. [Google Scholar] [CrossRef] [Green Version]
  94. Andrea, Y.; Pogrebnaya, T.; Kichonge, B. Effect of industrial dust deposition on photovoltaic module performance: Experimental measurements in the tropical region. Int. J. Photoenergy 2019, 2019. [Google Scholar] [CrossRef]
  95. Rao, A.; Pillai, R.; Mani, M.; Ramamurthy, P. Influence of dust deposition on photovoltaic panel performance. Energy Procedia 2014, 54, 690–700. [Google Scholar] [CrossRef] [Green Version]
  96. Mani, M.; Pillai, R. Impact of dust on solar photovoltaic (PV) performance: Research status, challenges and recommendations. Renew. Sustain. Energy Rev. 2010, 14, 3124–3131. [Google Scholar] [CrossRef]
  97. Bellmann, P.; Wolfertstetter, F.; Conceição, R.; Silva, H.G. Comparative modeling of optical soiling losses for CSP and PV energy systems. Sol. Energy 2020, 197, 229–237. [Google Scholar] [CrossRef]
  98. He, G.; Zhou, C.; Li, Z. Review of self-cleaning method for solar cell array. Procedia Eng. 2011, 16, 640–645. [Google Scholar] [CrossRef] [Green Version]
  99. Maghami, M.R.; Hizam, H.; Gomes, C.; Radzi, M.A.; Rezadad, M.I.; Hajighorbani, S. Power loss due to soiling on solar panel: A review. Renew. Sustain. Energy Rev. 2016, 59, 1307–1316. [Google Scholar] [CrossRef] [Green Version]
  100. Gaier, J.R.; Perezdavis, M.E.; Marabito, M. Aeolian removal of dust types from photovoltaic surfaces on Mars. In Proceedings of the 16th Space Simulation Conference, Albuquerque, NM, USA, 5–8 November 1990; Volume 3096, pp. 379–396. [Google Scholar]
  101. Al-Housani, M.; Bicer, Y.; Koç, M. Assessment of various dry photovoltaic cleaning techniques and frequencies on the power output of CdTe-type modules in dusty environments. Sustainability 2019, 11, 2850. [Google Scholar] [CrossRef] [Green Version]
  102. Masuda, S.; Fujibayashi, K.; Ishida, K.; Inaba, H. Confinement and transportation of charged aerosol clouds via electric curtain. Electr. Eng. Jpn. 1972, 92, 43–52. [Google Scholar] [CrossRef]
  103. Calle, C.I.; Buhler, C.R.; McFall, J.L.; Snyder, S.J. Particle removal by electrostatic and dielectrophoretic forces for dust control during lunar exploration missions. J. Electrost. 2009, 67, 89–92. [Google Scholar] [CrossRef] [Green Version]
  104. Kawamoto, H.; Uchiyama, M.; Cooper, B.L.; McKay, D.S. Mitigation of lunar dust on solar panels and optical elements utilizing electrostatic traveling-wave. J. Electrost. 2011, 69, 370–379. [Google Scholar] [CrossRef]
  105. Kawamoto, H.; Shibata, T. Electrostatic cleaning system for removal of sand from solar panels. J. Electrost. 2015, 73, 65–70. [Google Scholar] [CrossRef]
  106. Guo, B.; Javed, W.; Khoo, Y.S.; Figgis, B. Solar PV soiling mitigation by electrodynamic dust shield in field conditions. Sol. Energy 2019, 188, 271–277. [Google Scholar] [CrossRef]
  107. Guo, B.; Javed, W. Efficiency of electrodynamic dust shield at dust loading levels relevant to solar energy applications. IEEE J. Photovolt. 2018, 8, 196–202. [Google Scholar] [CrossRef]
  108. Guo, B.; Javed, W.; Pett, C.; Wu, C.Y.; Scheffe, J.R. Electrodynamic dust shield performance under simulated operating conditions for solar energy applications. Sol. Energy Mater. Sol. Cells 2018, 185, 80–85. [Google Scholar] [CrossRef]
  109. Guo, B.; Figgis, B.; Javed, W. Measurement of electrodynamic dust shield efficiency in field conditions. J. Electrost. 2019, 97, 26–30. [Google Scholar] [CrossRef]
  110. Kumar, N.M.; Sudhakar, K.; Samykano, M.; Sukumaran, S. Dust cleaning robots (DCR) for BIPV and BAPV solar power plants-A conceptual framework and research challenges. Procedia Comput. Sci. 2018, 133, 746–754. [Google Scholar] [CrossRef]
  111. Al Baloushi, A.; Saeed, M.; Marwan, S.; Algghafri, S.; Moumouni, Y. Portable robot for cleaning photovoltaic system: Ensuring consistent and optimal year-round photovoltaic panel performance. In Proceedings of the 2018 Advances in Science and Engineering Technology International Conferences (ASET), Dubai, UAE, 6 February–5 April 2018; pp. 1–4. [Google Scholar]
  112. Ganesh, V.A.; Raut, H.K.; Nair, A.S.; Ramakrishna, S. A review on self-cleaning coatings. J. Mater. Chem. 2011, 21, 16304–16322. [Google Scholar] [CrossRef]
  113. Mehmood, U.; Al-sulaiman, F.A.; Yilbas, B.S.; Salhi, B.; Ahmed, S.H.A.; Hossain, M.K. Solar energy materials & solar cells superhydrophobic surfaces with antire flection properties for solar applications: A critical review. Sol. Energy Mater. Sol. Cells 2016, 157, 604–623. [Google Scholar]
  114. Bhushan, B. Biomimetics: Lessons from Nature—An overview. Philos. Trans. R. Soc. A Math. Phys. Eng. Sci. 2009, 367, 1445–1486. [Google Scholar] [CrossRef] [PubMed] [Green Version]
  115. Feng, L.; Li, S.; Li, Y.; Li, H.; Zhang, L.; Zhai, J.; Song, Y.; Liu, B.; Jiang, L.; Zhu, D.; et al. Super-hydrophobic surfaces: From natural to artificial. Adv. Mater. 2002, 14, 1857–1860. [Google Scholar] [CrossRef]
  116. Bixler, G.D.; Bhushan, B. Bioinspired rice leaf and butterfly wing surface structures combining shark skin and lotus effects. Soft Matter 2012, 8, 11271–11284. [Google Scholar] [CrossRef]
  117. Bohn, H.F.; Federle, W. Insect aquaplaning: Nepenthes pitcher plants capture prey with the peristome, a fully wettable water-lubricated anisotropic surface. Proc. Natl. Acad. Sci. USA. 2004, 101, 14138–14143. [Google Scholar] [CrossRef] [Green Version]
  118. Nishimoto, S.; Bhushan, B. RSC Advances Bioinspired self-cleaning surfaces with superhydrophobicity, superoleophobicity, and superhydrophilicity. RSC Adv. 2013, 3, 671–690. [Google Scholar] [CrossRef]
  119. Jesus, M.A.M.L.d.; Neto, J.T.d.S.; Timò, G.; Paiva, P.R.P.; Dantas, M.S.S.; Ferreira, A.d.M. Superhydrophilic self-cleaning surfaces based on TiO2 and TiO2/SiO2 composite films for photovoltaic module cover glass. Appl. Adhes. Sci. 2015, 3, 169. [Google Scholar] [CrossRef] [Green Version]
  120. Zhong, H.; Hu, Y.; Wang, Y.; Yang, H. TiO2/silane coupling agent composed of two layers structure: A super-hydrophilic self-cleaning coating applied in PV panels. Appl. Energy 2017, 204, 932–938. [Google Scholar] [CrossRef]
  121. Fares, E.; Bicer, Y. Comparative performance evaluation of c-Si and GaAs type PV cells with and without anti-soiling coating using energy and exergy analysis. Renew. Energy 2020, 146, 1010–1020. [Google Scholar] [CrossRef]
  122. Nundy, S.; Ghosh, A.; Mallick, T.K. Hydrophilic and superhydrophilic self-cleaning coatings by morphologically varying ZnO microstructures for photovoltaic and glazing applications. ACS Omega 2020, 5, 1033–1039. [Google Scholar] [CrossRef] [Green Version]
  123. Pan, A.; Lu, H.; Zhang, L.Z. Experimental investigation of dust deposition reduction on solar cell covering glass by different self-cleaning coatings. Energy 2019, 181, 645–653. [Google Scholar] [CrossRef]
  124. Oehler, G.C.; Lisco, F.; Bukhari, F.; Uličná, S.; Strauss, B.; Barth, K.L.; Walls, J.M. Testing the durability of anti-soiling coatings for solar cover glass by outdoor exposure in Denmark. Energies 2020, 13, 299. [Google Scholar] [CrossRef] [Green Version]
  125. Aslam, O.P.M. Badruddin study of the influence of solar variability on a regional (Indian) climate: 1901–2007. Adv. Space Res. 2014, 54, 1698–1703. [Google Scholar] [CrossRef] [Green Version]
  126. Avashia, V.; Garg, A. Implications of land use transitions and climate change on local flooding in urban areas: An assessment of 42 Indian cities. Land Use Policy 2020, 95, 104571. [Google Scholar] [CrossRef]
  127. Makade, R.G.; Chakrabarti, S.; Jamil, B.; Sakhale, C.N. Estimation of global solar radiation for the tropical wet climatic region of India: A theory of experimentation approach. Renew. Energy 2020, 146, 2044–2059. [Google Scholar] [CrossRef]
  128. Ali, M.; Jamil, B. Fakhruddin estimating diffuse solar radiation in India: Performance characterization of generalized single-input empirical models. Urban Clim. 2019, 27, 314–350. [Google Scholar] [CrossRef]
  129. British Petroleum. BP Energy Outlook—2019: Insights from the Evolving Transition Scenario—India; BP: London, UK, 2019; pp. 1–2. Available online: https://www.bp.com/content/dam/bp/business-sites/en/global/corporate/pdfs/energy-economics/energy-outlook/bp-energy-outlook-2019-country-insight-india.pdf (accessed on 28 May 2020).
  130. Kumar Shukla, U.; Sharma, S. The potential of electricity imports to meet future electricity requirements in India. Electr. J. 2017, 30, 71–84. [Google Scholar] [CrossRef]
  131. Laha, P.; Chakraborty, B.; Østergaard, P.A. Electricity system scenario development of India with import independence in 2030. Renew. Energy 2019, 151, 627–639. [Google Scholar] [CrossRef]
  132. IEA. Total Primary Energy Supply 2017; IEA: Paris, France, 2019; Available online: https://www.iea.org/regions/asia-pacific (accessed on 28 May 2020).
  133. Das, B.; Suresh, A.; Dash, P.S.; Chandra, S.; Díaz, M.C.; Stevens, L.A.; Snape, C.E. Understanding the unusual fluidity characteristics of high ash Indian bituminous coals. Fuel Process. Technol. 2018, 176, 258–266. [Google Scholar] [CrossRef]
  134. Mahapatro, A.; Mahanta, P. Gasification studies of low-grade Indian coal and biomass in a lab-scale pressurized circulating fluidized bed. Renew. Energy 2019, 150, 1151–1159. [Google Scholar] [CrossRef]
  135. Bambawale, M.J.; Sovacool, B.K. India’s energy security: A sample of business, government, civil society, and university perspectives. Energy Policy 2011, 39, 1254–1264. [Google Scholar] [CrossRef]
  136. Sharma, A. India and energy security. Asian Aff. (Lond.) 2007, 38, 158–172. [Google Scholar] [CrossRef]
  137. Parikh, K.S.; Parikh, J.K.; Ghosh, P.P. Can India grow and live within a 1.5 degree CO2 emissions budget? Energy Policy 2018, 120, 24–37. [Google Scholar] [CrossRef]
  138. Dhar, S.; Pathak, M.; Shukla, P.R. Transformation of India’s steel and cement industry in a sustainable 1.5 °C world. Energy Policy 2020, 137, 111104. [Google Scholar] [CrossRef]
  139. Sarangi, G.K.; Mishra, A.; Chang, Y.; Taghizadeh-Hesary, F. Indian electricity sector, energy security and sustainability: An empirical assessment. Energy Policy 2019, 135, 110964. [Google Scholar] [CrossRef]
  140. Hairat, M.K.; Ghosh, S. 100 GW solar power in India by 2022 – A critical review. Renew. Sustain. Energy Rev. 2017, 73, 1041–1050. [Google Scholar] [CrossRef]
  141. Gupta, D.; Ghersi, F.; Vishwanathan, S.S.; Garg, A. Achieving sustainable development in India along low carbon pathways: Macroeconomic assessment. World Dev. 2019, 123, 104623. [Google Scholar] [CrossRef]
  142. Behuria, P. The politics of late late development in renewable energy sectors: Dependency and contradictory tensions in India’s National Solar Mission. World Dev. 2020, 126, 104726. [Google Scholar] [CrossRef]
  143. Charles Rajesh Kumar, J.; Majid, M.A. Renewable energy for sustainable development in India: Current status, future prospects, challenges, employment, and investment opportunities. Energy Sustain. Soc. 2020, 10, 1–36. [Google Scholar]
  144. Goel, M. Solar rooftop in India: Policies, challenges and outlook. Green Energy Environ. 2016, 1, 129–137. [Google Scholar] [CrossRef] [Green Version]
  145. Raina, G.; Sinha, S. Outlook on the Indian scenario of solar energy strategies: Policies and challenges. Energy Strategy Rev. 2019, 24, 331–341. [Google Scholar] [CrossRef]
  146. Solar Power Europe (SPE). Global Market Outlook for Solar Power: 2019–2023; Solar Power Europe: Brussels, Belgium, 2019; p. 92. Available online: https://www.solarpowereurope.org/global-market-outlook-2019-2023/ (accessed on 28 May 2020).
  147. Parnell, J. World’s Largest Solar Project will also Be Its Cheapest 2020; Greentechmedia: Boston, MA, USA, 2020; Available online: https://www.greentechmedia.com/articles/read/worlds-largest-solar-project-will-also-be-worlds-cheapest (accessed on 28 May 2020).
  148. Lam, N.L.; Smith, K.R.; Gauthier, A.; Bates, M.N. Kerosene: A review of household uses and their hazards in low-and middle-income countries. J. Toxicol. Environ. Heal.-Part B Crit. Rev. 2012, 15, 396–432. [Google Scholar] [CrossRef] [Green Version]
  149. Kumar, A.; Prakash, O.; Dube, A. A review on progress of concentrated solar power in India. Renew. Sustain. Energy Rev. 2017, 79, 304–307. [Google Scholar] [CrossRef]
  150. Singh, Y.; Pal, N. Obstacles and comparative analysis in the advancement of photovoltaic power stations in India. Sustain. Comput. Inform. Syst. 2020, 25, 100372. [Google Scholar] [CrossRef]
  151. Rathore, P.K.S.; Chauhan, D.S.; Singh, R.P. Decentralized solar rooftop photovoltaic in India: On the path of sustainable energy security. Renew. Energy 2019, 131, 297–307. [Google Scholar] [CrossRef]
  152. Chattopadhyay, M.; Chattopadhyay, D. Analysis of Indian renewable energy policy using climate data. Electr. J. 2012, 25, 81–93. [Google Scholar] [CrossRef]
  153. Liu, T.; Marlier, M.E.; DeFries, R.S.; Westervelt, D.M.; Xia, K.R.; Fiore, A.M.; Mickley, L.J.; Cusworth, D.H.; Milly, G. Seasonal impact of regional outdoor biomass burning on air pollution in three Indian cities: Delhi, Bengaluru, and Pune. Atmos. Environ. 2018, 172, 83–92. [Google Scholar] [CrossRef]
  154. Müller, J.; Mitra, I.; Mieslinger, T.; Meyer, R.; Chhatbar, K.; Gomathinayagam, S.; Giridhar, G. Towards building solar in India—A combined mapping and monitoring approach for creating a new solar atlas. Energy Sustain. Dev. 2017, 40, 31–40. [Google Scholar] [CrossRef]
  155. Chandrashekhar, V. Air Pollution in India reducing Solar Power Yield by 17–25%; The Times of India: Delhi, India, 2017; Available online: https://timesofindia.indiatimes.com/home/environment/pollution/air-pollution-in-india-reducing-solar-power-yield-by-17-25-study/articleshow/58378057.cms? (accessed on 28 May 2020).
  156. Gadi, R.; Saxena, M.; Sharma, S.K.; Mandal, T.K. Short-term degradation of air quality during major firework events in Delhi, India. Meteorol. Atmos. Phys. 2019, 131, 753–764. [Google Scholar]
  157. Rajaram, B.S.; Suryawanshi, P.V.; Bhanarkar, A.D.; Rao, C.V.C. Heavy metals contamination in road dust in Delhi city, India. Environ. Earth Sci. 2014, 72, 3929–3938. [Google Scholar] [CrossRef]
  158. Badarinath, K.V.S.; Kharol, S.K.; Kaskaoutis, D.G.; Kambezidis, H.D. Case study of a dust storm over Hyderabad area, India: Its impact on solar radiation using satellite data and ground measurements. Sci. Total Environ. 2007, 384, 316–332. [Google Scholar] [CrossRef] [PubMed]
  159. Mani, F.; Pulipaka, S.; Kumar, R. Characterization of power losses of a soiled PV panel in Shekhawati region of India. Sol. Energy 2016, 131, 96–106. [Google Scholar] [CrossRef]
  160. Boddupalli, N.; Singh, G.; Chandra, L.; Bandyopadhyay, B. Reprint of: Dealing with dust—Some challenges and solutions for enabling solar energy in desert regions. Sol. Energy 2017, 154, 134–143. [Google Scholar] [CrossRef]
  161. Yadav, N.K.; Pala, D.; Chandra, L. On the understanding and analyses of dust deposition on Heliostat. Energy Procedia 2014, 57, 3004–3013. [Google Scholar] [CrossRef] [Green Version]
  162. Vaishak, S.; Bhale, P.V. Effect of dust deposition on performance characteristics of a refrigerant based photovoltaic/thermal system. Sustain. Energy Technol. Assess. 2019, 36, 100548. [Google Scholar] [CrossRef]
  163. Waldl, H.P.; Das, P.K. Impact of soiling on energy yield of solar PV power plant and developing soiling correction factor for solar pv power forecasting. In Proceedings of the 2nd International Conference on Large-Scale Grid Integration of Renewable Energy in India, New Delhi, India, 4–6 September 2019. [Google Scholar]
  164. Perry, N. Air Pollution Throws Shade on India’s Solar Success; AFP: Gandhinagar, India, 2017; Available online: https://www.breitbart.com/news/air-pollution-throws-shade-on-indias-solar-success/ (accessed on 28 May 2020).
  165. Shiva Kumar, B.; Sudhakar, K. Performance evaluation of 10 MW grid connected solar photovoltaic power plant in India. Energy Rep. 2015, 1, 184–192. [Google Scholar] [CrossRef] [Green Version]
  166. Tejwani, R.; Solanki, C.S. 360° sun tracking with automated cleaning system for solar PV modules. In Proceedings of the 35th IEEE Photovoltaic Specialists Conference, Honolulu, HI, USA, 20–25 June 2010; pp. 2895–2898. [Google Scholar]
Figure 1. Examples of soiling. Overview of different soiling types with exemplary photographs of soiling by (A) mineral dust in a desert area, (B) bird droppings, (C) algae, lichen, mosses, or fungi, (D) pollen in wet and moderate climates, (E) engine exhaust from an industrial area, and (F) agricultural emissions. (taken from [39]).
Challenges 11 00009 g001
Figure 2. Photovoltaic (PV) output power (a) after one week of dust accumulation and (b) after three weeks in September 2014, Surabaya, Indonesia [71]. (c) Adverse effect of soiled PV/thermal (T) system in Iraq [87]; (d) accumulated dust on different PV modules installed in Kuwait [90].
Challenges 11 00009 g002
Figure 3. (a) Thermal investigation of a clean panel. (b) Thermal investigation of a non-uniform dust deposited panel [91]. (c) Working temperature of the PV panel with different weight of soil [28].
Challenges 11 00009 g003
Figure 4. Schematic of electrostatic cleaning [105].
Challenges 11 00009 g004
Figure 5. (a) Physical map of Indian solar radiation [150]; (b) state-wide installed solar rooftop PVs in India [151].
Challenges 11 00009 g005
Figure 6. Cleaning system for different climate zones in India.
Challenges 11 00009 g006
Table 1. Comparison of dust samples in some places [46].
LocationMajor ElementsMajor OxidesOrigin
Hangzhou (30.25° N, 120.16°), ChinaSi, Ca, Al, Fe, K, Mg, NaSiO2, Al2O3, CaO, Fe2O3Sand, potash feldspar, straw burning, mechanical wear[46]
Perth (56.39° N, –3.43° E), AustraliaSi, Ca, Al, Fe, KCalcium oxide, quartz, orthoclase (KAlSi3O8)Acidic and sandy soils from deserts[47]
Doha (25.29° N, 51.51° E), QatarCa, Si, Fe, Mg, AlCalcite (Ca(CO3)), dolomite (CaMg(CO3)2, quartz (SiO2)Dolomite, calcite, building, local soil
UAESiO2, Fe2O3, CaOHuman activities, wind-blown dust coming from the Arabian Peninsula[48]
Cairo (30.04° N, 31.24°), E QatarSi, Ca, Al, Fe, Mg, K, NaQuartz (SiO2), calcite (CaCO3)Cement industry, desert, fossil fuel combustion[49]
Northern PolandSi, Al, Mg, Fe, K, Ca, P, SSiO2, Al2O3, MgOSand, frictional elements of mechanical components[50]
Table 2. Details of India’s major PV installations.
LocationDetails
Pavagada (14.1°N, 77.28°E) Solar Park, KarnatakaUsed land area 13,000 acres.
Currently in operation 2050 MW.
Kurnool (15.68°N, 78.28°E) Ultra Mega Solar Park, Andhra PradeshUsed land area 5932.32 acres.
Capacity of 1000 MW.
Consist 4000 k PV panel.
Kamuthi (9.40° N, 78.36° E) Solar Power Project, Tamil NaduGenerating capacity of 648 MWp commissioned by Adani Power; consists of 2500 k PV panel.
This station is connected to 400 kV substation of the Tamil Nadu Transmission Corp.
PV panels are cleaned using self-charge robotic system daily.
Bhadla (27.53° N, 71.9° E) Solar Park, RajasthanUsed land area of 10,000 acres.
The park has total capacity of 2255 MW and commissioned power capacity is 115 MW (as of 22nd February 2017).
Charanka (23°54′N 71°12′E)
Solar park, northern Gujarat
Used land area 5384 acres.
The site is the world’s second largest photovoltaic power station and spread across 5384 acres of unused land.
Presently operating capacity of 615 MW.

