
The Evolution of the Spatial Distribution Pattern of Mosques in the Kashgar Region from 1955 to 2004


Abstract
:1. Introduction
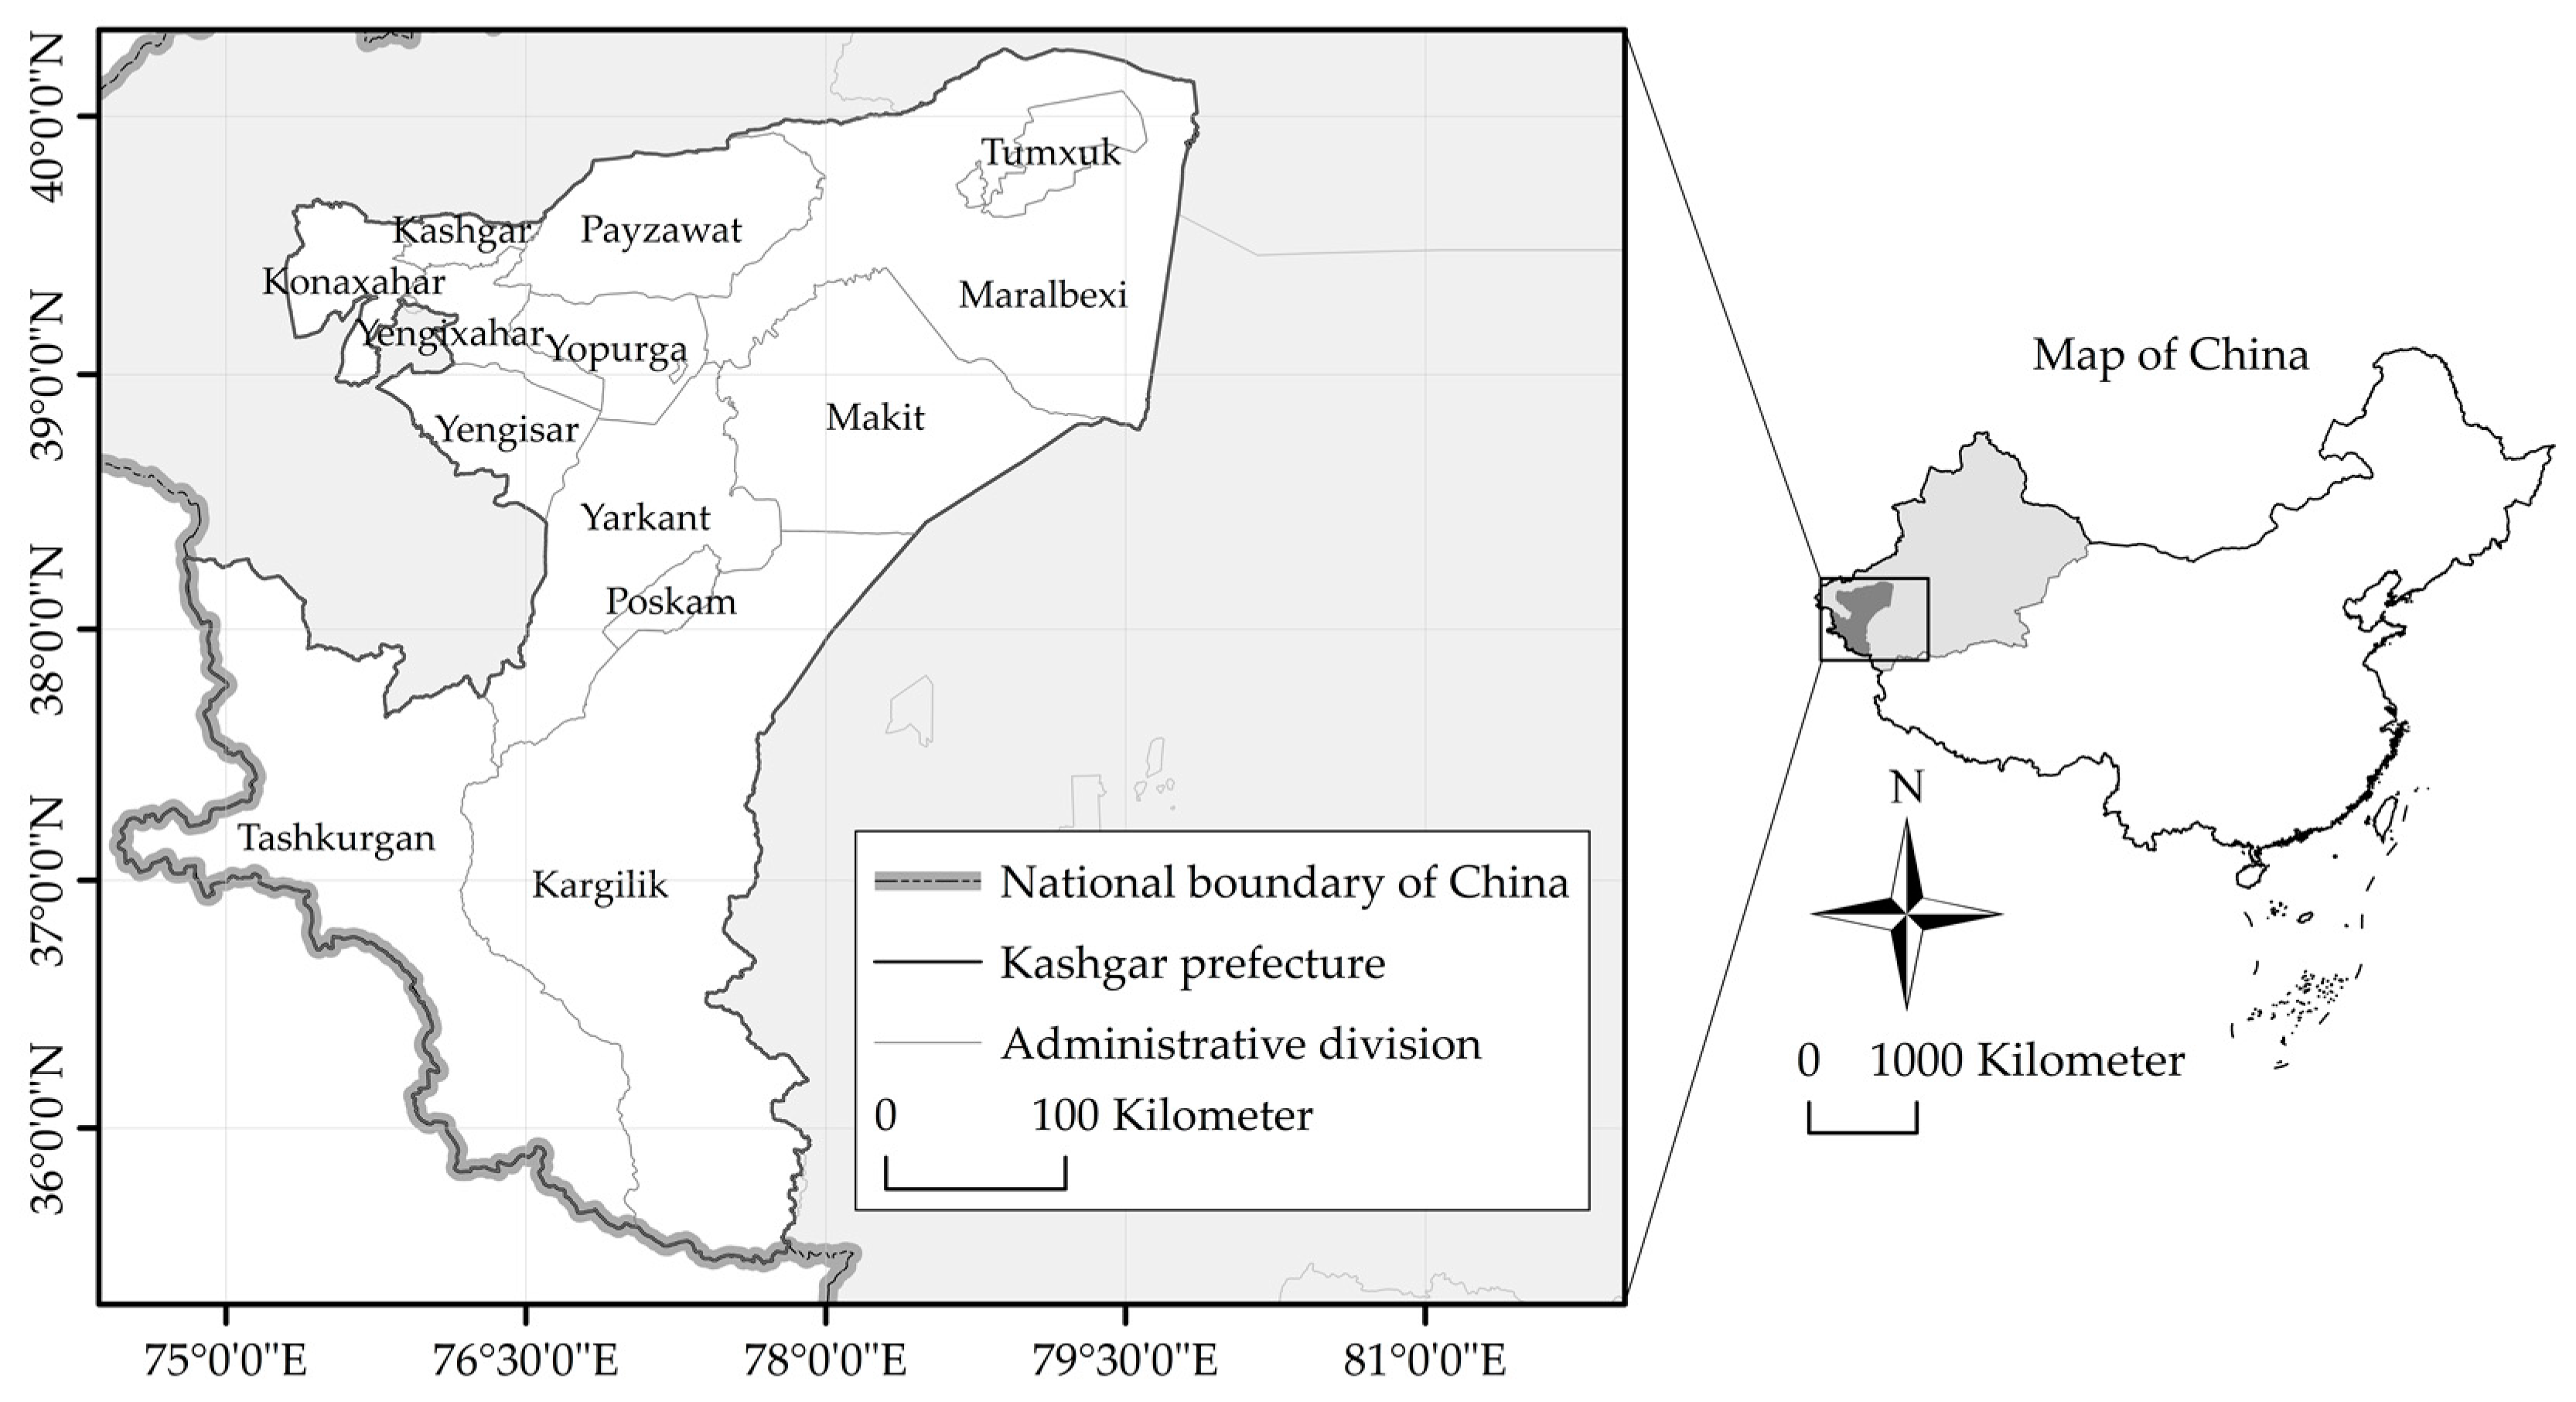
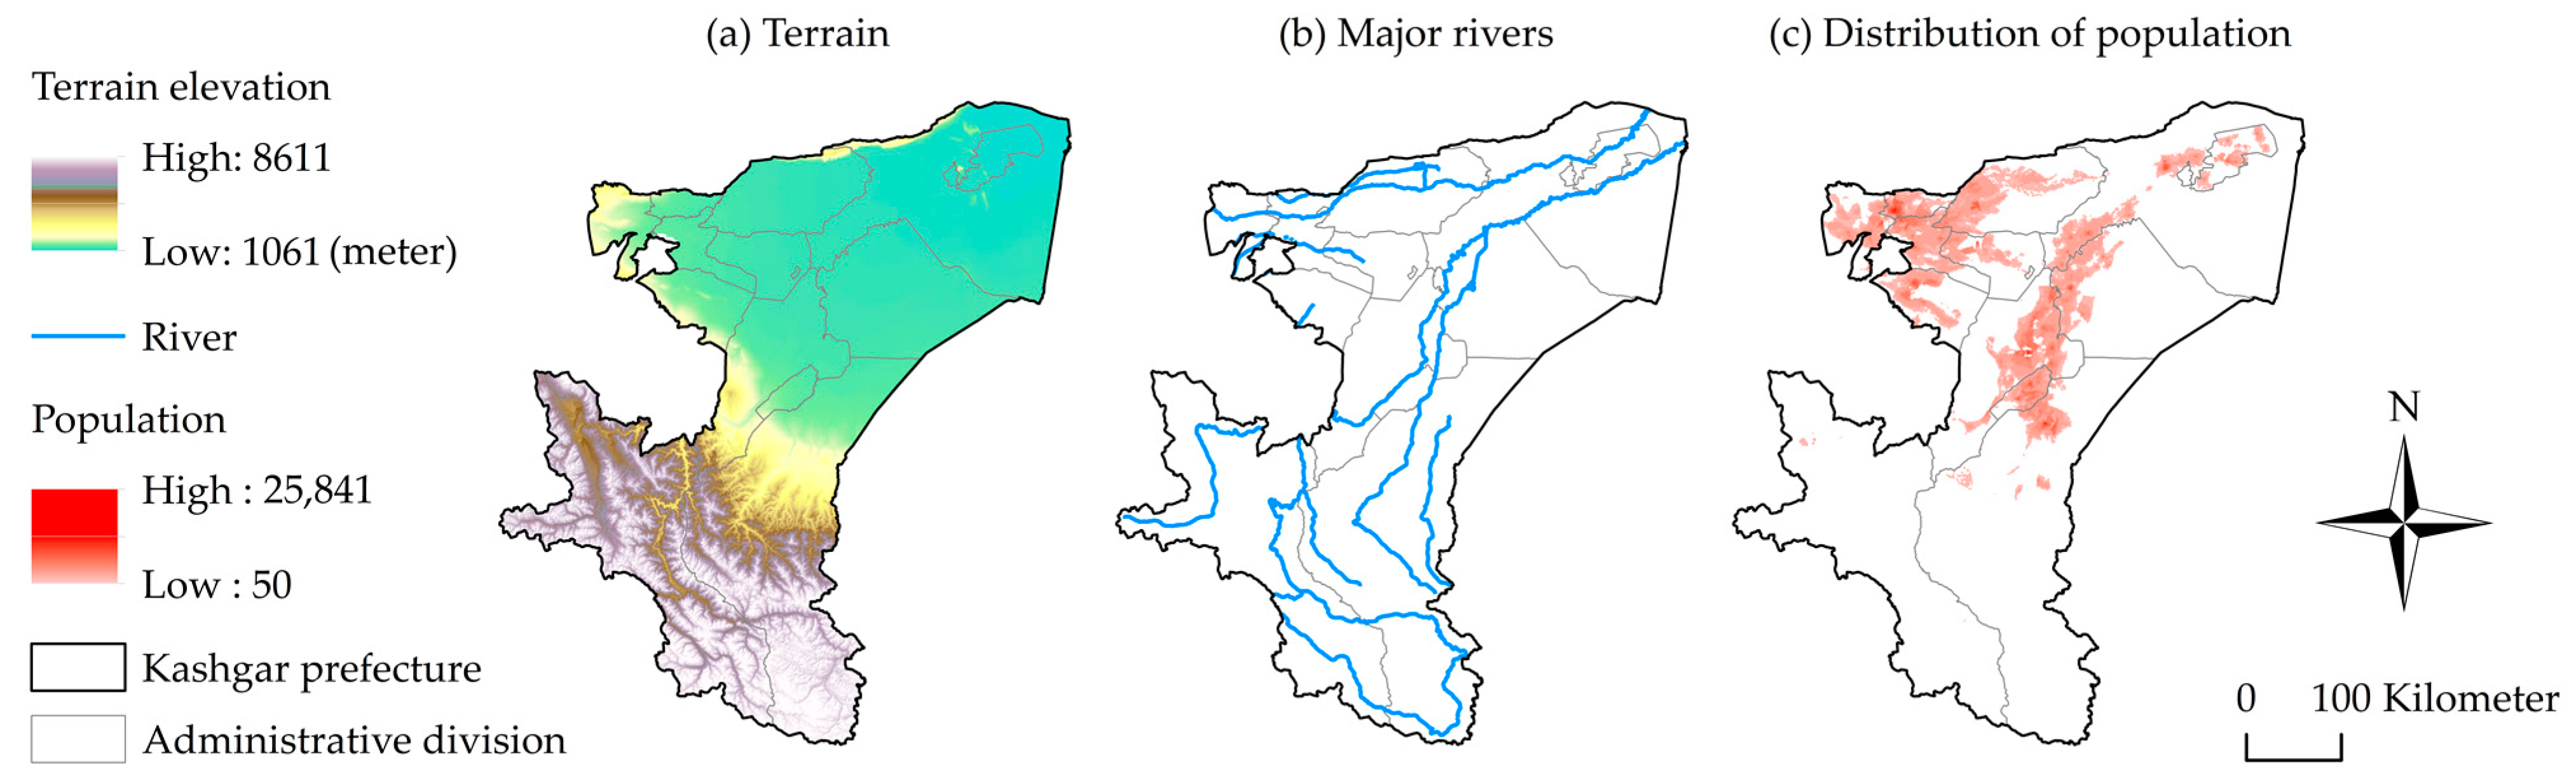
2. Overview of the Study Area
3. Data
3.1. Mosques Data
3.1.1. Location and Name of the Mosques
3.1.2. Longitude and Latitude Coordinates of the Mosques
3.1.3. Information on the Operation Nature of the Mosques
3.1.4. The Year the Mosques Started
3.2. Maps and Geographic Data
4. Methods
4.1. Standard Deviation Index and Coefficient of Variation
4.2. Global Moran’s I
4.3. Dot Density Estimation
4.4. Standard Deviational Ellipse
5. Analysis
5.1. Temporal Evolutionary Features of Mosques in the Kashgar Region
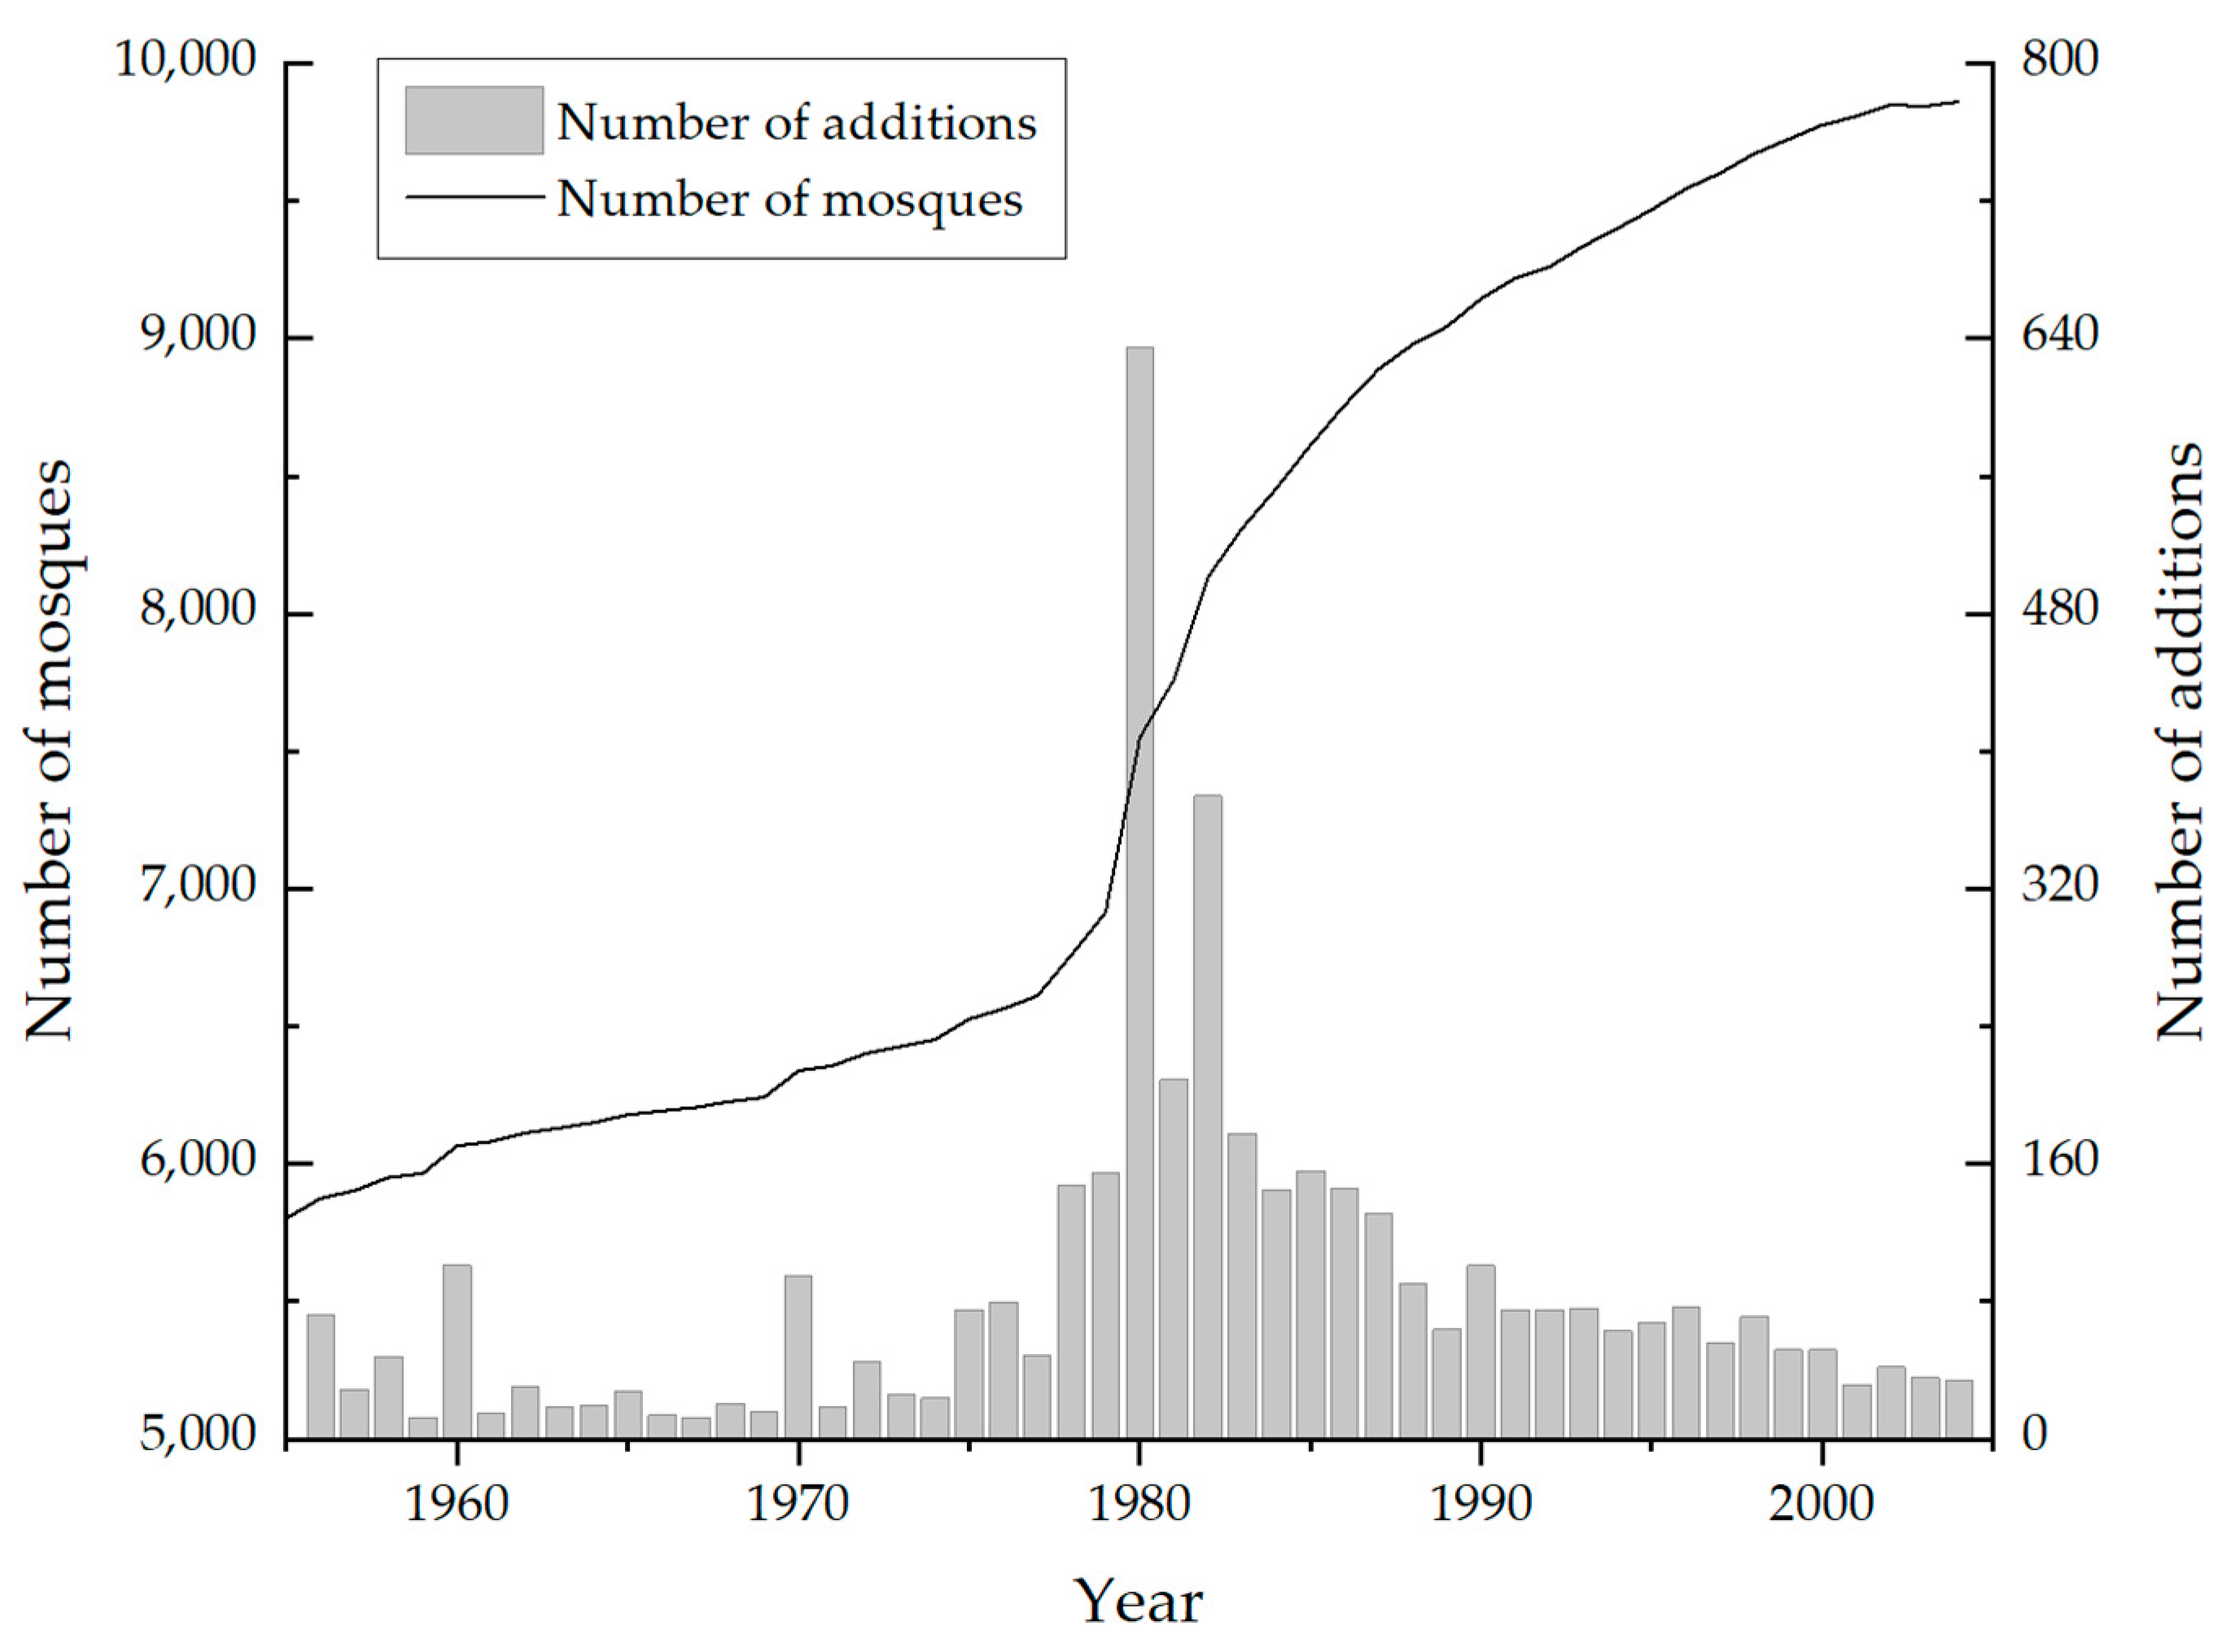
5.1.1. Changes in the Number of Mosques
5.1.2. Statistical Characteristics of the Number of Mosques
5.2. Spatial Evolution Characteristics of Mosques in the Kashgar Region
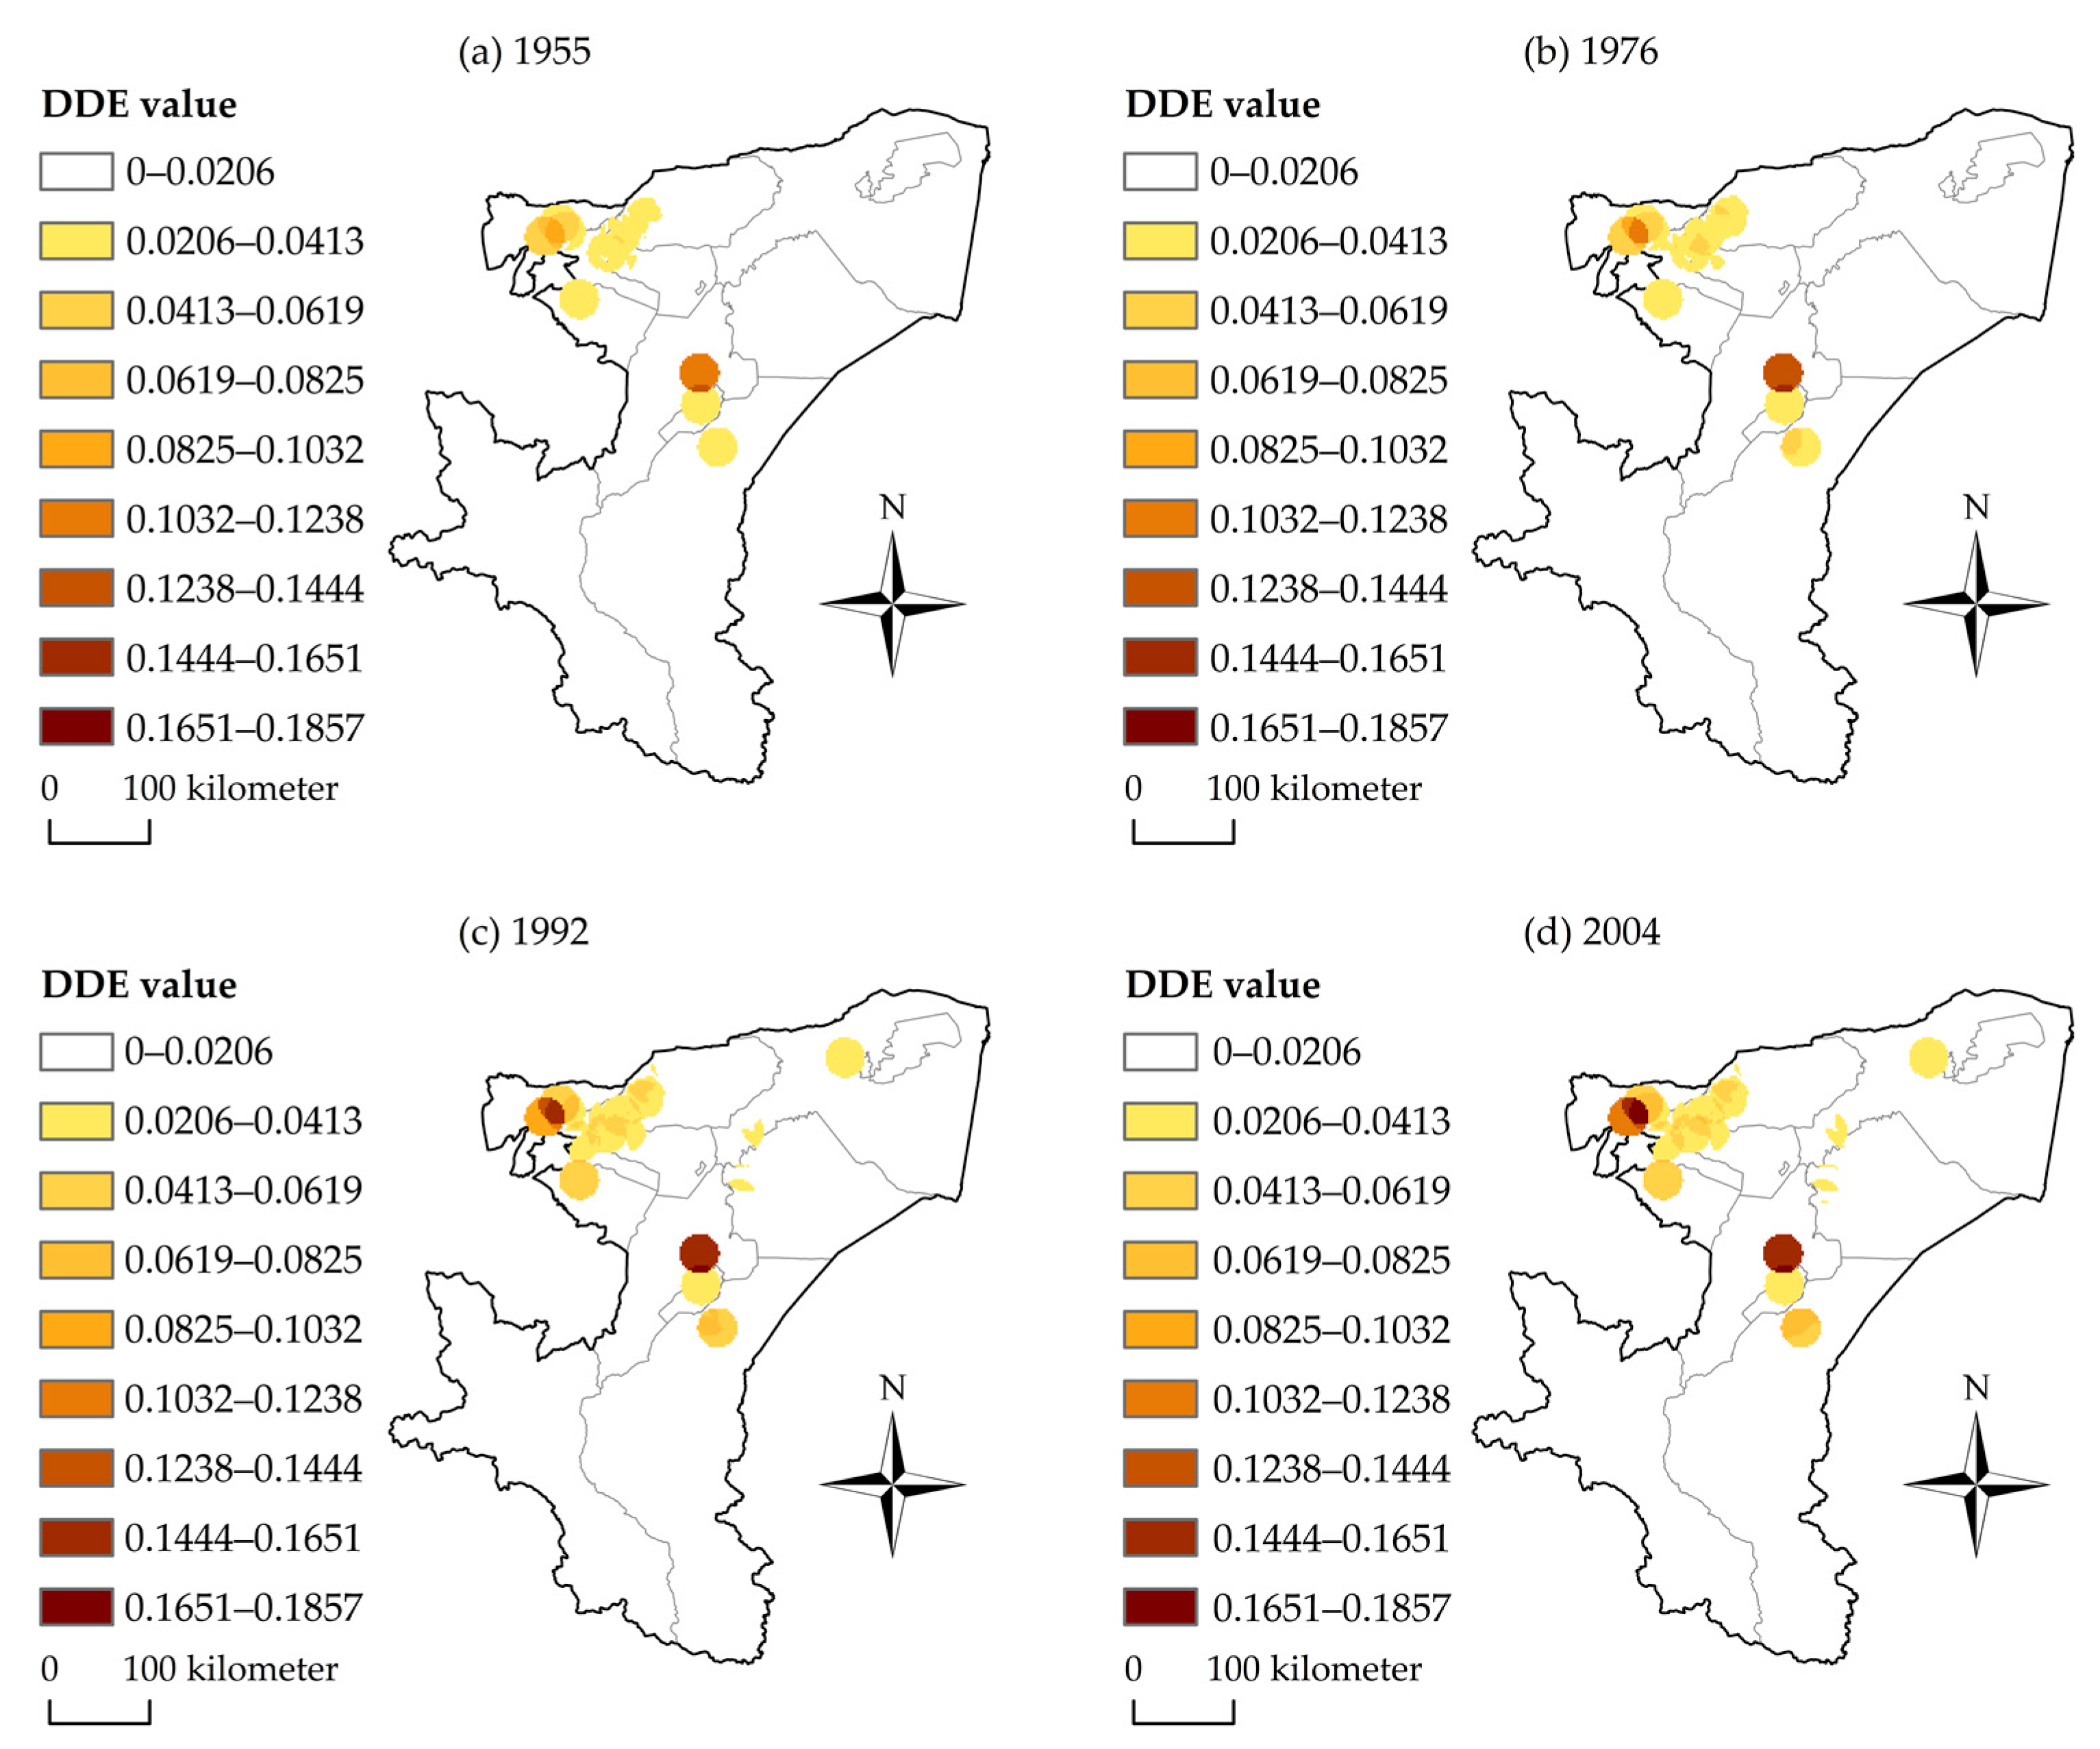
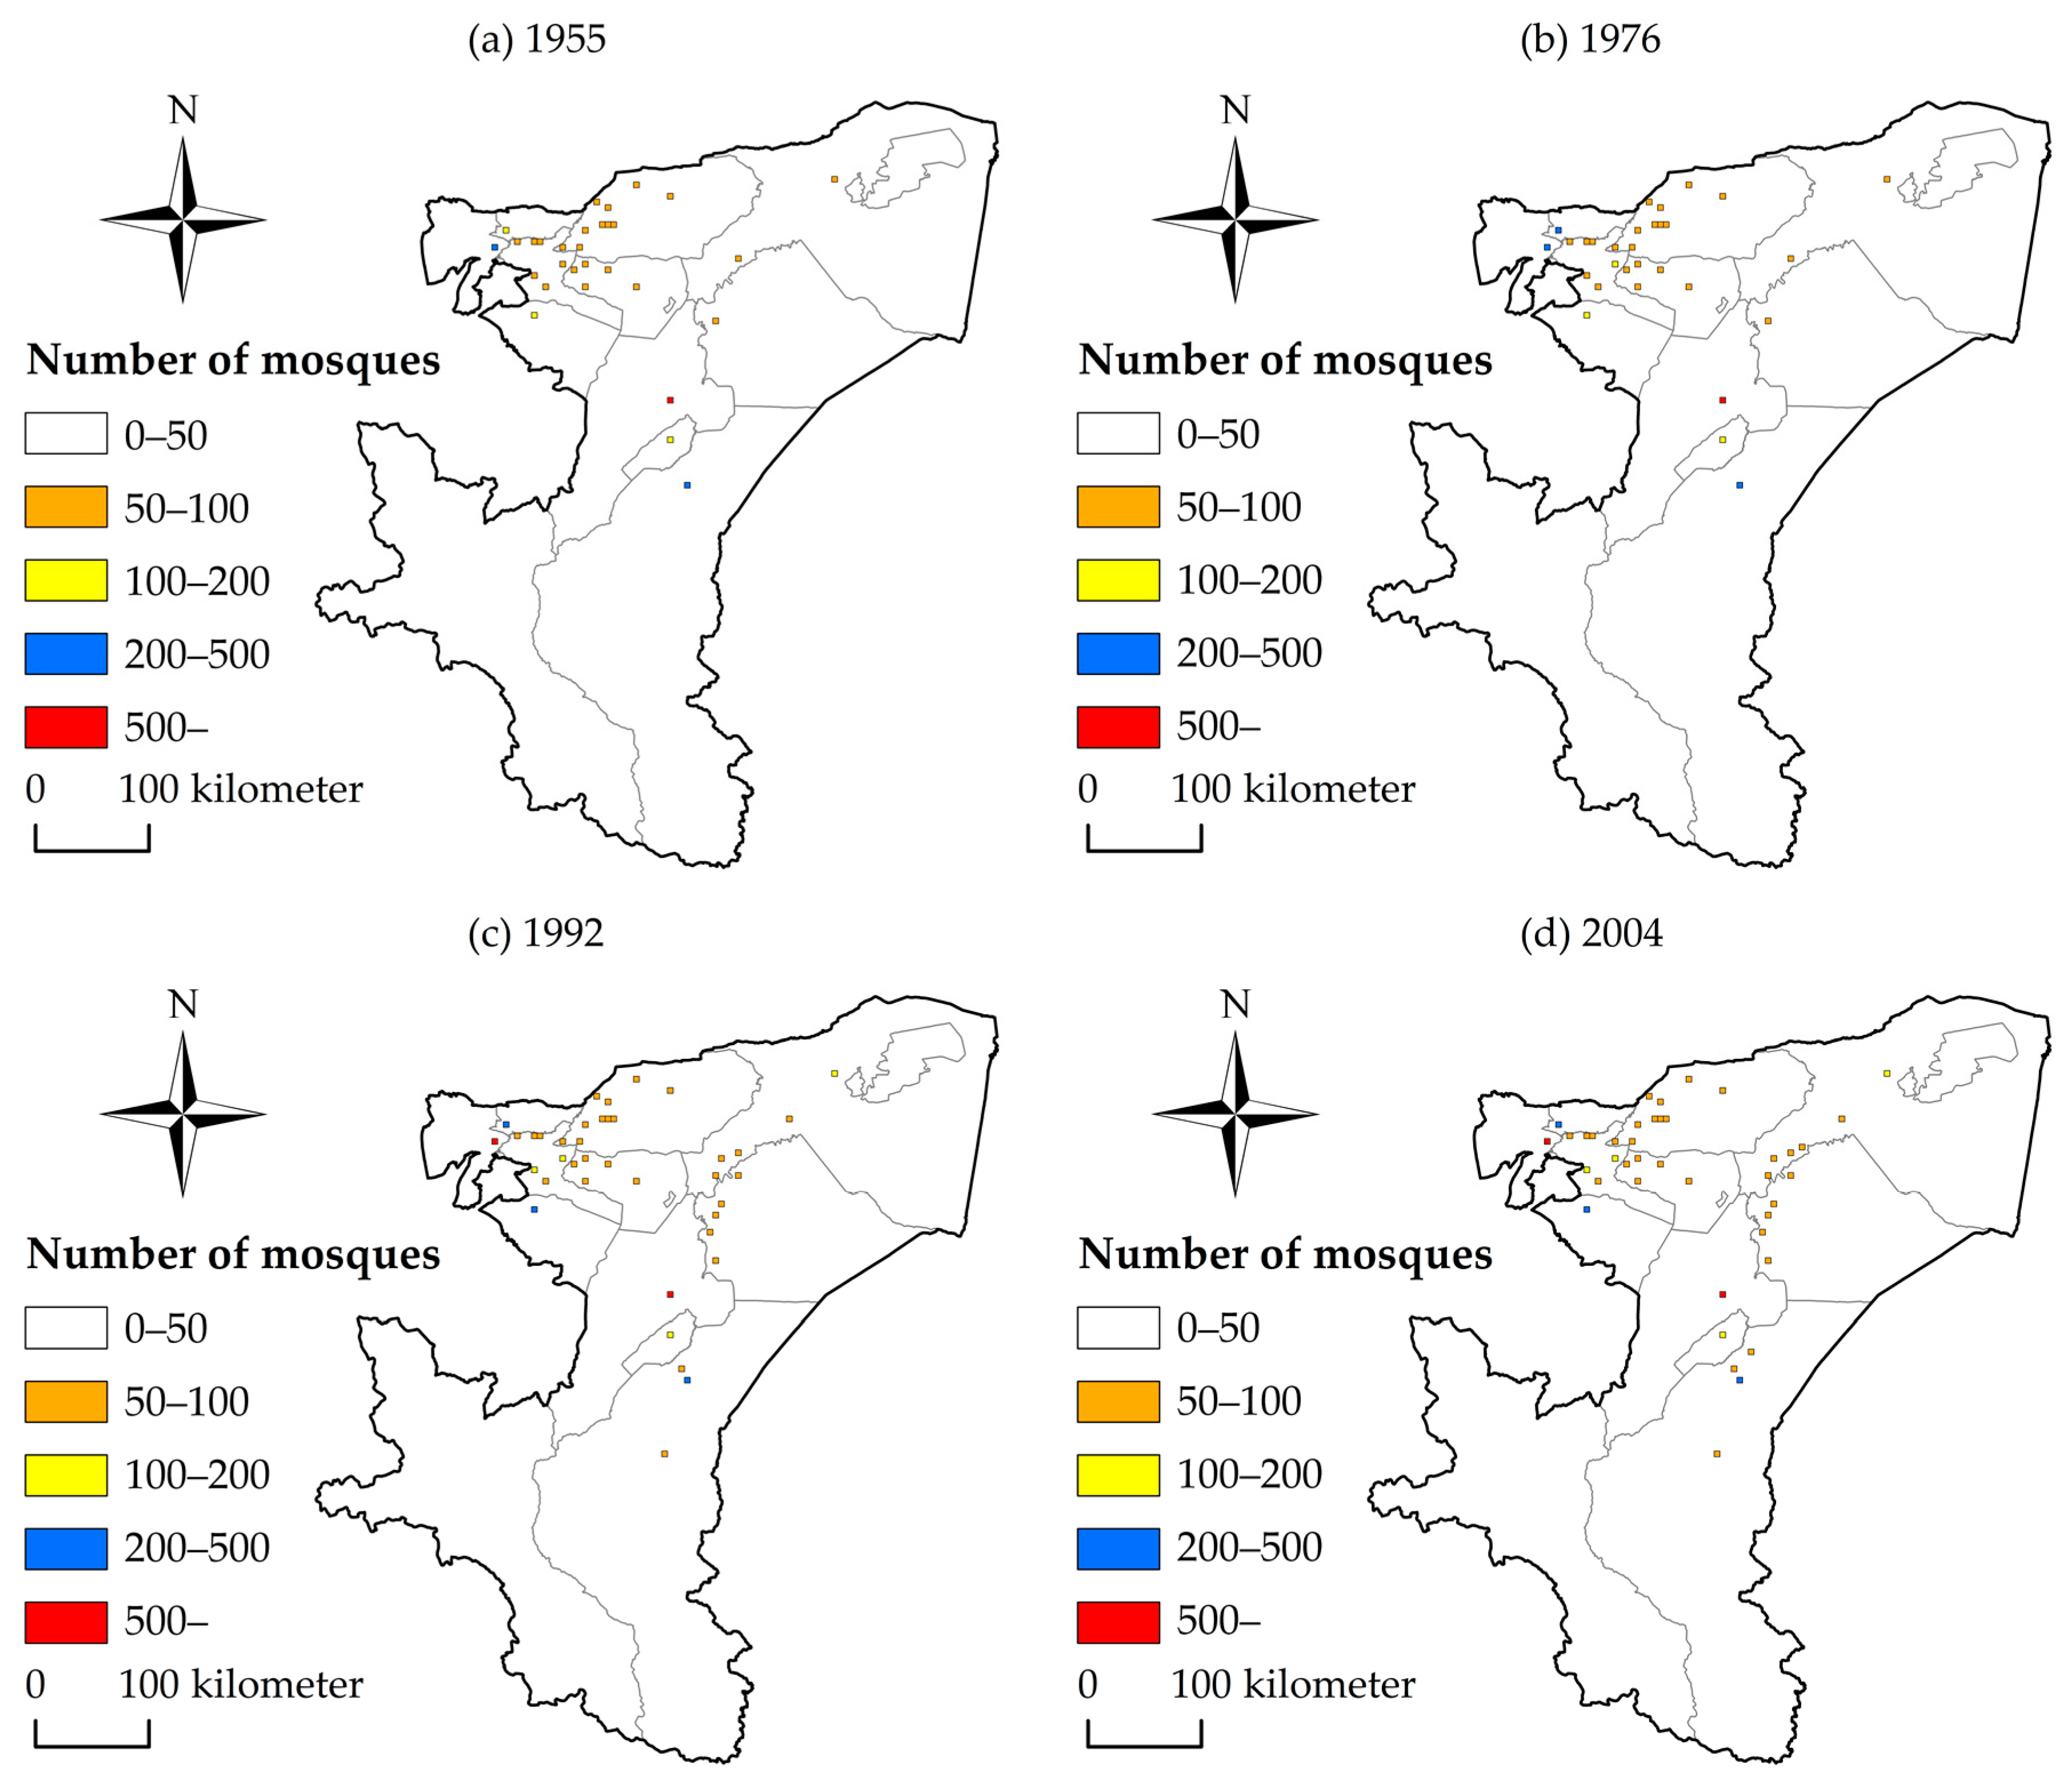
5.2.1. Spatial Distribution of Mosques
5.2.2. Clustering of Mosques
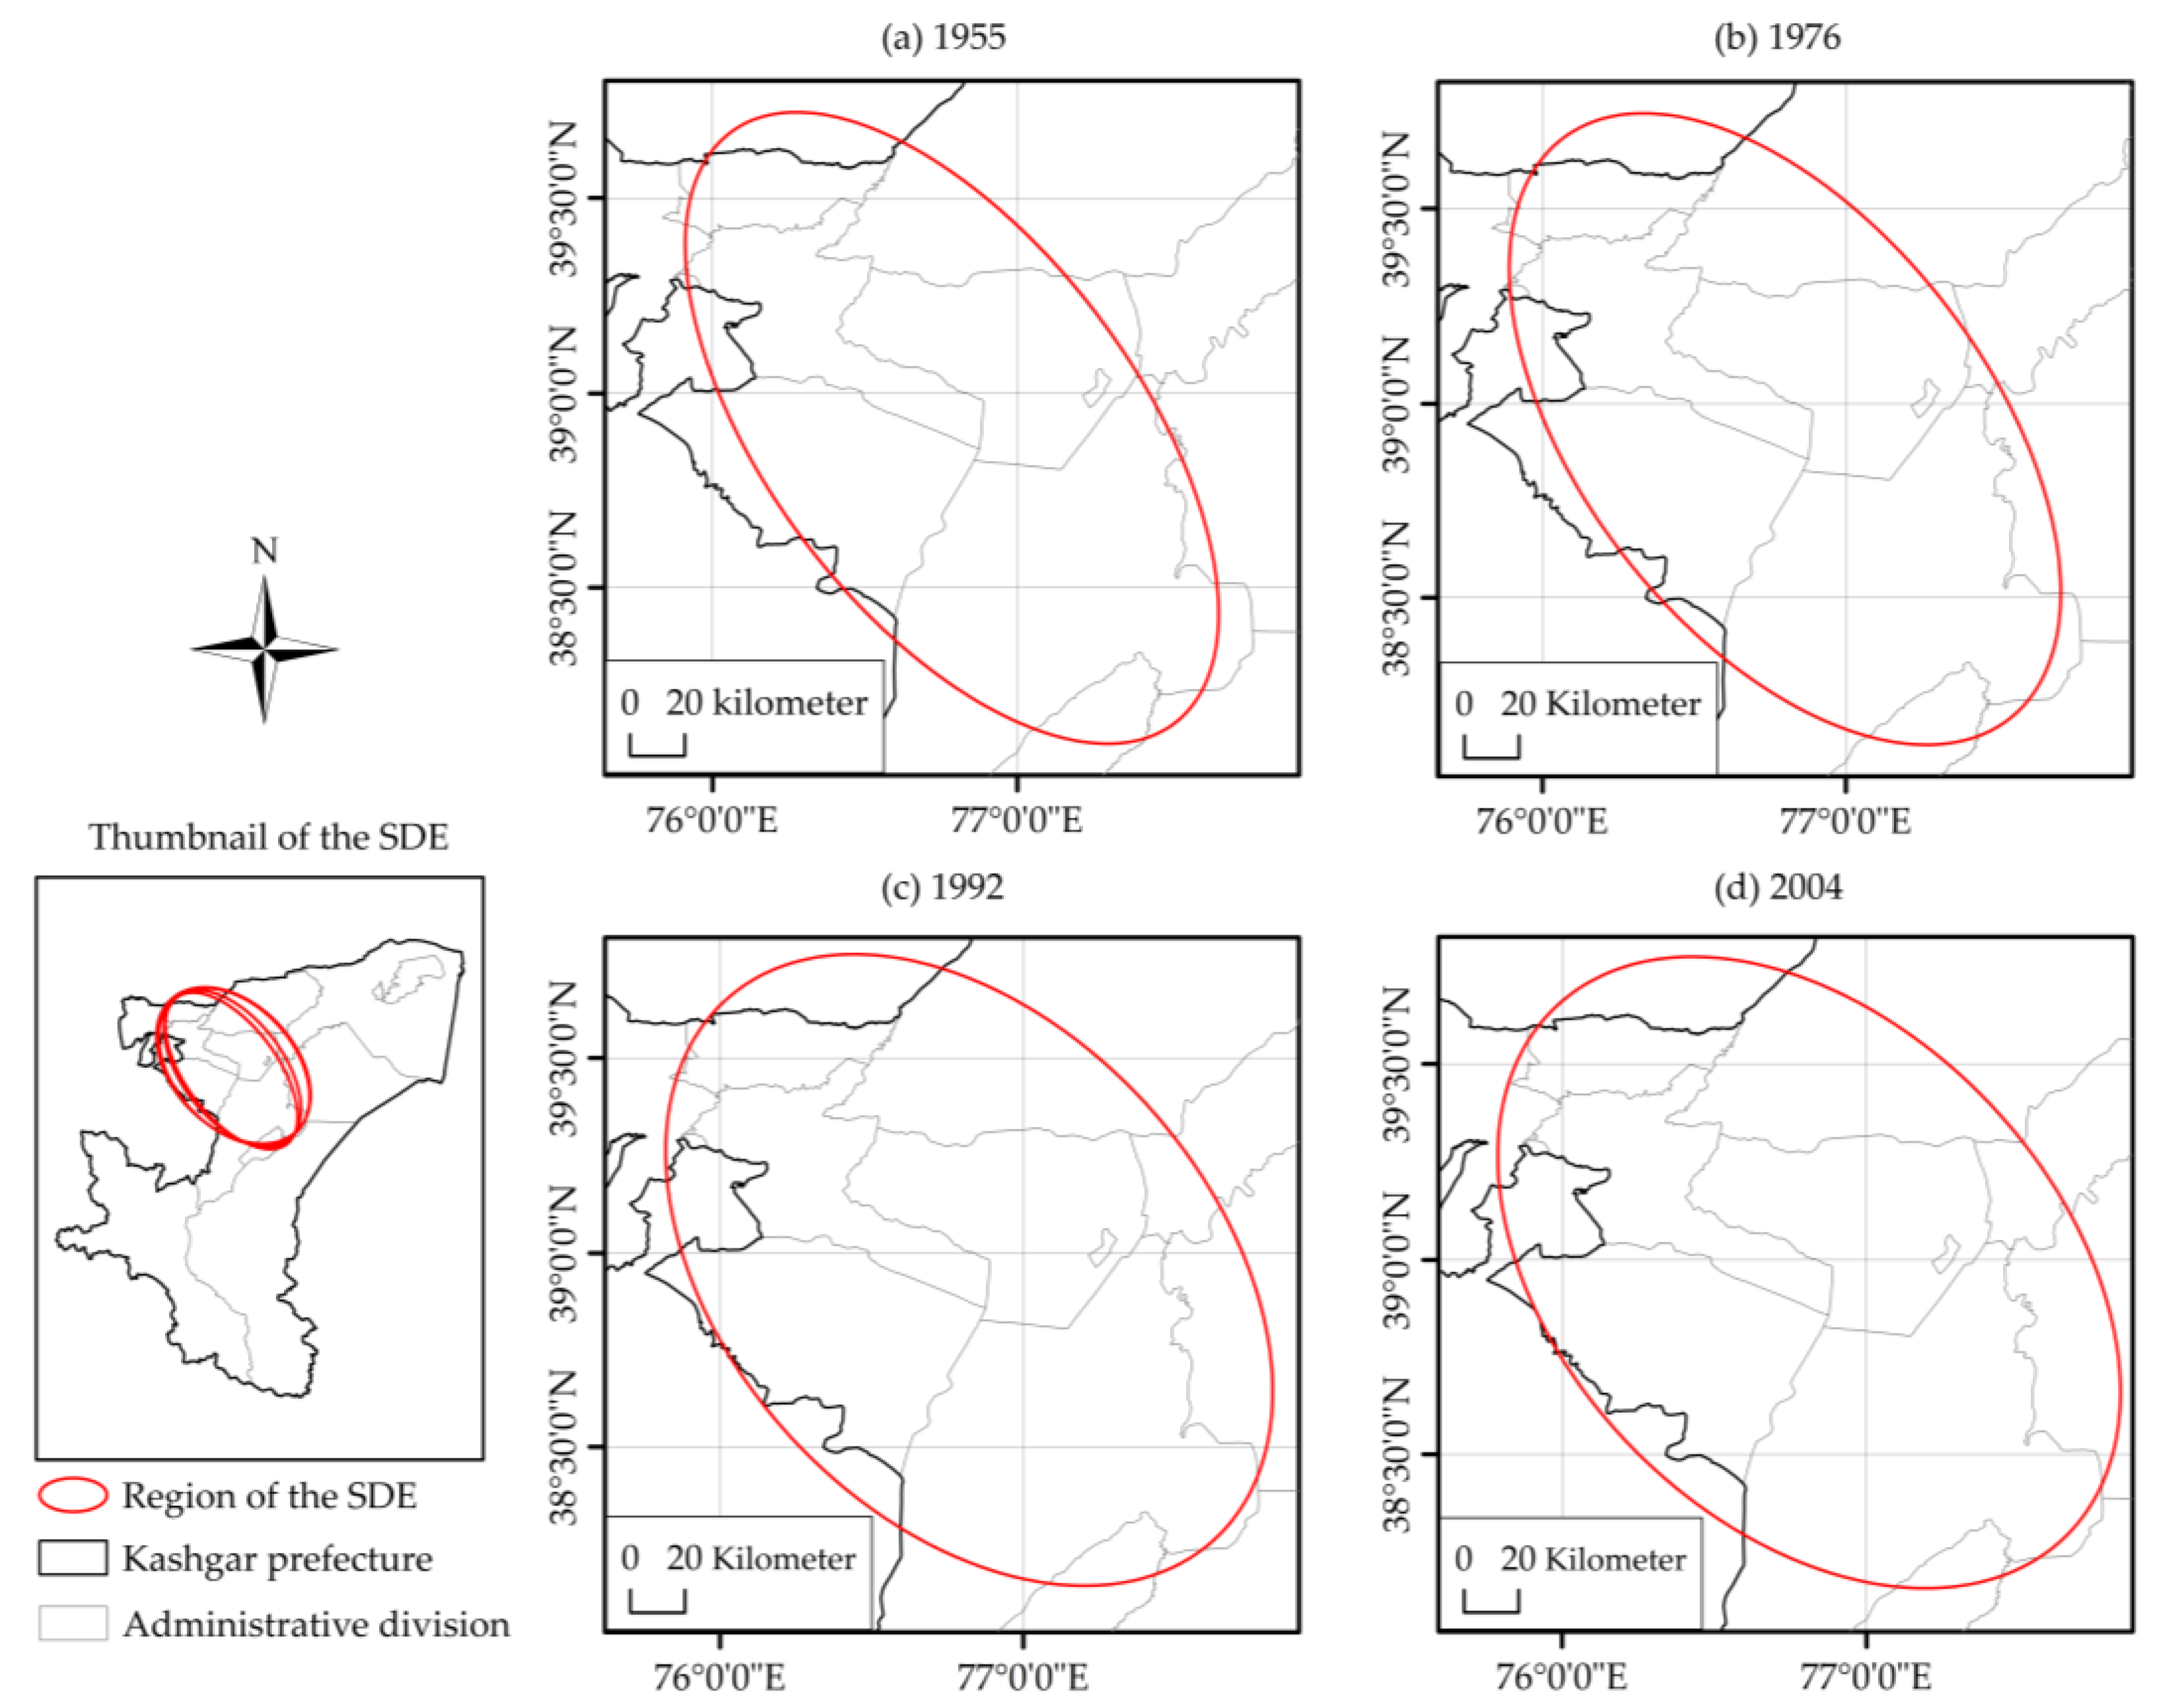
5.2.3. Spatial Expansion of the Mosque
5.3. Causes of the Evolution of the Spatial Distribution of Mosques in the Kashgar Region
6. Conclusions and Discussion
Author Contributions
Funding
Institutional Review Board Statement
Informed Consent Statement
Data Availability Statement
Acknowledgments
Conflicts of Interest
References
- Bao, Shuming, Changzhen Wang, and Miao Shui. 2014. Spatial Study of Religion with Spatial Religion Explorer. Paper presented at 22nd International Conference on Geoinformatics, Kaohsiung, Taiwan, June 25–27; pp. 1–8. [Google Scholar]
- Brace, Catherine, Adrain. R. Bailey, and David. C. Harvey. 2006. Religion, place and space: A framework for investigating historical geographies of religious identities and communities. Progress in Human Geography 30: 28–43. [Google Scholar] [CrossRef]
- Brzozowski, Grzegorz. 2013. Spatiality and the Performance of Belief: The Public Square and Collective Mourning for John Paul II. Journal of Contemporary Religion 28: 241–57. [Google Scholar] [CrossRef]
- Campbell, Michael O’Neal. 2005. Sacred Groves for Forest Conservation in Ghana’s Coastal Savannas: Assessing Ecological and Social Dimensions. Singapore Journal of Tropical Geography 26: 151–69. [Google Scholar] [CrossRef]
- Cao, Jingyi, and Youze Hu. 2006. An Experimental Discussion of Current Ethnic Relations in Xinjiang. Journal of Yili Normal University 1: 50–53. [Google Scholar]
- Dai, Yuanchen. 2019. Research on the Construction of Harmonious Ethnic Relations in Xinjiang Under “the Belt and Road” Strategy. Paper presented at 4th International Conference on Contemporary Education, Social Sciences and Humanities (ICCESSH 2019), Moscow, Russia, May 17–19; pp. 1814–18. [Google Scholar]
- Dann, Norman. K. 1976. Spatial Diffusion of a Religious Movement. Journal for the Scientific Study of Religion 15: 351–60. [Google Scholar] [CrossRef]
- Gokariksel, Banu. 2009. Beyond the officially sacred: Religion, secularism, and the body in the production of subjectivity. Social and Cultural Geography 10: 657–74. [Google Scholar] [CrossRef]
- Gregory, Ian N. 2003. A Place in History: A Guide to Using GIS in Historical Research. Oxford: Oxbow Books. [Google Scholar]
- He, Husheng, and Wenhui Wang. 2021. On the Socialist System of Religious Governance with Chinese Characteristics. Studies in World Religions 1: 1–15. [Google Scholar]
- Holloway, Julian. 2003. Make-believe: Spiritual practice, embodiment, and sacred space. Environment and Planning A 35: 1961–1974. [Google Scholar] [CrossRef]
- Jani, Haza Hanurhaza Md, Nor Zalina Harun, Mazlina Mansor, and Ismawi Zen. 2015. Exploring the Islamic Garden Concept as Inspirational Landscape Design. Procedia—Social and Behavioral Sciences 170: 359–68. [Google Scholar] [CrossRef]
- Jiang, Jingyun. 2019. Spatial Distribution Pattern of Religious Buildings in Fujian Province Based on POI Data Driving Force Study. Master’s thesis, Fujian Normal University, Fuzhou, China. [Google Scholar]
- Jordan, Teryy G., and Mona Domosh. 1999. The Human Mosaic: A Thematic Introduction to Cultural Geography, 8th ed. New York: Addison Wesley Longman, pp. 215–59. [Google Scholar]
- Khosravi, Hassan. 2019. Human Rights Challenges of Chinese State’s Interactions with Xinjiang Muslims. Jornal of Eslamic Human Rights 8: 33–60. [Google Scholar]
- Kong, Lily. 2001. Mapping ‘New’ Geographies of Religion: Politics and Poetics in Modernity. Progress in Human Geography 25: 211–33. [Google Scholar] [CrossRef]
- Kong, Lily. 2002. In Search of Permanent Homes: Singapore’s House Churches and the Politics of Space. Urban Studies 39: 1573–86. [Google Scholar] [CrossRef]
- Kong, Lily. 2005. Religious Schools: For Spirit, (f)or Nation. Environment and Planning D: Society and Space 23: 615–31. [Google Scholar] [CrossRef]
- Li, Xiaoxia. 2014. Analysis of the change in the number of mosques and management policies in Xinjiang. Sociology of Ethnicity 164: 38–46. [Google Scholar]
- Liu, Jeffrey, and Ziling Wan. 2022. The Making of a Sacred Landscape: Visualizing Hangzhou Buddhist Culture via Geoparsing a Local Gazetteer the Xianchun Lin’ an zhi 咸淳臨安志. Religions 13: 711. [Google Scholar] [CrossRef]
- Liu, Yuqing, and Yuanlin Wang. 2022. Spatiotemporal Reconstruction of Water Deities Beliefs in the Pearl River Delta Applying Historical GIS. Religions 13: 1040. [Google Scholar] [CrossRef]
- Lloyd, Christopher. D. 2012. Analysing the Spatial Scale of Population Concentrations by Religion in Northern Ireland Using Global and Local Variograms. International Journal of Geographical Information Science 26: 57–73. [Google Scholar] [CrossRef]
- Lu, Jianfu. 2022. On Several Issues in the Study of Marxist Religion. Science and Atheism 5: 11–18. [Google Scholar]
- Ma, Bei. 2012. A research Study on Spatial Distribution within a Mosque, with Linxia Mosque as an Illustration. Master’s thesis, Northwest Minzu University, Lanzhou, China. [Google Scholar]
- Pa, Linda. 2006. Islam in the Kashgar region of Xinjiang. China Muslim 2: 33–34. [Google Scholar]
- Peach, Ceri. 1999. Social geography. Progress in Human Geography 23: 282–88. [Google Scholar] [CrossRef]
- Preston, Laurence W. 2002. Shrines and Neighbourhood in Early Nineteenth-Century Pune, India. Journal of Historical Geography 28: 203–15. [Google Scholar] [CrossRef]
- Song, Li, Yexi Zhong, Xinghua Feng, and Jie Huang. 2016. Research on spatial-temporal pattern and evolution model of religious sites in Jiangxi province. World Regional Studies 25: 166–76. [Google Scholar]
- Sopher, David E. 1981. Geography and Religions. Progress in Human Geography 5: 510–24. [Google Scholar] [CrossRef]
- Stump, Roger W. 1986. The geography of religion: Introduction. Journal of Cultural Geography 7: 1–3. [Google Scholar] [CrossRef]
- Sunier, Thijl. 2013. Space-making and religious transformation: Mosque building in the Netherlands. Canadian Journal of Netherlandic Studies 34: 59–82. [Google Scholar]
- Valins, Oliver. 2003. Defending identities or segregating communities: Faith-based schooling and the UK Jewish community. Geoforum 34: 235–47. [Google Scholar] [CrossRef]
- Xie, Yongping, and Wuzheng Du. 2013. Investigation and Analysis of the Current Economic and Social Situation of Rural Areas in South Xinjiang—A Study of Rural Areas in Shache County, Kashgar City. Theory Research 34: 93–96. [Google Scholar]
- Xue, Dongqian, Ning Shi, Zhiyong Duan, Jing Guo, and Ling Li. 2013. The channel of cultural exchange, spread and diffusion: A case study of the Silk Road in China. Journal of Northwest University (Natural Science Edition) 43: 781–86. [Google Scholar]
- Xue, Ximing, Hong Zhu, and Xueqiong Tang. 2009. Spatial Distribution and Evolution of Urban Religious Landscape: A Case Study of Protestant Churches in Guangzhou after 1842. Human Geography 1: 48–52. [Google Scholar]
- Yu, Dan Smyer. 2011. The Spread of Tibetan Buddhism in China: Charisma, Money, Enlightenment. London: Routledge. [Google Scholar]
- Zhang, Zhigang. 2021. On Innovative Religious Governance System with Chinese Characteristics. China Religion 7: 8–9. [Google Scholar]
- Zhong, Yexi, and Shuming Bao. 2014. Space-Time Analysis of Religious Landscape in China. Tropical Geography 34: 591–98. [Google Scholar]
- Zhou, Yong. 2022. Locality from Hybridization to Integration: Cultural Politics and Space Production of Taiwan Mazu Temples in Mainland China. Religions 13: 836. [Google Scholar] [CrossRef]
- Zhu, Litao, Huimin Su, Ping Zhang, and Zhengwei Li. 2019. Spatial and temporal evolution of Tibetan Buddhist temples in Qinghai Province. World Regional Studies 28: 209–16. [Google Scholar]
- Zilolakhon, Olimova, and Akhrorbek Akhmadjonov. 2022. System of governance of the karakhanid state and its essence. Asian Journal of Research in Social Sciences and Humanities 12: 106–8. [Google Scholar] [CrossRef]

| 1955 | 1976 | 1992 | 2004 | |||||
|---|---|---|---|---|---|---|---|---|
| Number of Mosques | Growth Rate | Number of Mosques | Growth Rate | Number of Mosques | Growth Rate | Number of Mosques | Growth Rate | |
| Maralbexi | 120 | - | 229 | 90.83% | 668 | 191.70% | 784 | 17.37% |
| Payzawat | 857 | - | 1024 | 19.49% | 1164 | 13.67% | 1168 | 0.34% |
| Kashgar | 385 | - | 438 | 13.77% | 590 | 34.70% | 623 | 5.59% |
| Makit | 171 | - | 212 | 23.98% | 435 | 105.19% | 455 | 4.60% |
| Yarkant | 1459 | - | 1580 | 8.29% | 1840 | 16.46% | 1868 | 1.52% |
| Konaxahar | 634 | - | 751 | 18.45% | 1194 | 58.99% | 1454 | 21.78% |
| Yengixahar | 617 | - | 668 | 8.27% | 912 | 36.53% | 942 | 3.29% |
| Tashikurgan | 9 | - | 10 | 11.11% | 20 | 100.00% | 20 | 0.00% |
| Tumxuk | 2 | - | 2 | 0.00% | 4 | 100.00% | 8 | 100.00% |
| Kargilik | 509 | - | 561 | 10.22% | 899 | 60.25% | 968 | 7.68% |
| Yengisar | 316 | - | 337 | 6.65% | 655 | 94.36% | 684 | 4.43% |
| Yopurga | 365 | - | 384 | 5.21% | 485 | 26.30% | 499 | 2.89% |
| Poskam | 359 | - | 369 | 2.79% | 399 | 8.13% | 403 | 1.00% |
| 1955 | 1976 | 1992 | 2004 | |
| 5803 | 6565 | 9265 | 9876 | |
| - | 13.13% | 41.13% | 6.59% | |
| 379.1082 | 415.203 | 481.2163 | 509.8243 | |
| 0.849286 | 0.822184 | 0.675209 | 0.671093 | |
| 1 | 0.257986 *** | 0.266054 *** | 0.280559 *** | 0.290587 *** |
| 4.029865 | 4.102548 | 4.118258 | 4.251173 |
| Rank | 1955 | 1976 | 1992 | 2004 |
| 50–100 | Payzawat (10) | Payzawat (10) | Payzawat (10) | Payzawat (10) |
| Yengixahar (6) | Yengixahar (5) | Yopurga (5) | Yopurga (5) | |
| Yopurga (5) | Yopurga (5) | Makit (5) | Makit (5) | |
| Maralbexi (2) | Maralbexi (2) | Maralbexi (4) | Maralbexi (5) | |
| Makit (1) | Makit (1) | Yengixahar (4) | Yengixahar (4) | |
| Kargilik (2) | Kargilik (3) | |||
| 100–200 | Kashgar (1) | Yengixahar (1) | Yengixahar (2) | Yengixahar (2) |
| Yengisar (1) | Yengisar (1) | Poskam (1) | Poskam (1) | |
| Poskam (1) | Poskam (1) | Maralbexi (1) | Maralbexi (1) | |
| 200–500 | Konaxahar (1) | Konaxahar (1) | Kargilik (1) | Kargilik (1) |
| Kargilik (1) | Kargilik (1) | Kashgar (1) | Kashgar (1) | |
| Kashgar (1) | Yengisar (1) | Yengisar (1) | ||
| 500– | Yarkant (1) | Yarkant (1) | Yarkant (1) | Yarkant (1) |
| Konaxahar (1) | Konaxahar (1) |
| 1955 | 1976 | 1992 | 2004 | |
| Coordinates of center | 76.785689 E | 76.799293 E | 76.821778 E | 76.811586 E |
| 38.906773 N | 38.930410 N | 38.951602 N | 38.962799 N | |
| x lengths: (km) | 270.683 | 268.539 | 272.384 | 268.920 |
| y lengths: (km) | 135.632 | 149.123 | 179.592 | 181.376 |
| Area (km²) | 28815.107 | 31,581.231 | 37,500.608 | 38,287.301 |
| Azimuth: | 131.165 | 128.816 | 120.532 | 118.842 |
Disclaimer/Publisher’s Note: The statements, opinions and data contained in all publications are solely those of the individual author(s) and contributor(s) and not of MDPI and/or the editor(s). MDPI and/or the editor(s) disclaim responsibility for any injury to people or property resulting from any ideas, methods, instructions or products referred to in the content. |
© 2023 by the authors. Licensee MDPI, Basel, Switzerland. This article is an open access article distributed under the terms and conditions of the Creative Commons Attribution (CC BY) license (https://creativecommons.org/licenses/by/4.0/).
Share and Cite
Wu, S.; Zhong, Y.; Bao, S.; Wang, W.; Nie, T. The Evolution of the Spatial Distribution Pattern of Mosques in the Kashgar Region from 1955 to 2004. Religions 2023, 14, 216. https://doi.org/10.3390/rel14020216
Wu S, Zhong Y, Bao S, Wang W, Nie T. The Evolution of the Spatial Distribution Pattern of Mosques in the Kashgar Region from 1955 to 2004. Religions. 2023; 14(2):216. https://doi.org/10.3390/rel14020216
Chicago/Turabian StyleWu, Shangguang, Yexi Zhong, Shuming Bao, Wenhui Wang, and Tanyue Nie. 2023. "The Evolution of the Spatial Distribution Pattern of Mosques in the Kashgar Region from 1955 to 2004" Religions 14, no. 2: 216. https://doi.org/10.3390/rel14020216
APA StyleWu, S., Zhong, Y., Bao, S., Wang, W., & Nie, T. (2023). The Evolution of the Spatial Distribution Pattern of Mosques in the Kashgar Region from 1955 to 2004. Religions, 14(2), 216. https://doi.org/10.3390/rel14020216