1. Introduction
Throughout the development of modern worldwide transportation, inland river transportation, as a supplement to maritime transportation, has accelerated both the economic and social development. As economies prosper further and the throughput of inland river ports continues to grow, inland river shipping is one of the chief means of comprehensive transport networks [
1]. Containers discharged from ocean vessels are piled on hub ports to inland ports by transshipment. To make transshipment operations less costly, a well-organized transportation network need to be designed [
2]. Therefore, feeders are the most important facilities of transportation in inland waterways. Traditional barges are usually not self-propelled and need to be towed or pushed by tugs. Often, barges are replaced by self-navigated feeders to meet speed, capacity, and safety requirements. These feeders are often used to transport bulk cargo [
3] such as sand, iron ore [
4], and containers [
5,
6,
7].
This research focused on container transportation by feeders between a hub port and an out port with direct shipping (single stage schemes) [
8]. Compared with land transportation using trucks and rail, inland feeder transportation has many advantages. For example, first, feeder transportation largely alleviates traffic congestion problems caused by land transportation and breaks land transportation bottlenecks caused by the limited number of trucks and trains. Second, feeders have a lower operating cost compared to trucks and trains [
9]. The longer the distance traveled, the more economical it becomes. For example, according to China’s inland port policy [
10], the berthing cost is RMB 0.5–1 per net ton, based on the net tonnage of the vessel. The terminal handling fee is RMB 526 for a 20-foot and RMB 804 for a 40-foot. For freight, using the example of moving cargo from Nanjing to Shanghai Yangshan terminals, the shipper pays RMB 1500 for a 20-foot by feeder, while paying approximately RMB 4500 for a 20-foot using trucking, which is triple the cost of the feeder freight. Third, water transportation reduces fuel consumption per unit, and aligns with national appeals for “land to water” and “bulk to container” approaches consistent with green shipping. Therefore, container feeder transportation meets the current needs of inland shipping and supports sustainability goals.
In Europe, the Rhine River is one of the most important waterways for inland container transportation. Rotterdam Port in the Netherlands is located at the confluence of the Rhine River and the Maas River. The long-term goals of the Rotterdam Port Authority [
11] originally described the proposed transportation model as being 41% barges, 42% trucks, and 17% railways by 2020; by 2035, the ultimate target ratios were listed as 45% barges, 35% trucks, and 20% railways. Consequently, the increase in the proportion of barges makes the Rhine River play an increasingly important role. Similar to the contribution of the Rhine River in Europe [
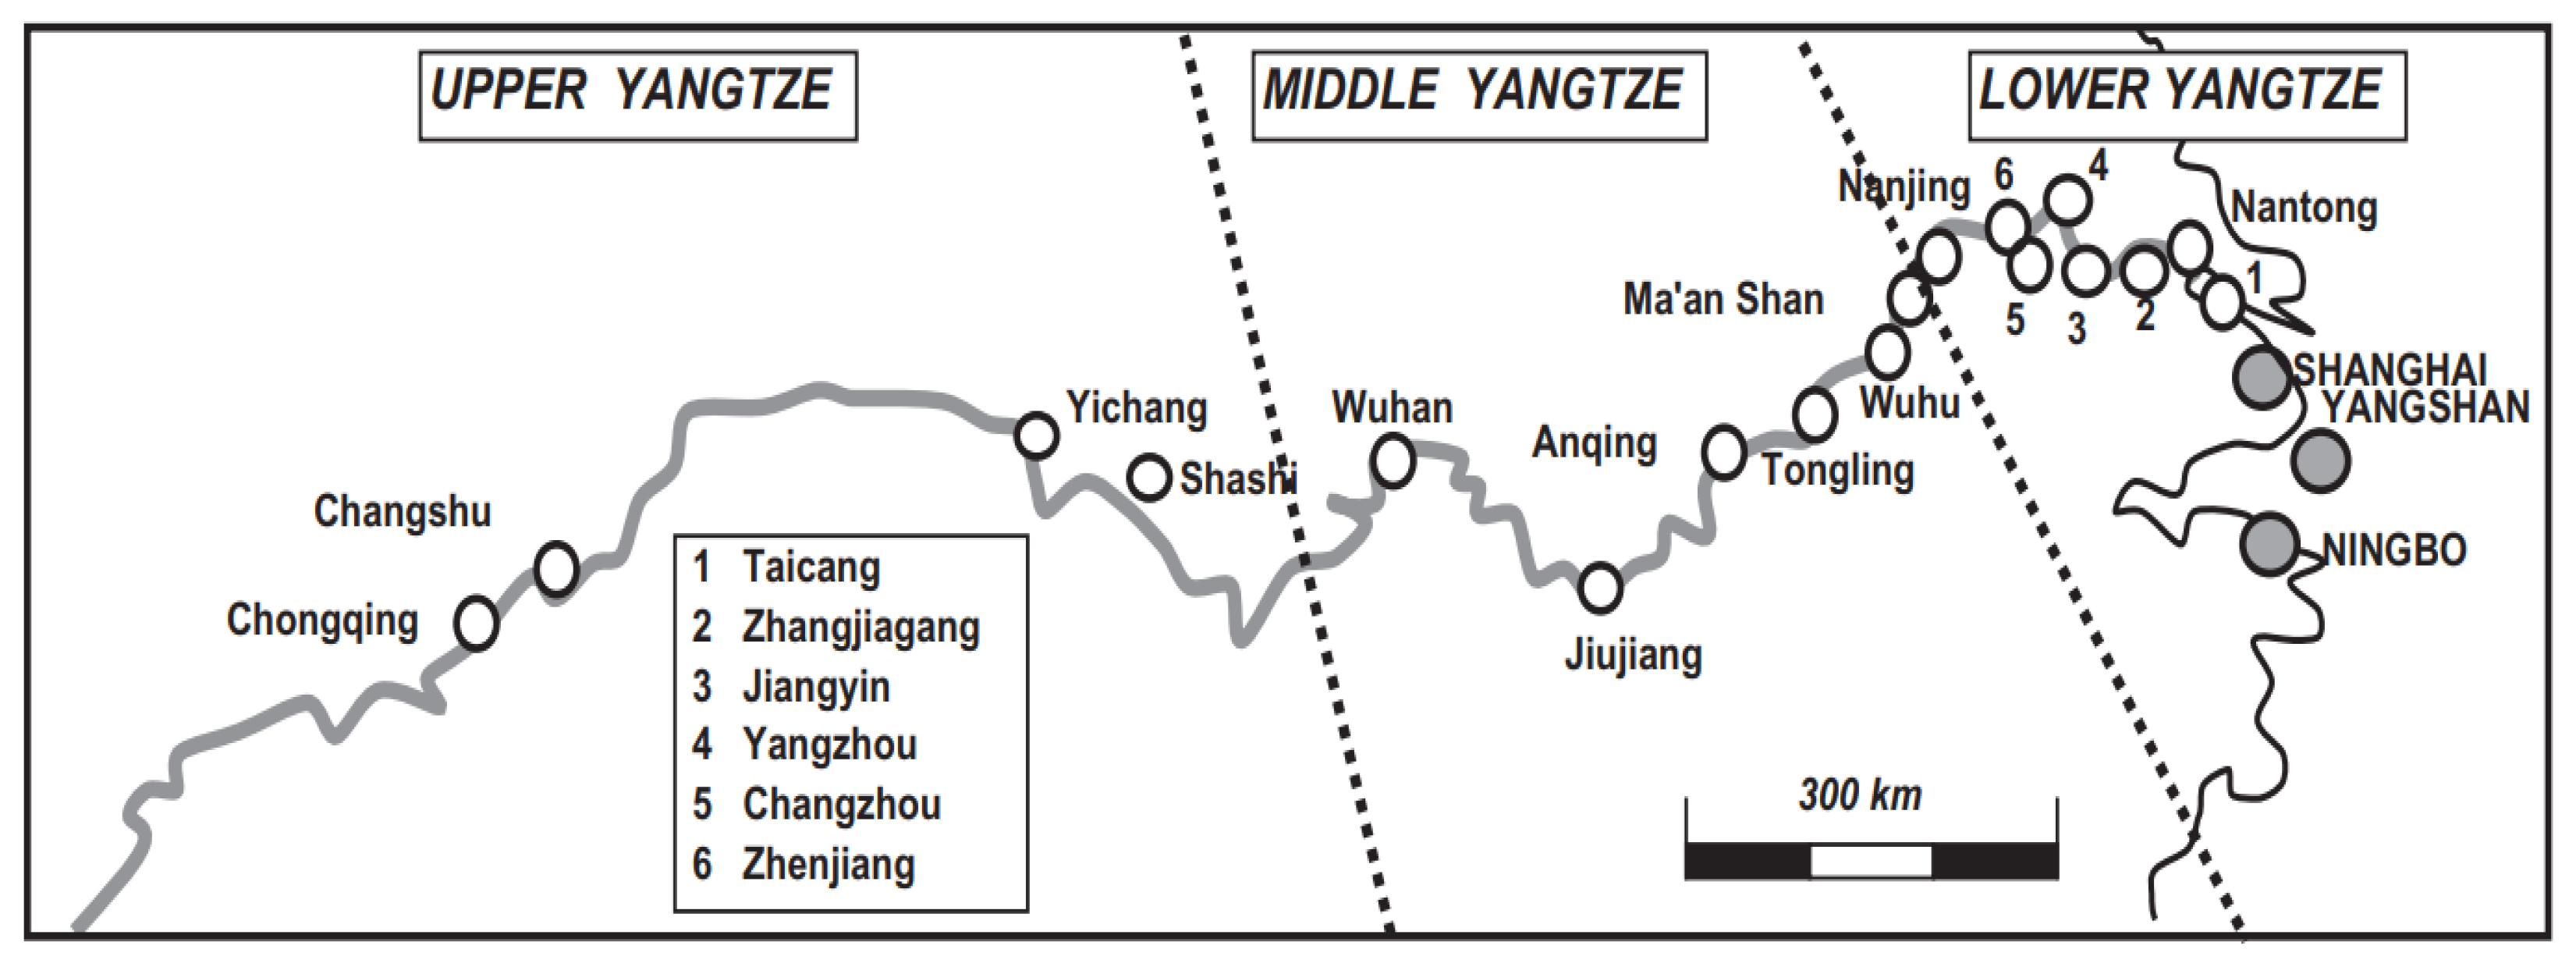
12], the tremendous transportation resources and important position of the Yangtze River are vital in promoting the economy and societal development of the region. This has increased the need to identify ways of upgrading feeder transportation along the Yangtze River. The Yangtze River is 6300 km long. It is China’s largest river and the world’s third largest river, as shown in
Figure 1.
Rapid economic development in the middle and lower reaches of the Yangtze River, and the gradual advancement of national strategies such as the Yangtze River Economic Belt initiative, has led to an increase in the quantity and types of goods transported through the Yangtze River. This had made the Yangtze River Delta the region with the best container performance in China. For example, the container throughput of Shanghai Port exceeded 43.5 million twenty-foot equivalent units (TEUs) in 2020 [
13]. In addition, Ningbo Port, another hub port serving the Yangtze River Delta, had 27.82 million TEUs of container throughput in 2020 [
14]. River–sea intermodal transportation has made a great contribution to the increase of containers volume; however, this continuous increase in container transportation volume in Shanghai Port and Ningbo Port has created new challenges for feeder companies with respect to feeder scheduling and container transportation. For example, most feeder companies still use manual experience to solve the problem. The time spent on manual decision-making is difficult to calculate and many possible mistakes are unavoidable. Furthermore, large container ships, such as the fifth-generation and the sixth-generation ultra-Panamax container ships, have greatly improved the region’s leading position in the container transportation market.
However, because of the complexity of the natural channel conditions, large container ships have been unable to access the inland waterways. For example, smaller feeders are normally used in the upper stream, while large ones (more than 1000 TEUs) are used downstream. The draught limitations of the ships and the height of the bridges, as well as the locks on the route, also restrict the operation and capacity of feeders. Therefore, all these factors must be considered for the safety in inland river shipping [
7].
The optimization of feeder organization has a great significance to the whole trunk network system. For instance, a well-organized feeder transportation can save a lot of time and cost, and make full use of the inland water transportation resources, as well as promote cooperation between many feeder companies. Given this background, we analyzed the decisions facing container transportation businesses in feeder companies from Shanghai Port to the Yangtze River ports, based on the characteristics introduced above. Containers discharged from ocean vessels and piled on Shanghai Port are loaded onto different feeders with different inland destinations. To minimize the associated costs, this research analyzed container volumes and departure times for each feeder. A mixed integer nonlinear programming (MINLP) mathematical optimization model for feeder scheduling and container transportation (FSCT) on the Yangtze River was established and a suitable solution method was proposed. The model improves the transportation efficiency and avoids some mistakes. At the same time, the mathematical methods and algorithms can be applied to the traditional feeder industries. More importantly, the proposed model and algorithm was developed for the Yangtze River, but can also be applied for other inland rivers, such as the Yellow River and the Pearl River in China, and the Mississippi River in the United States.
This work makes two key contributions to the field.
Most research on inland shipping has considered the ship’s draught and the bridge height [
7,
15,
16]. However, few studies have considered both characteristics in inland shipping. For example, although Zhang et al. [
7] considered the bridge height and water depth, empty containers reposition was their key concerns. Compared to other inland shipping models, we focused on determining which containers are shipped by certain feeders and when the feeders are assigned to depart from Shanghai Port. We considered the factors above and constructed an MINLP model of the FSCT to minimize the total cost for feeder operators.
We proposed a PSO algorithm to solve the FSCT problem after introducing the auxiliary decision variables to linearize the nonlinear objective function. To improve the solution efficiency of the PSO algorithm, we also introduced a taboo list and aspiration criterion to obtain high quality initial feasible particles. The improved PSO algorithm designed in this paper can be used to solve large-scale problems with acceptable satisfactory solutions. The rationality and practicability of the proposed MINLP model was verified using actual operation data from certain feeder operators.
The rest of this paper is structured as follows:
Section 2 reviews the literature related to this research.
Section 3 constructs the FSCT model of the Yangtze River, which considers the ship’s draught and the bridge height.
Section 4 linearizes the nonlinear objective function by introducing new parameters and variables. We also designed a PSO algorithm to increase solution efficiency and introduced a taboo list and aspiration criterion for the TS algorithm to improve the PSO algorithm.
Section 5 verifies the effectiveness of the model and the efficiency of the algorithms using numerical experiments. Finally,
Section 6 presents relevant conclusions and future research directions.
2. Literature Review
Containers are discharged from ocean vessels and piled on hub ports to inland ports by transshipment. Transshipment is a multi-echelon distribution with cross-docking, and aims to provide a conceptual framework for multi-echelon transport systems with cross-docking [
17]. The purpose of transshipment is to find higher load factor and fewer port calls [
18]. To make transshipment operations less costly, a well-organized transportation network needs to be designed [
2]. The process of containers from ocean hub ports to inland ports is direct shipping [
8], also known as river–sea intermodal transportation. Crainic and Kim [
19] and Slack [
20] argued that intermodal transportation is the transportation of a person or a load from its origin to its destination by a sequence with at least two transportation modes.
Inland river shipping is an important part of the intermodal transportation and port transportation system [
1], and many researchers have explored the topic. Bulk cargo transportation is an important part of inland river shipping [
3,
4]. Yang et al. [
3] analyzed the potential development of the Yangtze River bulk port system. Li et al. [
4] studied the problem of iron ore transportation alongside the Yangtze River, developing a mixed integer programming formulation to yield an optimal shipping schedule for a cluster of steel manufacturing plants. Compared to bulk cargo, there have been many studies on container transportation in hinterland waterways [
5,
6,
7,
21,
22,
23,
24]. They [
5,
6,
7] studied container shipping of the Yangtze River to minimize the total cost: Yang et al. [
5] discussed the optimal method for the container shipping network and the fleet arrangement to satisfy the demand of transporting containers; Zheng and Yang [
6] explored the optimal transshipment ports to meet external demand with the scale economies of container shipping and proposed a mixed integer linear programming model; Zhang et al. [
7] investigated the problem of repositioning empty containers and also developed a mathematical model, but they considered the bridge height and water depth constraints.
Feeders are an important tool for transporting containers and they play a significant role in inland waterways. Therefore, many researchers have studied the topic. This section mainly discusses research related to feeder shipping in inland rivers [
6,
15,
16,
21,
22,
23,
24,
25,
26,
27,
28,
29,
30,
31]. Konings and Rob [
25] discussed the relationship between barge network design, transport market, and the performance of intermodal barge transport on the Rhine River. Konings and Rob [
26] further showed that optimizing sailing schedules and maximizing the efficiency of capacity utilization can improve the performance of container barge transport in a hub-and-spoke service. Notteboom [
21] and Notteboom et al. [
22] compared the container shipping networks in the Yangtze River and the Rhine River: Notteboom [
21] paid close attention to the similarities and dissimilarities of their spatial and functional developments; Notteboom et al. [
22] focused on barge container shipping with a comprehensive and comparative empirical analysis. Fu et al. [
27] proposed strategies for improving the competitiveness of barge operations in Hong Kong.
Research on the feeder scheduling problem is also very common in the academic field [
6,
28,
29,
30,
31]. Zhen et al. [
6] proposed a mixed integer programming (MIP) model to study a tug-scheduling problem along the Yangtze River to optimize the assignment of non-self-propelled barges. Taylor et al. [
28] presented a simulation-based scheduling system designed to assist in barge dispatching and boat assignment problems for inland waterways. Lalla-Ruiz et al. [
29] studied a barge scheduling problem involving the dispatching of incoming and outgoing barges through different waterways, with the goal of minimizing the waiting time facing barges that need to access or leave the port. Edirisinghe and James [
30] studied a variant inventory routing problem and applied it to scheduling barges for oil pickup from off-shore oil-producing platforms with limited holding capacity. Dobrkovic et al. [
31] investigated how to use publicly available AIS data to effectively schedule barges in the logistic domain and validated the results produced by the genetic algorithm with known inland water routes.
While some studies have considered container transportation or feeder scheduling, few have focused on optimizing feeder scheduling for container transportation in inland rivers. Maraš et al. [
23] investigated the optimization of container transport routes of barge ships along an inland waterway, with the goal of maximizing the shipping company’s profit. They presented a mixed integer linear programming (MILP) model and proposed meta-heuristics to address larger instances. Fazi [
24] considered maritime container transportation between a seaport and a dry port using a barge; the study proposed a comprehensive mathematical model to seek the maximum profits from stowed containers and developed a hybrid metaheuristic approach based on a local search. Although [
23,
24] studied the problem of feeder scheduling and container transportation in inland rivers, the factors of draft and bridge were not considered.
A few past studies [
7,
15,
16] have incorporated the draft and bridge factors into the research. To reduce the influence of the inland bridge construction on shipping and logistics distribution, Wang et al. [
15] established an inland river bridge navigation hole distribution optimization model and combined dynamic programming and grey theory, using the Wuhan Zhuankou Bridge as an example. Tan et al. [
16] studied the natural conditions in a waterway segment, including water draught, the width and length of the locks in the location, service charges, and capacity decisions of an inland river port.
Although the above studies [
1,
3,
4,
5,
6,
7,
15,
16,
21,
22,
23,
24,
25,
26,
27,
28,
29,
30,
31] explored feeder scheduling and container transportation, as well as the draft and bridge factors in inland river shipping problem, these factors were not integrated into one problem, and the methods and key points were also different. For example, in order to satisfy the demand of transporting containers, the optimal method for the container shipping network and the fleet arrangement was studied in [
5], but they failed to consider draft and bridge factors. Reference [
7] considered the draft and bridge, but they studied how to transport empty containers. Therefore, we propose a model and algorithms for feeder scheduling and container transportation along the Yangtze River based on the ship’s draft and bridge height. A feeder scheduling scheme, the scheduling time of each feeder, and the container volume of each feeder were obtained, providing a feeder scheduling decision-making reference for the operators that can help minimize the total cost.
4. Solution for the FSCT Model of the Yangtze River
4.1. Linearize the FSCT Model of the Yangtze River
Two continuous variables are multiplied together () in the objective function of [MINLP-1], making the objective function nonlinear. Commercial software packages, such as CPLEX, cannot solve this problem. Therefore, we linearize the objective function using the following steps.
First, we transform the two multiplicative continuous decision variables into a binary variable multiplied by a continuous decision variable by introducing new parameters and decision variables.
| Penalty cost of the container in the delayed delivery time interval at i port. |
| Binary variable that determines the interval of the delayed delivery time. |
The variable equals 1 if the delayed delivery time is in interval when the container is transported by the s type of b feeder at i port; the variable is 0 otherwise.
Therefore, the new constraints are as follows:
Constraints (12) and (13) determine the interval for the delayed delivery time. Therefore, the model [MINLP-1] can be expressed as [MINLP-2]:
This expression is subject to Constraints (2)–(13).
Second, a binary variable multiplied by a continuous variable is linearized by introducing new auxiliary decision variables
, equaling the value of
. Then, the new constraints are as follows:
In summary, the model [MINLP-2] becomes [MILP]:
This expression is subject to Constraints (2)–(13) and Constraints (15)–(16).
Then, the model [MILP] is directly solved using CPLEX.
4.2. PSO Algorithm
The exact solution was obtained by commercial software (such as CPLEX, LINGO), but the software is limited by the size and scale of the data as well as the complexity of the model. In other words, CPLEX finds it difficult to find the optimal solution when the data scale and the model complexity are large. With the call of national policies such as “land to water” and “scattered to centralized”, the volumes of the feeder and container in the Yangtze River are bound to rapidly increase. Therefore, we need to design an appropriate algorithm to accelerate the speed and quality of the solutions. The PSO algorithm is a swarm intelligence algorithm based on iterative processes [
33]. To adjust the velocity of particles with respect to the direction and the size of the swarm, they explored their own experiences and previous experience with other particles. The symbols used in the PSO algorithm are as follows:
| pn | Each particle. |
| N | Swarm size. |
| d | The dimension of search space. |
| Current position of each particle and . |
| Velocity of each particle and . |
| pbest | Current personal best position of each particle,. |
| gbest | Current global best position of the swarm, . |
Using the current velocity and the distance from
pbestnd and
gbestd, the modified velocity and position of each particle is expressed as follows:
In these expressions,
iter is the current iteration;
c1 is the constant weighing factor corresponding to
pbest;
c2 is the constant weighing factor corresponding to
gbest;
r1 and
r2 are random numbers between 0 and 1 [
34]. In this paper, the PSO algorithm is adopted to solve the FSCT problem of the Yangtze River. The next subsection presents the processes.
4.2.1. Coding and Decoding
The coding and decoding method significantly influences the model solution. As such, we designed a real number coding for the key decision variables
in
Figure 3. Selecting the number of containers transported by a certain type of feeder, with 10 destination ports, yields the following coding and decoding method:
For the first port, 150 containers are transported by a certain feeder of a certain type. After learning from a better particle, the optimal container number is determined to be 170.
4.2.2. Generate the Initial Feasible Particles
This method only generates the key decision variable , because the values of the initial particles are only associated with . The variable is related to four constraints: the farthest reach of the inland port due to the ship’s draught limitation (Constraint (6)); the limitation of the feeder capacity (Constraint (4)), the limitation of bridge height along the Yangtze River (Constraint (7)); the number of transported containers of the destination port (Constraint (8)). The steps to generate an initial feasible particle are as follows.
Step 1: According to the port demand and the feeder capacity, randomly generate the values of each position of particles.
Step 2: If a certain position in the particles does not meet the ship’s draught limitation, the value of the position is zero; otherwise, go to Step 3.
Step 3: Separately accumulate the number of containers for each feeder transport with each port. If the number is greater than the feeder capacity, reduce the number at the relevant location until all feeders meet capacity limitations.
Step 4: Accumulate the number of containers of each port when each feeder passes a bridge. If the number exceeds the bridge height limitation, reduce the number of containers at the location until all feeders meet the bridge height limitation.
Step 5: First, accumulate the number of containers transported to each port. If the number exceeds port demand, reduce the number at the location until all containers are delivered to the destination port. Otherwise, increase the number at the location until all containers are delivered to the destination port. The number of containers is increased by randomly selecting a feeder sailing to the port. Second, calculate and compare the number of containers that can be transported by the feeder when the number meets certain conditions, such as the ship’s draught, the feeder capacity, and the bridge height. Then, select the minimum value of the increased number of containers, and the difference between the lowest level of demand. Finally, continue to select the other feeder and repeat the above steps until all containers are delivered to the destination port.
There are two forms of logic when generating feasible particles in the steps above. The “increase” logical step is reflected in Step 5, where there are fewer containers than the demand at the port. The “decrease” logical step evenly reduces the value of for all relevant positions of the containers, where a is the target number, o is the current number, and h is the number of relevant positions of the containers. Then, the process randomly reduces the value of for a specific position and determined whether the value is negative or not. The value returns to zero if the value is negative; otherwise, the steps above are repeated until the requirements are met.
4.2.3. Optimize the Inefficient Transportation of Feeders
Although the logic of generating initial particles in
Section 4.2.2 has a certain amount of randomness, the process increases the difficulty of finding the optimal solution of PSO algorithm, because the logic is easier to apply by evenly distributing containers to each feeder. The PSO algorithm has difficulty learning how to reduce specific particle positions to zero through the current particle, even if a feeder abandons the transportation of containers at a certain port. Therefore, the method leads to many inefficient feeders (
Figure 4) in the initial particle scheme. Based on these challenges, we designed a way to eliminate the effect of inefficient feeder transportation and obtain the optimal initial feasible particles. The steps needed to optimize inefficient feeder transportation are as follows.
Step 1: Establish an inefficient (load to capacity) ratio ɛ. For example, ɛ is 0.9 when the loading volume of containers in the feeder is less than 90 percent of the feeder capacity.
Step 2: Identify the best feeder from the leftover feeders to transport the containers from the location of a particle representing inefficient transportation. In other words, select the number of loaded containers in the best feeder when shipped to the same destination port that is larger than the rest of the feeders.
Step 3: Search the location where the number of containers from the remaining feeders (have the same destination port) represents an inefficient position. Then, record and update the optimal location. After the search, identify the recorded optimal position of the “buyer” and combine the inefficient capacity of the previous position with the “buyer” until there are no positions identified as representing inefficient transportation.
4.3. Improved PSO Algorithm
It is generally easy for a PSO algorithm to reach a locally optimal solution, which can lead to the problem of premature convergence. The inertia weight has a great impact when searching for either a local or global optimal solution in the PSO algorithm. We used the method of the linear time-declining inertia weight to set the algorithm as having a first preference for a global optimal solution. Then, the algorithm is gradually allowed to search for a locally optimal solution.
However, even if the initial feasible particles are outstanding in a PSO algorithm, it is easy for similar solutions to emerge. For example, the total transportation cost is identical when the same total number of containers is transported to the same port using the same type of feeder. These transportation schemes are not identical; however, the effect is essentially the same. Therefore, to mitigate this disadvantage, we introduce a taboo list and aspiration criterion in a Taboo Search (TS) algorithm, to reduce the probability of similar solutions within recent generations. To avoid the repetition of some operations and a cyclical result, we place the related elements (taboo object) that lead to repeated operations into the taboo list. The aspiration criterion prevents the objects with the best objective function value and the most influence on the target value from being placed on the taboo list, which would lead to a failure to update the algorithm to the optimal solution. The steps taken to improve the PSO algorithm are as follows.
Step 1: Set the length of the taboo list and the aspiration criterion. To ensure the solution is not similar to other solutions within two generations, the length of the list is twice the number of particles, and the aspiration criterion is set as the current optimal particle.
Step 2: All generated/updated particles are judged after the particles enter the taboo function. If the value of a certain particle is optimal for the current objective function, it is not necessary to compare the taboo objects in the taboo list, and the process exits the taboo function; otherwise, go to Step 3.
Step 3: Set the criterion to judge similar particles, such that it sets the same number of containers transported by different type of feeders and the same number of feeders with the same type of feeders.
Step 4: Determine whether the two particles are similar particles or not. If a new particle is not similar to all particles in the taboo list, insert the new particle at the end of the taboo list and release the top particles from the taboo list; otherwise, change parameters to generate another list of initial feasible particles and evaluate it again, until the two particles are not similar.
The overall improved PSO algorithm procedure is outlined in Algorithm 1.
| Algorithm 1: Improved PSO algorithm procedure. |
| 1: | INPUT: initial vnd, N, pn, d, maximal iteration niter, taboo table length tl, ɛ and gi:
//Initialization |
| 2: | Setiter, current inefficient ratio ɛ0, pbest and gbest; |
| 3: | Generate N particles with d dimensions based on gi:
//Generate the initial particles |
| 4: | DO |
| 5: | iter←0, ɛ = 1; |
| 6: | While iter ≤ niter |
| 7: | Make the particles feasible (4.2.2); |
| 8: | If ɛ0 ≤ ɛ then |
| 9: | Eliminate the inefficient particles; |
| 10: | End if
//Make the particles feasible and eliminate the inefficient particles |
| 11: | Find pbestnd; |
| 12: | If error (pbestnd) >error (pbestnd,iter), iter[0, iter] then |
| 13: | Update pbestnd; |
| 14: | End if |
| 15: | Find gbestd; |
| 16: | If error (pbestnd,iter) >error (gbestd,iter), n[0, N], iter[0, iter] then |
| 17: | Update gbestd←pbestnd,iter; |
| 18: | End if |
| 19: | Update vnd; |
| 20: | Update particles position:
//Update pbestnd, gbestd, the speed and the position of particles |
| 21: | Make the particles feasible and eliminate the inefficient particles; |
| 22: | Judge the taboo list; |
| 23: | If error (current particle) ≠ error (gbestd) then
//Aspiration criterion for optimal solutions |
| 24: | While current particle is similar to pn in taboo list |
| 25: | Updated particles; |
| 26: | Make the particles feasible and eliminate the inefficient particles; |
| 27: | End while |
| 28: | If current particle is not similar to pn in taboo list then |
| 29: | Updated taboo list; |
| 30: | End if
//Taboo list for similarity solutions |
| 31: | End if |
| 32: | End while |
| 33: | OUTPUT:Gbest |
5. Numerical Experiments
To assess the performance of the model and the algorithms proposed in this research, the mathematical programming software CPLEX (12.8) was used to compare solutions solved using different algorithms at the same scale. These numerical experiments were completed using a personal computer with Intel Core i7-6567 CPU (3.30 GHz), with 4.00 GB of RAM.
The same parameters for numerical experiments were used for each method and scale to facilitate a comparison of the solutions’ efficiency and quality of CPLEX, the PSO algorithm, and the improved PSO algorithm. There are 1 base port (Shanghai Port) and 22 main destination ports (Taicang, Nantong, Zhangjiagang, Jiangyin, Gaogang, Zhenjiang, Nanjing, MaanShan, Yuxikou, Wuhu, Tongling, Chizhou, Anqing, Hukou, Jiujiang, Wuxue, Huangshi, Wuhan, Honghu, Shashi, Zhicheng, Yichang) in our numerical experiments. The partial parameters were based on operating data from a certain forwarding company operating in the feeder transportation business. These data included the berthing cost of feeders, the handling cost of containers, the penalty costs of delivery delays, and the travel time cost of the feeder. All parameter settings are listed in Appendix (
Table A1,
Table A2, and
Table A3).
To test the effectiveness and efficiency of the proposed solution method, we conducted extensive experiments to compare the solution results of the PSO algorithm and the improved PSO algorithm. It is important to note that the number of feeders that travel from Shanghai Port (Yangshan terminals and Waigaoqiao terminals) to inland port per day/year is about 80–110/35,000 [
13]. In practice, compared to the large scale, the number of destination ports and feeders is relatively small because many forwarding companies do not cooperate, and a certain forwarding company is our optimized subject. Therefore, the number of destination ports and feeders in numerical experiments is optimized. The results were directly solved using the CPLEX solver. The experimental results are provided in
Table 1.
The results in
Table 1 show that the capacity of CPLEX is limited when handling large-scale problems. For example, in instance 10, CPLEX cannot find the optimal solution. In comparison, the improved PSO algorithm solves the problems for all instances within a reasonable computational time. However, the CPLEX can quickly identify the optimal solutions in small-scale and medium-scale instances, with levels of precision and speed that are better than the improved PSO algorithm.
In the PSO algorithm, we randomly generate the initial particles in two ways, affecting the feasibility of the particles and the degree of inefficient transportation. As shown in
Table 2, the two logical paths for generating the initial feasible particles have nearby running times and have only a small influence on the optimal solutions. However, the results generated using PSO-I exceed those of PSO-B. The logic of PSO-B provides more randomness for the next feasible particle process, and the logic of PSO-I causes the value of the location of some particles to be consistently lower than other positions. The value is easily reduced to zero when addressing the subsequent inefficient transportation.
As shown in
Table 1 and
Figure 5, the quality of the optimal solutions and the running time of the improved PSO algorithm are better than the PSO-I algorithm. This is because the improved PSO algorithm has a stronger ability to generate an optimized solution under the same number of iterations for any scales. Due to the condition of similar particles, this also requires more time. Therefore, the problem of inland river container transportation on a large scale can be solved by the improved PSO algorithm with acceptable accuracy.
In reality, on one hand, most forwarding companies still use manual experience to solve the problems of feeder scheduling and container transportation. On the other hand, our model simplifies some complicating factors. Therefore, the results are only simply compared with reality. For example, the calculable total cost of transporting 6300 TEUs from Shanghai Port to Nanjing Port on time by 10 feeders with manual experience is about RMB 2.8 million (the cost comes from a certain forwarding company), while the cost of our model is about RMB 2.43 million. As stated in the above, the costs of two methods have a big gap. More importantly, the time spent on manual decision-making is difficult to calculate. Therefore, the model has better solutions for feeder scheduling and container transportation with the factors of draft and bridge, compared to the manual decision-making.
6. Conclusions
In the context of prosperous inland river shipping, a large number of containers are discharged from ocean vessels and are transported to inland port by feeders via river–sea intermodal transportation. This paper studied the problems associated with feeder scheduling and container transportation from Shanghai Port to inland ports along the Yangtze River. An MINLP model was formulated to address this problem while minimizing the operating cost by considering the ship’s draught and bridge height limitations. After linearizing the model, an improved PSO algorithm with the acceleration techniques was designed to support the proposed model. Although some authors studied feeder scheduling and container transportation, as well as the draft and bridge factors in inland river shipping problems, the factors were not integrated into one problem, and different methods were used. Numerical experiments show that the mathematical model is feasible, with improved algorithms. Moreover, this work provides useful guidance and concepts for the government to build new bridges and feeder operators to support their business and inland river shipping. For example, the factors of draft and bridge are a considerable limitation of river–sea intermodal transport of containers. Rivers with shallow water depth and bridges with low height will make large feeders unseaworthy. Therefore, the government should also consider the impact of bridges on inland river when deciding on new bridges, as well as upgrading the channel level. In addition, the CPLEX results can be directly applied to feeder scheduling and container stowage for the feeder operators. This avoids possible mistakes made during manual decision-making and improves the transportation efficiency.
Although this research considered many factors and characteristics in inland waterway shipping, there remain limitations that create opportunities for future research. For example, future studies could consider the problem of stacking containers that arrive early at the destination port. In addition, the possibility of container transshipment should also be considered, given the different destination ports for containers and the sharing and exchanging of feeder slots by peers. Furthermore, it would be interesting to highlight the best advantages of the computational tool for shipping companies in terms of time and costs, and possibly propose fleet re-adaptations or alternative systems for more efficient market organization. Finally, it would be a benefit to improve the precision of the model algorithm to mitigate the remaining problems with the PSO algorithm. These limitations represent our future research directions. Despite these limitations, this work adds value to the field by formulating an MINLP model to address the FSCT problem faced by the Yangtze River in China. It provides significant guidance for solving practical problems.


