4.1. Evolution of Maximum Winds and Water Levels
In
Figure 2, the contour plots of Cases 2, 1 and 3 show the effect of increasing wind intensity on maximum wind velocity magnitude and maximum water elevation of storm surges that happen at every mesh node over the entire duration of the hurricane. For brevity, the rest of the cases are not shown in this figure, since the wind intensity remains the same for all as that of Case 2. The increase in wind intensity increases the effect of maximum winds, which is observed by the relative distance of contour lines 20 m/s (or 30 m/s) from the hurricane track in
Figure 2a,c, and e. In a previous study [
7], authors found that the storm size was inadvertently increased due to a linear increase of the wind intensity multiplier. This finding holds true in this study as well. The maximum water elevation increases with the wind intensity due to a stronger overland push in the southwest end of the Florida peninsula and in the recess of the Georgia–Carolinas coastline, as a comparative study of
Figure 2b,d, and f shows. Similar findings for Rita hindcast studies were reported by Rego et al. [
6] and Irish et al [
11], who observed that the effect of varying wind intensity on a storm surge is similar in magnitude to that of varying the radius of maximum wind along the coast of Louisiana. As reported in [
14,
15], the east coast experienced a positive surge due to onshore wind perpendicular to the shoreline, whereas the west coast mostly experienced a negative surge (
Figure 2 does not show it) due to offshore winds. The positive surge returned on the west coast after the hurricane eye passed a location and onshore wind pushed the water towards the coast. On the southeast coast of Florida, water was able to slide up north, which minimized the surge height, if any. In the recess of the Georgia–Carolinas coastline there was a funnel effect, which helped water accumulation, leading to a high surge, although the location is a bit away from the storm path.
The wind intensity and its impact on storm surge is further demonstrated by snapshots of wind velocity vectors and velocity magnitude color plots at the landfall times, as shown in
Figure 3 for Cases 2 and 3. Hurricane Irma made a landfall in Florida Keys at 1300UTC on 10 September 2017 near Cudjoe Key, then a final landfall near Marco Island in southwest Florida, at 1930 UTC on 10 September 2017. Asymmetric and anticlockwise rotating wind with stronger right-side patterns are observed at both landfalls in
Figure 3. However, it can be noticed that the wind is stronger during the landfall in Florida Keys (
Figure 3a,b) than in the southwest coast (
Figure 3c,d). It can be clearly seen from a comparison between
Figure 3 column 1 and column 2 that increasing the wind intensity increases the storm size, indicating that wind intensity affects the area over which the storm acts. On the east coast, the wind remained onshore that caused positive surges. On the west coast, initially, the wind was offshore that caused negative surges. However, after the hurricane passed over the location, the wind returned onshore, which lead to positive surges. In the recess of the Georgia–Carolinas coastline, the onshore wind was mostly shore perpendicular, which caused high surges.
To ascertain the actual quantitative effects of individual parameters shown in Cases 2–9 (see
Table 2), the maximum water elevation differences between the reference case (Case 1) and each other case (i.e., Case 1–Case 2, etc.) were computed.
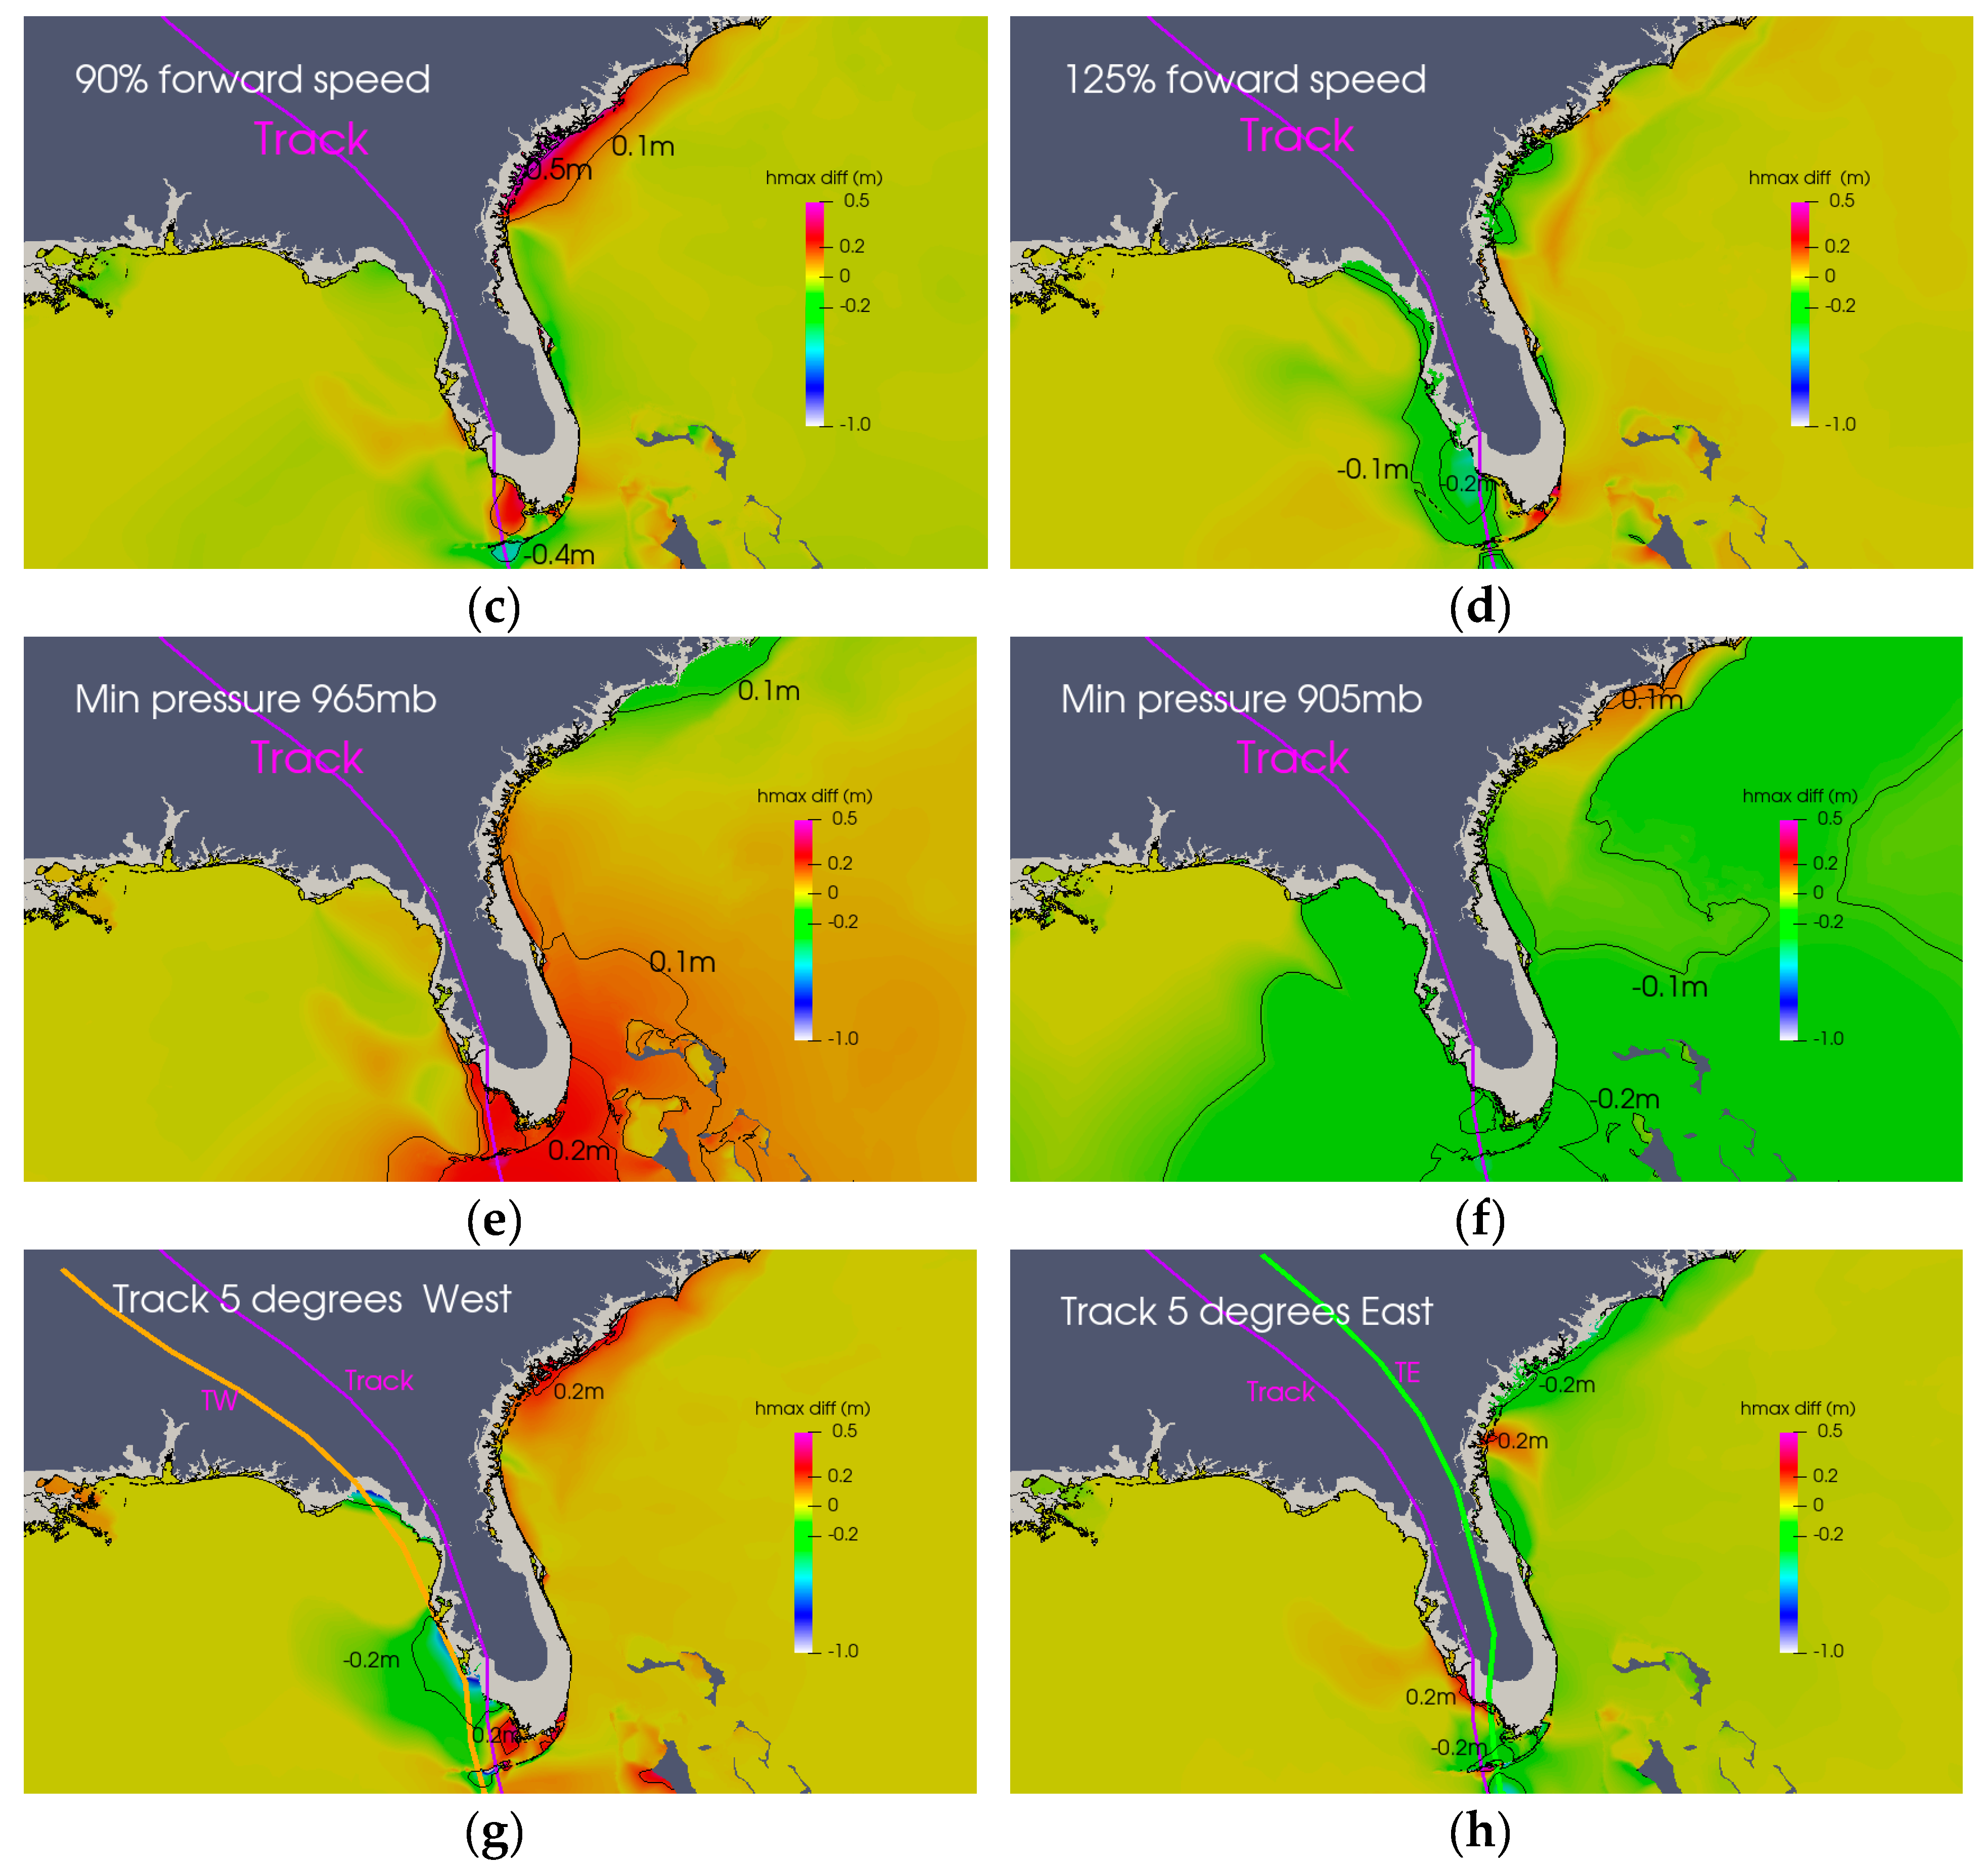
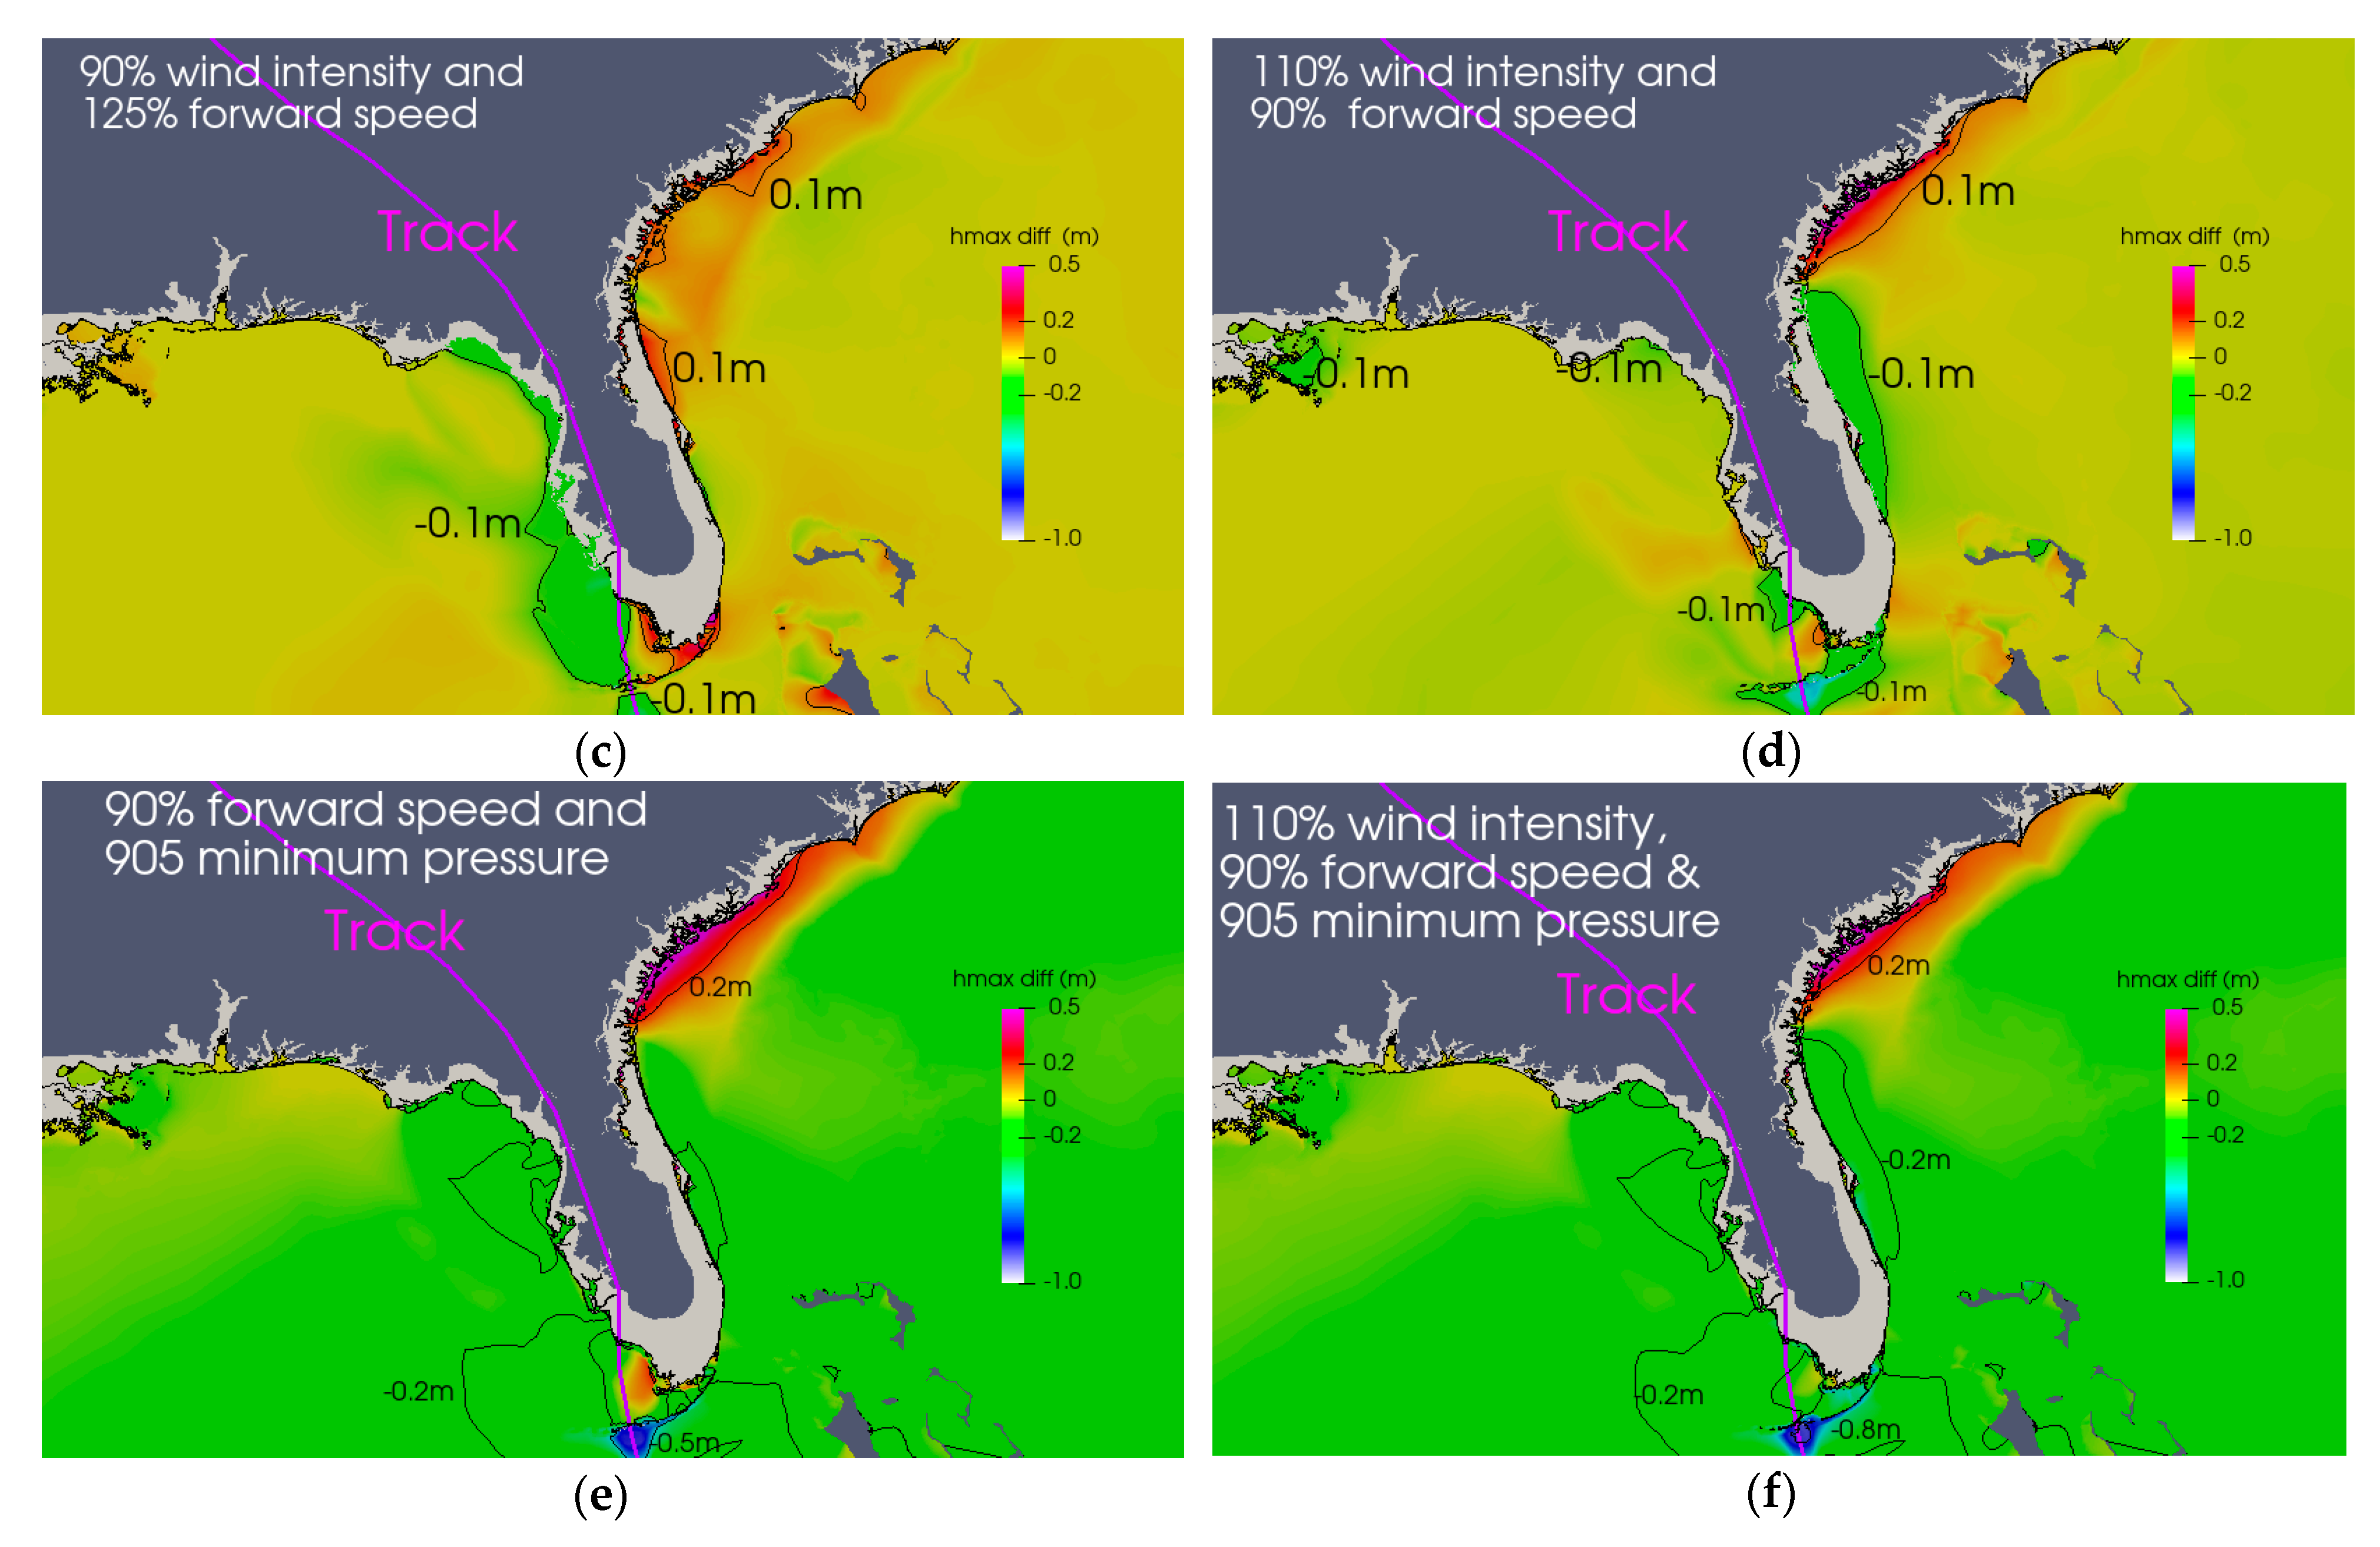
Figure 4a,b indicate the effect of varying wind intensity on Irma peak surges. When the wind intensity is increased by 10%, about 0.2 m increase in peak surges occurred around the landfall areas of Cudjoe Key and the Naples area. This increase in surge is due to stronger onshore winds pushing water overland after the hurricane eye passed over these locations. Observation reports indicated that all of the greater Naples area received hurricane force-sustained winds, with category 2 sustained winds likely affecting much of the southern and eastern portions of Naples. A similar increase in surge is observed in the east Florida coast and on the concave shaped coastline of Georgia–Carolinas. The contrary happens when the wind intensity is decreased by 10%.
A reduction in the hurricane forward speed by 10% increases the peak surges in the south side of Florida Keys by more than 0.4 m, but decreased by the same amount on the north side, as seen in
Figure 4c. This is possibly because high onshore winds take more time to push water against the key islands from the south, thereby increasing the peak surges. The peak levels remain low on the open coast, since the forward speed is slow to push water back onshore. There is a decrease of more than 0.5 m in peak water levels along the Georgia–Carolinas coastline and a decrease in forward speed. The funnel effect subsided as more time was allowed for the water to disperse. On the other hand, when the forward speed is increased (
Figure 4d), there is a 0.2 m increase in flooding in the open coast areas of west and southwestern Florida as the wind has enough momentum to push water against the shoreline. Along the Georgia–Carolinas coastline, the surge is slightly higher as well. A 0.2 m decrease in peak surge occurs in the southeast Florida, at the intersection of Florida Keys and continental Florida.
As shown in
Figure 4e, as the pressure is increased, there is about a 0.2 m reduction in surge levels on the near shore. On the other hand, as
Figure 4f shows, a decrease in pressure results in about a 0.2 m surge increase. Both are due to the inverted barometer effect. The effect is along the track and widely spread in the open ocean, especially along the south coast of Florida. Musinguzi et al. [
7] observed similar findings during Hurricane Rita. In agreement with this theoretical relationship, [
13] found surge levels to rise by 0.8 to 1 m around Puerto Rico and the U.S. Virgin Islands for Hurricanes Irma and Maria, with center pressures of 914 and 910 millibars, respectively. The surge level increasing or decreasing by 0.2 m for a 30 millibar incremental pressure drop or rise in the present study is within 67% of the classical theoretical relationship mentioned above. The results are reasonable, given that the region of the study is a continental shelf with land effects and not a deep ocean.
To examine the influence of the track on peak surges, the original Irma track is shifted 5° westwards and eastwards, starting from the eye location about 48 h before the landfall. As shown in
Figure 4g, h, lines TW and TE represent the original track shifted 5° westwards and eastwards, respectively.
Figure 4g shows that shifting the track 5° westwards increases the peak surge by more than 0.2 m on the west coast of Florida. Shifting the track 5° eastwards increases the peak surge by more than 0.2 m along the Georgia–Carolinas coastlines, as seen in
Figure 4h. From the comparison of vector snapshots displayed in
Figure 5a, b, it is clear that the 5° westward storm pushes wind onshore in the southwest Florida after the hurricane eye passes a location, causing a higher surge there. When the track is shifted 5° eastwards (
Figure 5c), a stronger onshore wind is active on the east coast than west, causing a slightly higher surge on the east coast. Note that the track is on the continental Florida for the most part, which minimizes the surge effects overall. As the storm moved up north, on-shore winds pushed more water to inundate most of the Georgia–Carolinas coastline.
4.2. Water Level Timeseries for Observed and Model Predictions
As shown in
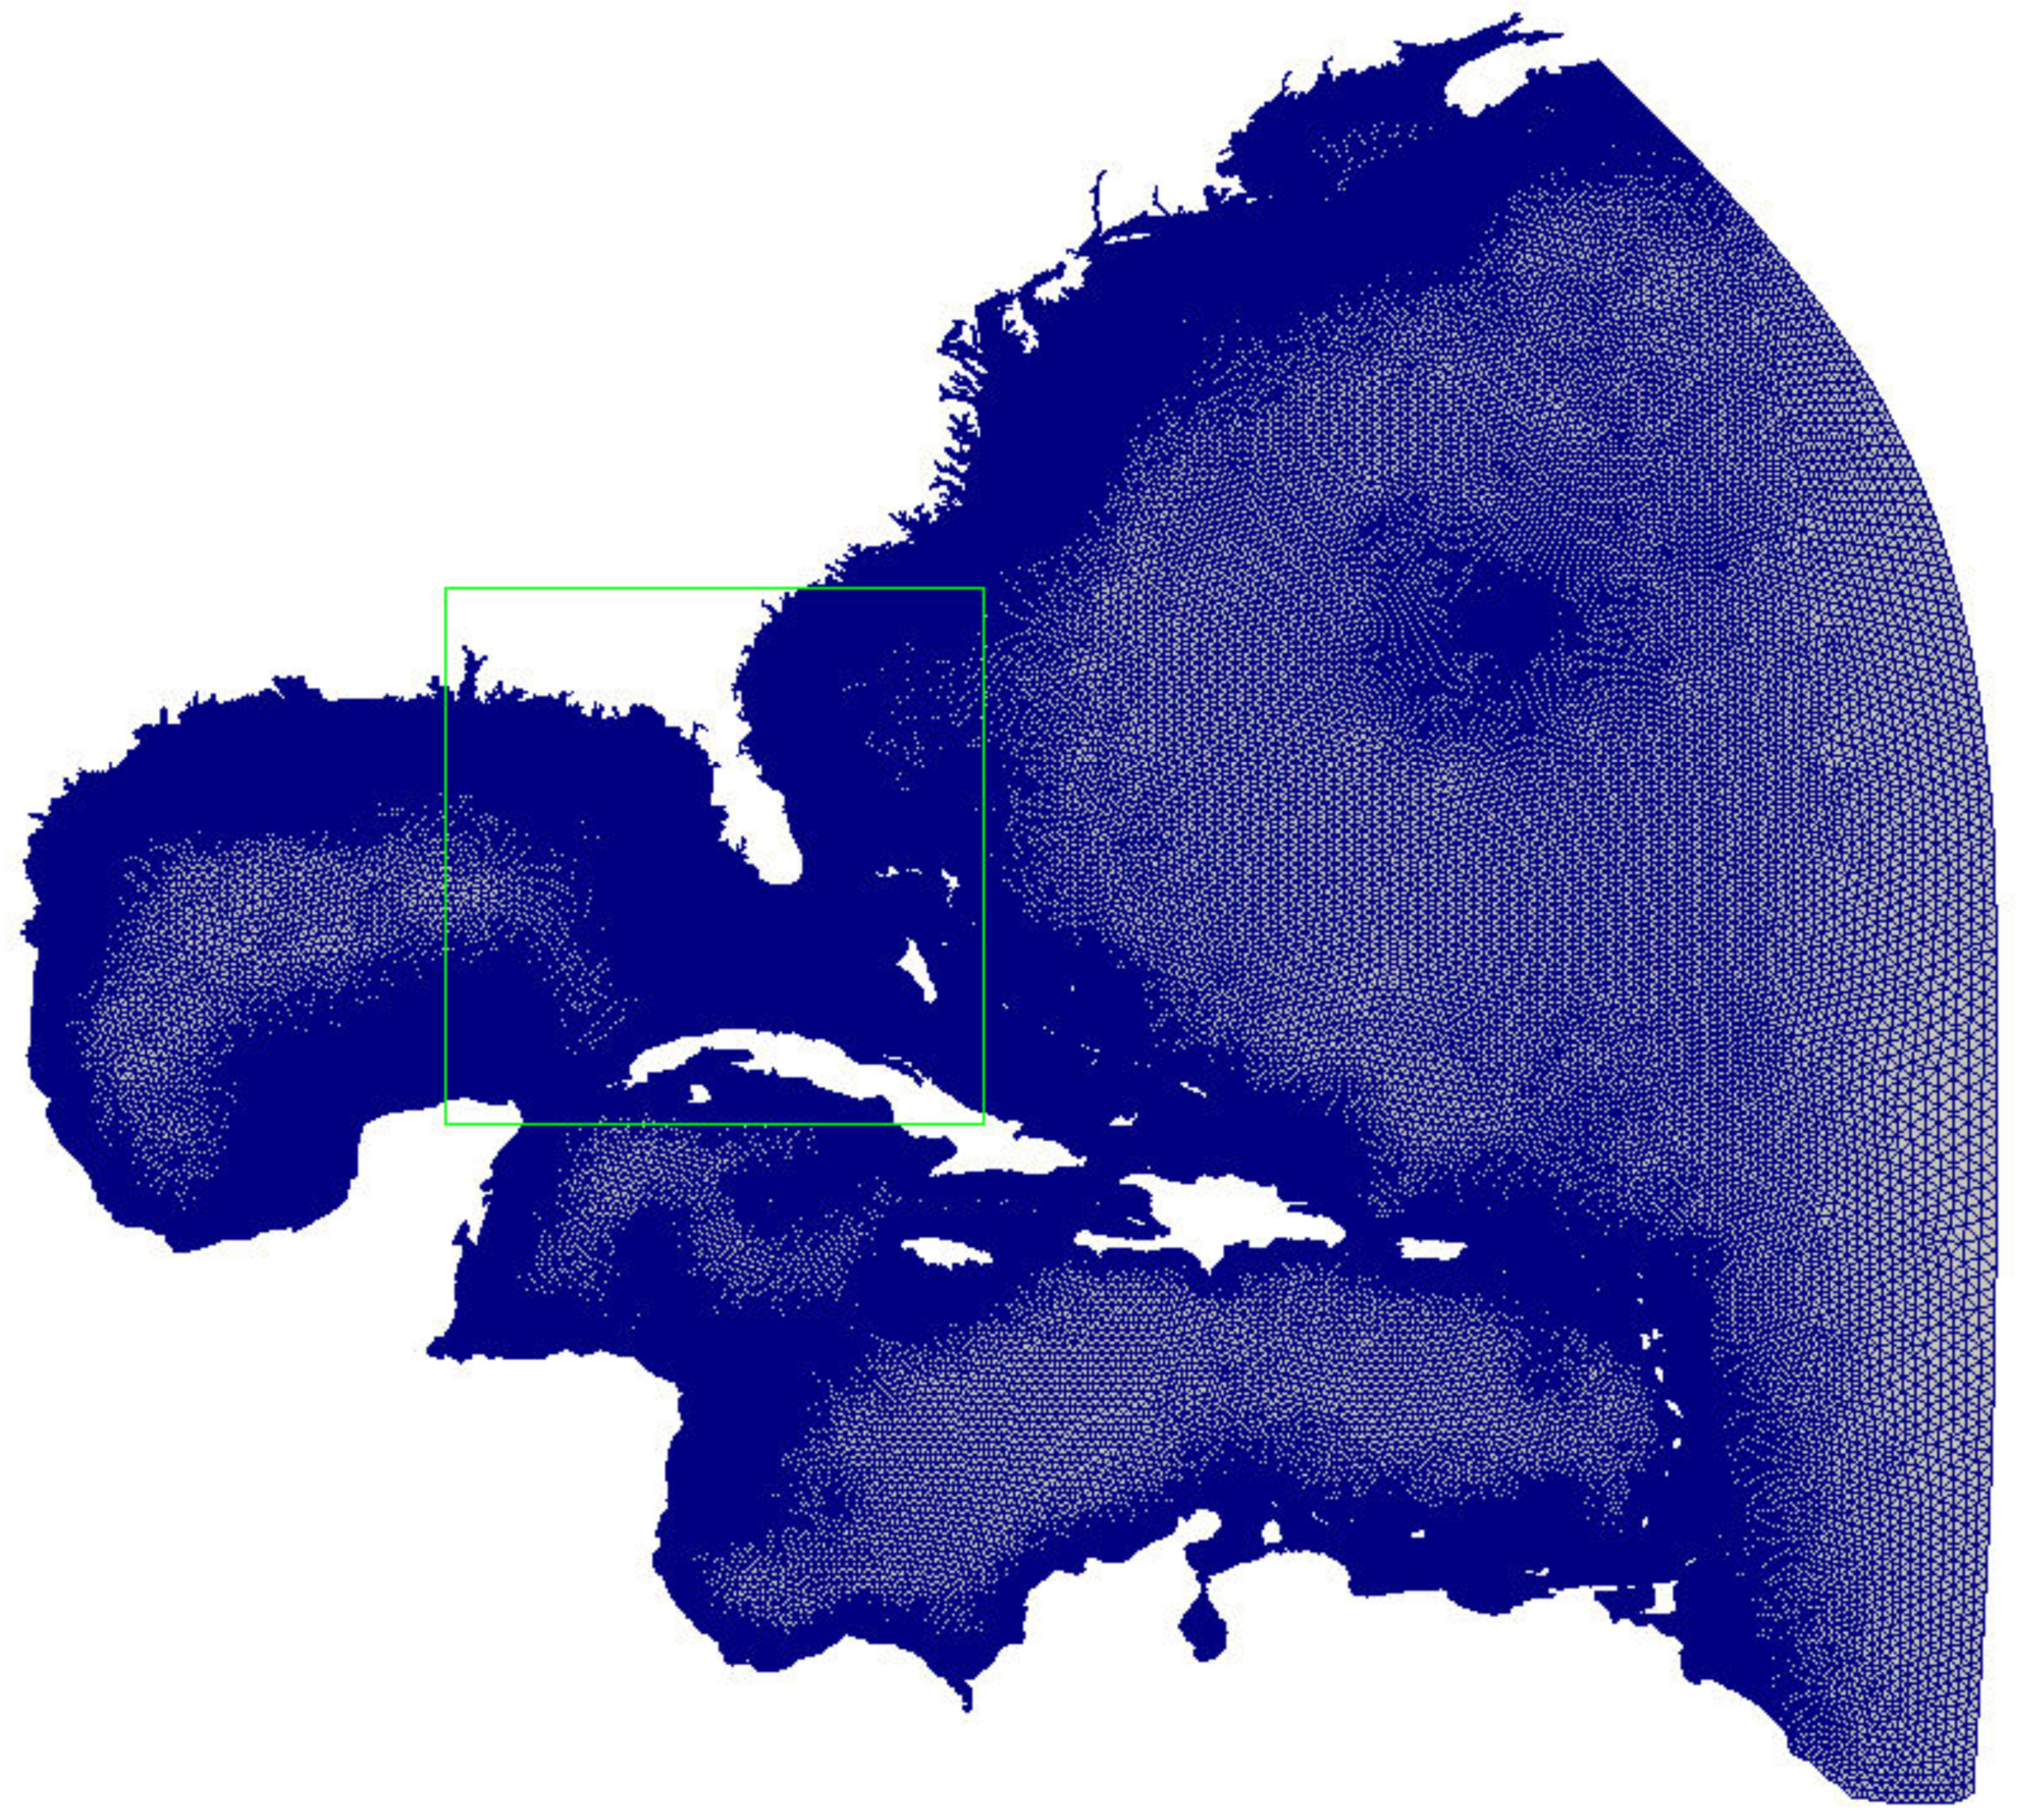
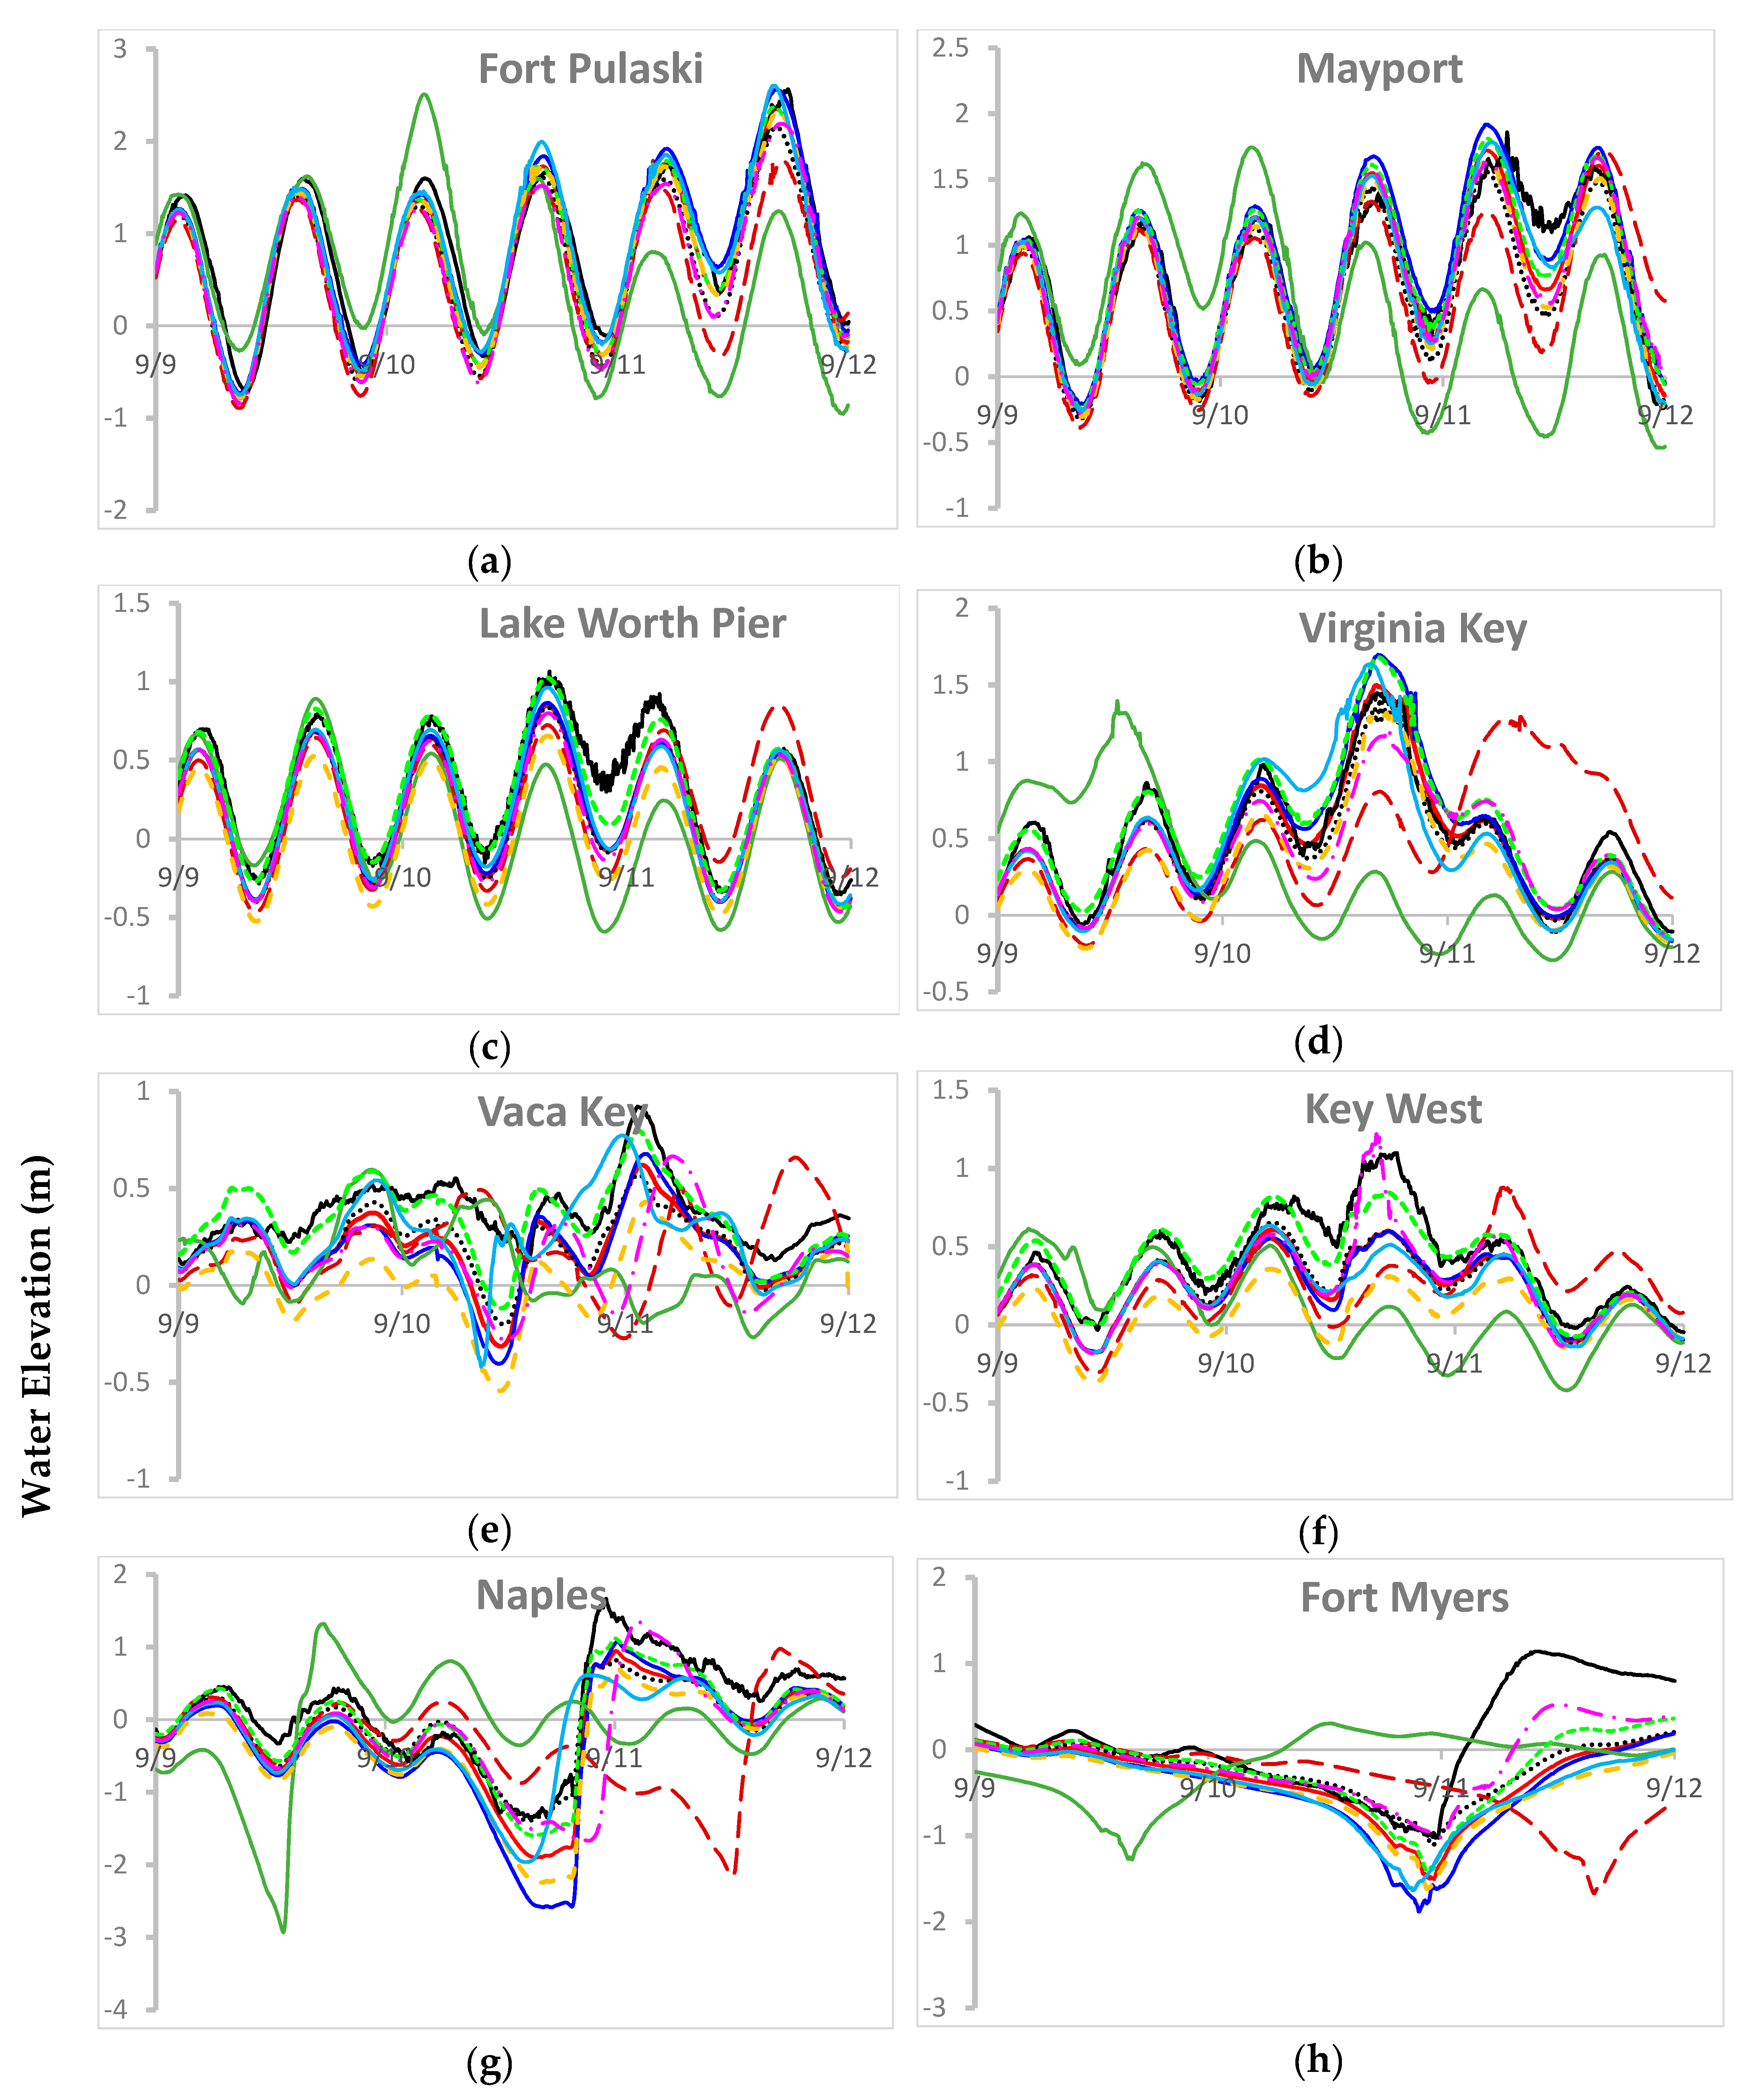
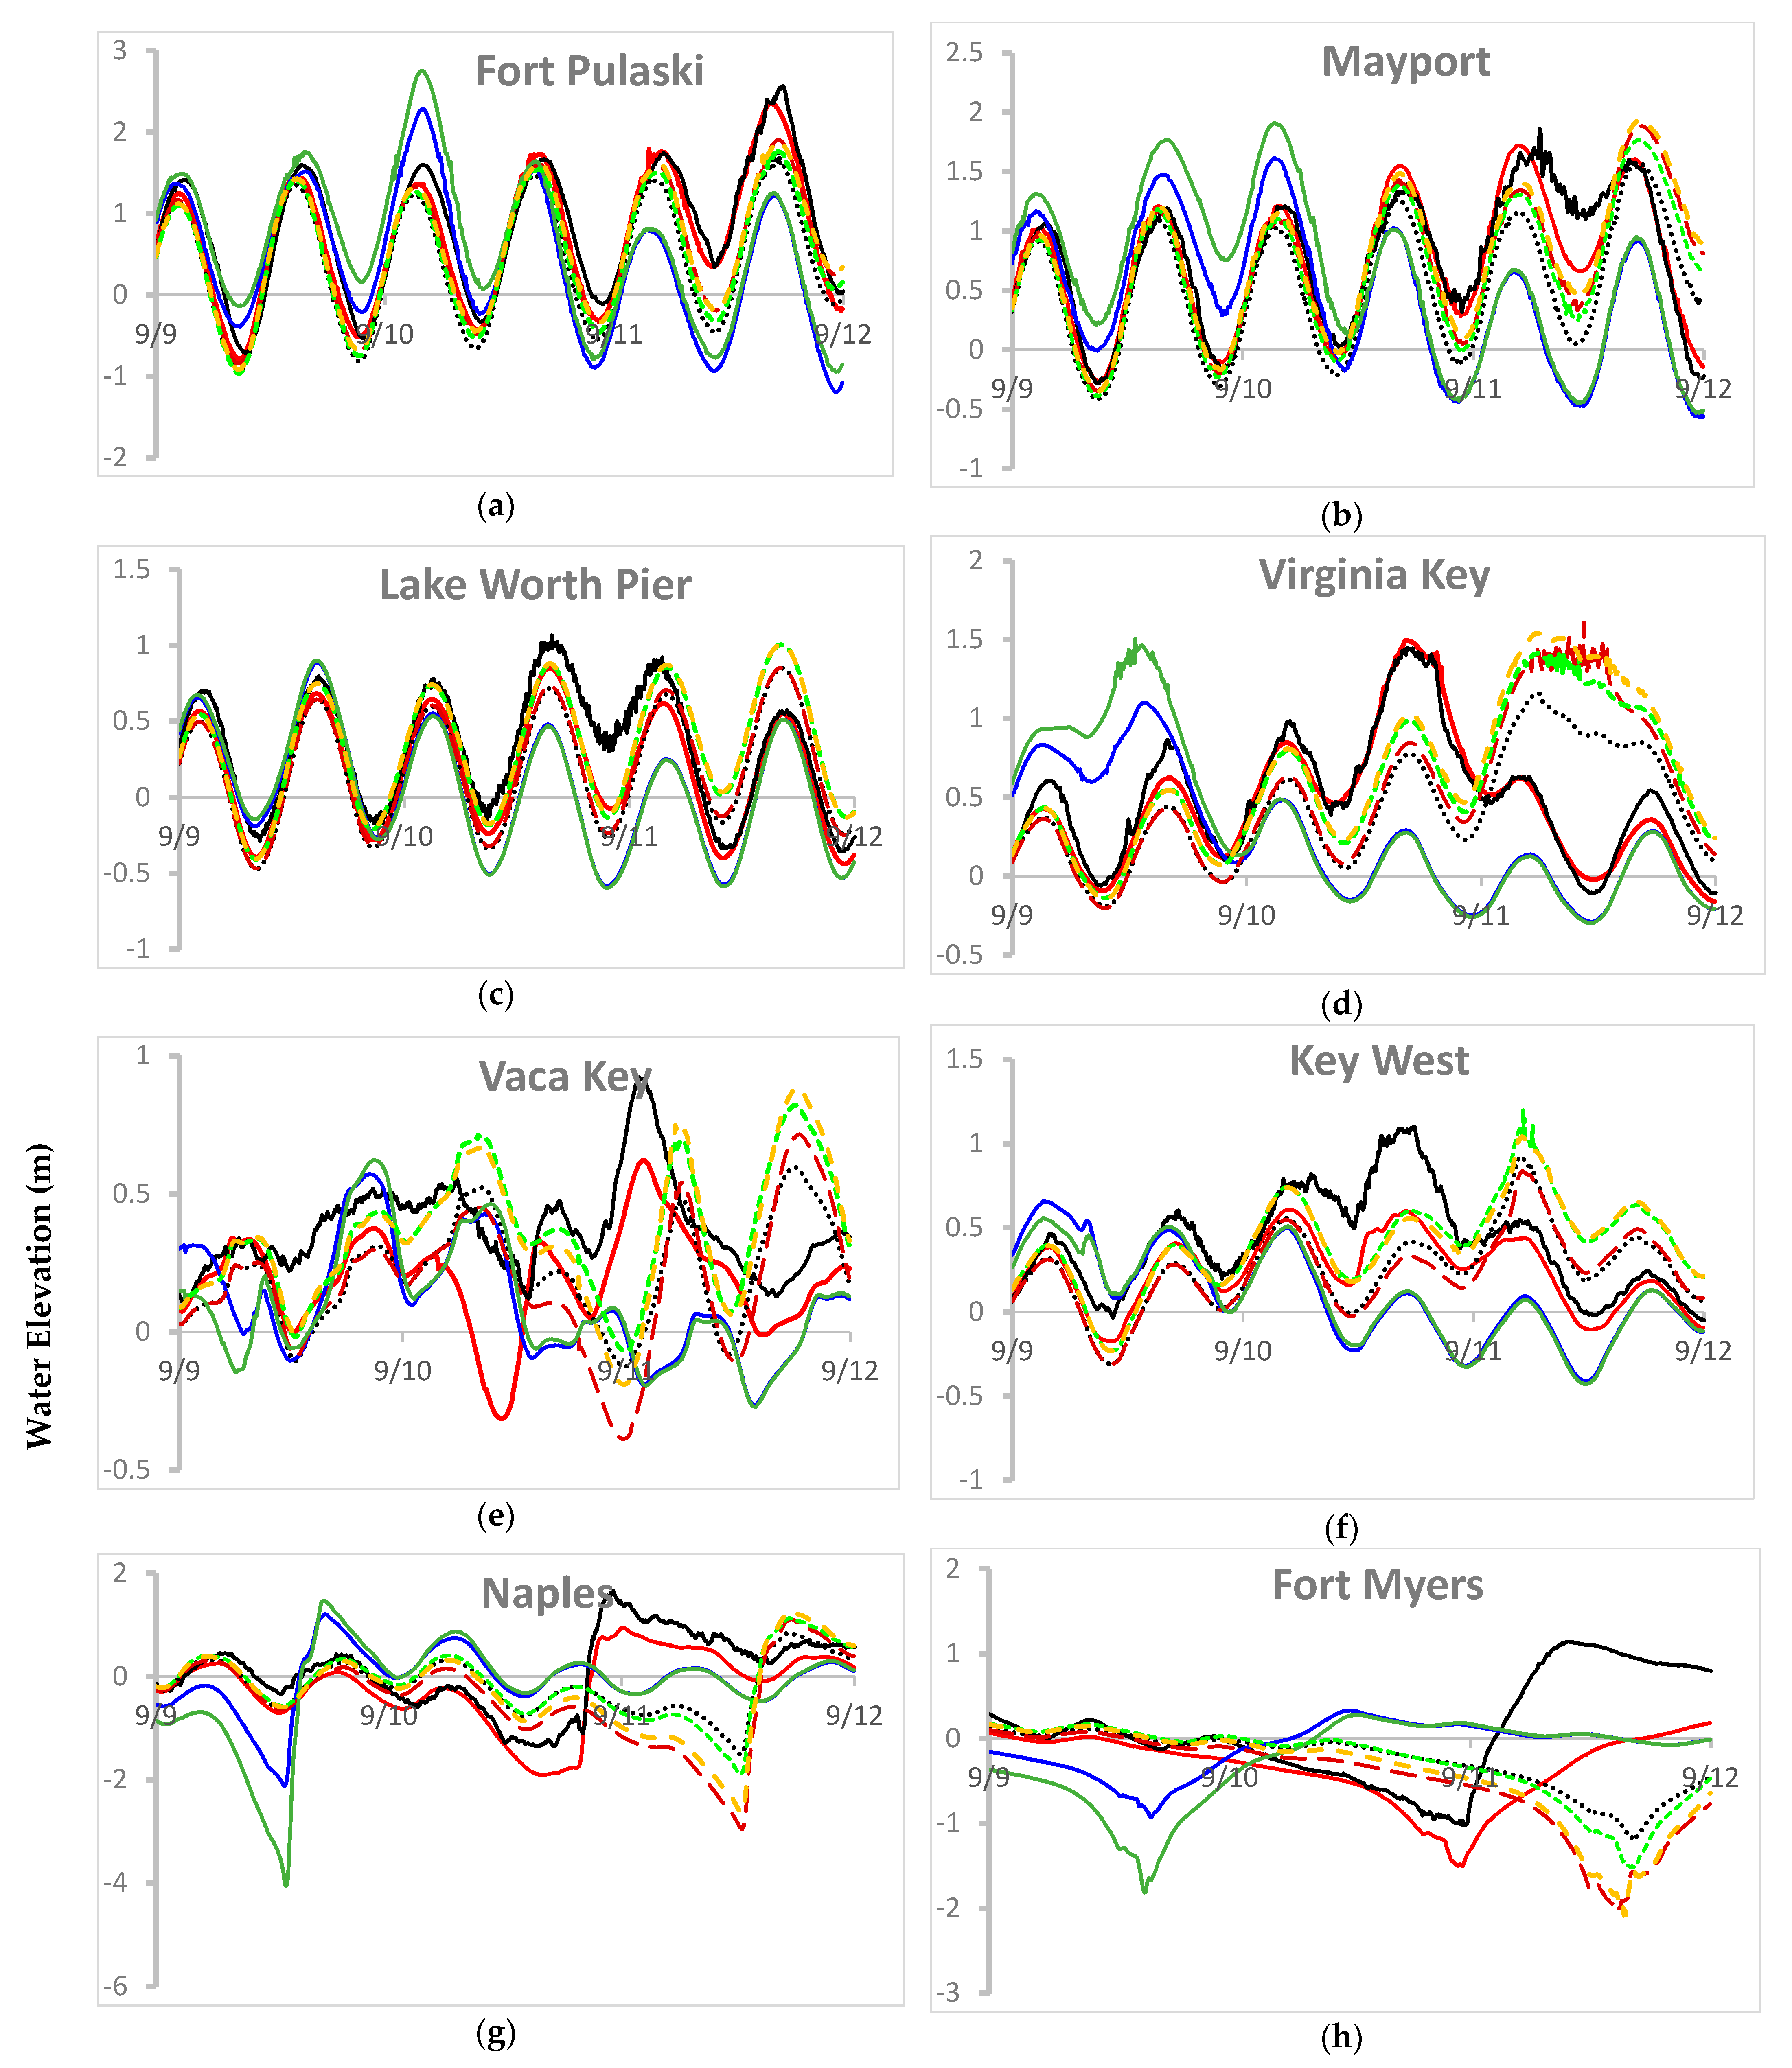
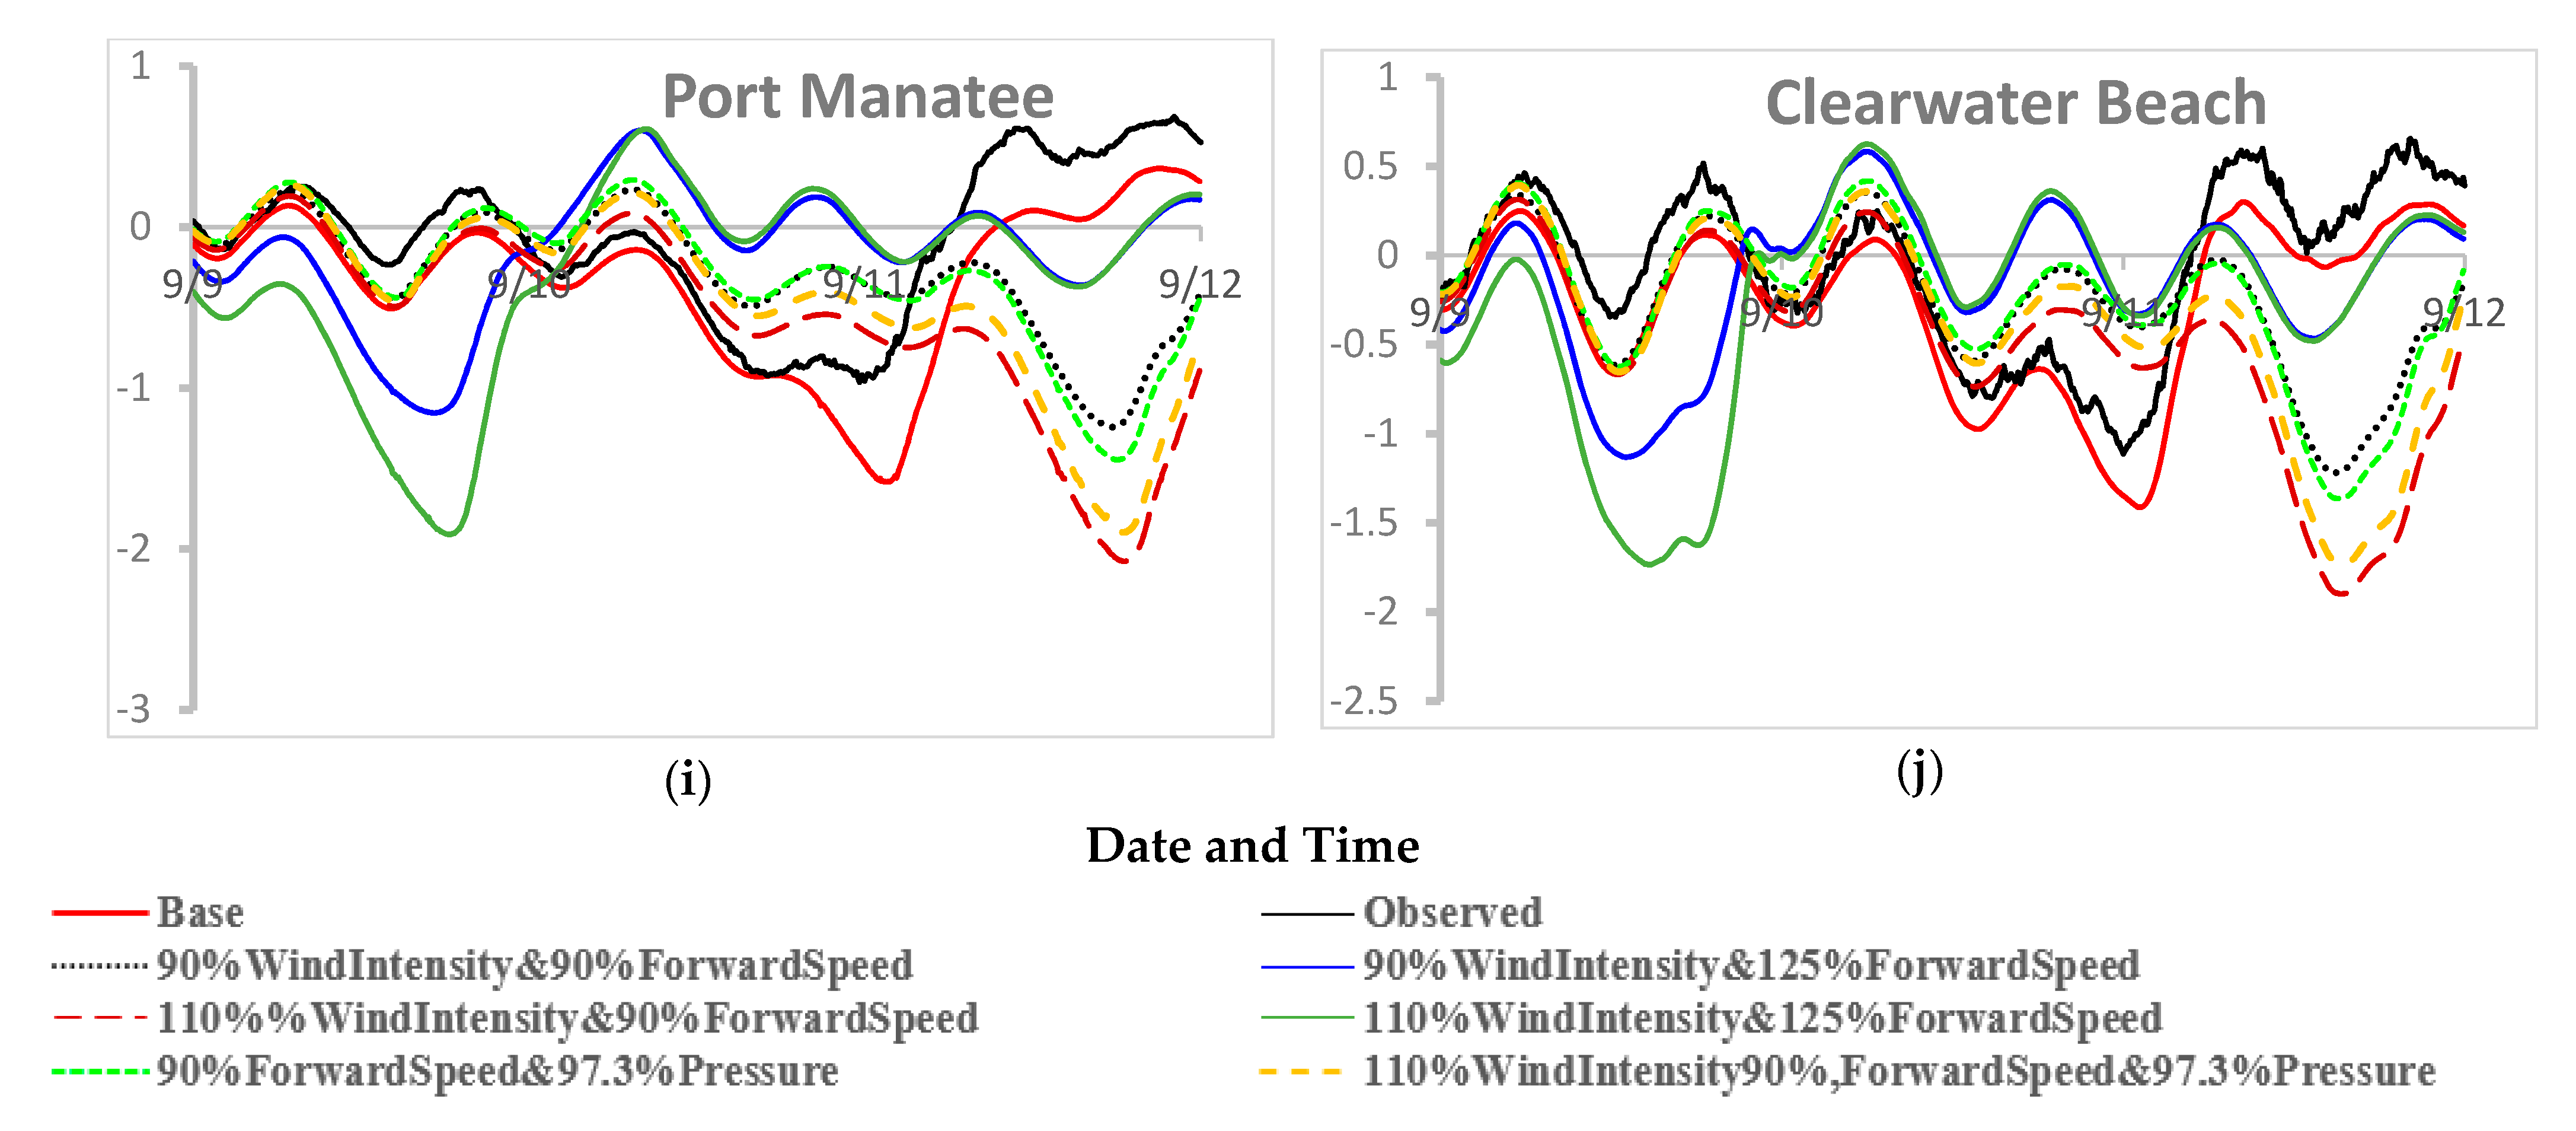
Figure 6, modeled Hurricane Irma water level timeseries are compared to the observed water levels at 10 selected locations in south Florida. The identification number for the National Oceanic and Atmospheric Administration (NOAA) gauge stations and location bathymetric depths are shown in
Table 2. Fort Pulaski is located near Savannah River on South Carolina–Georgia border, while Mayport is located on St. Johns River east of Jacksonville, Florida. Lake Worth Pier and Virginia Key stations are located far away to the east of landfall, Key West and Vaca Key are located close to the land fall areas in the Florida Keys. Naples and Fort Myers are located close to the landfall areas near north of Marcos Island, while Port Manatee and Clearwater are located farther north of landfall areas in southwest Florida. The bathymetry and geographic locations of these gauge stations with respect to the track are shown in
Figure 1b.
To further understand the effect of the varying parameters (i.e., Cases 2–9) listed in
Table 1, modeled water level time series are compared to the modeled water level time series using OWI (i.e., Case 1) meteorological forcing, as well as the observed water levels at eight stations in South Florida. In comparison with the observed data, the OWI model results are acceptable and are well comparable to those presented in a recent study done using the parallel Coastal and Estuarine Storm Tide (CEST) Model [
25], indicating that OWI well represented Hurricane Irma windfields. Overall, OWI underpredicts the Irma surge at all stations except at the Virginia Key station. The greatest underprediction of more than 0.9 m occurs at Fort Myers. Fort Myers station is located deep inside a river channel. The water path from the ocean to the station goes through a tortuous path. Any inaccuracies in the mesh, Manning’s n coefficient and bathymetry along the way is bound to cause some discrepancy and delay in surge peaks. In the Key West station, the model underpredicts by about 0.5 m, and the reason for this underprediction is possibly a coarser mesh resolution in the Key West region. However, as shown in
Figure 6, water level time series with varying parameters in OWI indicate overprediction by some models and underprediction for others. Moreover, the models show a phase lag or lead in the arrival peak surge at a given location, depending on the effect of changing the parameter. The highest peak water levels of about 1.5 m are observed at Naples and Fort Myers, while the lowest peak water levels of about 0.6 m occurred at Port Manatee and Clearwater beach. The east coast stations have mostly positive surges, although they have low tide times. On the contrary, the west coast stations have negative surges of −1 m or more for 18 to 24 h, which is related to the offshore wind pushing water away when the hurricane was approaching the stations. The surge reversed once the hurricane wind came onshore after the eye passed over the stations. This phenomenon has been well documented after the hurricane [
14,
15], although it was not reported in the advisories.
An identical effect of wind intensity is observed in almost all stations. When wind intensity is increased, water levels are higher than that of the reference (i.e., Case 1) model. The greatest effect of increasing wind intensity occurs at the Virginia Key station (
Figure 6d), indicating that stronger winds produce a high inundation in the Miami and Biscayne Bay areas. Peak water levels tend to decrease when wind intensity is decreased. In the Florida Keys, the effect of an increasing wind intensity appears to be higher on the east of the track than on the west side of the track due to the steering counterclockwise winds, as shown in
Figure 6e, f for Vaca Key and Key West stations, respectively.
Reducing pressure increases the peak water levels, while increasing pressure decreases the water levels at all selected stations. However, increasing or decreasing pressure produces about the same magnitude of impact on storm surges. The greatest impact of pressure occurs in the southeast coast at Lake Worth Pier and Virginia Key stations and in the Florida Keys at Vaca Key and Key West stations. At these stations, onshore winds combine with a low barometric pressure to generate the highest storm surges. As the center moved northward towards the west coast, changes in barometric pressure had no apparent effect on the Irma storm surge, but wind forcing was more influential. Similar results were obtained by [
15].
Changes in the forward speed result in a phase lead or phase lag of peak water levels. When forward speed is increased by 25%, peak surges occur with a phase lead of 30 h, but a decreasing forward speed by 10% results in a phase lag of 17 h. In a previous study, Musinguzi et al. [
7] observed a phase lead of 36 h when hurricane Rita’s forward speed was increased by 25%. At Vaca Key and Key West stations, reducing forward speed has more of an impact on surge than an increasing forward speed, implying that slowing the hurricane gives it more time to inundate the islands, while a fast-moving hurricane quickly passes the islands. At stations in southwest Florida, increased forward speed caused more surge relative to the reference (Case 1) model. This can be explained by the wind directions in
Figure 3, which were predominantly southwestward before Irma moved northwards, but later the wind directions became primarily northeastward, pushing more water back overland. In east Florida, at Lake Worth Pier and Virginia Key stations, changes in the forward speed does not indicate significant changes in peak water line timeseries, further confirming that low barometric pressure was a significant contributor to high peak storm surges on the east coast.
When the track shifted 5° west of the original track, it increases peak water levels on the west coast. This is demonstrated by higher peak surges at the Key West and Naples stations. When the track is shifted 5° east, an increase in peak surges occur at stations on the entire Florida east coast, Georgia–Carolinas coastline. NOAA stations at Mayport, Lake Worth Pier and Virginia Key indicate an evident increase in maximum surge. The greatest increase in peak surges of about 0.8 m occurs at Key West station, when the track in shifted 5° east.
4.3. High Water Marks
High water marks (HWMs) are typically collected from the water marks left on structures, poles and trees after hurricane storm surges recede, and serve as important gauges to assess the worst storm surge which occurred at a given location over the entire duration of the storm. A comparative study of observed and modeled HWMs is a tool to assess model performance with respect to the observed data. However, it should be noted that not all HWM stations may be found to be wet in a typically ADCIR simulation. Hence, some stations may be predicted by the model as dry stations. This situation may be tied to a lack of model mesh resolution, outdated bathymetry, inaccurate input parameters, etc. A total of 47 National Ocean Service observed High-Water Marks (HWMs) are used to evaluate the performance of each modeled water level against the observed HWMs. The observed HWMs and their locations with respect to the coast lines are shown in
Figure 1b. Most of the high valued HWMs stations are on the east coast, along the Georgia–Carolinas coastline and low valued HWMs stations are on the southwest coast of Florida. In
Figure 7, the points are color-coded based on the surge (predicted minus observed). White-coded points indicated that HWM was well predicted by the ADCIRC model. These were characterized as those with surge differences within ±0.25 m. Red points indicate dry points. These locations were not wetted by the model. Green-coded points indicate underpredicted HWM locations and yellow-coded points indicate overpredicted HWM.
In the statistical analysis of HWMs, the number of points wetted by the ADCIRC model vary for all the simulated cases. The high-water mark locations not wetted by the model (dry points) are omitted in the computation of error statistics [
2,
7]. A comparison between observed and modeled HWMs, the number of wet-dry locations and the error statistics for different cases are presented in
Table 3.
Figure 8 shows scatter plots for the modeled and observed HWMs. The red square points indicate over-prediction by the model, while blue diamond points indicate underprediction by the model. The black line represents the best line of fit. In
Table 3, the simulation with OWI meteorological forcing has a Correlation Coefficient (
R2) value of 0.697, a Mean Normalized Bias (
) value of −0.138 and the Root Mean Square Error (
ERMS) is 0.143. The
ERMS assesses how scattered the data points are, which is largely attributed to the underprediction of HWMs at most of the locations. The
assesses how the modeled elevations are on a par with observed data. An overall negative value of Mean Normalized Bias (
) indicates an underprediction of HWMs by the OWI model. Most of the underprediction occurred at the Naples and Fort Myers areas, also shown by water level time series in
Figure 6g,h. In a previous study, Hurricane Irma HWMs located in South Florida mangrove zones were under-predicted using the CEST Model [
25]. They attributed this underprediction to the proximity of these areas to the domain boundary, resulting in a limited fetch for wind to push water inland. The OWI simulation overpredicted HWMs located around Virginia Key. This is further evidenced by the overprediction of water level timeseries at Virginia Key station as shown in
Figure 6d.
As shown in
Table 3, when wind intensity is increased to 110%, the
R2 increases to 0.703, while the
ERMS decreases to 0.139. As the comparison between
Figure 8a,c shows, increasing the wind intensity to 110% has improved the modeled HWM to be on a par with the observed data, as most HWMs are elevated, as indicated by a lower absolute value of
(0.032). When the forward speed is decreased, the model produces the worst statistics by reducing
R2 to 0.631, increasing the absolute value of
to 0.191, increasing
ERMS to 0.189, and increasing the number of dry locations to 3. When the forward speed is increased,
R2 is higher than the reference model with a smaller error and a lower absolute value of
. Note that for the higher forward speed case, the HWM may occur a day or two earlier than that of the reference case, as
Figure 6 indicates. The highest
R2 was 0.817 and the smallest
ERMS was 0.092, although a moderate absolute value of
(0.14) with 3 dry locations occur when hurricane track is shifted 5° west. When the track is shifted 5° east,
R2 reduces to 0.650,
ERMS increases to 0.273, scatter and the number of dry locations increases to 6, but
improves overall. Increased pressure gives an
R2 of 0.729 and an
ERMS of 0.160, although the number of dry locations increases to 6. When pressure is decreased,
R2 decreases to 0.686 and
ERMS decreases to 0.116. The best overall HWM performance is obtained when the wind intensity is increased to 110%.
4.4. Combined Effect of Wind Intensity, Forward Speed and Pressure
In
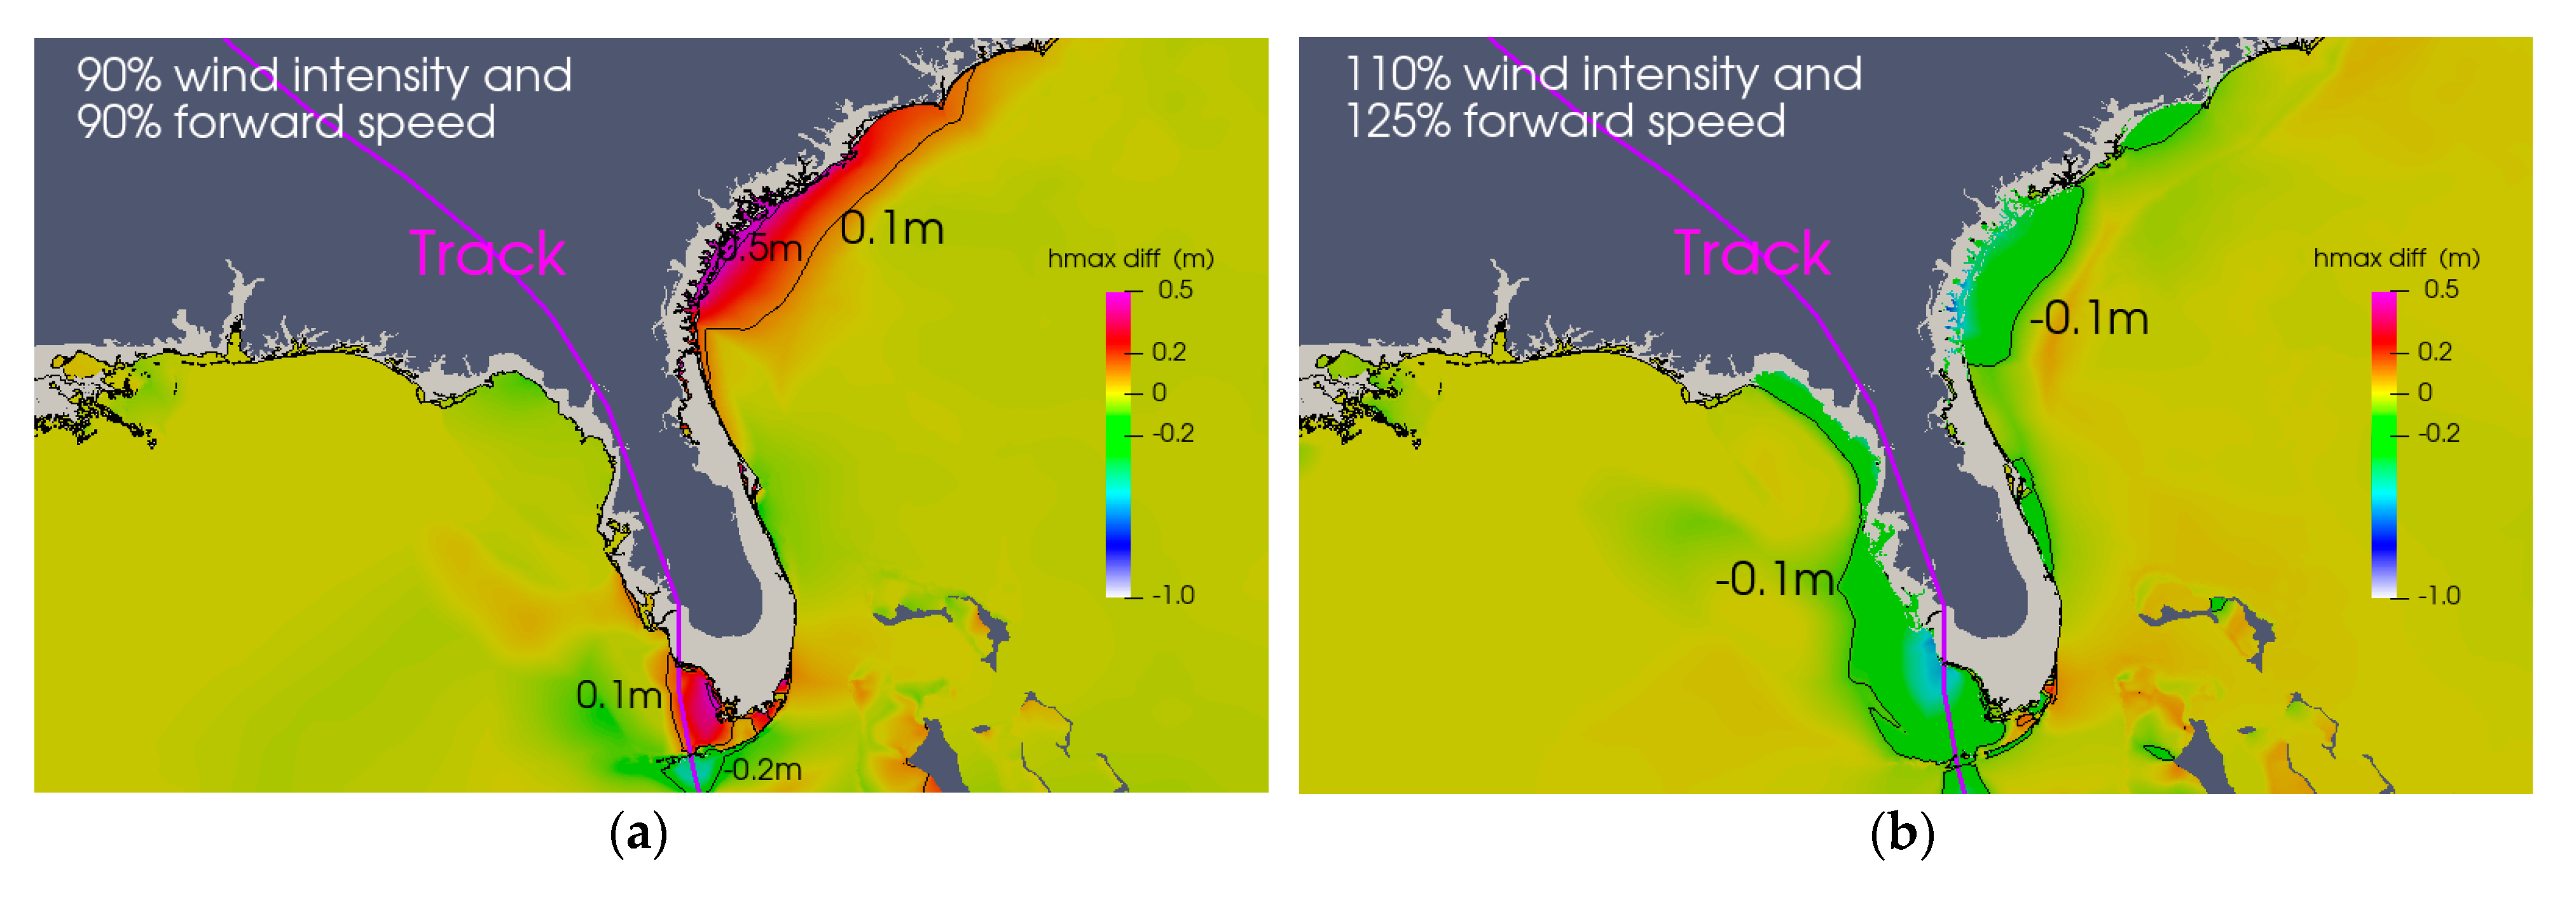
Figure 9, the combined effect of wind intensity, forward speed and pressure is examined. As presented in
Table 1, wind intensity, forward speed and pressure are simultaneously increased and/or decreased. The maximum water level differences between each simulation in Cases 10–15 and the reference simulation are computed using the maximum water elevation at each node. These maximum water elevation differences are used to ascertain the combined effects of wind intensity, forward speed and pressure.
As shown in
Figure 9a, when both wind intensity and forward speed are decreased, the storm surge decreases by about 0.2 m in southwest Florida, north of Key West, and by about 0.5 m in the northeast along the recess of the Georgia–Carolinas shoreline. The west coast remains mostly unaffected. However, the peak surges increase by more than 0.2 m in the south of Florida Keys. On the southwest coast, the decrease in wind intensity weakens the northeastward winds, pushing water up overland, but in Florida Keys, the increase in the surge is because the slow forward speed of the hurricane allows more time to inundate the entire islands. In the recess of the Georgia–Carolinas shoreline, the decrease in surge is because of weaker shore perpendicular (see
Figure 3 and
Figure 5) winds pushing water overland. When both parameters are increased, as seen in
Figure 9b, higher winds push more surge north of the keys and the south and west coast of Florida. In the northeast, along the recess of the Georgia–Carolinas coastline, there is a clear increase in surge as well, which is because of the stronger shore perpendicular winds pushing water overland. This combination appears to generate a large surge all around the Florida peninsula, except on the east coast. The effect of the surge on the east coast of Florida is relatively less, as water may easily slide up the coastline.
In
Figure 9c, when the wind intensity is decreased and the forward speed is increased, near the southeast of Florida, the surge is decreased and increased on the right and left side of the track, respectively. The peak water levels in the Florida Keys east of landfall decreased due to a weaker but faster wind pushing water to go past the islands. As observed before, decreased wind intensity causes the surge to slightly decrease in the northeast recess of the Georgia–Carolinas coastline. However, the surge on the west coast increases, which can be largely attributed to the increased forward speed. When wind intensity is increased and the forward speed is decreased, as shown in
Figure 9d, surges increase throughout the Florida Keys and east Florida. The west coast remains mostly unaffected. In the northeast recess of the Georgia–Carolinas shoreline, a decrease in surge occurs.
The combined effect of decreasing the forward speed and a reduced pressure is analyzed in
Figure 9e. It is observed that the surge increase occurs in most parts of the Florida Keys by more than 0.5 m. This increase extends to southeast Florida in the Biscayne Bay and Miami areas. A simultaneous decrease in forward speed and pressure potentially increases the surges in most parts of the west, south and east coasts of Florida. A decrease in surge occurs in the northeast recess of the Georgia–Carolinas coastline.
In
Figure 9f, the combined effect of wind intensity, forward speed and pressure is studied by simultaneously increasing wind intensity but decreasing both the forward speed and pressure. This parametric combination produces the greatest storm surge impact in and around Florida, with a more than 0.8 m increase in surge observed around the Florida Keys. A decrease in surge occurs in the northeast recess of the Georgia–Carolinas coastline. The overall effect is similar, but more intense than the case presented in
Figure 9e. The higher wind intensity pushes the water to cause overland flooding.
The ADCIRC + SWAN water level time series for the combined effect of wind intensity and forward speed are compared to the observed water levels at 10 stations, as shown in
Figure 10. Note that there is a time lead or lag wherever there is an increased or decreased forward speed, respectively. When both wind intensity and forward speed are decreased, an increase in the water level time series occurs in Florida Keys around the landfall areas. For instance, an increase in surge happens at the Key West station, indicating that a slow forward speed essentially inundates Florida Keys regardless of the wind for both high and low wind intensities. When both parameters are increased, water level time series indicate that the surge increases in southwest Florida as well as in Florida Keys. In the northeast recess of the Georgia–Carolinas coastline, the surge is increased at Pulaski and Mayport stations. However, there is not much change in the surge in the stations located on the east coast (Virginia Key and Lake Worth Pier), indicating the less sensitivity of storm surges to changes in the wind on the southeast coast.
When the wind intensity is reduced and the forward speed is increased, the water level timeseries at Vaca Key and Key West stations in Florida Keys decrease relative to the reference (Case 1) simulation. The surge in the northeast recess of the Georgia–Carolinas coastline decreases, as seen in the timeseries of Fort Pulaski and Mayport stations (see
Figure 10a,b, respectively). When the wind intensity is increased and the forward speed is reduced, an increase in surges occurs in the Florida Keys, as shown by the water level time series at Vaca Key and Key West stations, while no difference in peak water levels occur at the Virginia Key and Lake Worth Pier stations. This confirms the findings that a high wind intensity and/or a slow forward speed increases peak surges in the Florida Keys, while wind intensity plays a big factor in the flooding in the northeast recess of the Georgia–Carolinas coastline.
The combined effect of a simultaneous increase in wind intensity and a decrease in both the forward speed and pressure is a combination with the greatest effect in increasing the storm surge in the south of Florida. This effect is most critical in the Florida Keys, as seen in water timeseries at the Key West station (
Figure 10e). However, this combination causes a decrease in surge in the northeast recess of the Georgia–Carolinas coastline, especially at Fort Pulaski station (
Figure 10a).
All west coast stations experience negative surges, as discussed before. Positive surges recede once the hurricane eye passes over the stations.


