Article

Coupled Interactions Analysis of a Floating Tidal Current Power Station in Uniform Flow

1
College of Shipbuilding Engineering, Harbin Engineering University, Harbin 150001, China
2
Southern Marine Science and Engineering Guangdong Laboratory (Zhuhai), Zhuhai 519000, China
3
School of Marine Engineering and Technology, Sun Yat-sen University, Guangzhou 518000, China
4
Jiangnan Shipbuilding (Group) Co., Ltd., Shanghai 201913, China
*
Author to whom correspondence should be addressed.
J. Mar. Sci. Eng. 2021, 9(9), 958; https://doi.org/10.3390/jmse9090958
Submission received: 12 August 2021 / Revised: 27 August 2021 / Accepted: 28 August 2021 / Published: 3 September 2021
(This article belongs to the Topic Sustainable Energy Technology)

Abstract

:
For a floating tidal current power station moored in the sea, the mutual interactions between the carrier and the turbine are pretty complex. Current simulation methods based on potential flow theory could not consider the complicated viscous effects between the carrier motion and rotor rotation. To accurately account for the viscous effect, developing a different numerical simulation method based on computational fluid dynamics is necessary. This paper deals with a moored FTCPS (floating tidal current power station) with 6-degree-of-freedom motion in uniform flow based on dynamic fluid body interactions (DFBI) method. Results showed that the blockage effect caused by the columns would increase the average power output of the turbine, while the power output fluctuation also increased. When the carrier is individually moored in the sea, the motion response of the carrier is pretty small, and the carrier is obviously trimming by the bow. However, when the turbine is mounted on the carrier, the carrier motion response is simple harmonic. The motion response frequency of the carrier is in relation to the rotation frequency of the turbine.

1. Introduction

The tidal current energy is one of the most abundant clean renewable energy resources worldwide [1]. Due to its high energy density, strong predictability, and energy stability, tidal current energy has become a hot topic in ocean energy research in recent years [2]. The tidal current turbine is the core component that converts the ocean tidal current kinetic energy into electricity. Tidal current turbines can be classified into fixed turbine and floating turbine based on their supporting platforms [3]. Figure 1 shows some typical fixed and floating tidal current turbine worldwide. Most of them are still in the demonstration stage and far from commercialized applications. Compared to fixed turbines, floating tidal current turbines are suitable for different kinds of complex marine environments. Floating tidal current turbines are easy to install [4]. The large deck area is convenient for daily operation and maintenance. The turbines can better make use of the strong ocean surface tidal current kinetic energy. The floating platform can be easily removed and redeployed when the platform experience extreme weather conditions. The floating platform has no requirements for the submarine topography and ocean depth [5]. Thus, the FTCPS possesses broad development prospects in the future.
The floating platform can be easily removed and redeployed when the platform experience extreme weather conditions. The floating platform has no requirements for the submarine topography and ocean depth. Thus, the FTCPS possesses broad development prospects in the future [6]. However, the FTCPS is moored to the sea in the long-term. The turbine’s operation would generate a high working load, which would heavily influence the motion response of the carrier. Since the flow field is highly changed due to the motion, the motion response of the carrier would, in turn, affect the turbine’s power output. To enhance the reliability and safety of such a kind of device, it is necessary to thoroughly study the mutual and complex interactions between the carrier and the turbine before commercial development and application.
Experiments about the coupled interactions between the platform motion and turbine’s hydrodynamics are seldom seen in the literature. Firstly, it is difficult to simulate the load condition of the turbine mounting on a floating platform. Secondly, scaled-down FOWT models have underlying limitations for simultaneously satisfying essential scaling laws (Froude and Reynolds number scaling) [7]. That is, when the Froude scaling law is applied, the Reynolds number scaling law is not guaranteed, and vice versa. Usually, an experimental test costs much more than ordinary numerical analysis. Currently, there is no systematic theoretical framework or mature commercial software to analyze the coupled interactions between the carrier and the turbine for such a system. The turbine and the carrier are often considered as two independent parts. The mutual interactions between the turbine and carrier are usually ignored or simplified. Since the structure of FTCPS is similar to the floating offshore wind turbine (FOWT), some researchers suggest that the analysis method of FTCPS could learn from the OFWT [8]. Thanhtoan et al. studied a FOWT experiencing the prescribed pitching motion of a supporting platform as a sine function [9]. Results showed that the unsteady dynamic loads of the turbine were dramatically changed by the frequency and amplitude of the platform motion. Shifeng et al. carried out a wind-tunnel experiment for a horizontal axis wind turbine with prescribed rolling and pitching motion to study the wake and power fluctuations [10]. Results showed that the power output of the turbine could increase with moderate tower oscillations. The cube of the relative incoming flow velocity impinging the rotor in the pitching, and a momentum replenishing in the rolling motion could lead to the power increasing of the rotor. Thanh et al. established a computation fluid dynamics framework based on dynamic fluid body interaction approach to inspect the turbine’s power fluctuations and the platform’s motion responses [11]. Three different methods (DFBI, FAST-BEM, GDW) have been conducted and detailed compared for the simulation of FOWT. Compared to the conventional techniques, such as FAST-BEM and generalized dynamic wake (GDW) methods, the maximum oscillating amplitude of turbine power output could be an approximate four-fold difference by the proposed DFBI methods. Some researchers have used similar methods to study the tidal current turbine learnt from wind turbine research. Guo et al. established a framework based on a modified blade element momentum to investigate the power output and rotor loads of a horizontal axis tidal current turbine with prescribed floater motions [12,13]. The floater motions were calculated in the time domain by potential flow theory. Results showed that floater-motion-induced contributions dominate the rotor load. They suggested that the rotor should be mounted close to the floater center to avoid the floater-motion-induced velocity on the blade section. Brown et al. developed a computational HATT model for generalized incident flow conditions using the actuator theory [14]. The arbitrary movement of the turbine was modeled based on the ‘weighted body force implementation’. This method requires no constraints in the local structure of the mesh around the turbine, which allows for a quick and efficient simulation of the turbine. Shuqi et al. established a numerical model based on the dynamic mesh technique to study the turbine’s hydrodynamics with prescribed platform oscillating motions [15,16]. Results showed that the turbine’s loads and power output were highly affected by the oscillating frequency and oscillating amplitude. The damping coefficient and added mass of the turbine were obtained by the least square method. They explained that the fully coupled motion prediction of the platform could be realized by adding the damping and added mass of the turbine to the platform’s motion equation in time domain. However, the technique about the motion prediction of the platform are not reported yet in the literature. Xu et al. studied the coupled motion of a catamaran by linearly adding the wave excitation force of the turbine to the platform’s motion equation [17]. However, the motion response of the catamaran tends to be underestimated.
As described above, there is currently no systemic method for analyzing the fully coupled characteristics of floating tidal current power stations. The turbine’s hydrodynamics and platform’s motion response are always investigated separately. Therefore, a fully coupled method which can take the platform’s motion, turbine’s hydrodynamics, and mooring line tension into consideration is required for the FTCPS.
Therefore, this study establishes a six-degree-of-freedom motion model of a platform-turbine-mooring coupled system under the gas-water two-phase flow based on the dynamic fluid-solid interaction and volume fraction methods. The complicated coupling mechanism between the turbines and the platform is studied. The dual-rotor turbines and the power station carrier model are simplified to reduce the interference of other complex components in the investigation of the coupling effect between the turbines and the platform. The force and moment are transmitted between the carrier and hydraulic turbines through a rotating hinge to reduce interference with connecting construction on hydraulic turbine-carrier coupling. Meanwhile, a double overlapping grid will ensure the convergence of the computational results to prevent the large-scale transient movement of the carrier and the rotating motion of the turbines from causing the calculation results to diverge. Based on the above methods, this article first compares the simulation results with the test results to verify the reliability of the research method. Then, the interactions between the motion of the carrier and the rotating motion of turbines under the uniform flow condition are computed and the mutual influence law and the flow field are obtained by using the aforementioned numerical simulation method. Finally, the influence of the speed ratio on the hydrodynamic characteristics of the turbine under the uniform flow condition is discussed. This research not only outputs the information of turbine load, power and flow field in real-time by the CFD prediction method for the coupled characteristics of a tidal current power station but also predicts the motion response of the power station carrier. The research results can provide specific theoretical guidance and technical support for the design and engineering of floating tidal current power plants.

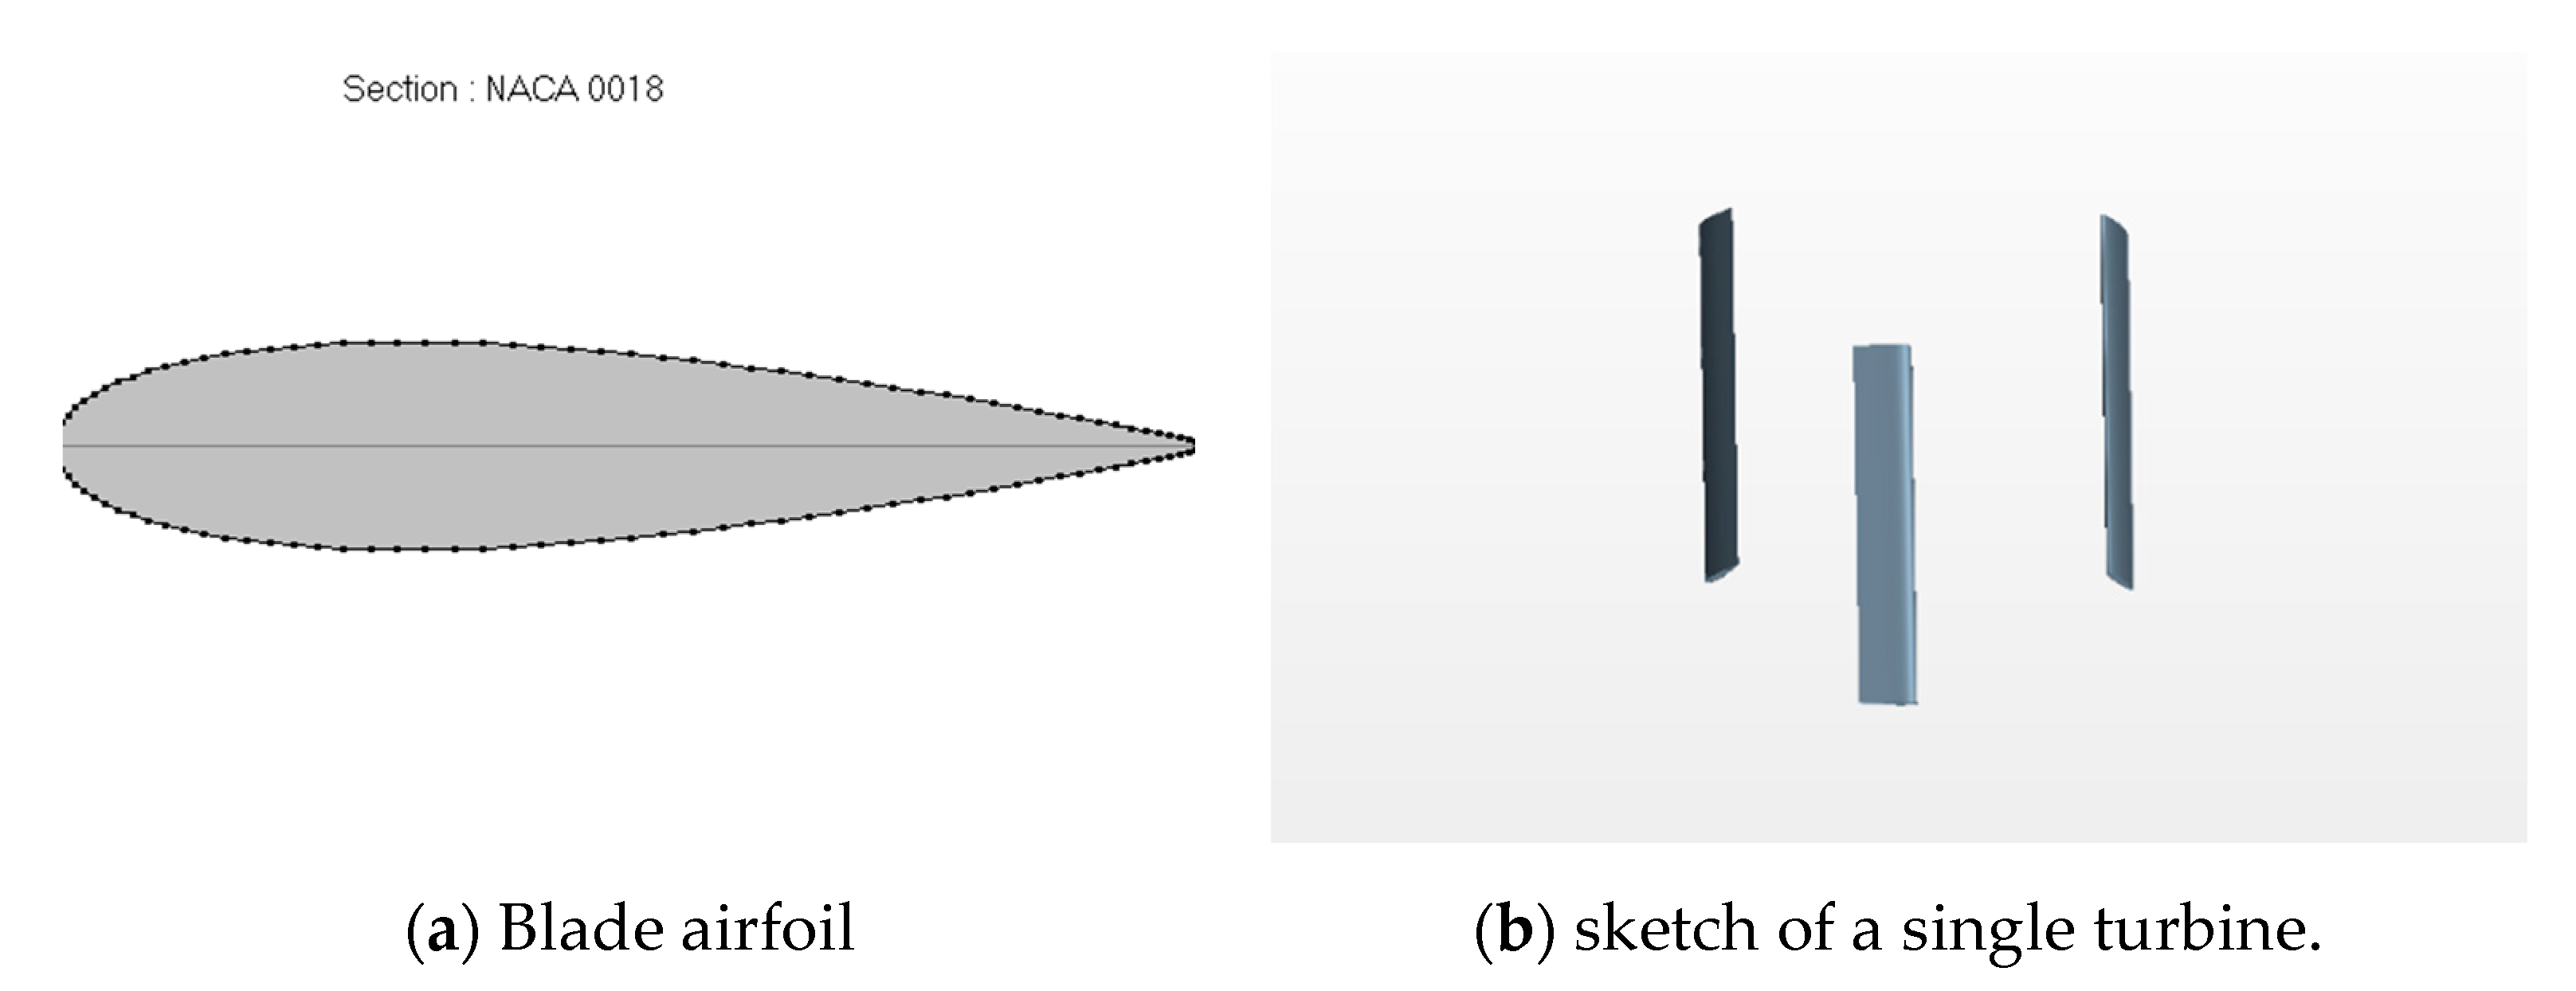
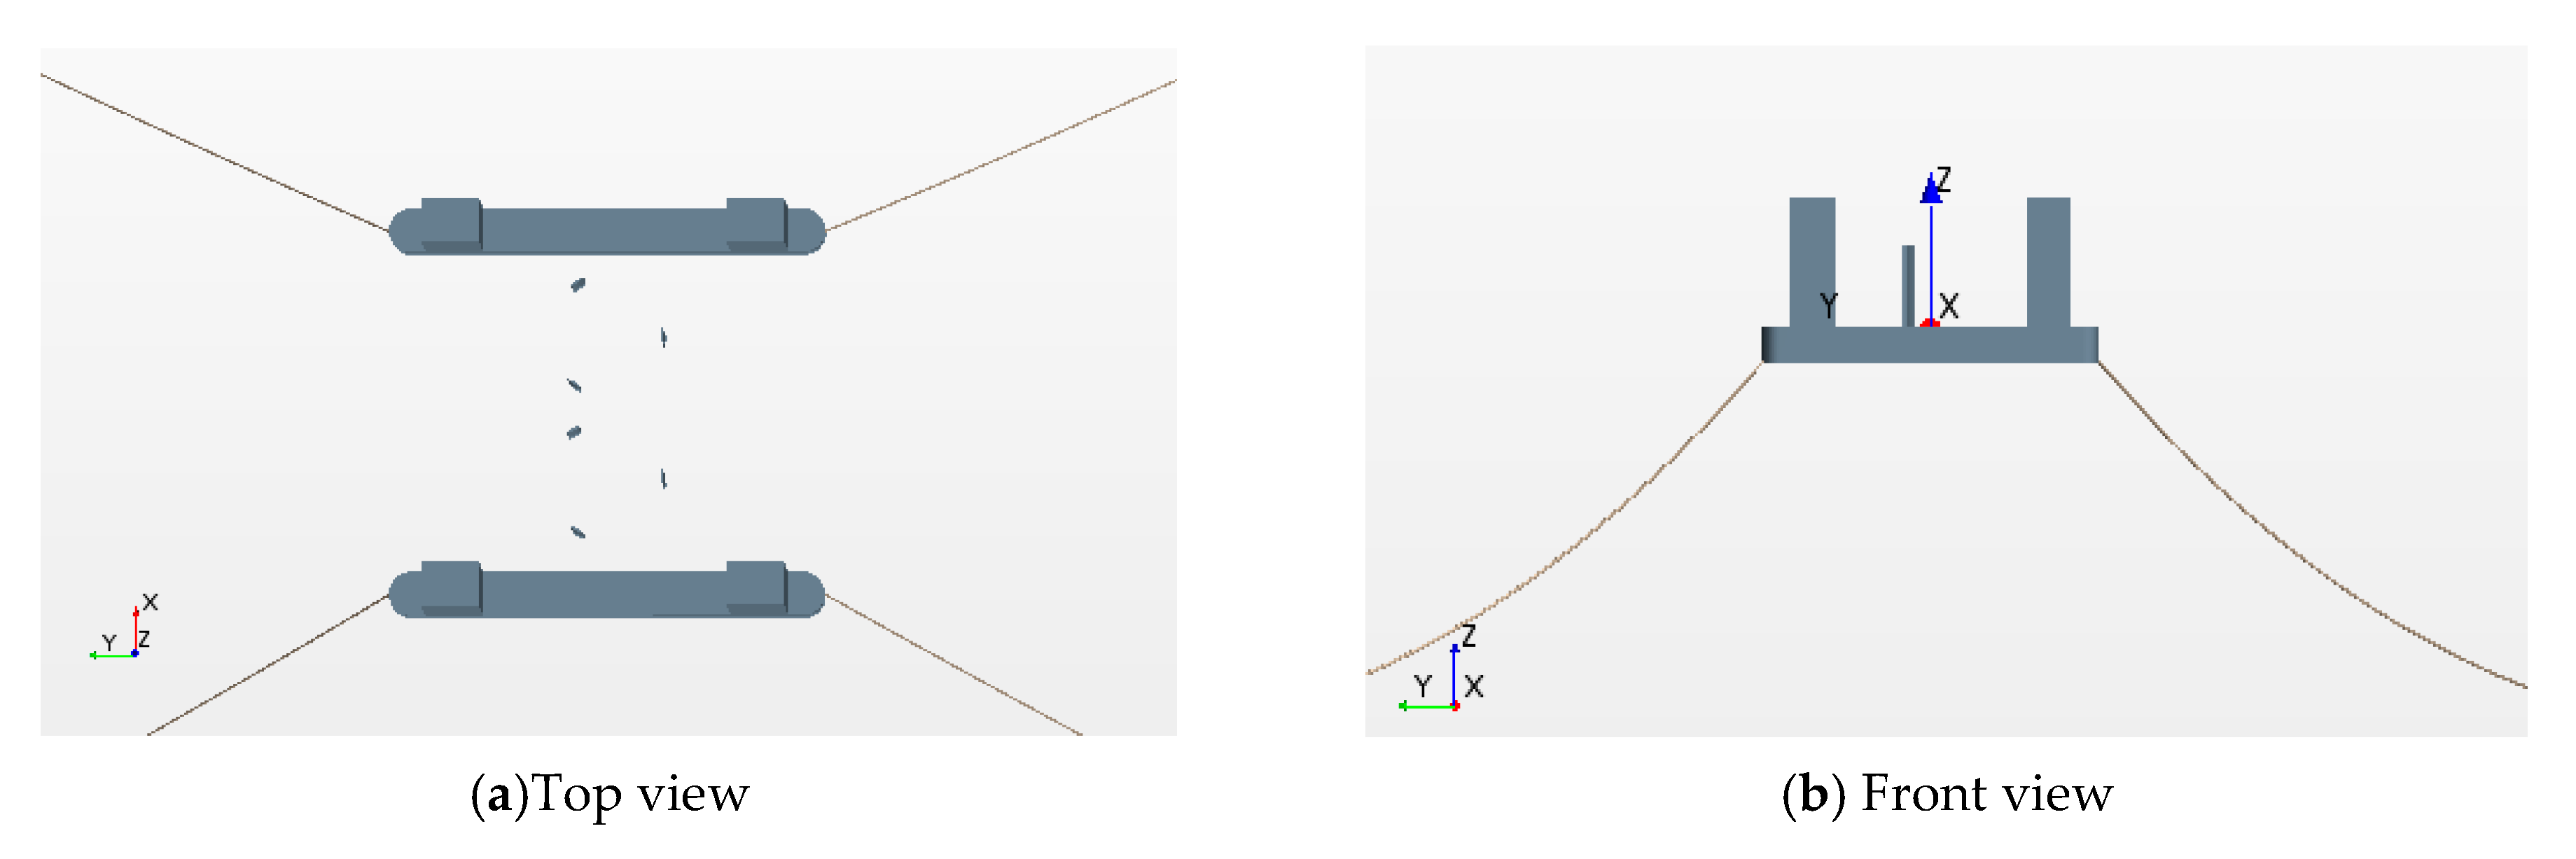
2. Floating Tidal Current Power Station Design

In this paper, a four-column semi-submersible tidal current power station is designed by adopting a vertical-axis counter-rotating double-rotor turbine. The main structure of the FTCPS includes the main floating bodies on the left and right sides, two symmetrical lower beams, four columns, the platform deck, and the upper buildings. Figure 2 shows the sketch of the floating tidal current power station model. The twin-rotor turbine is symmetrically deployed.
The airfoil of the turbine is NACA-0018, as shown in Figure 3a. The designed capacity of a single turbine is 120 kW, the designed flow velocity is 2.5 m/s, the turbine’s diameter is 8 m, and the airfoil chord length is 1 m. A sketch of the turbine is shown in Figure 3b. To increase the computation efficiency and minimize the influence of unnecessary components of the FTCPS, the FTCPS has been simplified in the numerical simulation process. A simplified model of the FTCPS is shown in Figure 4.

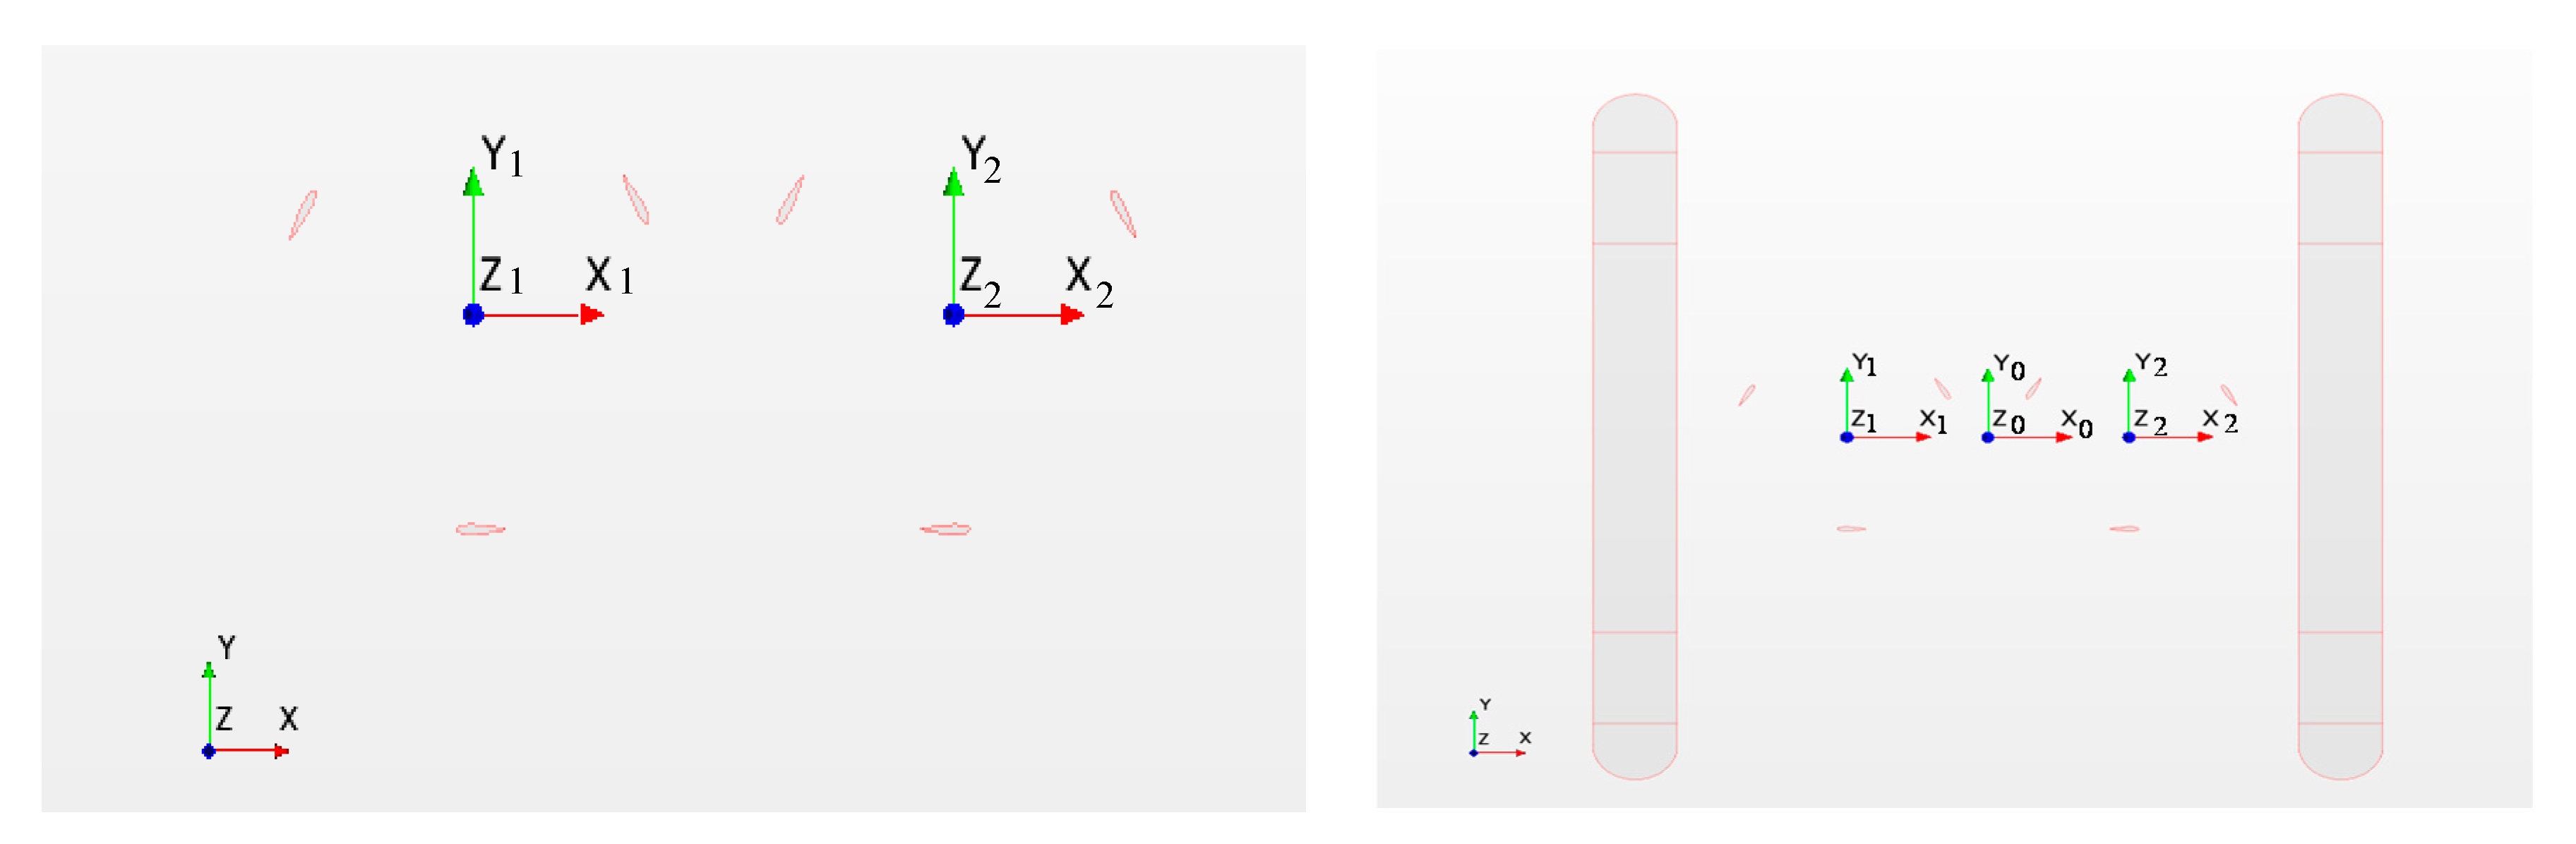
3. Numerical Research on the Performance of Vertical-Axis Twin-Rotors Tidal Current Turbine

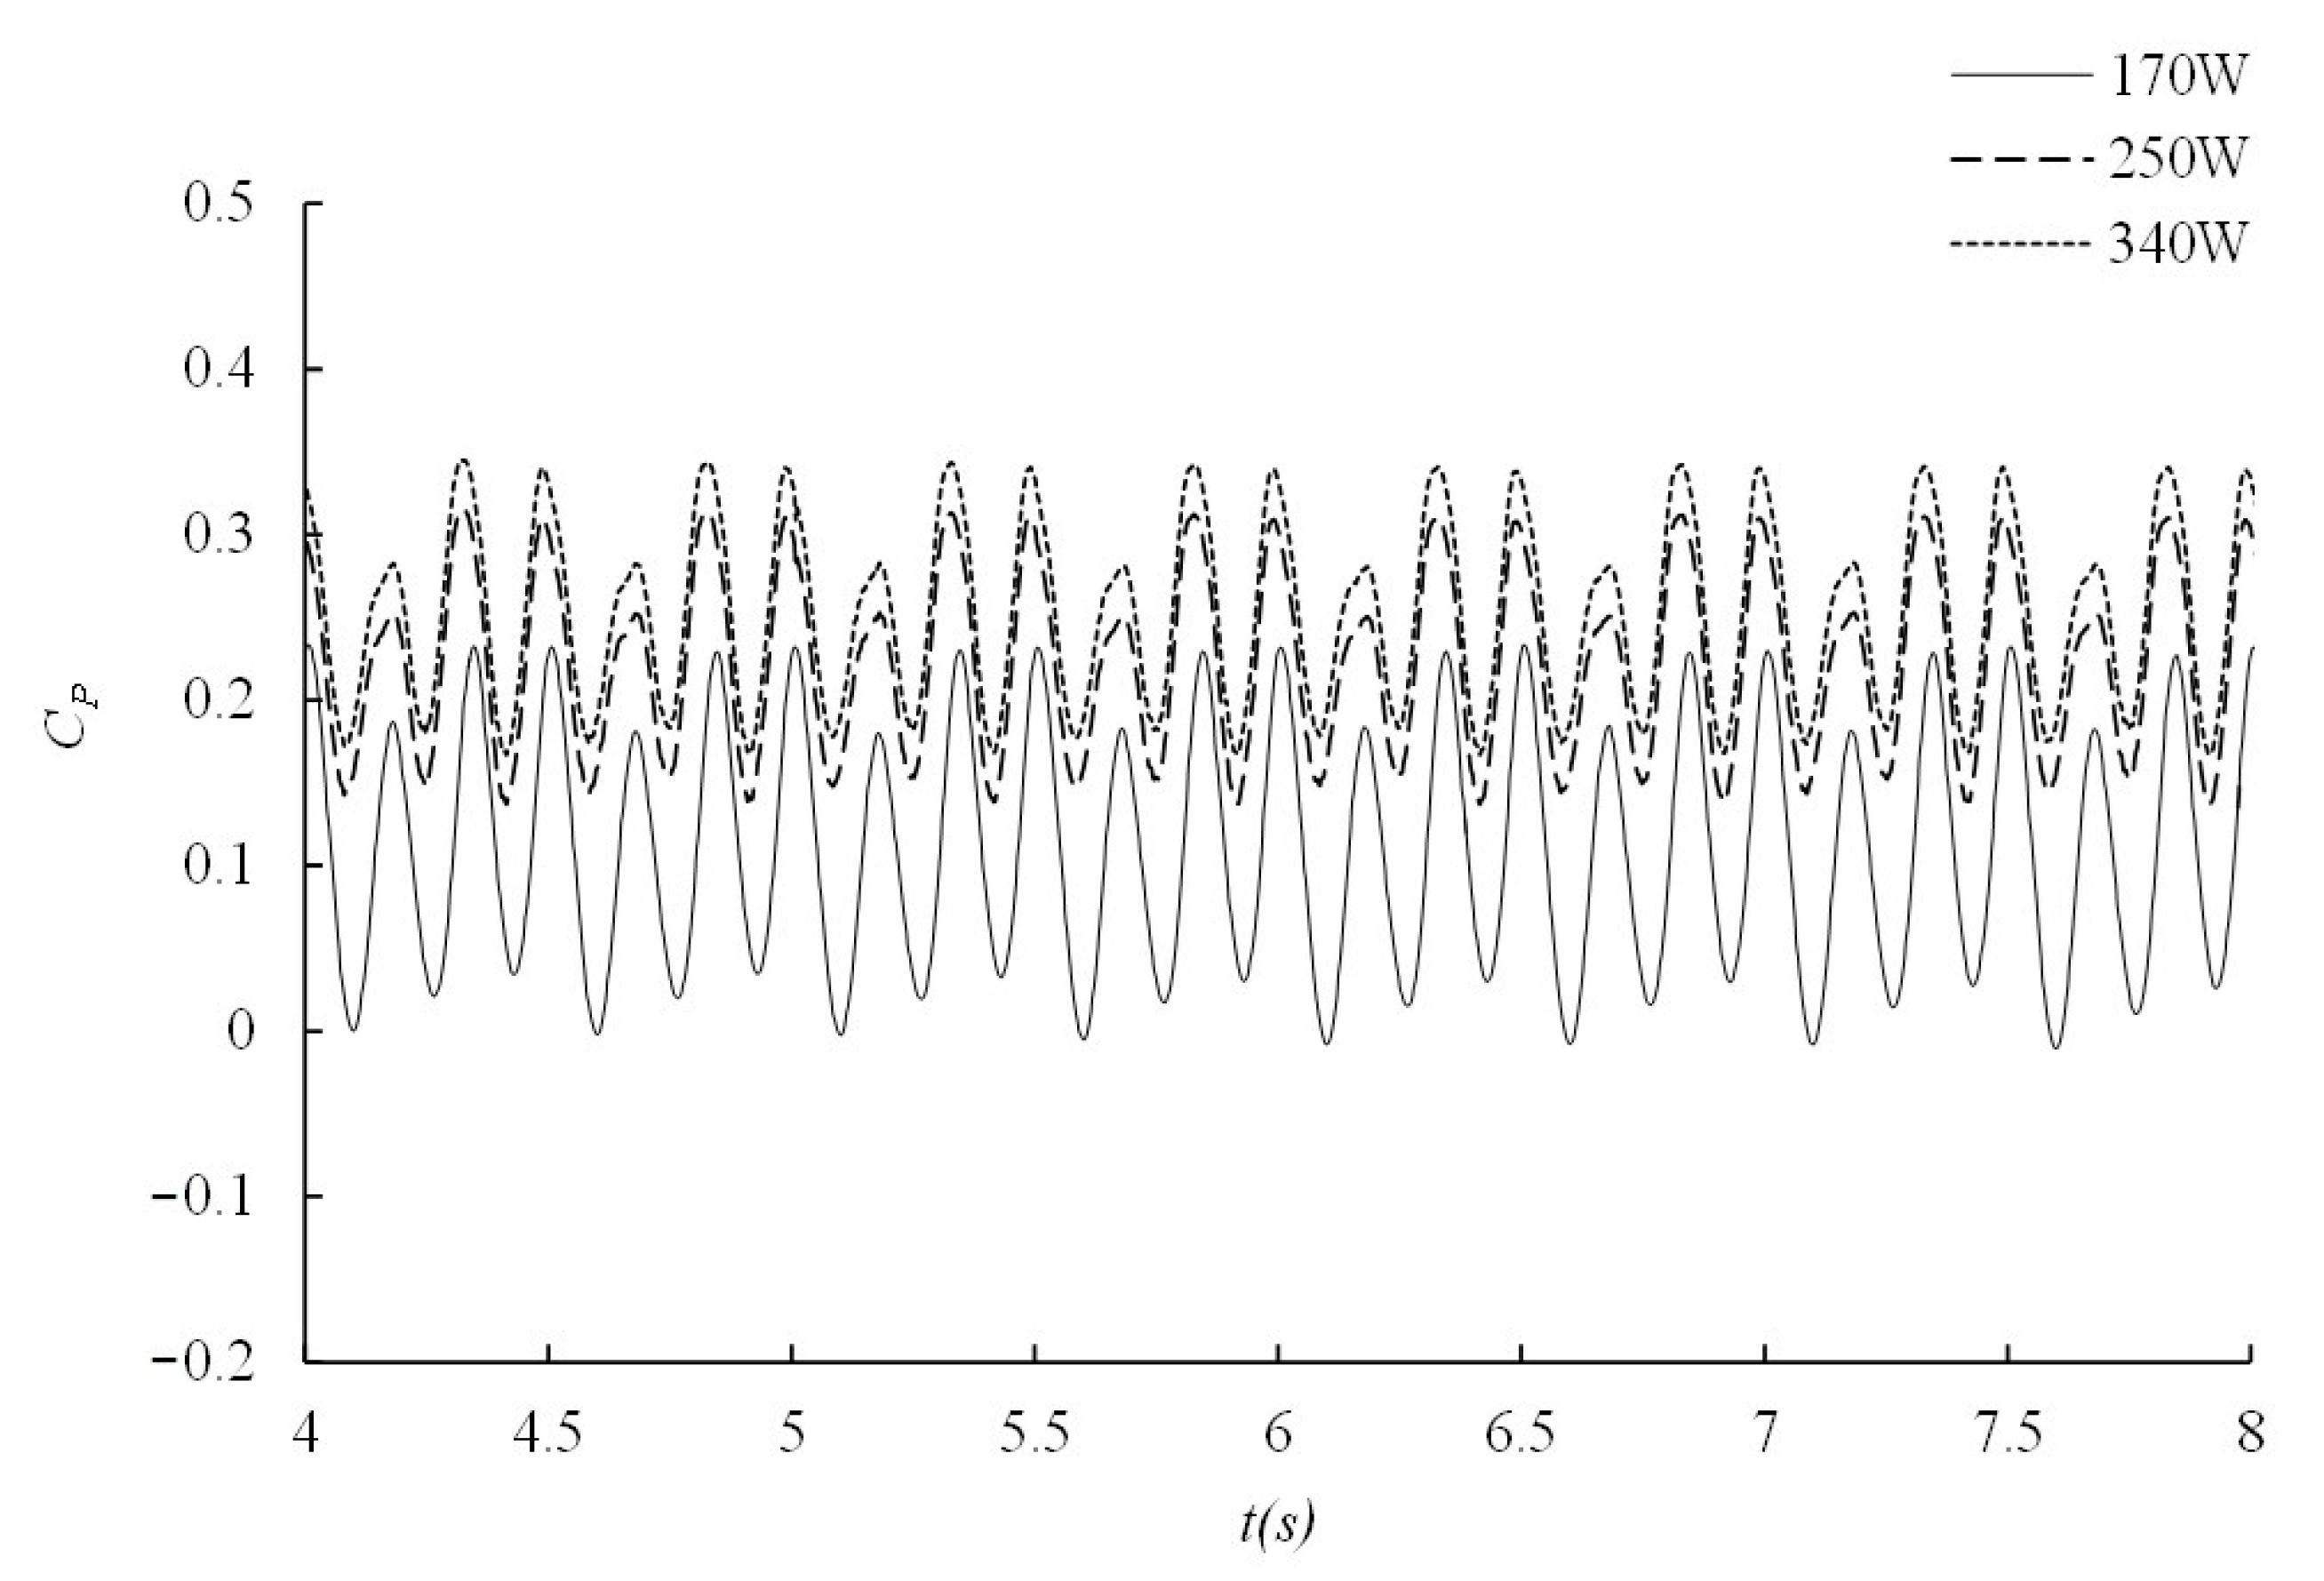
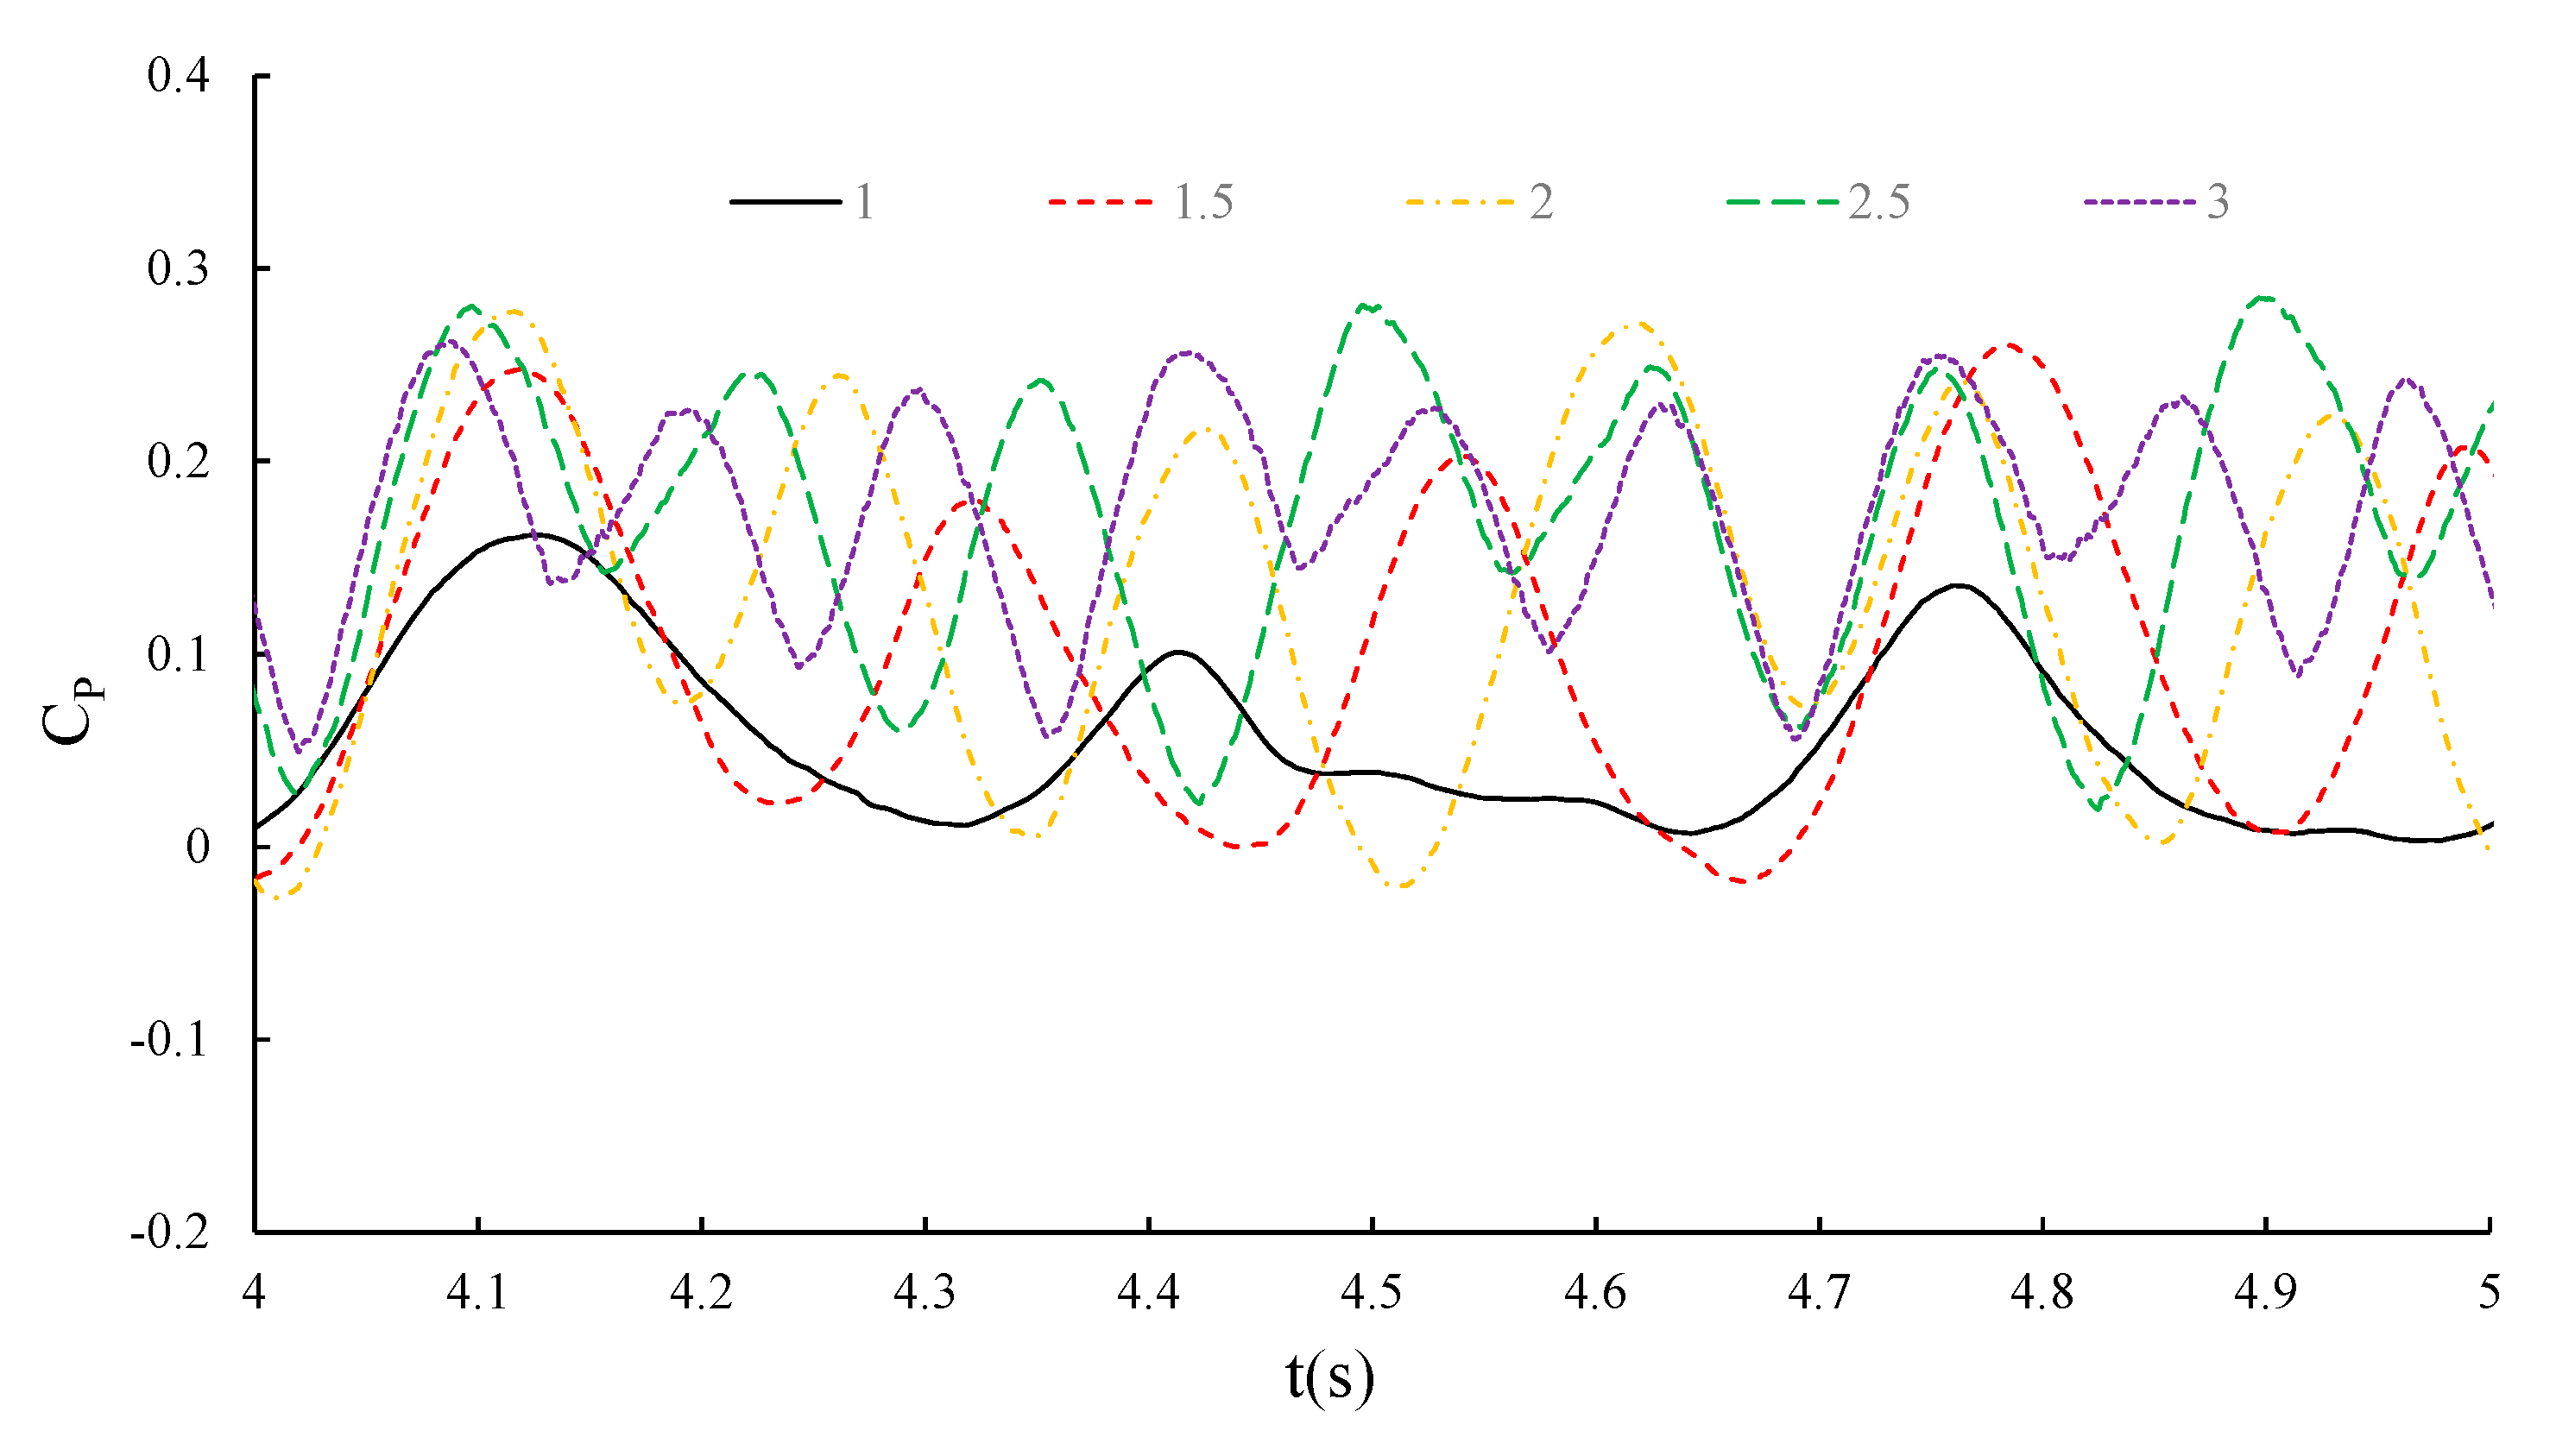
3.1. Numerical Verification of CFD Simulation

In the present research, all the simulations employed a semi-implicit method for pressure-linked equations (SIMPLE) solution algorithms. A second-order up-wind scheme was used for the convection terms. In the unsteady simulation of the floating power station, a second-order central difference scheme was used for the time discretization. Meanwhile, the overset method was used to avoid the computation divergence caused by the significant platform’s motion coupled with turbine rotation. In general, the computational is composed of a background domain, an overset refined turbine rotation domain, and a platform motion domain. Detailed discussions have been discussed in previously published literature [18,19].
The overall computational process for the DFBI analysis used in this study is well described in References [11,20]. The turbine rotation is coupled in the 6-DOF motions of the platform, which superimposes a body rotation in addition to the platform motion. The volume of fluid (VOF) and the 6-DOF motion solver is used to solve the fluid-induced motion of the FTCPS in a two-phase flow composed of water and air. The catenary mooring line method is used to model the four mooring lines attached to the FTCPS in time domain.

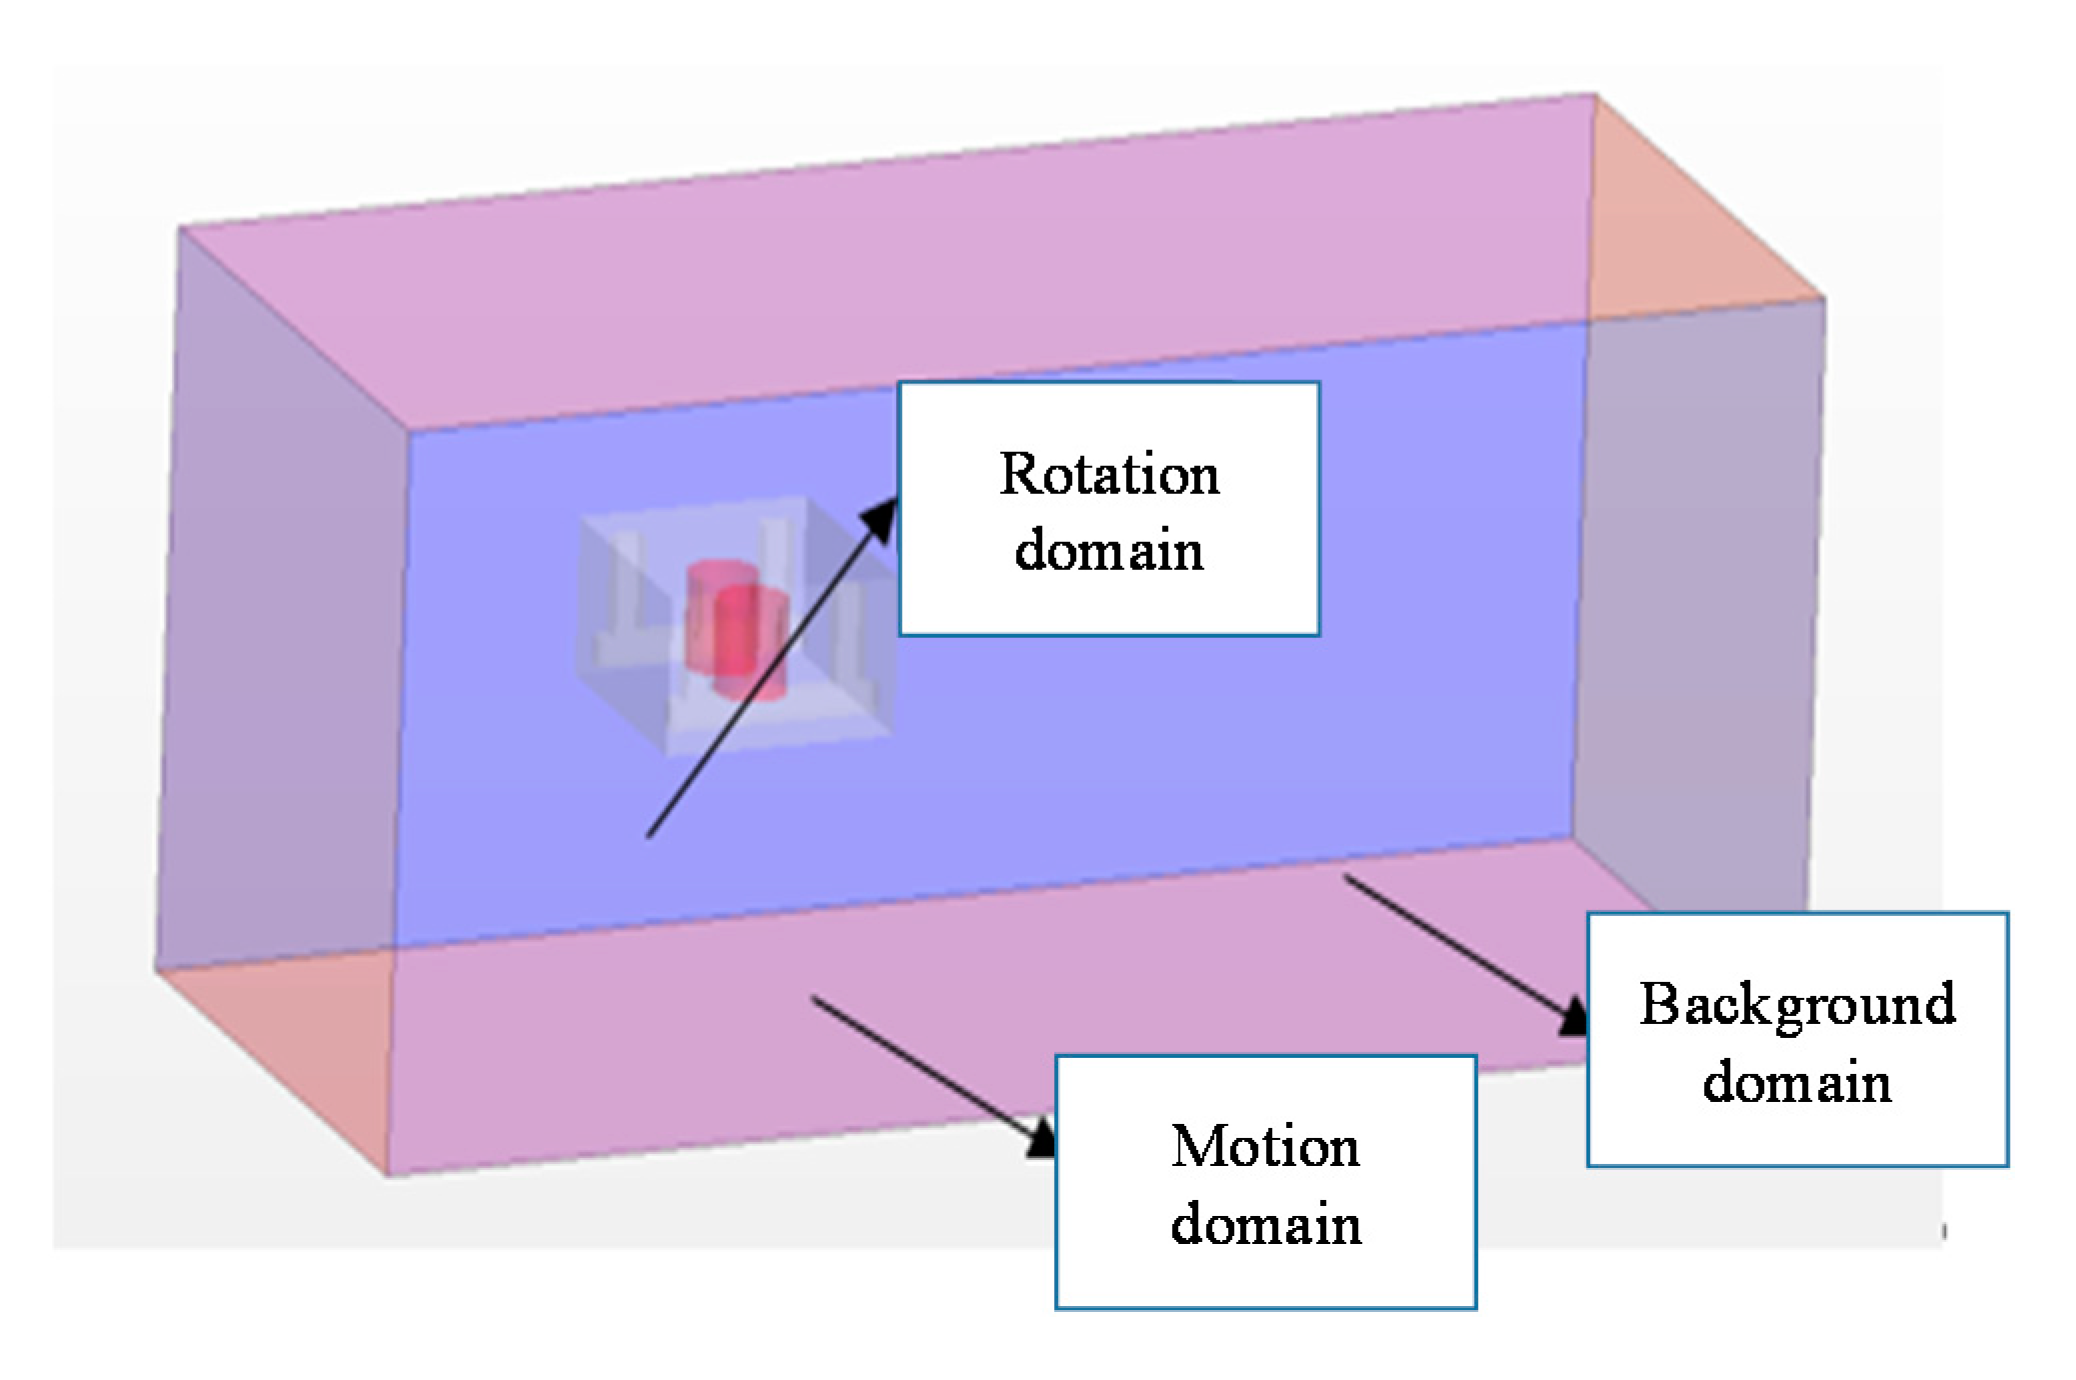
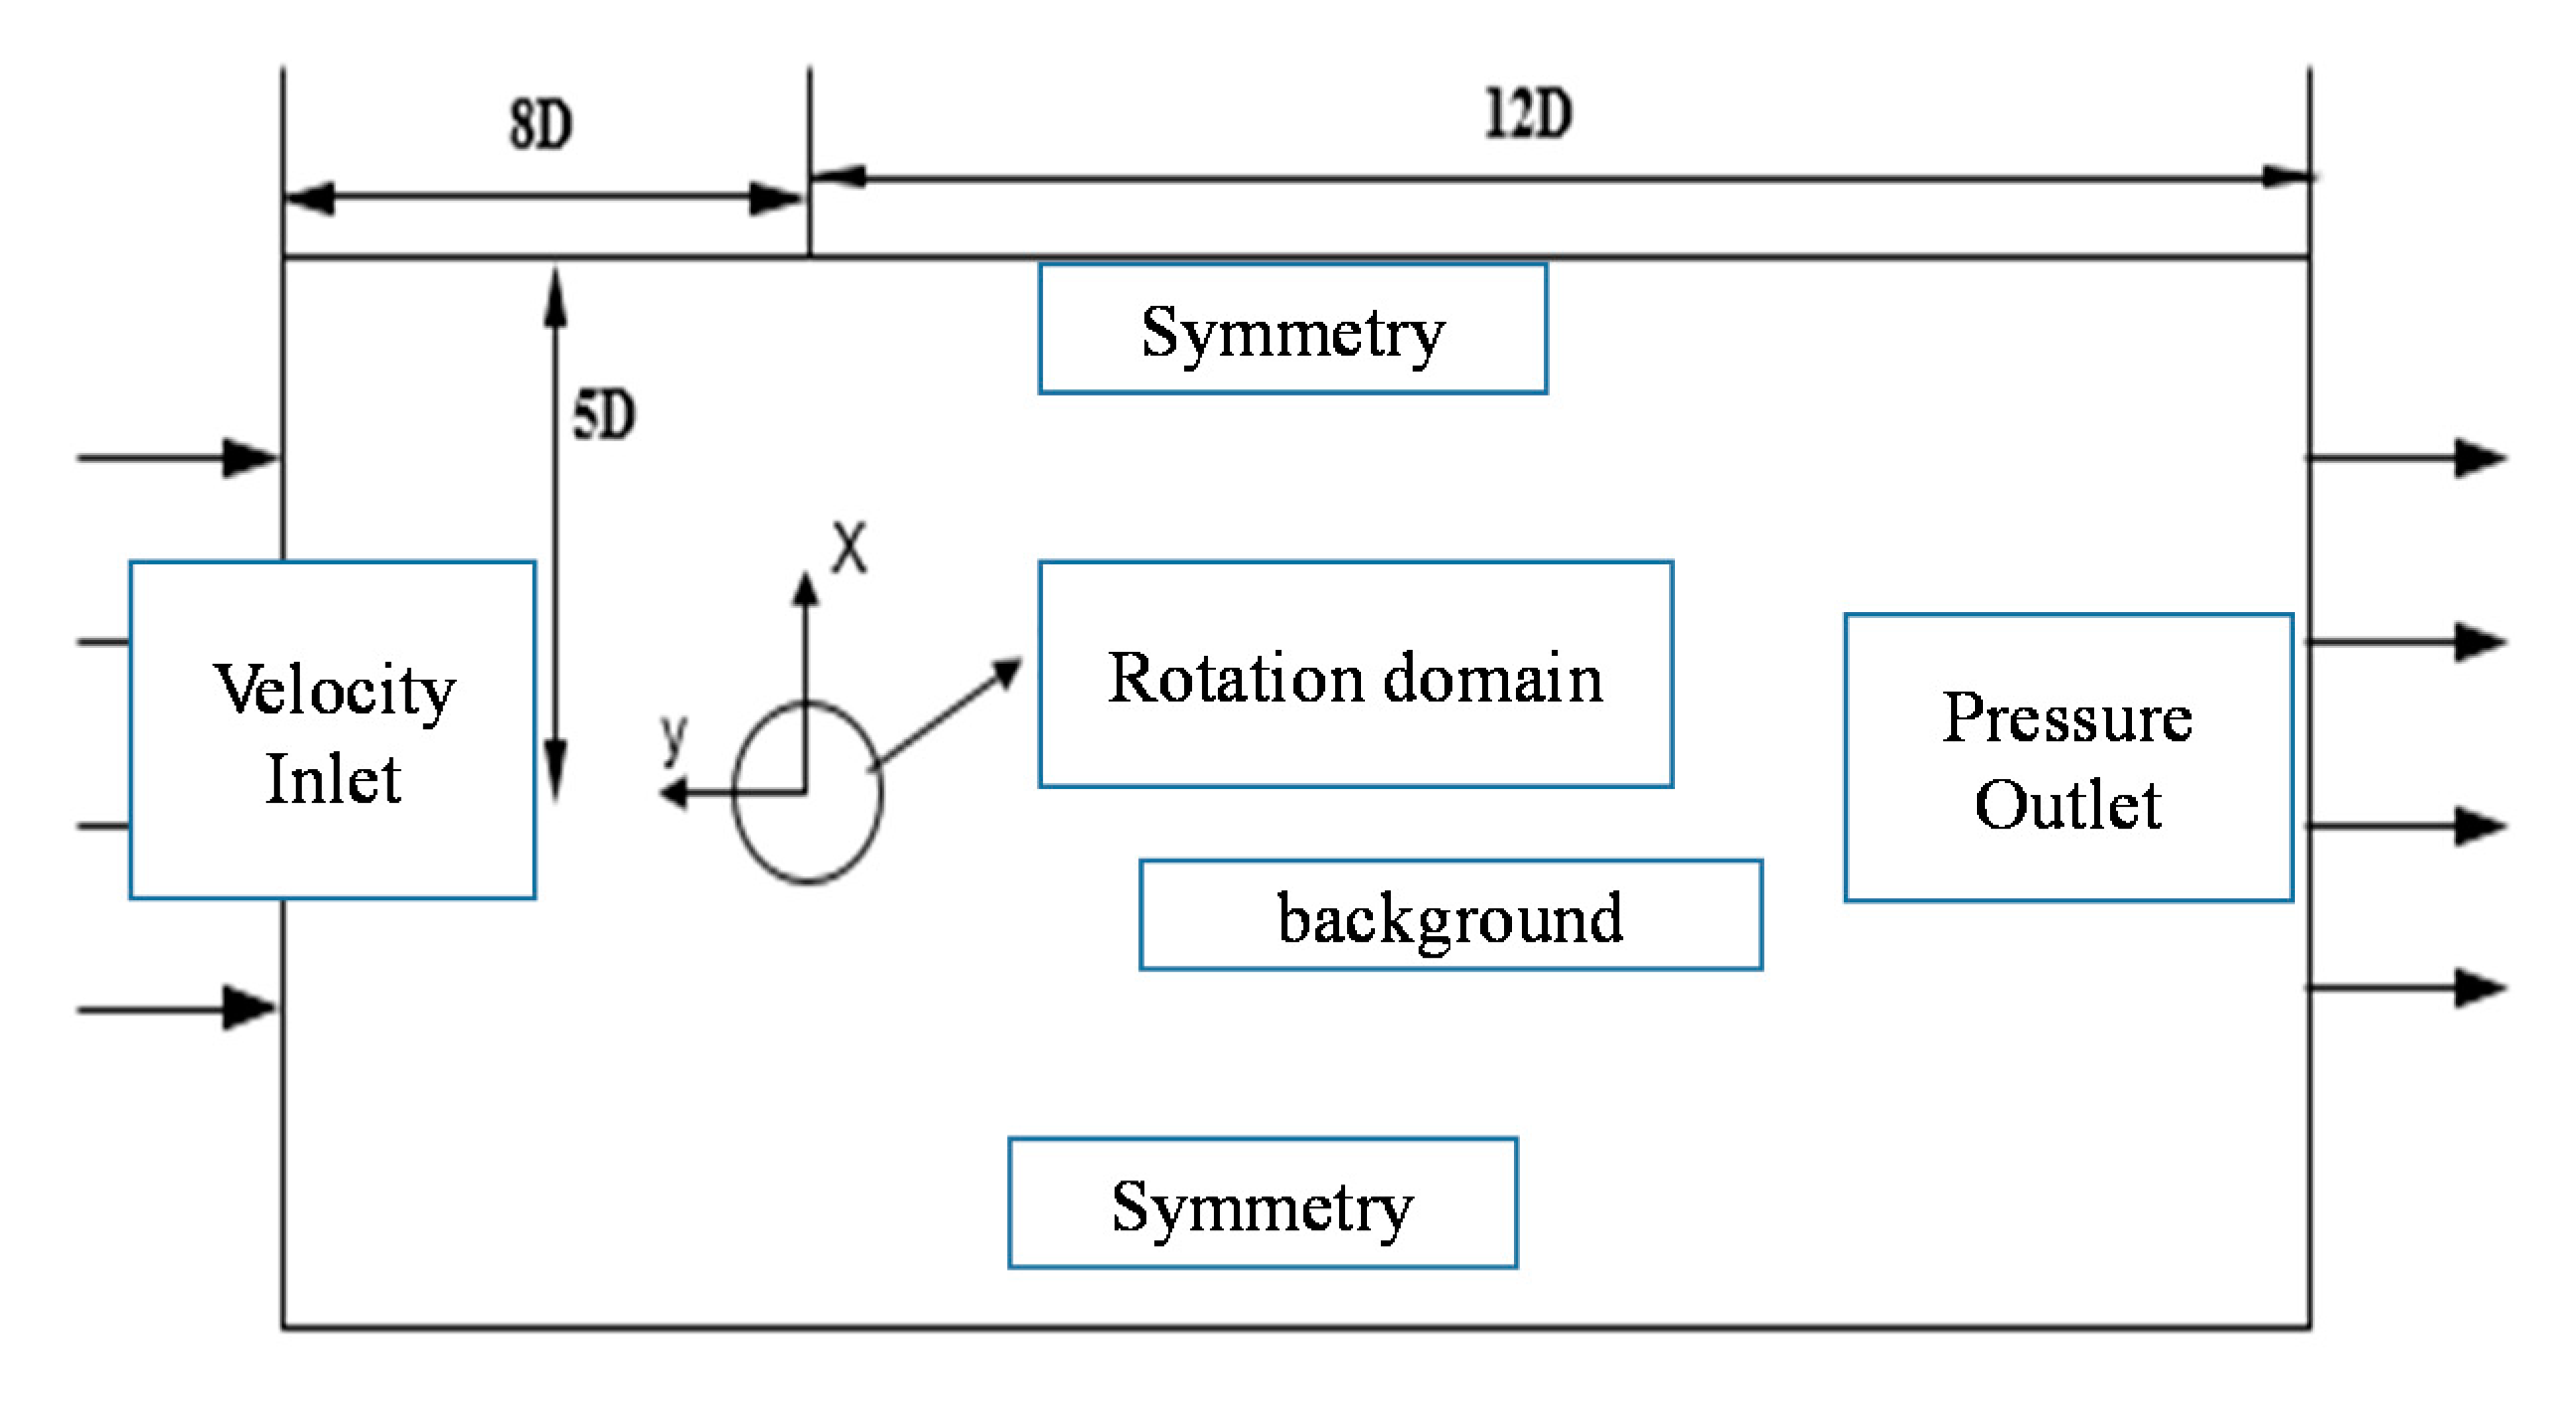
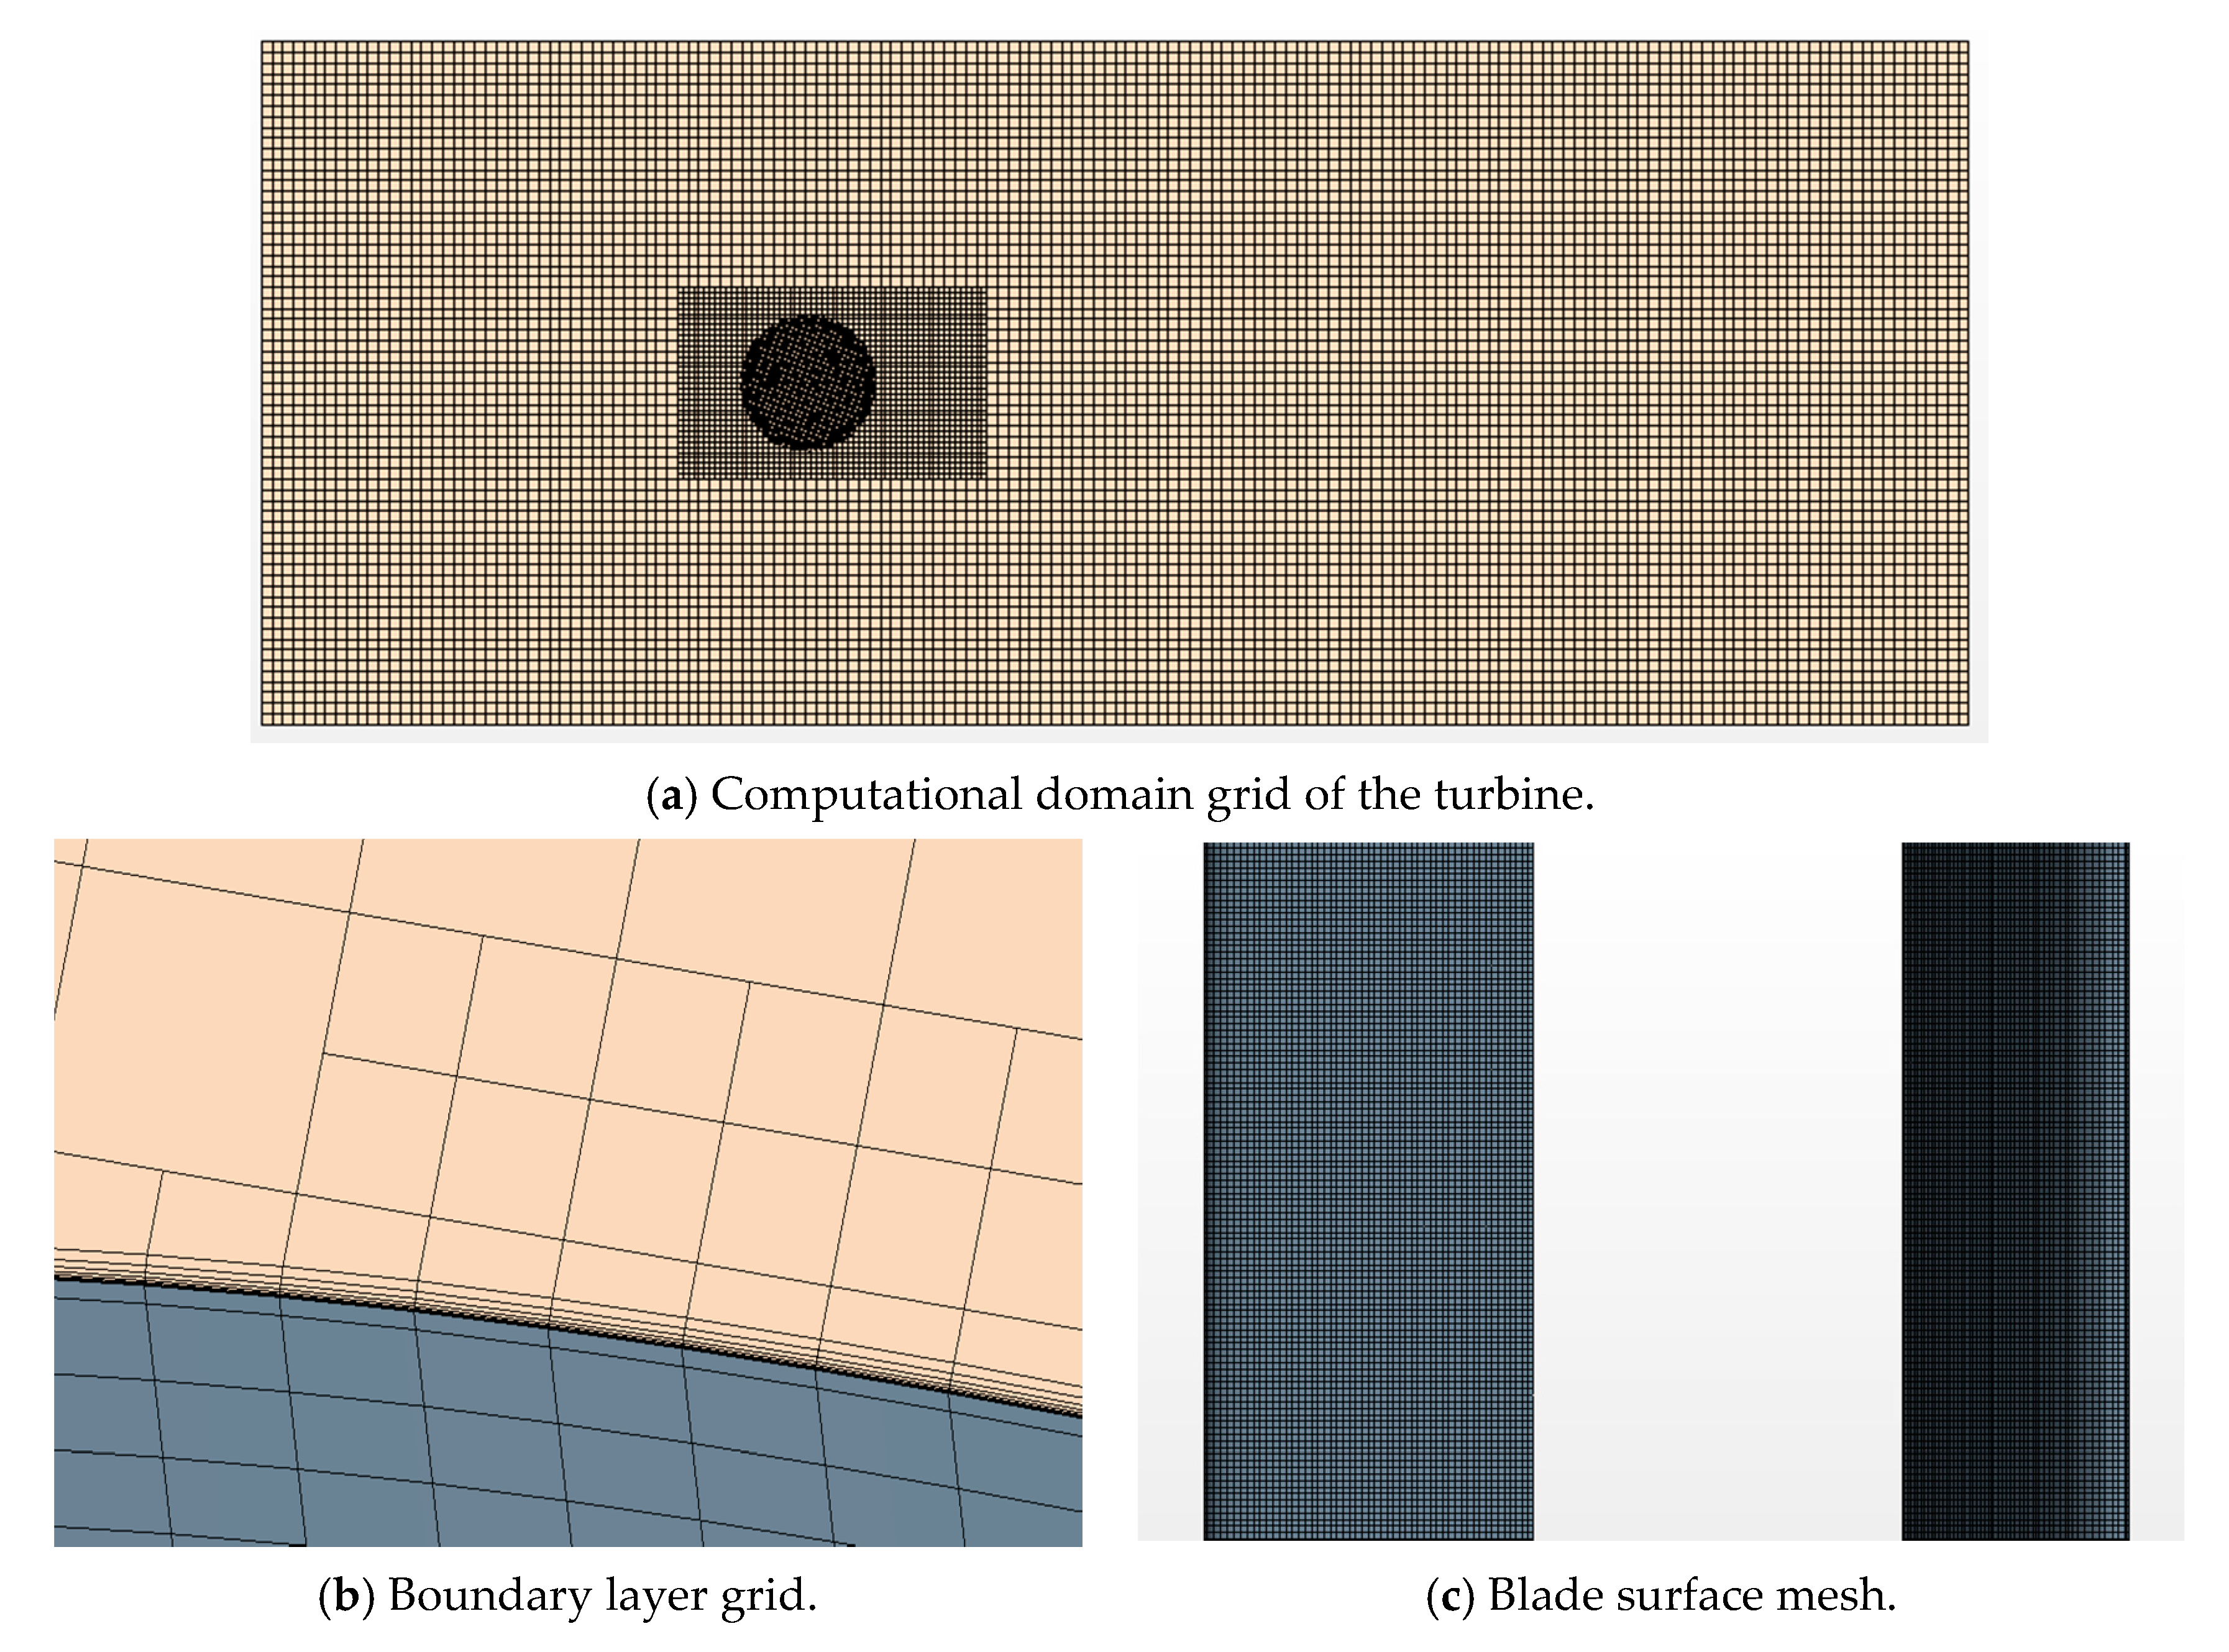
3.2. Computational Domain Settings

In the present numerical simulations, a global fixed coordinate system (XYZ), one 6-DOF coordinate system (X0Y0Z0), and two local rotating coordinate systems (X1Y1Z1 and X2Y2Z2) has been established in the computational domain. As shown in Figure 5a,b, in the simulation process, the left turbine rotates clockwise in X1Y1Z1 by the Z1-axis, while the right turbine rotates counterclockwise in X2Y2Z2 by the Z2-axis. This internal counter-rotation method can maximize the power output of the twin-rotor system, which has been proved by many researchers [12]. As has been mentioned in Section 3.1, the rotation coordinate (X1Y1Z1 and X2Y2Z2) of the twin-rotor turbine is coupled with the platform’s body motion coordinate X0Y0Z0. The carrier is set as a DFBI body. The carrier and the turbine are connected by a virtual hinge. The virtual hinge can transmit the force and momentum between the carrier and the turbine at each time step.
As Figure 6 shows, the four catenary mooring lines are symmetrically attached to the platform, forming an angle of 30 degrees with the incoming flow direction (the Y-axis direction). The mooring line simulation is based on quasi-static theory. The net weight of the mooring line is 10 kg/m, and the overall length of each line is 7 m.
When calculating the coupled motion of the carrier, turbine and mooring system are under uniform flow conditions. There is a two-phase flow in the numerical model due to free surfaces. VOF (Volume of Fluid) is an effective numerical technique for free surface modelling based on the Euler method [21]. Therefore, the VOF fifth-order wave model is used to simulate the numerical tank.
As Figure 7 shows, the whole computational domain is divided into three sub-domains: background domain, rotating domain, and moving domain. The background domain and the moving domain are connected by overset. The implementation of overset method can reduce the risk of computational divergence resulted from the large movement of the carrier. The rotation domain and the background domain are also connected by the overset method.
The size of the whole computational domain is shown in Figure 8. The numerical tank measures 20D × 10D × 10D (D is the diameter of the turbine). The entrance of the computational domain is set as velocity inlet, and the incoming flow speed is 1.5 m/s. The outlet and the top of the computational domain is set as pressure outlet, and the relative pressure is set as 0 Pa. The bottom is set as a solid wall. Both sides of the computational domain are set as symmetry planes.
The trimmed cell mesh technique was used in the mesh generation for the whole numerical simulation cases. Due to the complex rotation and 6-DOF movement of the turbine, the mesh around the turbine blade has been refined to capture the flow separation and accurately simulate the mesh around the turbine blade, and the free surface has been refined to accurately simulate the physical scene and capture the flow separation near the blade surface. The mesh around the interface between the water and the air has also been refined to maintain the stability and accuracy of free surface in space and time. The generated computational domain grid, boundary layer grid, and blade surface grid are shown in Figure 9a–c. During the mesh generation around the blade surface, there are 8 layers inside the boundary, with a first layer of 0.0004 m and a progression ratio of 1.5.
For the numerical simulation under uniform flow conditions, due to the existence of the free surface, the motion of the carrier and the turbine will lead to the mesh deformation of the free surface. Therefore, the surrounding grid needs to be encrypted to maintain the stability of the free surface in space and time. At the same time, to reduce the error caused by the iterative transmission of data between grids, this paper encrypts the grid from the rotation domain to the background domain layer by layer, and the overall grid division of the computational domain is shown in Figure 10.
Notably, a grids independency test has been carried out to keep a balance between computation efficiency and computation resources. Three different refined meshes (coarse mesh: 170 W, medium mesh: 250 W, fine mesh: 340 W) have been simulated, and the results are shown in Figure 11. The difference between the medium mesh and the fine mesh is relatively small, while the coarse mesh tends to underestimate the power output efficiency of the turbine. Thus, the fine mesh has been selected in the following numerical simulations.

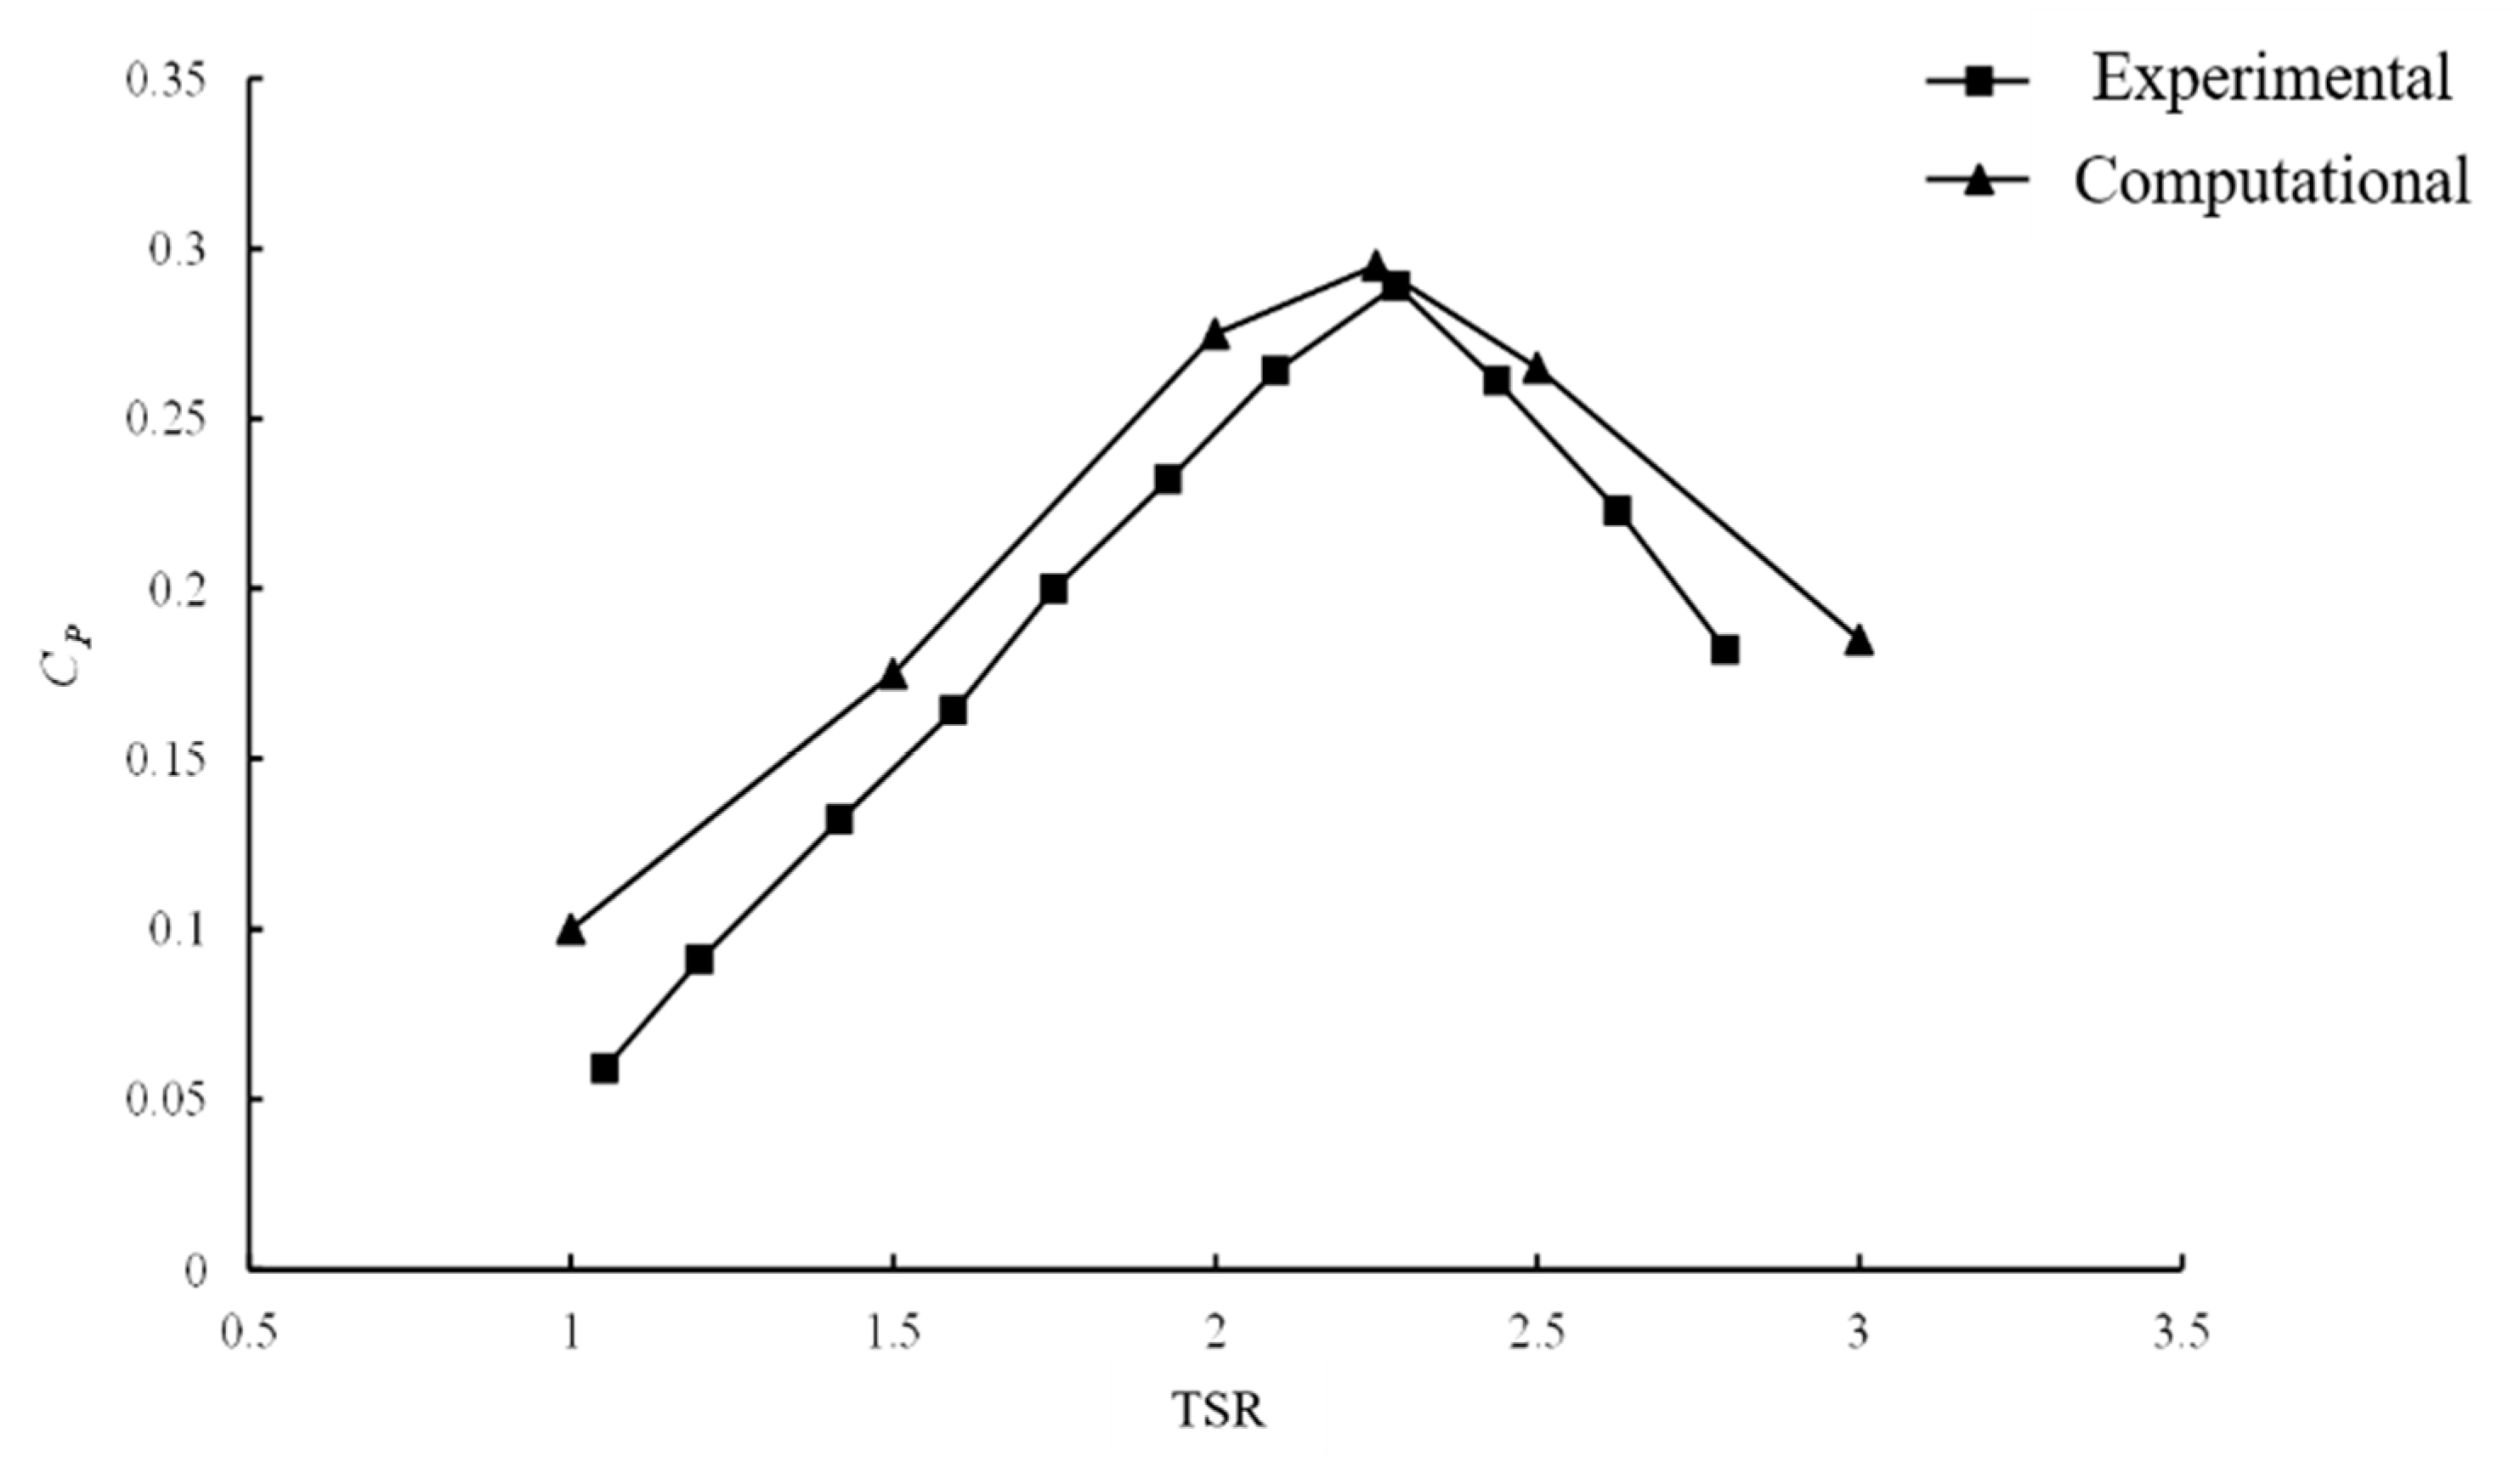
3.3. Validation of the Computational Model

Figure 12 shows the comparison between the numerical simulation results and the corresponding model test results [22]. The test model parameters are consistent with the turbine parameters designed in this paper. It can be seen that, as the speed ratio increases, the turbine power output efficiency (Cp) first increases and then decreases. The value difference between the experiment and numerical simulation at the best speed ratio is small, and the overall trend is in good agreement. However, since the mechanical friction, free liquid surface, and waves are not considered in the numerical simulation, the computational results are a little higher than the experimental results. The simulation error does not exceed 10% (within the error range) in the low-speed ratio area. In general, the simulation results of the CFD numerical simulation method for the vertical axis turbine are in good agreement with the test results, which verifies the reliability of the CFD numerical simulation method for computing the hydrodynamic performance of the vertical axis turbine.

4. Results and Discussions

4.1. Influence of Speed Ratio on the Hydrodynamic Characteristics of Hydraulic Turbine
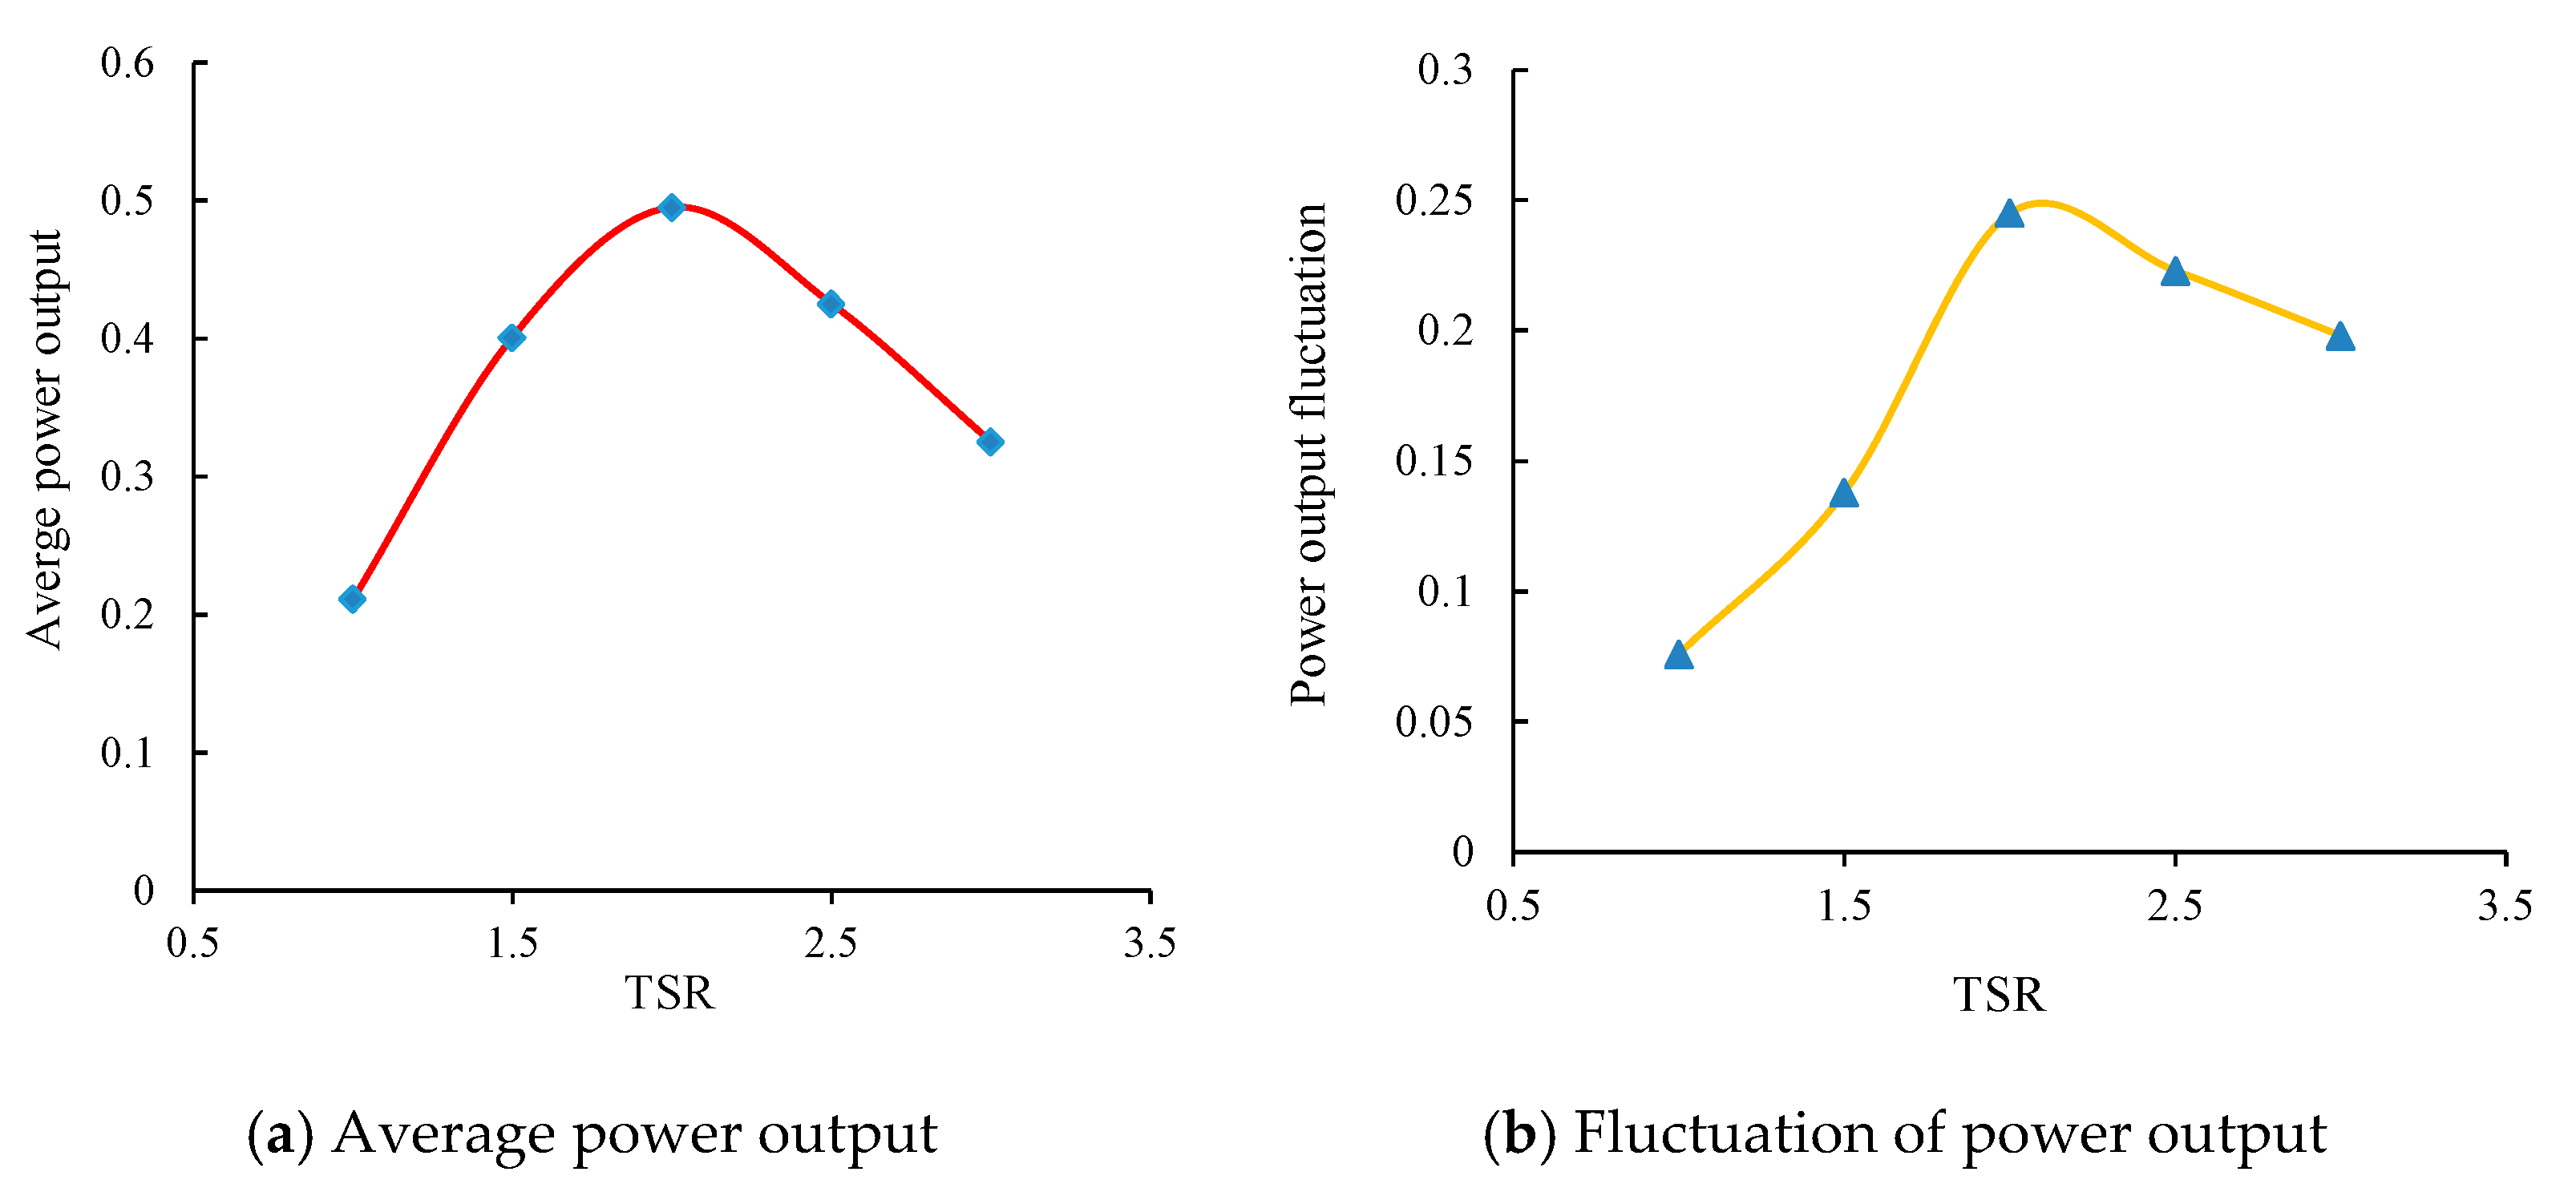
During the operation of a floating tidal current power station, the tidal current speed is not always constant. In order to maximize the power output of the turbine, it is necessary to adjust the rotation speed of the turbine. This section discusses the changing tendency of the hydrodynamic characteristics of the floating turbines under different tip speed ratios (1, 1.5, 2, 2.5, 3). The incoming flow velocity is 2.5 m/s, and the direction is along the negative direction of the y-axis.

4.1.1. Power Output

Figure 13 shows the time history curve of turbine power output efficiency at different tip speed ratios (TSRs). It can be seen that, under the condition of uniform flow, the power output efficiency changes periodically, and its change period is consistent with the rotation period of the turbine. Sawtooth line sections could be observed at the time history curve of the turbine power output curve when the TSR is low. When the turbine is operating at low TSR, flow separations occurs around the blade surfaces, which caused the blade force fluctuations.
Figure 14 shows the fluctuation amplitude ( C ^ p ) and average value ( C ¯ p ) of power output efficiency of the turbine at different speed ratios. It can be seen that, as the speed ratio increases, both C ¯ p and C ^ p first increase and then decrease. When the speed ratio approaches 2, both C ¯ p and C ^ p reach their maximum values. Meanwhile, when the speed ratio is increasing from 1 to 2, the increasing trend of C ^ p is faster than that of C ¯ p , and, when the speed ratio is from 2 to 3, the decreasing trend of C ¯ p is slower than C ^ p .

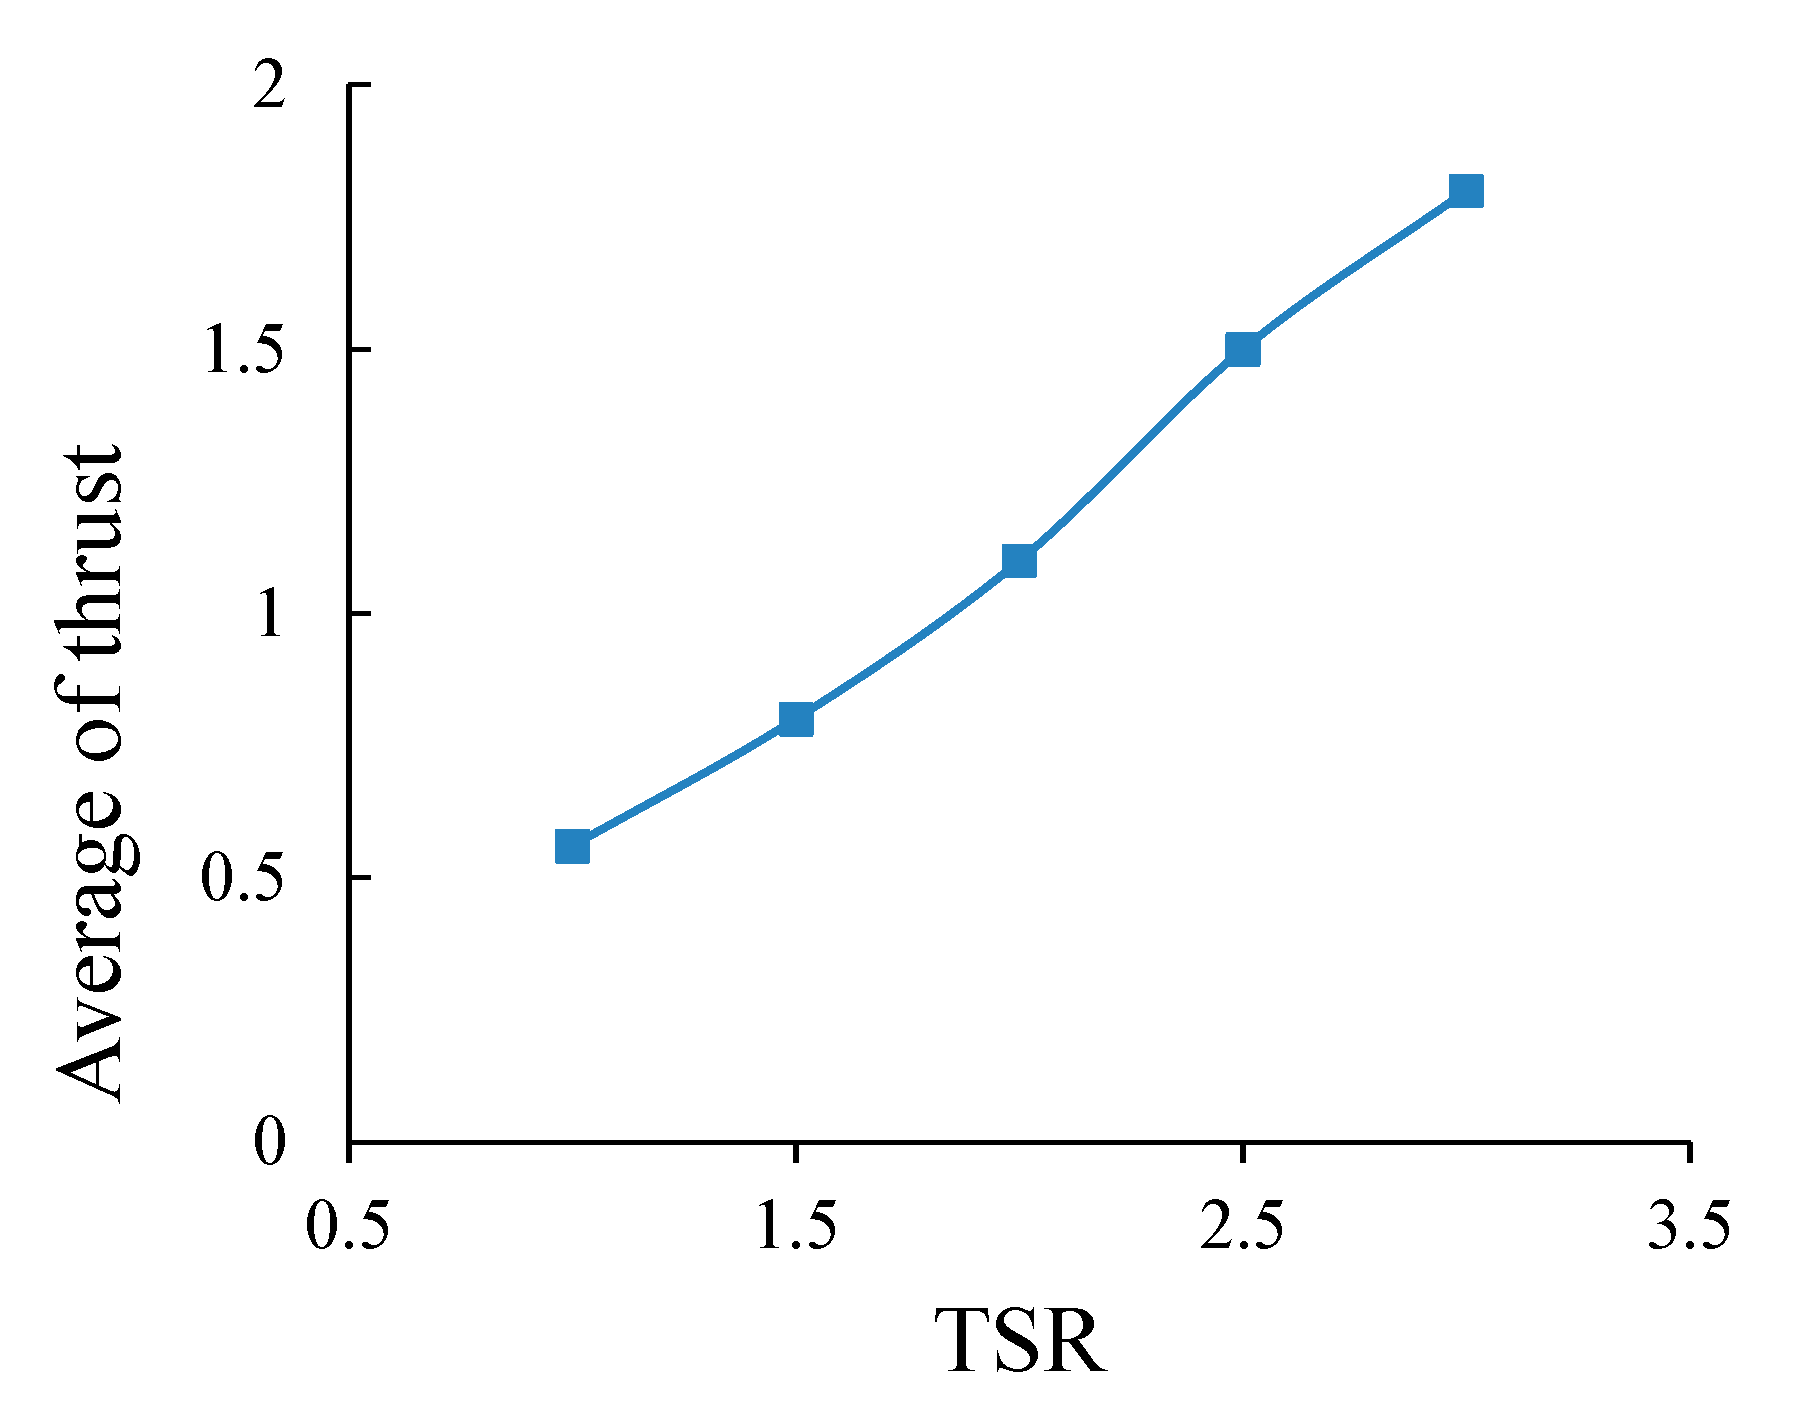
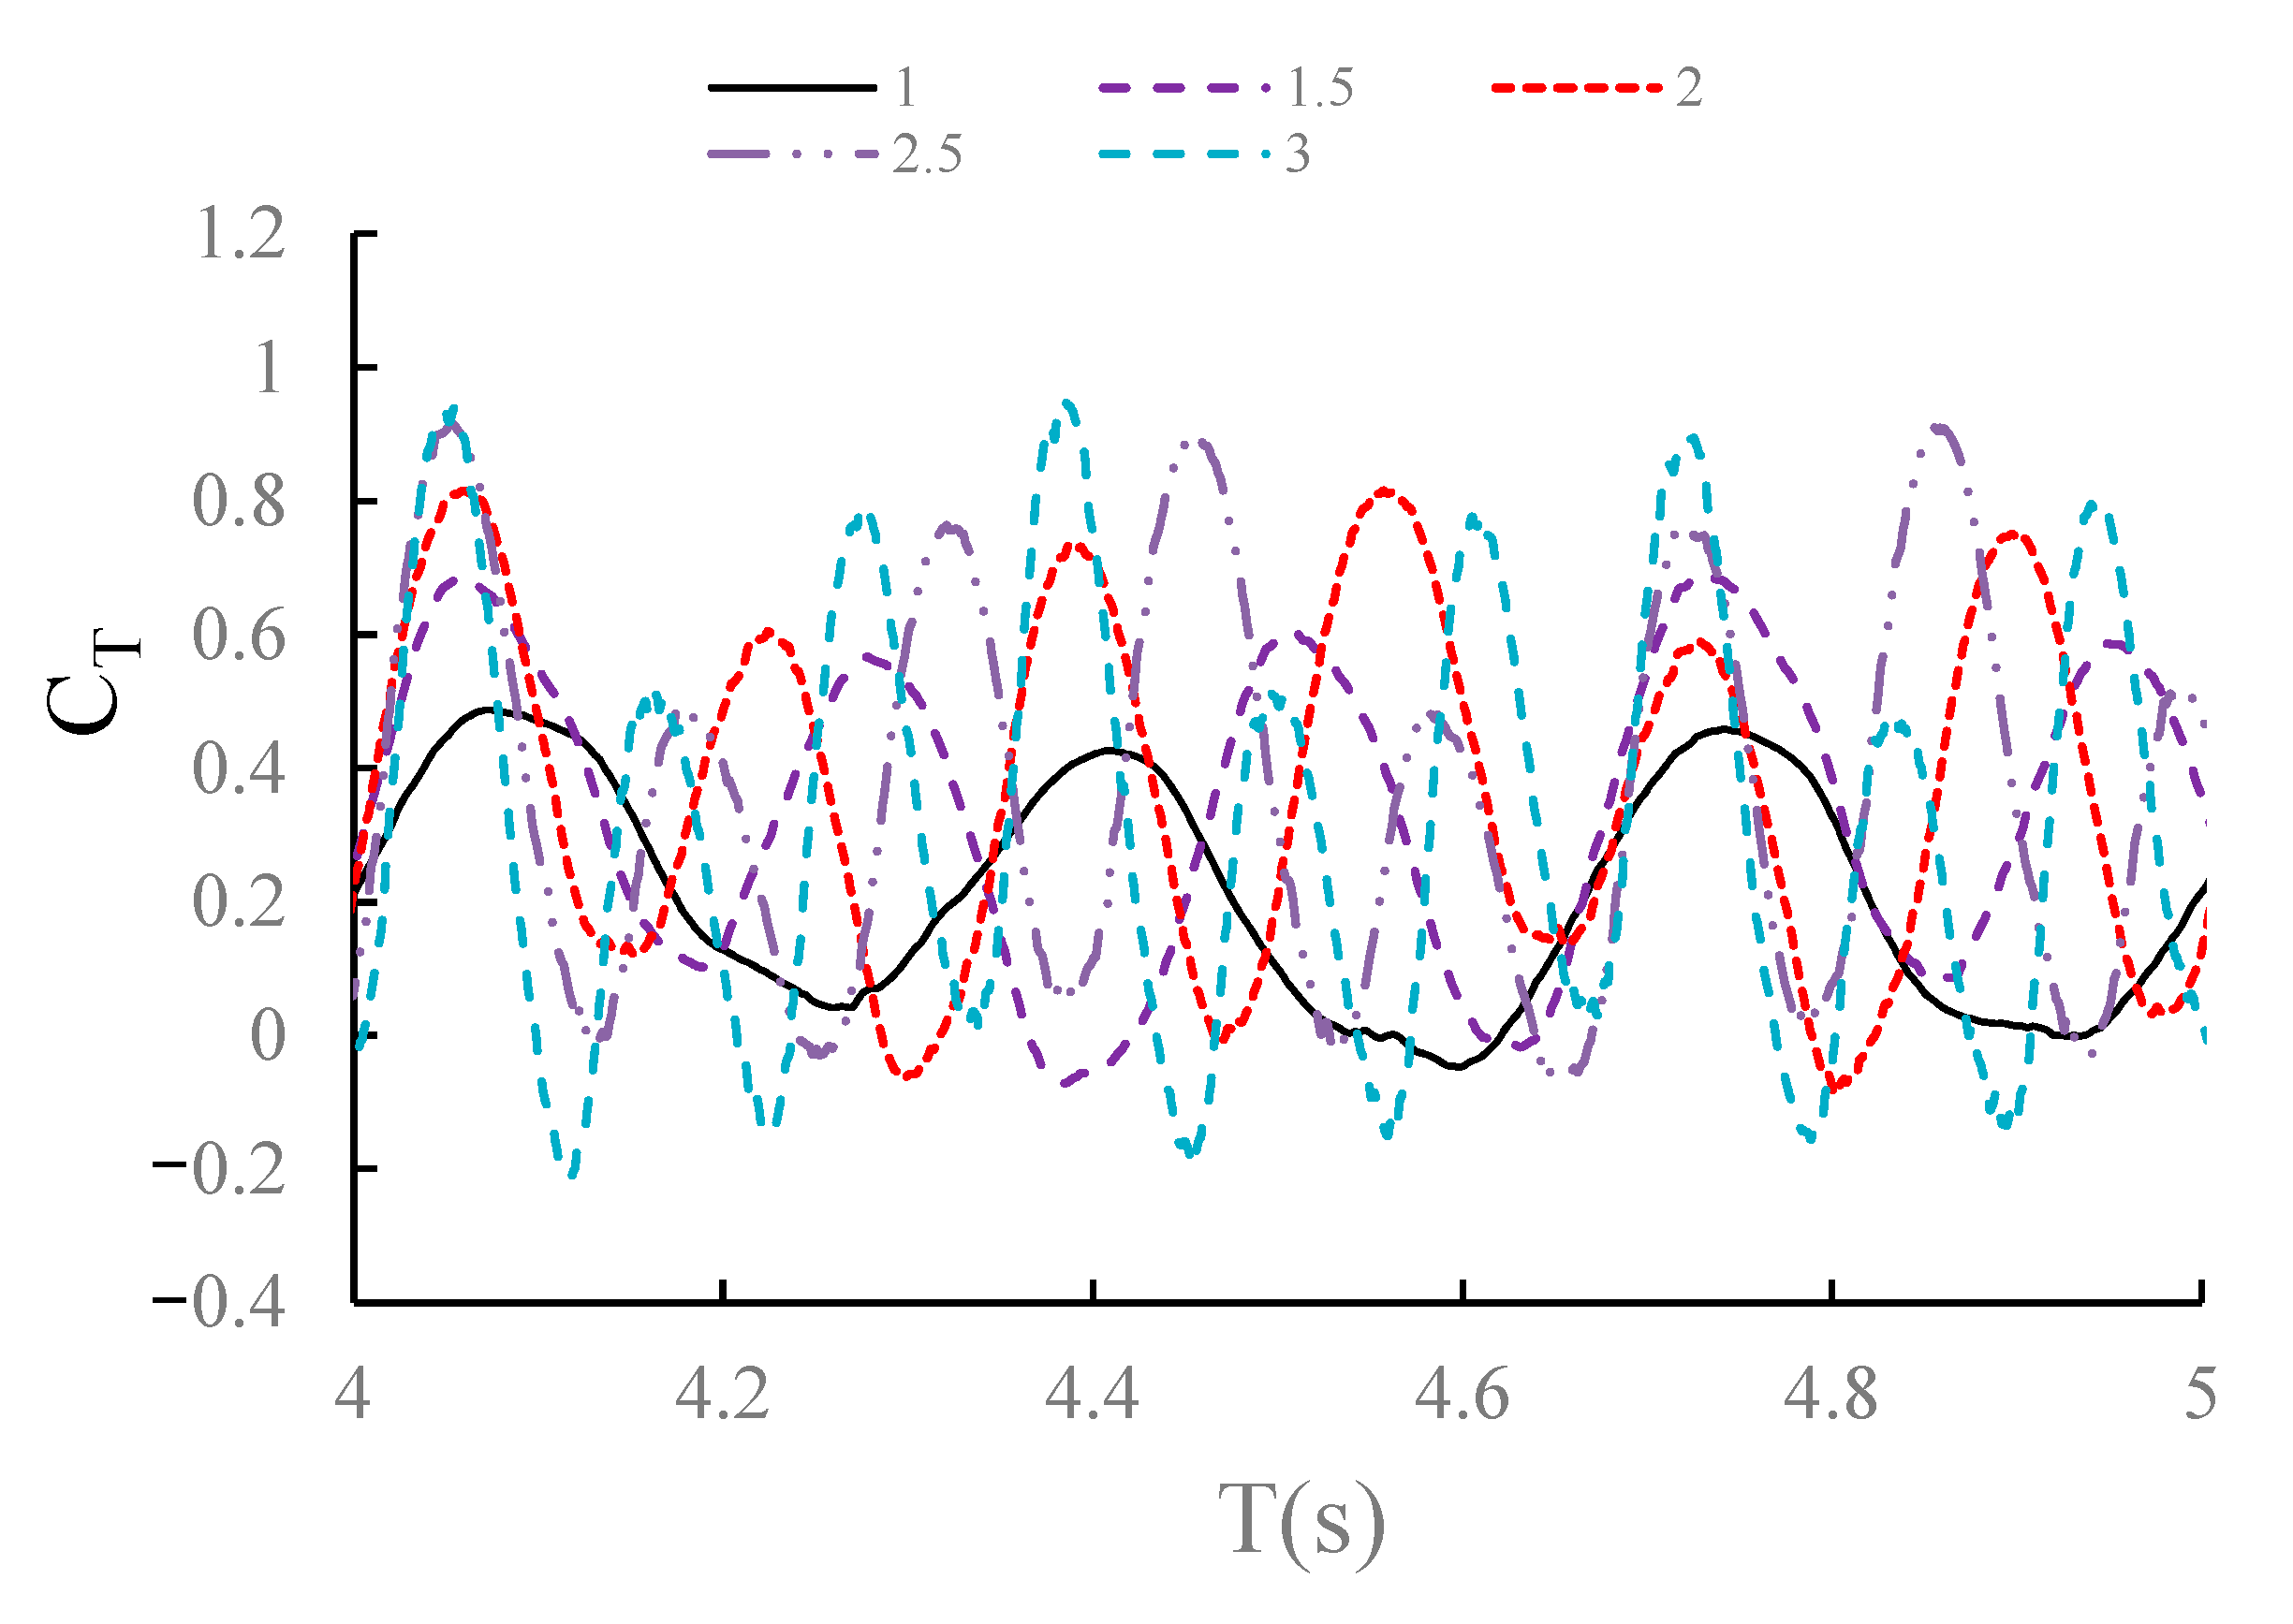
4.1.2. Thrust Coefficient

Figure 15 shows the time history curve of the thrust coefficient of one of the turbine at different TSRs. It can be seen that, as the TSR increases, the fluctuation rate of the thrust coefficient becomes more intense. It can be seen from Figure 16 that the average thrust coefficient ( C ¯ T ) is positively correlated with the change of the speed ratio because the thrust of the hydraulic turbine increases with the increase of the speed ratio.

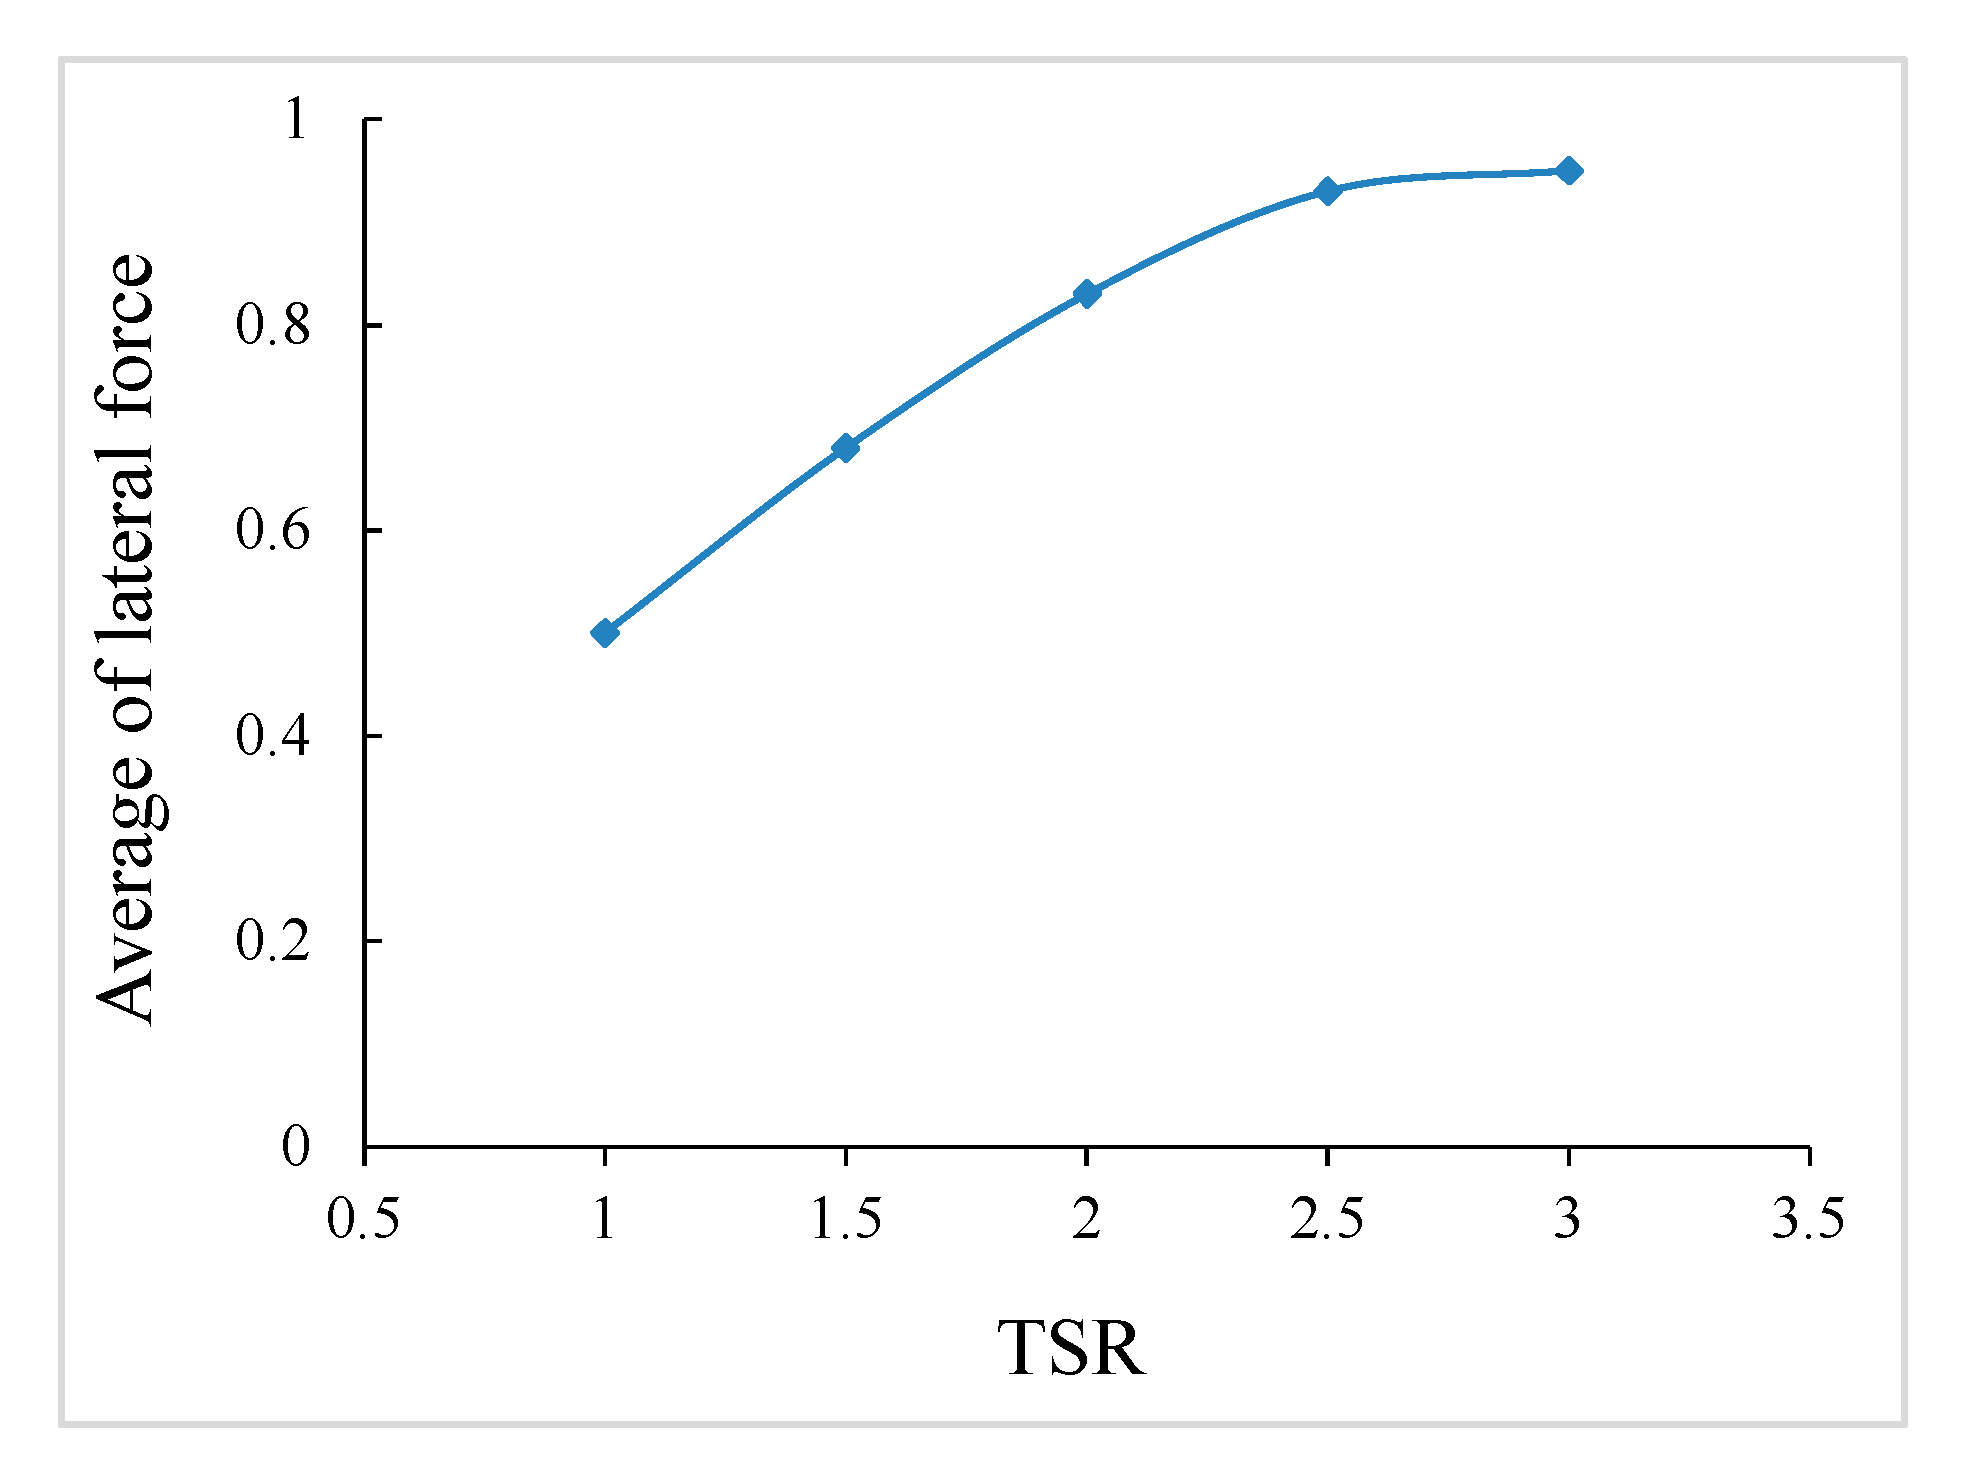
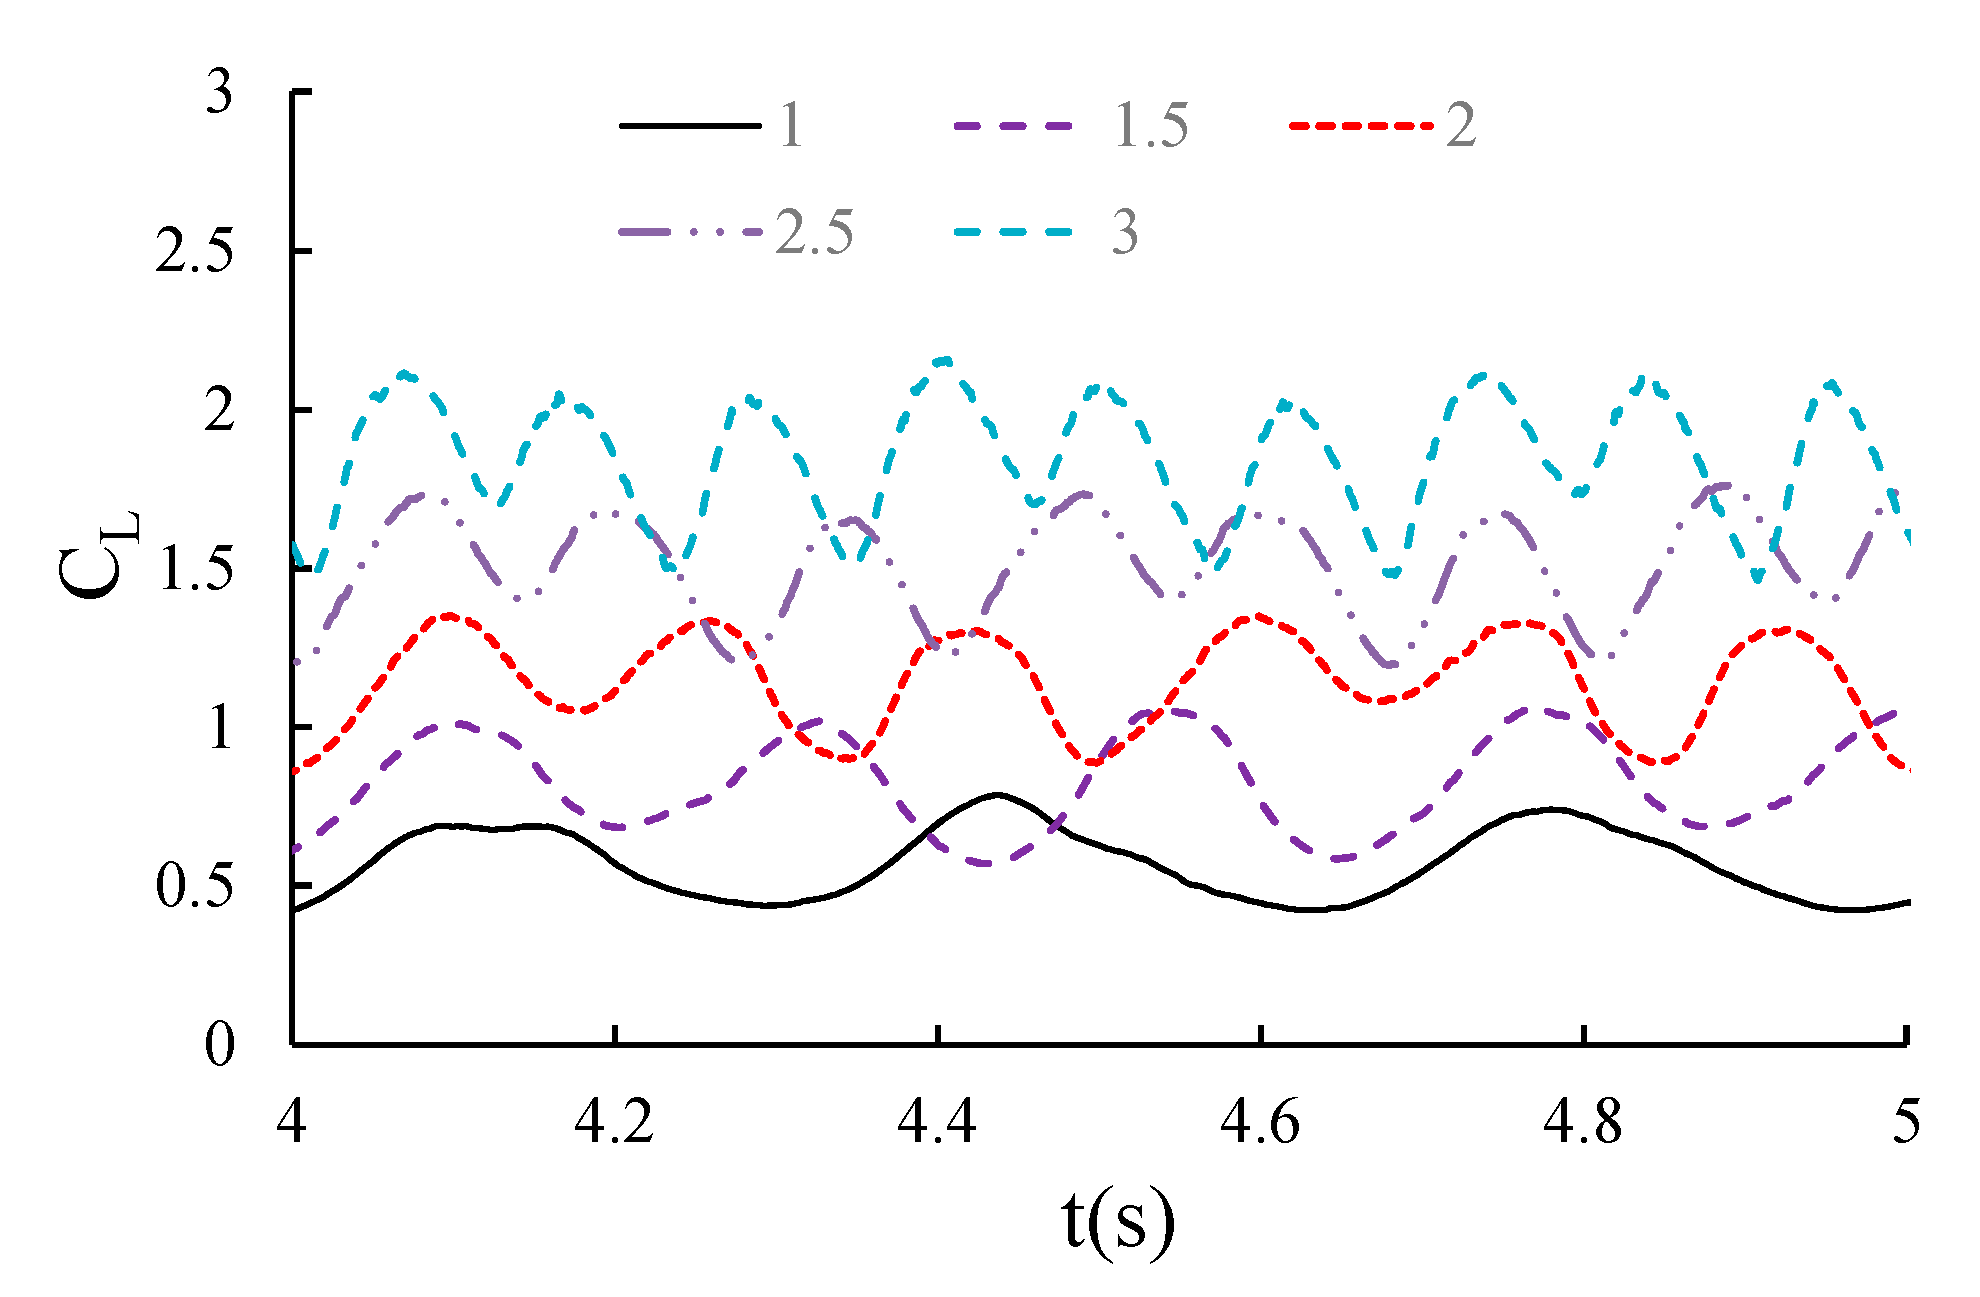
4.1.3. Lateral Force Coefficient

Figure 17 is the time history curve of the lateral force coefficient of a single turbine at different speed ratios. It can be seen that the lateral force coefficient of the hydraulic turbine changes periodically, and its change period is consistent with the rotation period of the hydraulic turbine. When the speed ratio is low, the lateral force fluctuation of the hydraulic turbine is small. As the speed ratio increases, the lateral force coefficient of the turbine increases, and the fluctuation become more intense. Figure 18 shows that the amplitude of the lateral force coefficient of the turbine ( C L ) increases with the increasing speed ratio, but the increasing trend gradually slows down. As the speed ratio increases, the average value of the lateral force coefficient ( C ¯ L ) first increases and then decreases. The maximum lateral force coefficient at the best speed ratio of 2 is 0.35. At this time, the hydraulic turbine continues to receive positive lateral force. This is because changing the direction of rotation will change the direction of the side force. In order to offset the influence of lateral force on the rolling and swaying motion of the turbine and its carrier, the usual method is to arrange an even number of inwardly rotating turbines side by side.

4.2. Influence of Carrier Motion on the Hydrodynamic Characteristics of Hydraulic Turbine
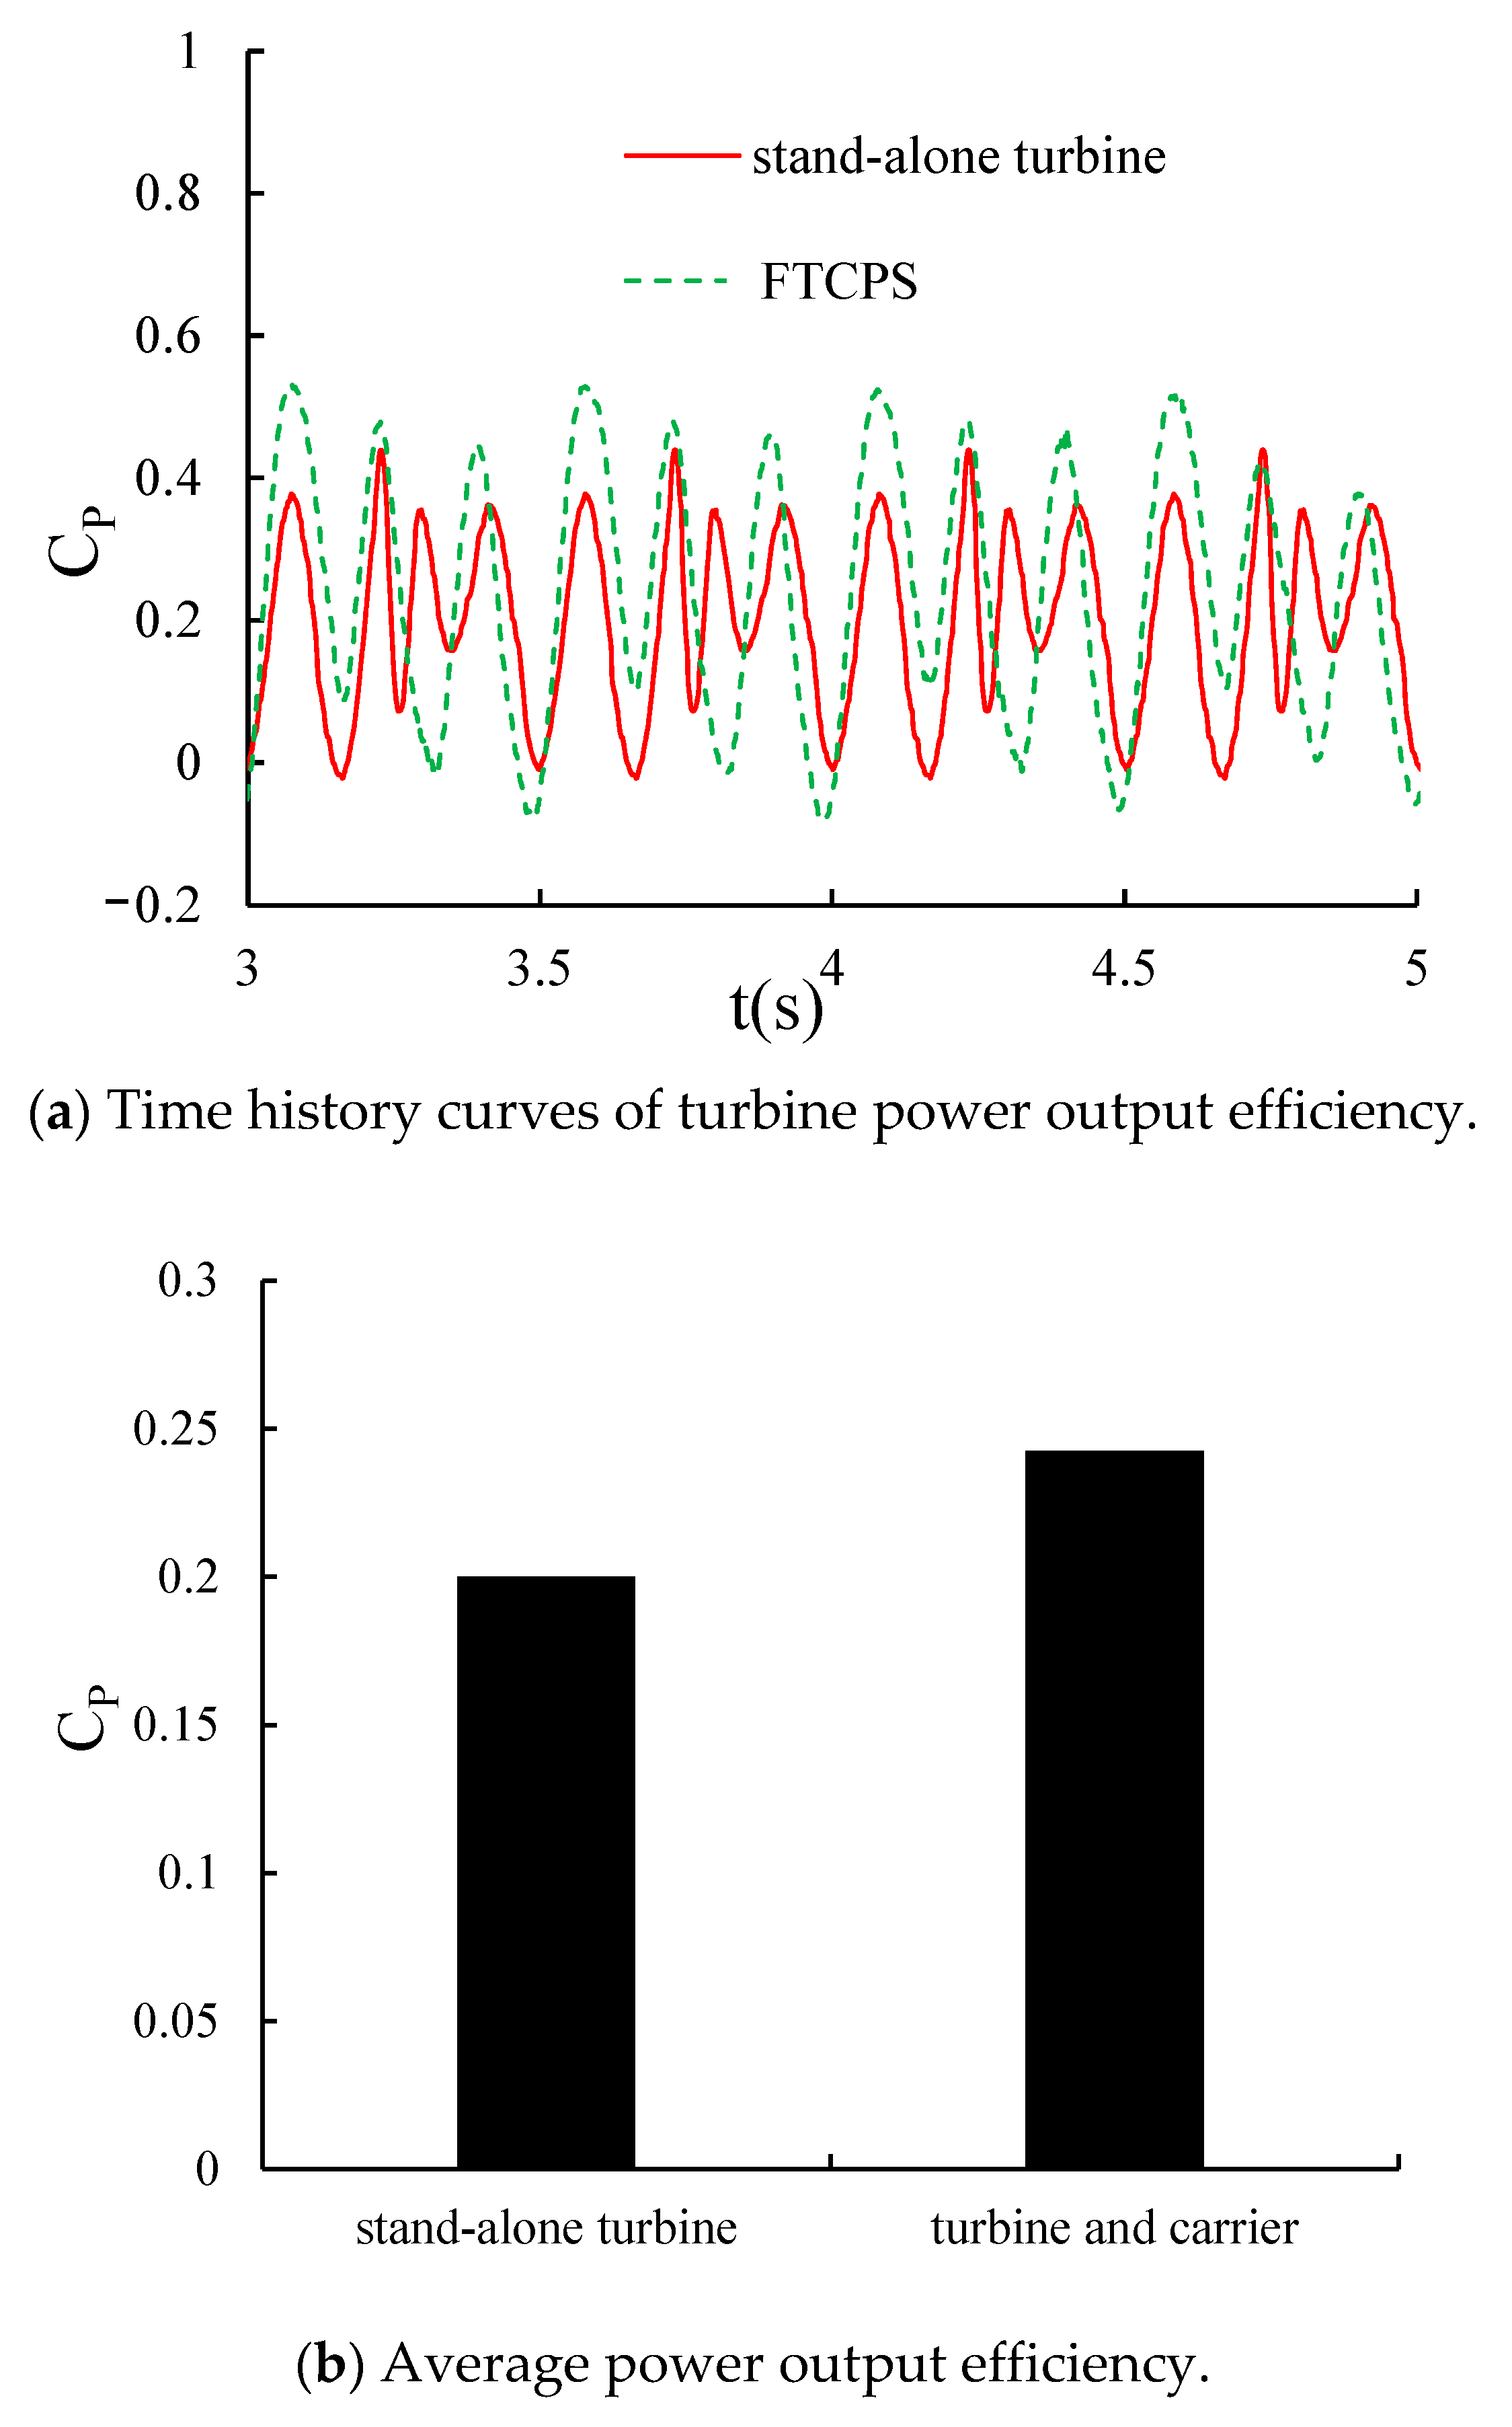
This section compares the hydrodynamic performance difference of the twin-rotor turbine at two different operation conditions, e.g., fixed and floating conditions. In the fixed condition, the computational domain only includes the twin-rotor turbine without any motion. In the floating condition, the computational domain includes the twin-rotor turbine and the carrier with 6-DOF motion. The TSR of the turbine is 2, and the incoming flow velocity is 2.5 m/s. The specific design parameters of the computational domain are shown in Table 1.

4.2.1. Power Output

Figure 19 shows the comparison of power output efficiency with respect to time between case A and case B due to the carrier 6-DOF motion.
It can be seen that the fluctuation rate of the turbine with 6-DOF motion is bigger than the fixed turbine. The motion response of the carrier caused higher flow fluctuations for the incoming flow acting on the turbine disk, leading to larger power output fluctuations for the turbine. The average power output of the turbine in case A is 0.24, while the average power output of the fixed turbine is 0.2. The power output increasing of the floating turbine is caused by the two front columns of the carrier. The submerged part of the column changed the boundary conditions of the flow field around the turbine. The two front columns are similar to a flow deflector, which increases the flow velocity passing through the turbine. A flow acceleration zone is clearly observed in Figure 26. The flow velocity increasing effect would be thoroughly discussed in Section 4.4.1.

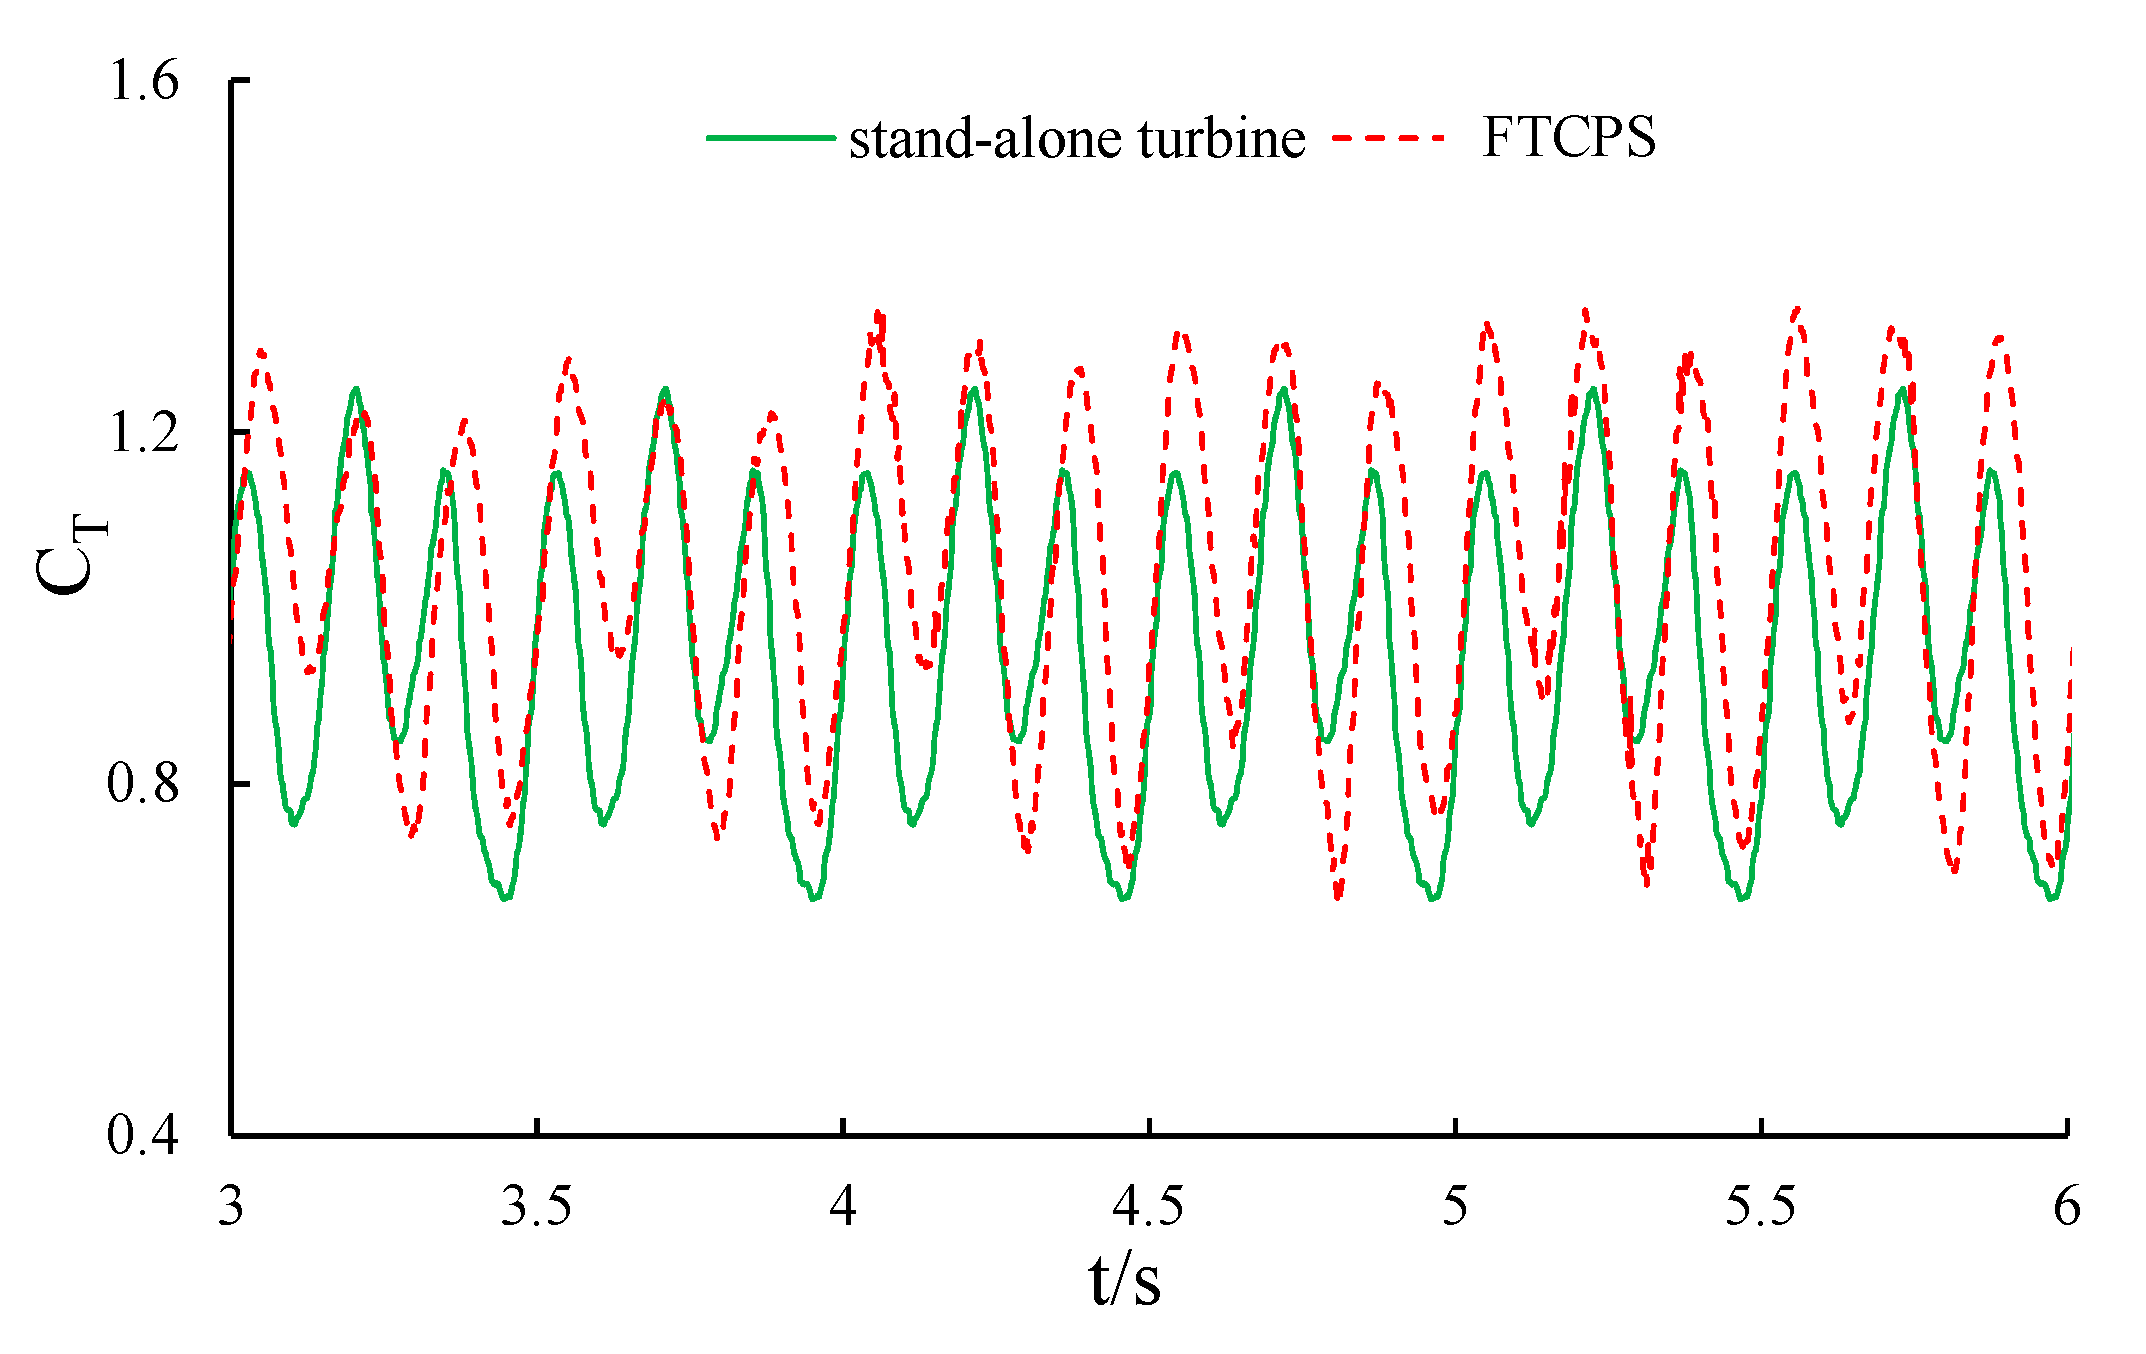
4.2.2. Thrust Coefficient

Figure 20 shows the comparison of thrust coefficient with respect to time for the twin-rotor turbine. The maximum value of thrust for the floating turbine is 1.3 times that of the fixed turbine. The fluctuation rate of thrust for the floating turbine is 1.13 that of the fixed turbine. The deflector effect of the columns increased the power output of the floating turbine, but it also increased the thrust. As for the fluctuation rate difference between the two cases, the motion response of the carrier increased the flow velocity changing rate acting on the turbine, which definitely would increase the fluctuation rate. It can also be observed that the fluctuation frequency of the thrust for the floating turbine is almost equal to the fixed turbine, which implies that the motion response of the carrier would not influence the thrust frequency response characteristics.

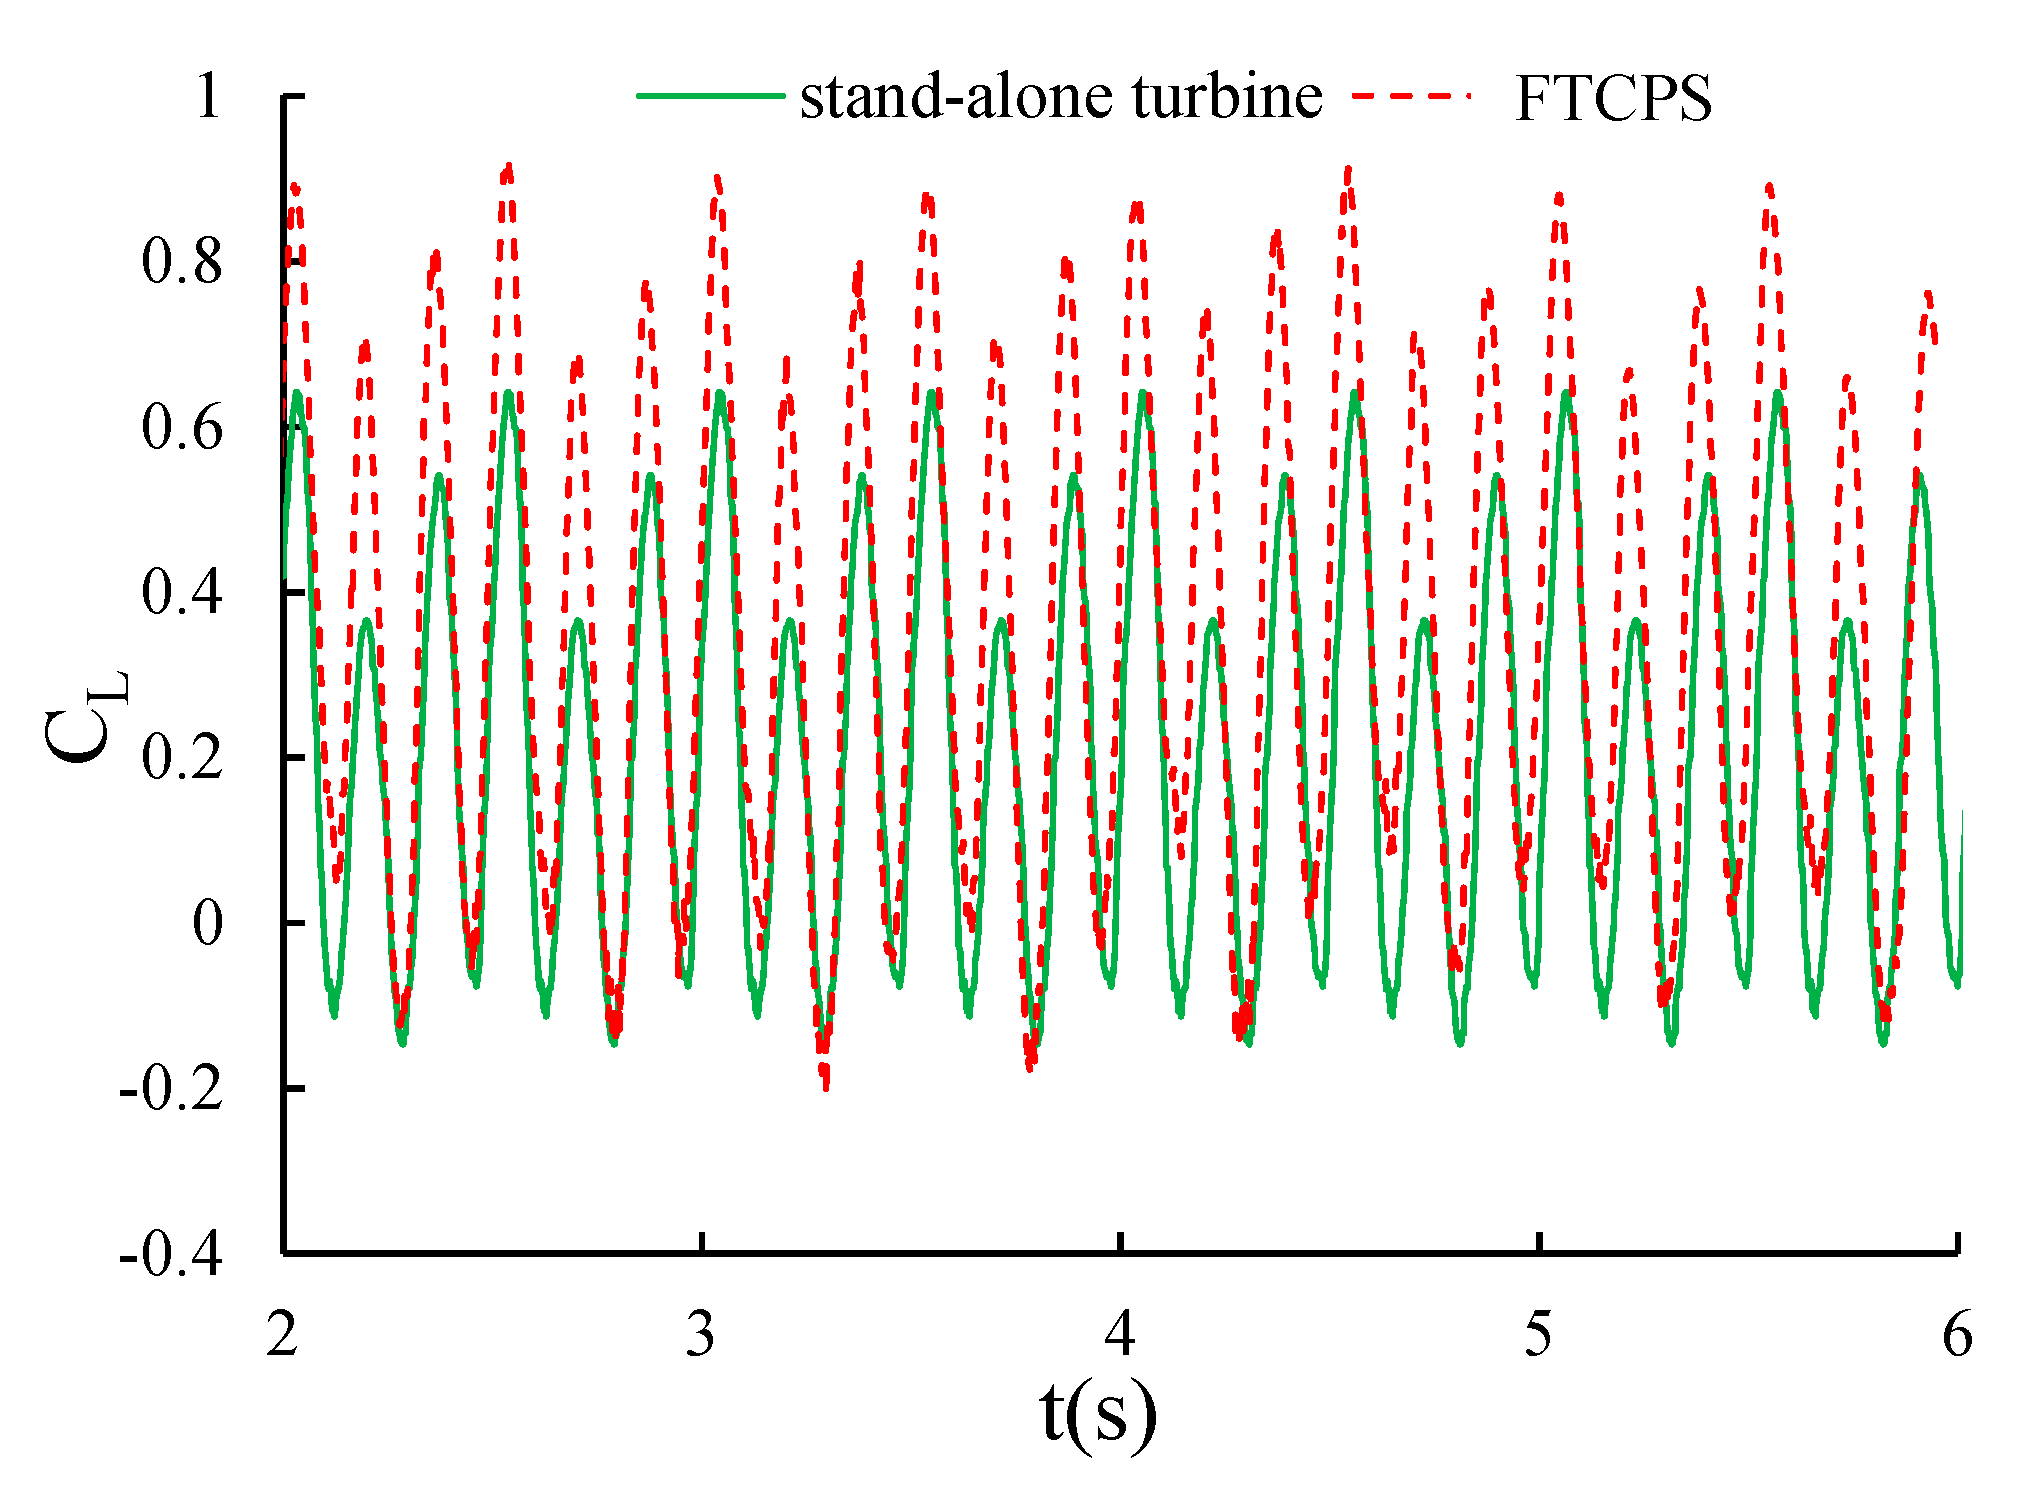
4.2.3. Lateral Force Coefficient

The change of the lateral force of the twin-rotor turbine will affect the rolling and swaying motion of the vertical-axis tidal current turbine. Figure 21 is a time history curve of the lateral force coefficient of the vertical axis turbine. It can be seen that the fluctuation range and maximum value of the lateral force coefficient of the turbine with a carrier are 1.125 times and 1.3 times that of the turbine without a carrier. The reason is that the carrier increases the lateral force acting on the turbine. However, the minimum values of the lateral force coefficients are all-around 0. It can be seen that the lateral force coefficient is much smaller than thrust coefficient. The lateral force between the two rotor is opposite leading to the resultant of lateral force decreasing. Meanwhile, the carrier is equivalent to shortening the distance from the turbine to the boundary. The reflected wave formed by the fluid passing through the surface of the carrier is also one reason for the increase in the lateral force coefficient.

4.3. Influence of the Turbine on the Hydrodynamic Response of the Carrier

This section compares the motion response difference of the carrier at two different scenarios, e.g., a stand-alone carrier (case C) and a carrier with the twin-rotor turbine (case D). Only three difference directions have been chosen in the discussion e.g., surge, pitch and heave. The motion response at these three directions is the most essential for the safe operation of such a kind of device. TSR of the twin-rotor turbine is set as 2, and the incoming flow velocity is 2.5 m/s. The specific design parameters of the computational domain are shown in Table 2.

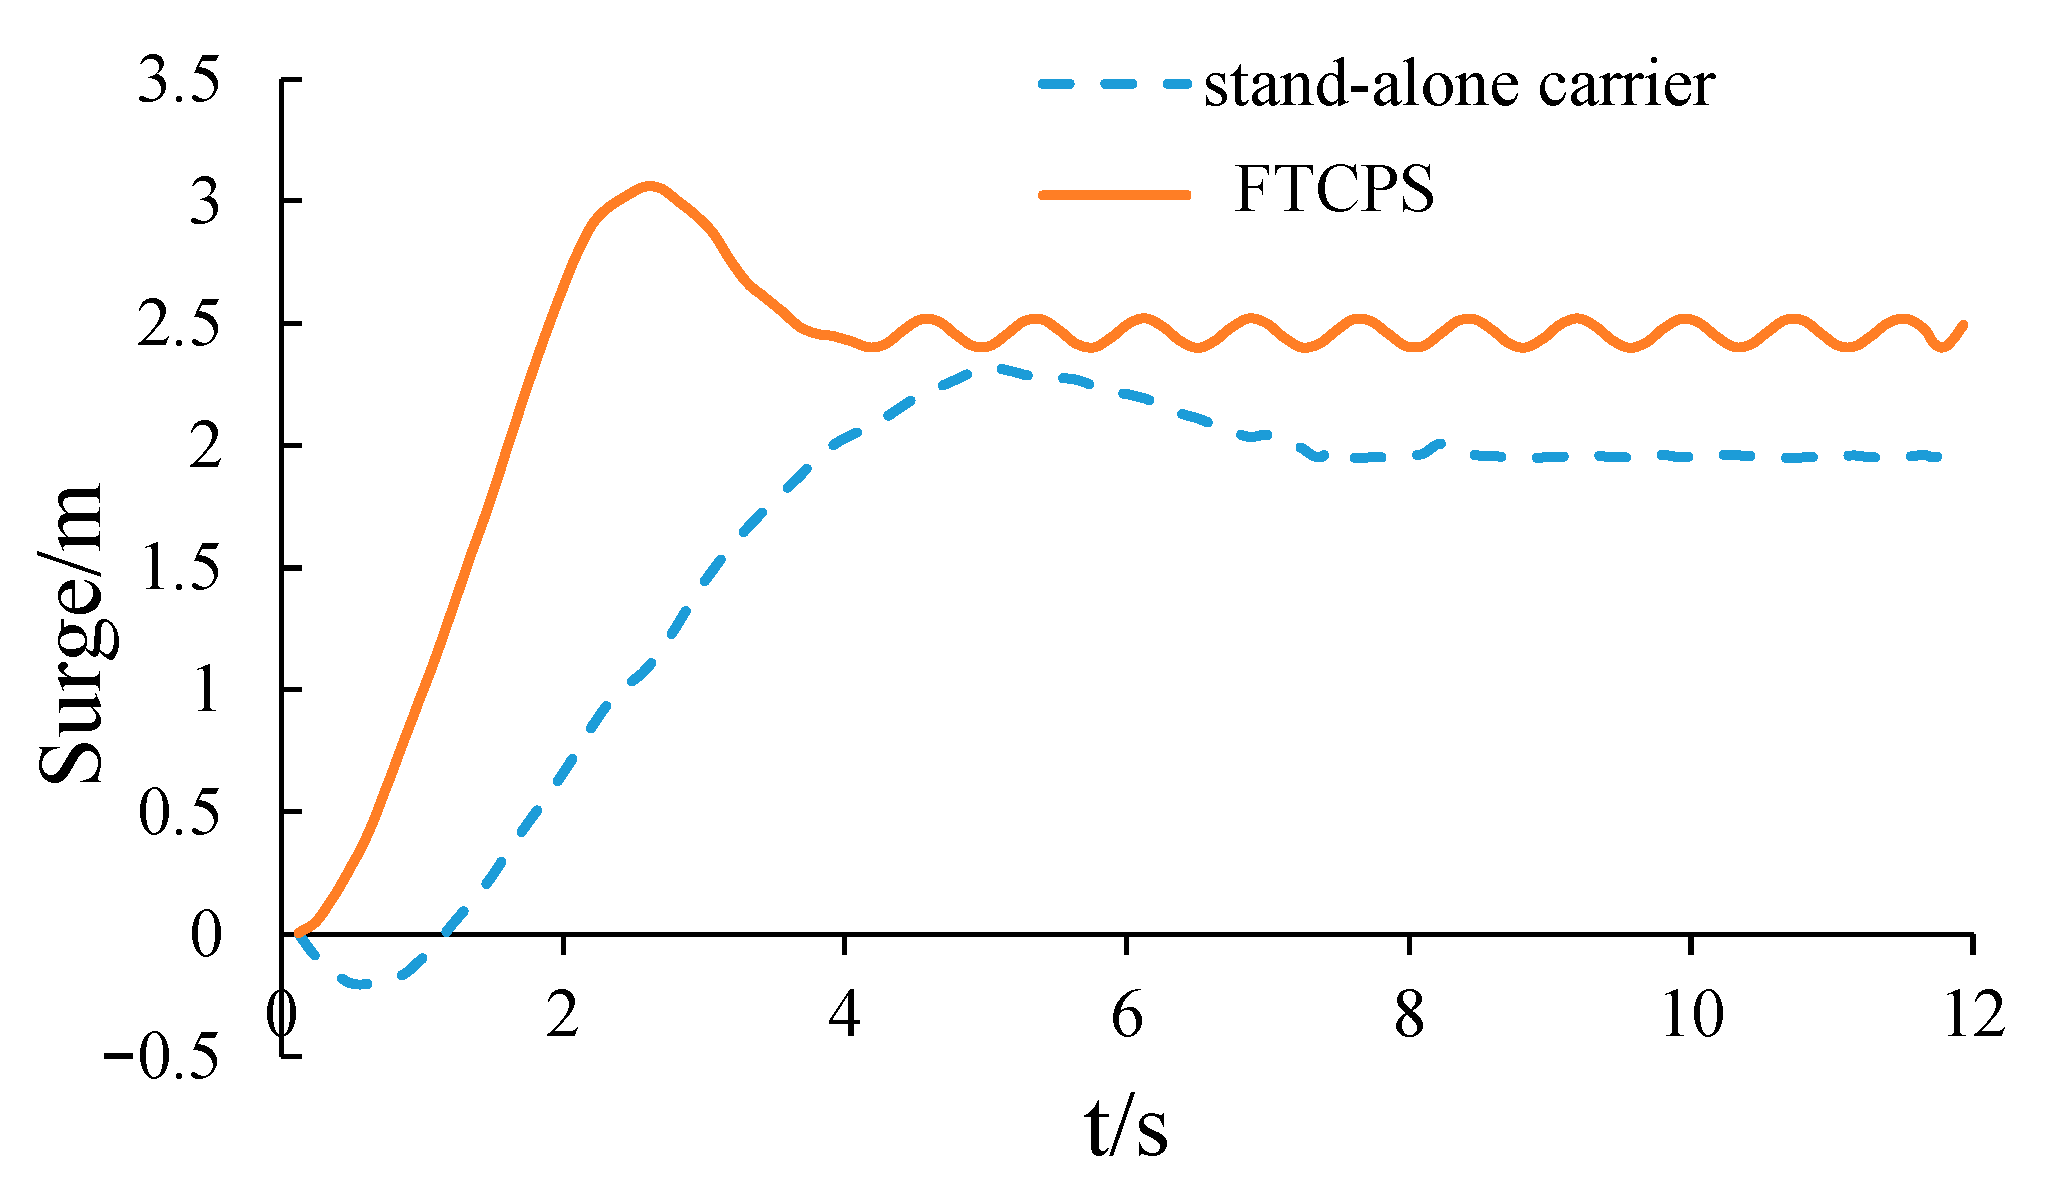
4.3.1. Surge Motion of the Carrier

Figure 22 shows the comparison of surge motion response with respect to time due to the operation of twin-rotor turbine. It can be seen that the stand-alone carrier would move towards the negative axis of X first and then move downstream. The negative value of surge motion response is caused by the pretension of the mooring line. In the end, the surge motion of the carrier is almost a constant value when the carrier moves to the equivalent position. However, for the FTCPS scenario, the carrier would directly move downstream, which is different from the stand-alone carrier. This is caused by the thrust generated by the turbine. The surge motion of the carrier is almost sinusoidal when the carrier moves to the equivalent position. The frequency of the surge motion response is equal to the rotation period of the twin-rotor turbine. It can also be seen that the surge motion response of case D is much bigger than case C. The thrust of the twin-rotor dramatically increased the motion response of the carrier and changed the equivalent position of the carrier.

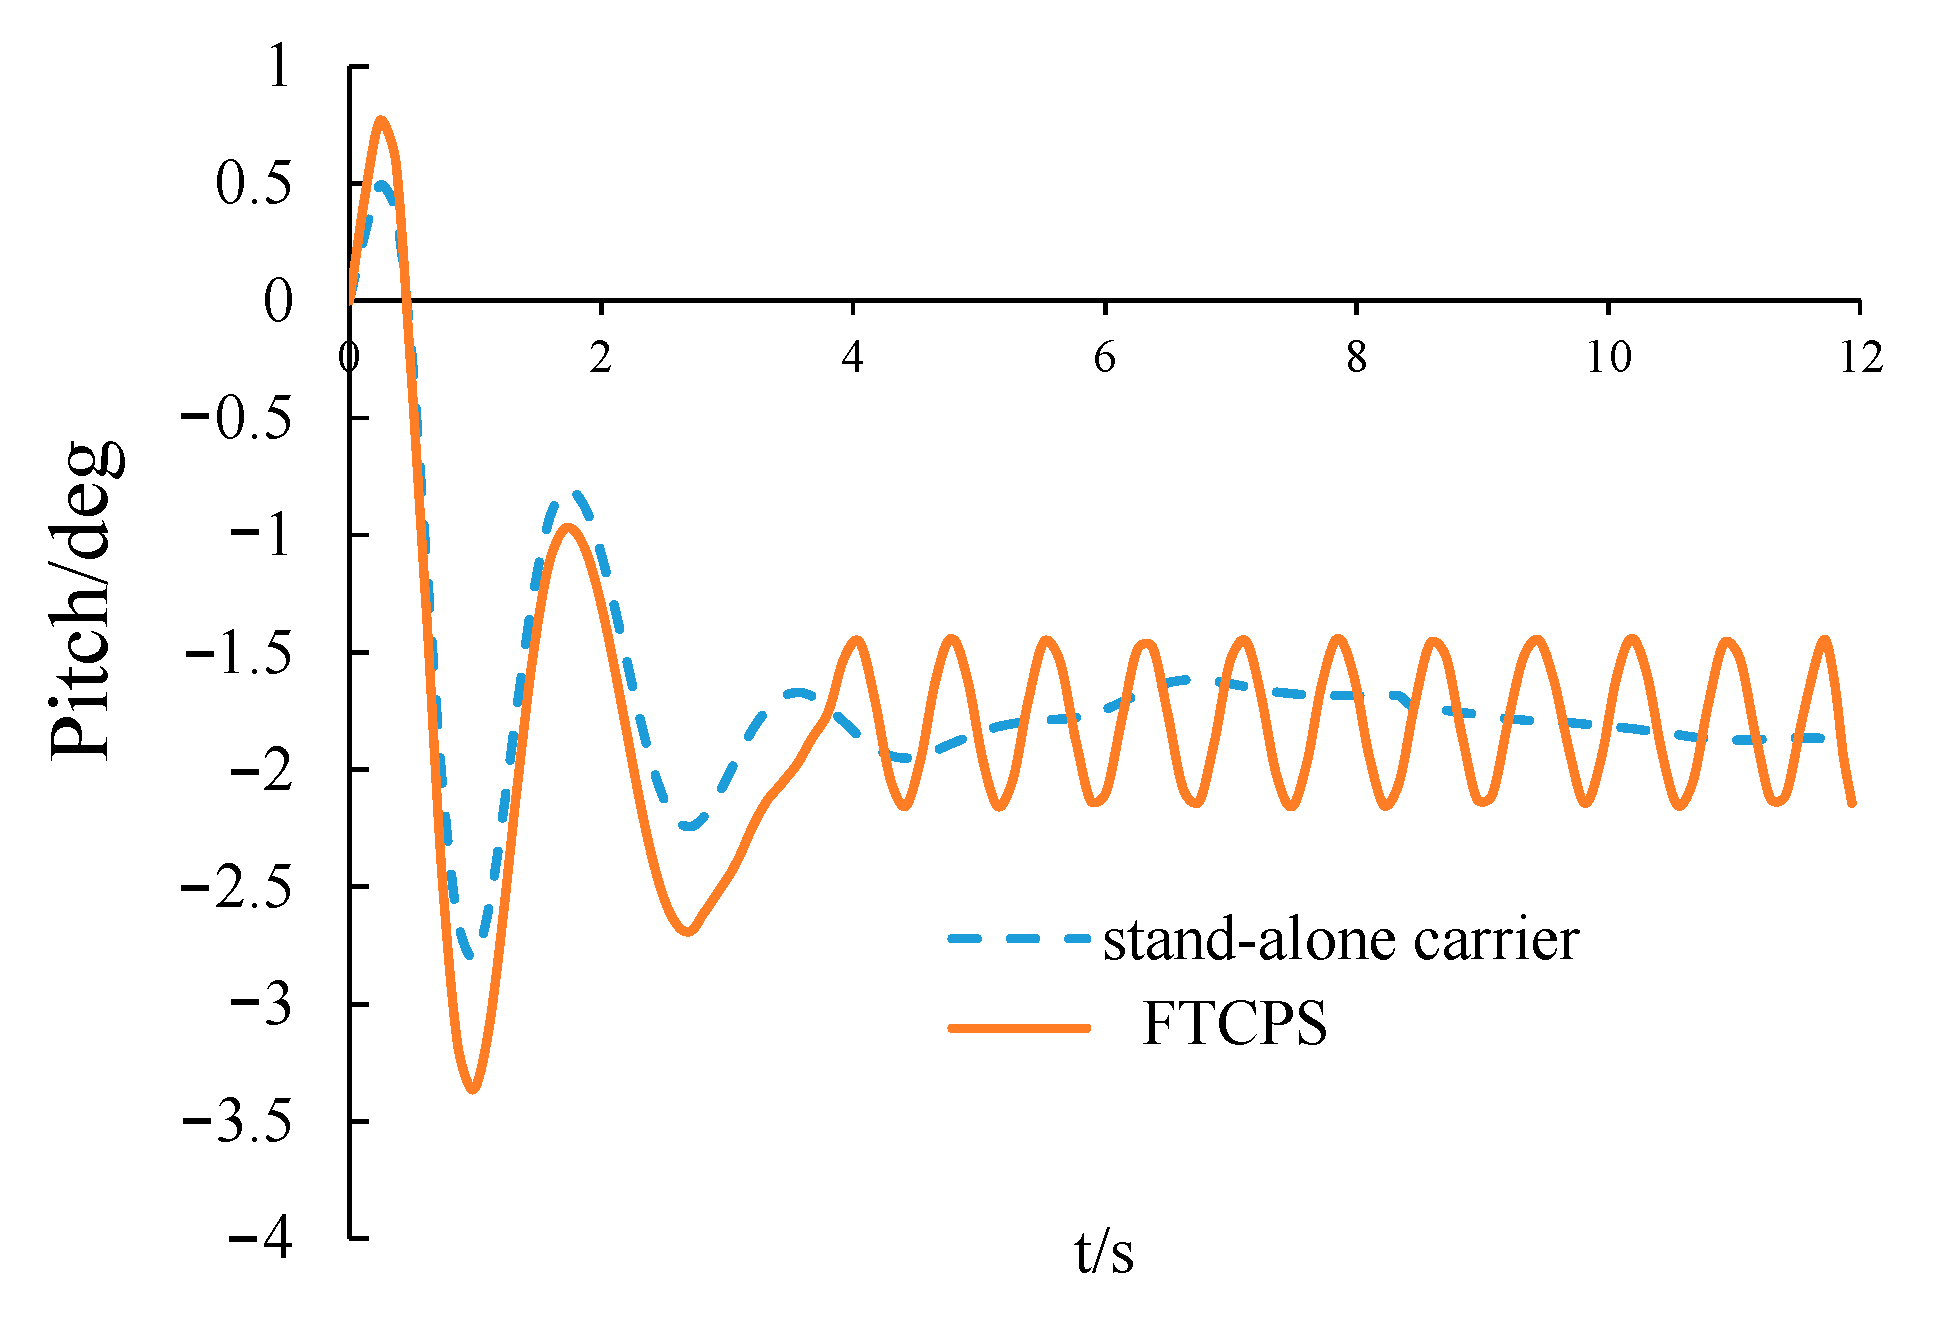
4.3.2. Pitch Motion of the Carrier

Figure 23 shows the comparison of pitch motion response with respect to time due to the operation of twin-rotor turbine. In the initial stage, the motion response of the two scenarios is almost the same. However, the pitch motion of the stand-alone carrier is almost a constant value when the carrier moves to the equivalent position. The average pitch angle is −1.77°, which implies that the carrier is trimming by head. Compared to the stand-alone carrier, the pitch motion of the FTCPS is also trimming by head. However, the pitch motion of the FTCPS is almost sinusoidal when the carrier reaches equivalent position. The pitch motion frequency of the FTCPS is almost equal to the rotation period of the twin-rotor turbine. The average pitch angle is −2.25°, which implies that the thrust of the twin-rotor turbine would increase the trimming by head situation, which increases the risk of wave running-up.

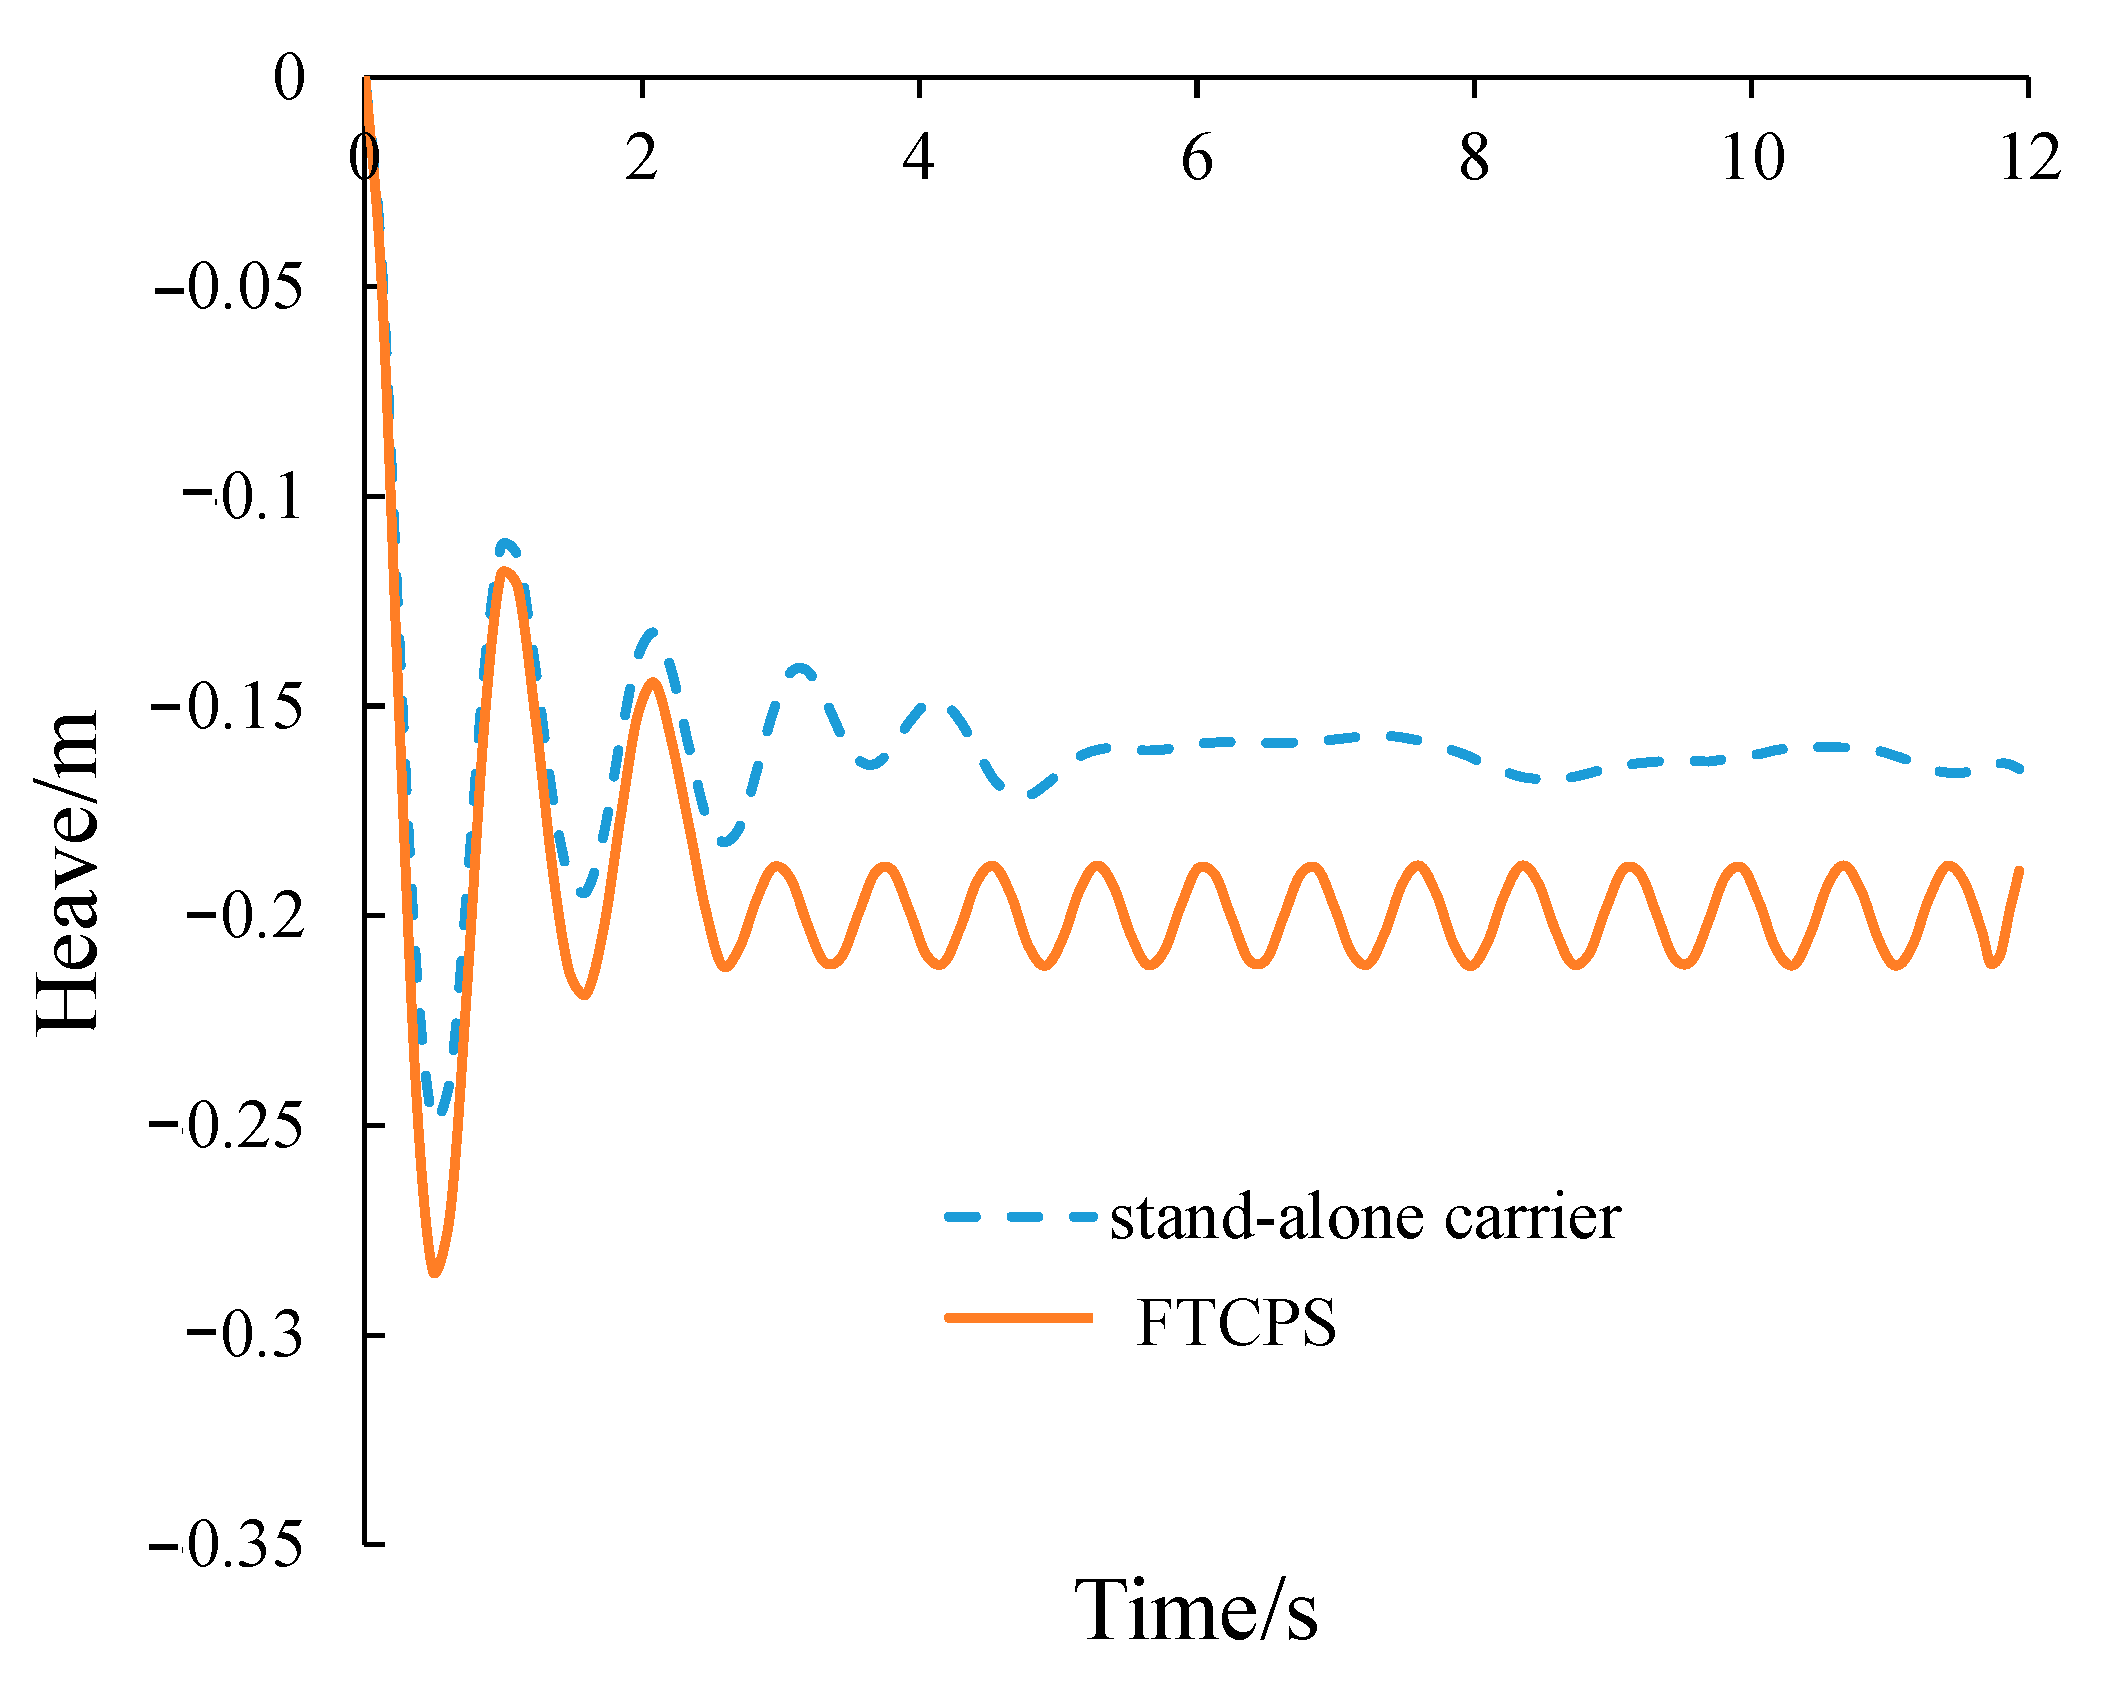
4.3.3. Heave Motion of the Carrier

Figure 24 shows the time history curve of the heave motion response of the carrier. It can be seen that the heave motion of the carrier with turbine is much bigger than the stand-alone carrier. The stand-alone carrier would stay steady when the carrier moves to the equivalent position. The heave motion of the stand-alone turbine can be neglected compared to the carrier with the twin-rotor turbine. For the FTCPS, the heave motion is also sinusoidal. The heave motion frequency is also linked with the turbine rotation period. Due to the existence of the twin-rotor turbine, the full system would reach a new equivalent position.
It can be seen that the heave motion response value difference is pretty small compared to the surge motion and roll motion. Since the turbine is a straight-bladed turbine, the horizontal cross-sectional area of the blade is small, which has little influence on the vertical heave damping and added mass of the turbine.

4.4. Flow Field Analysis

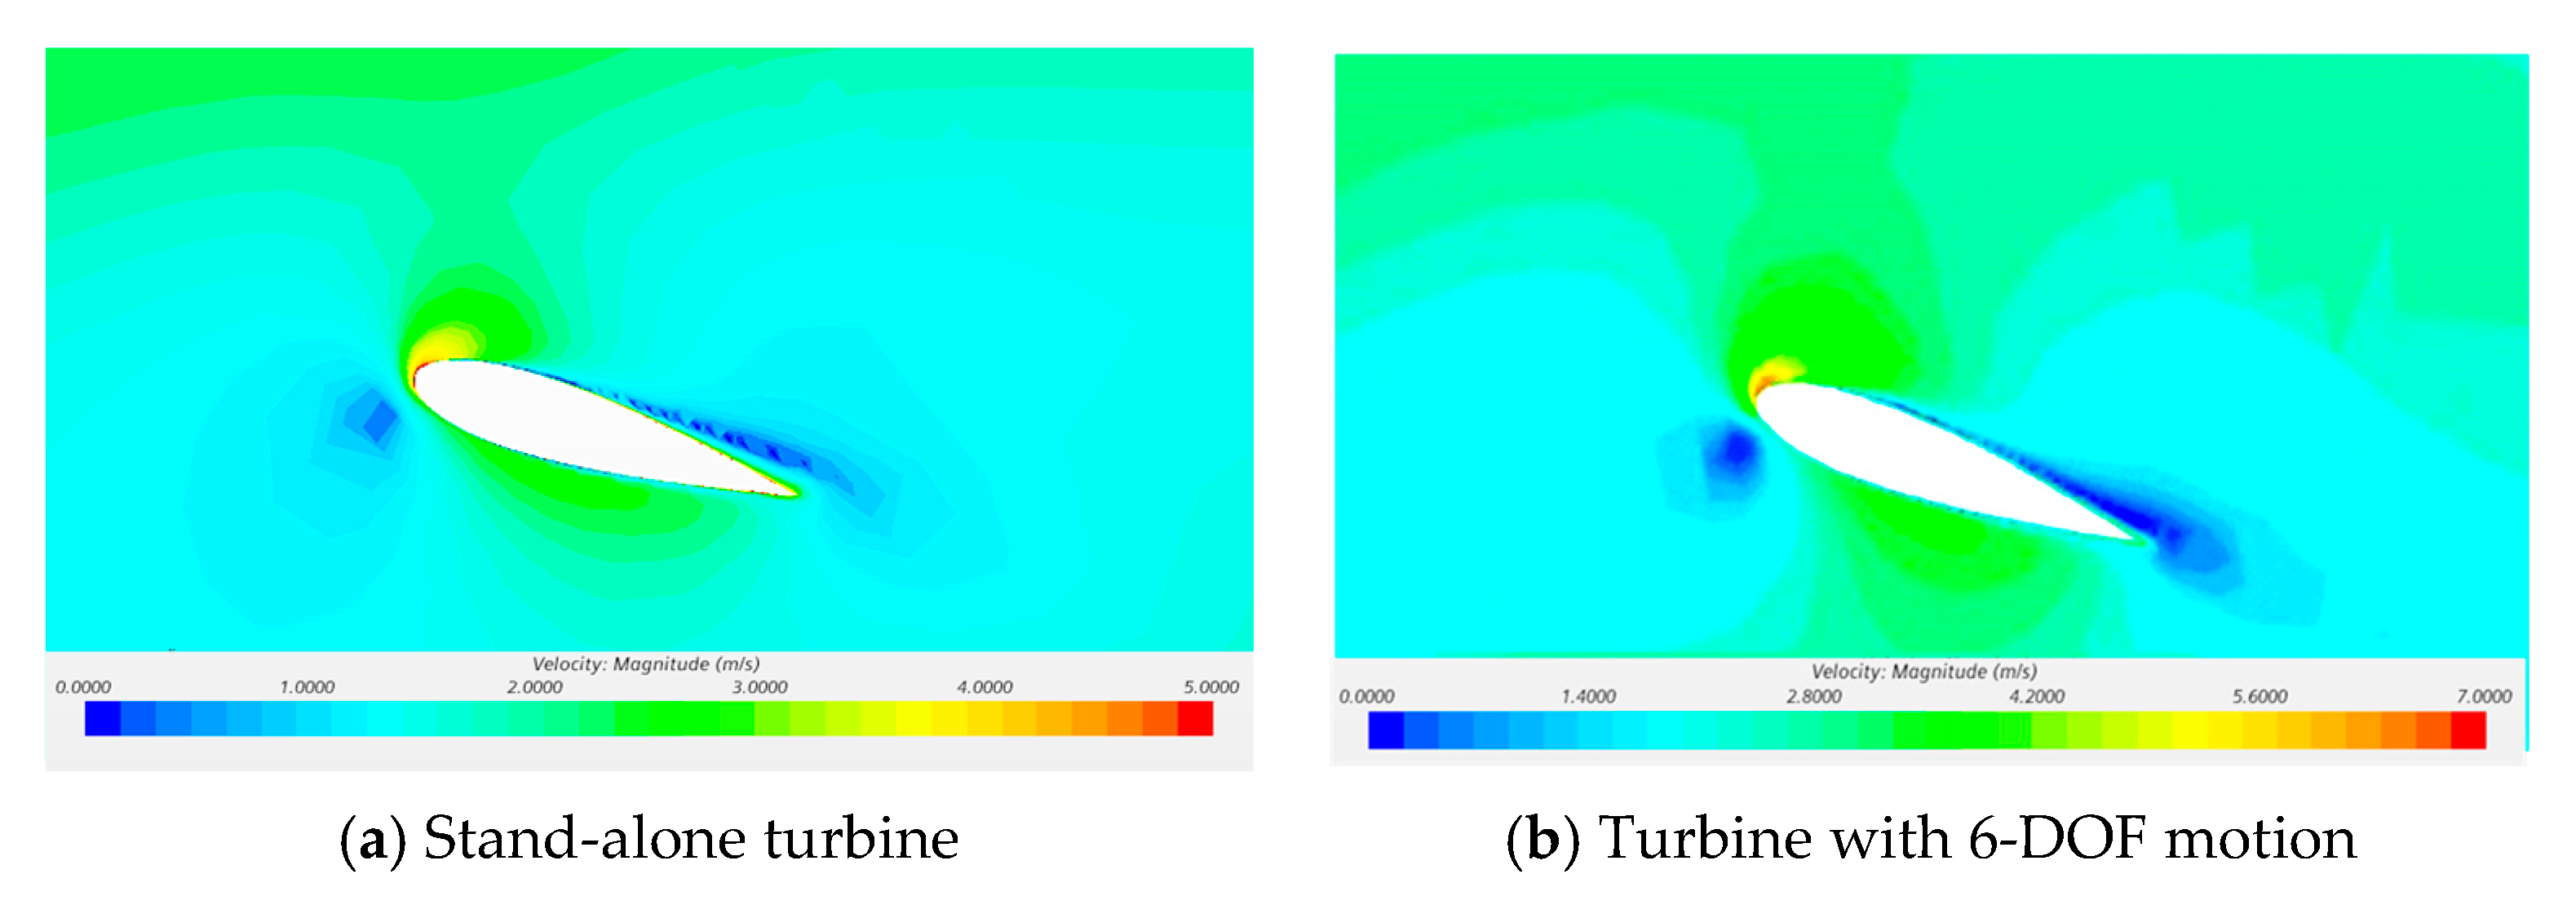
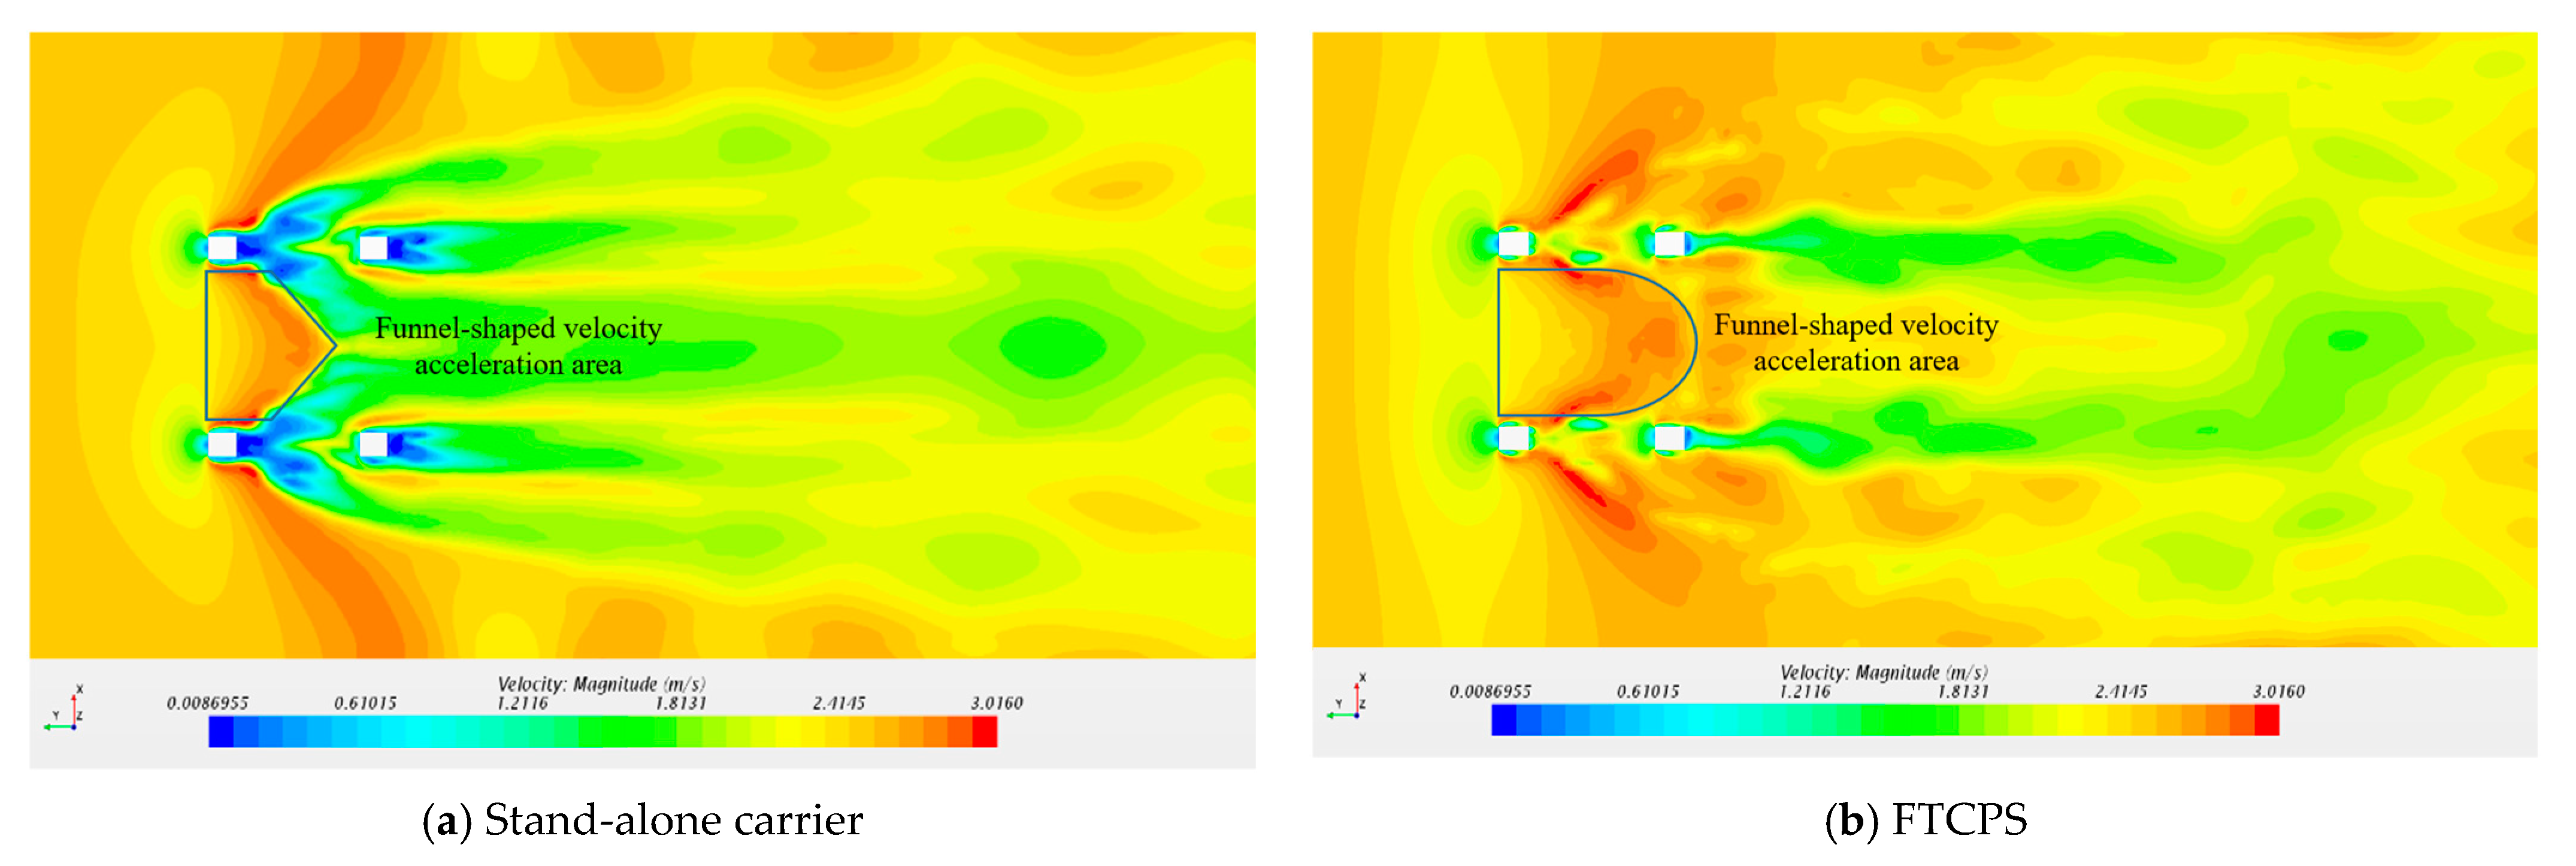
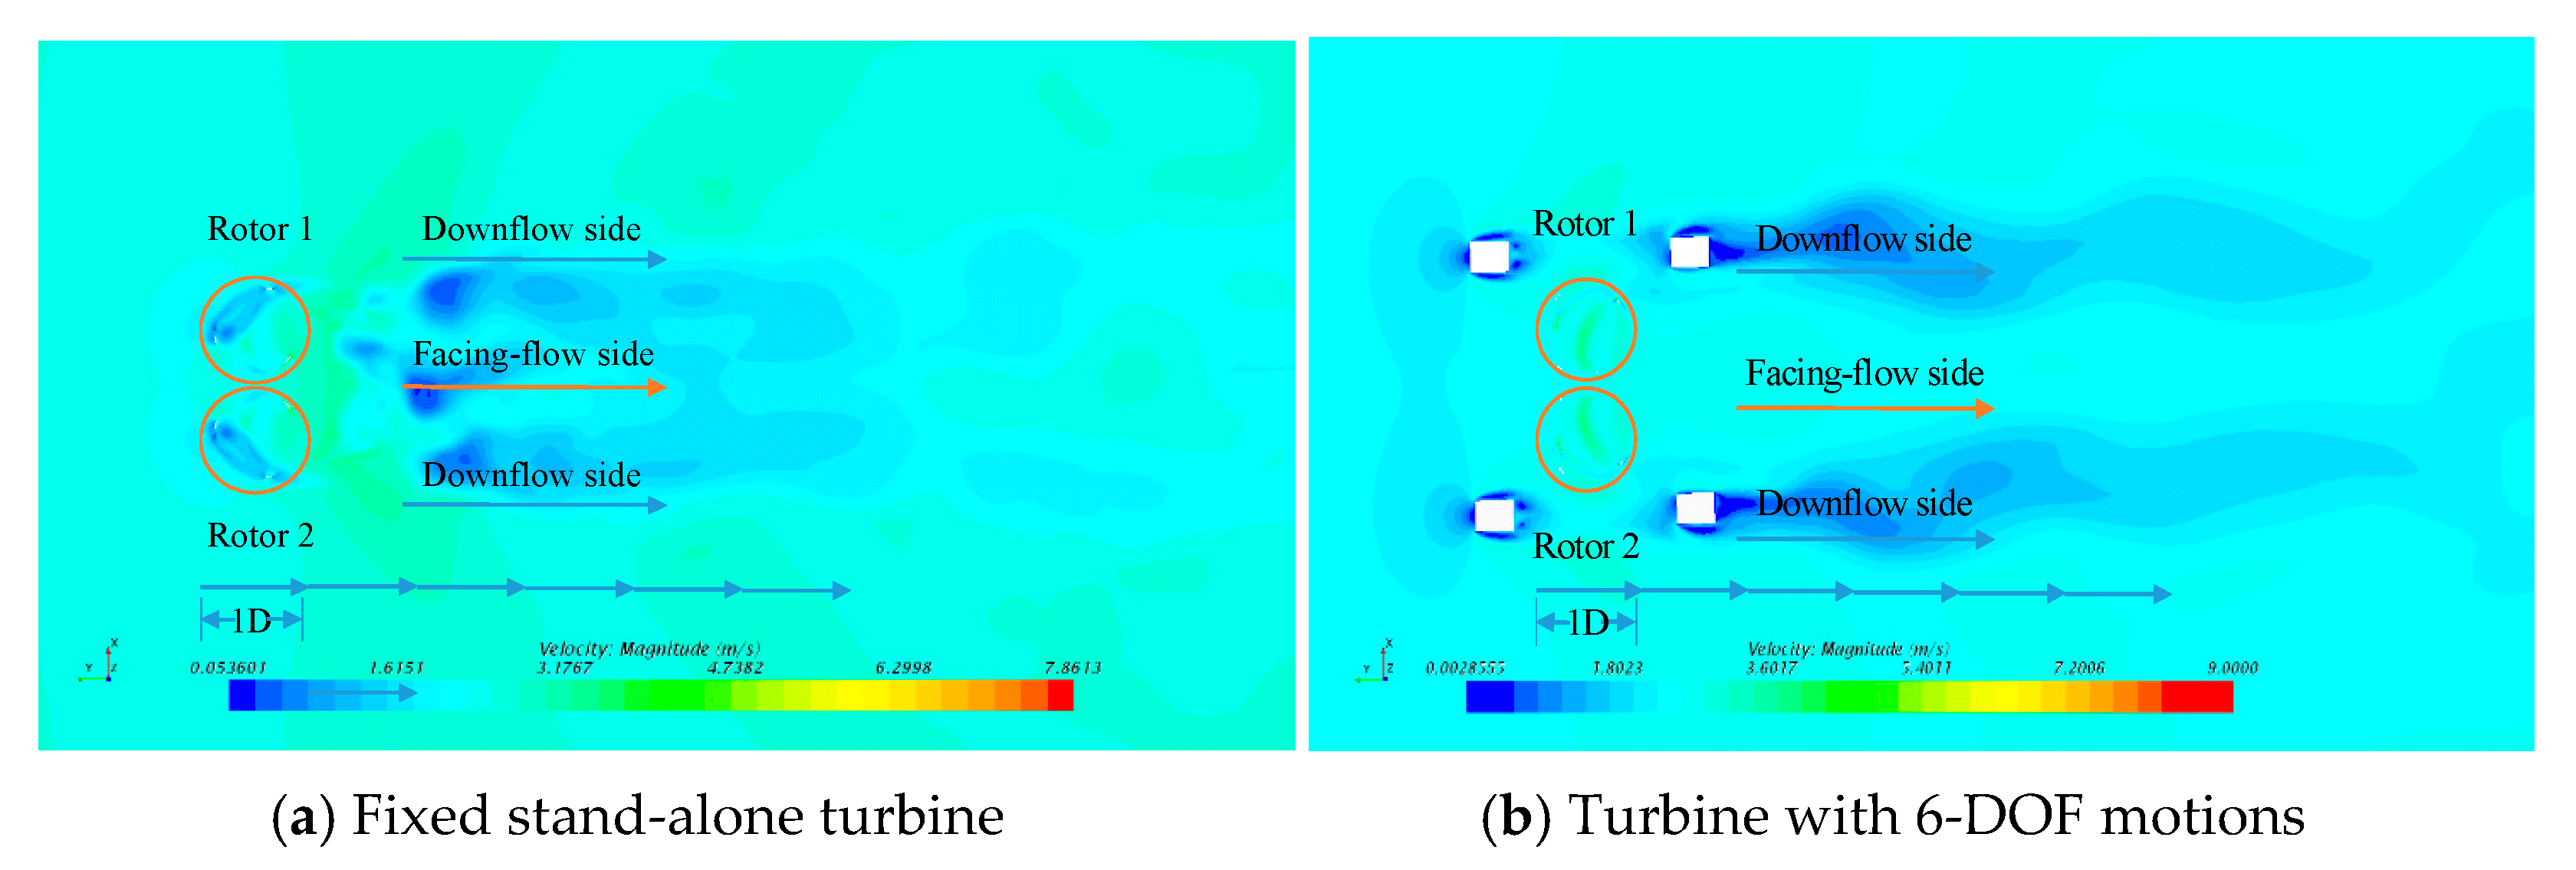
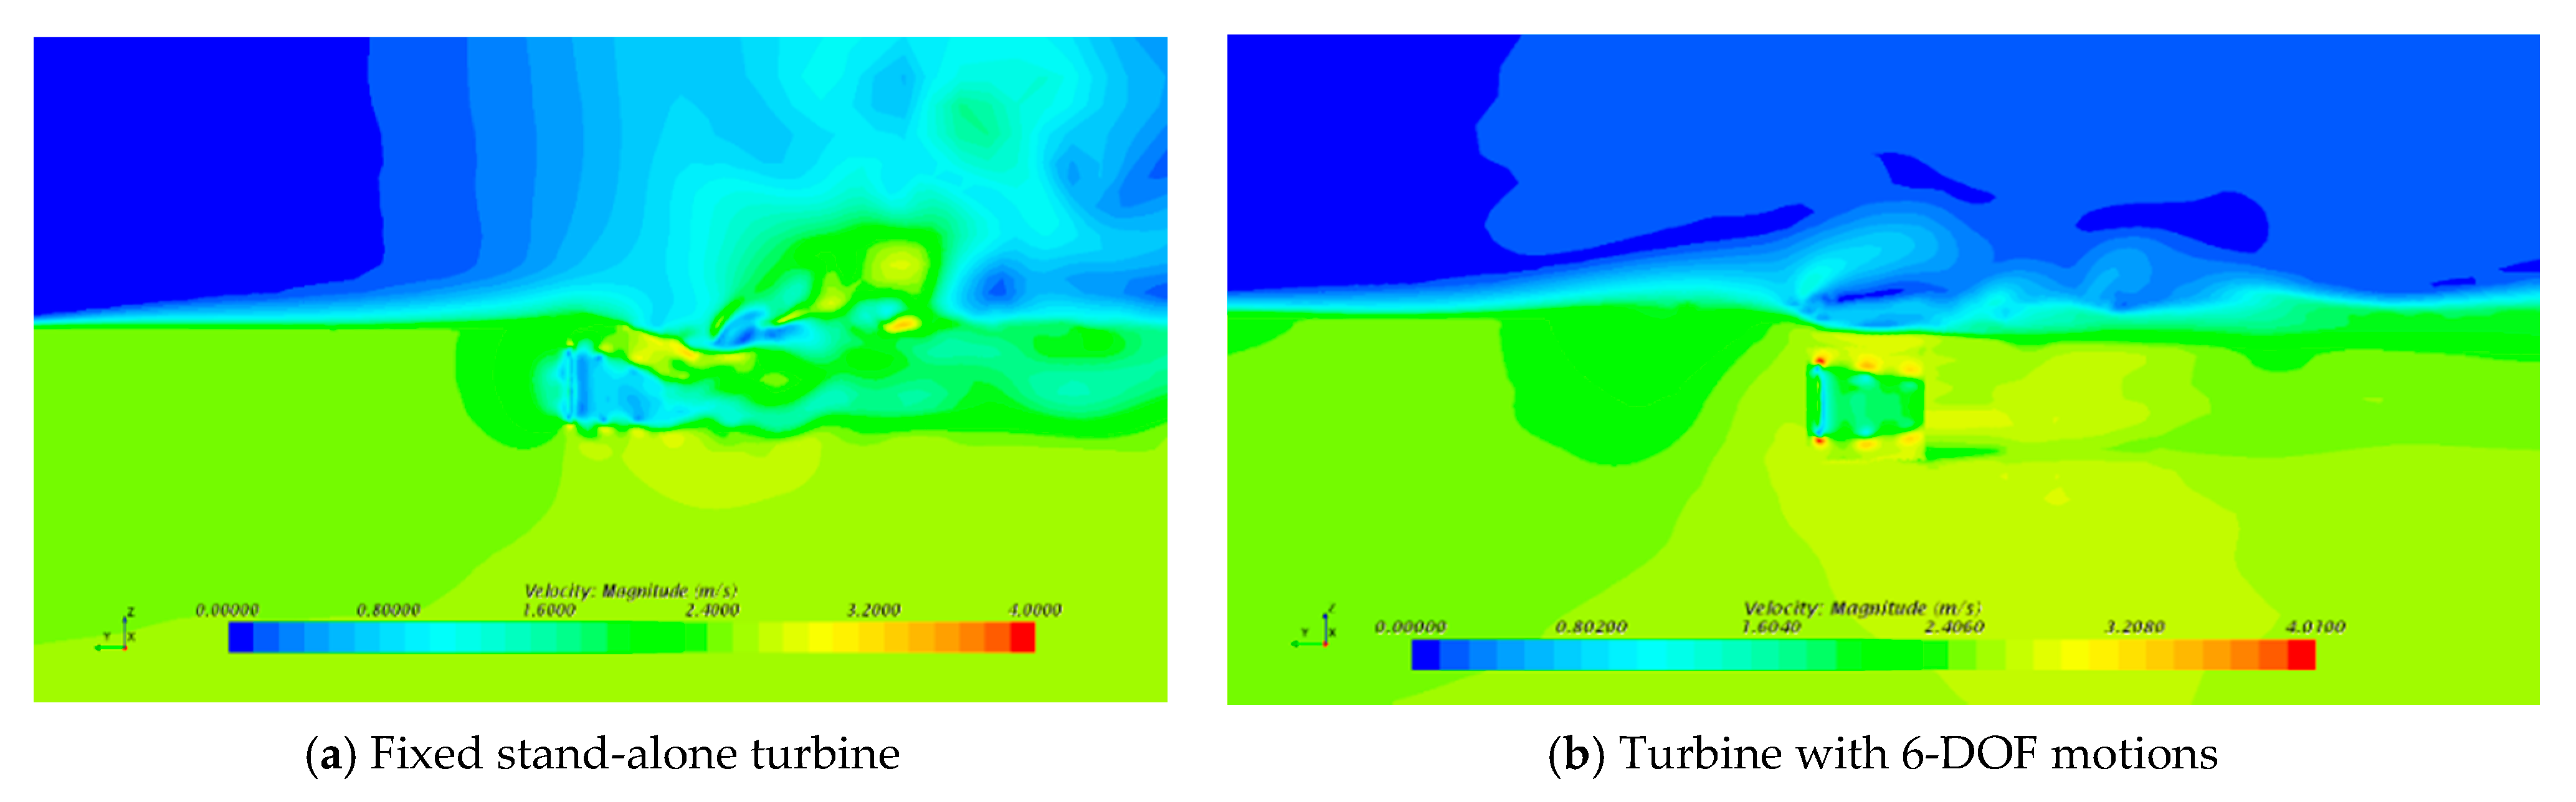
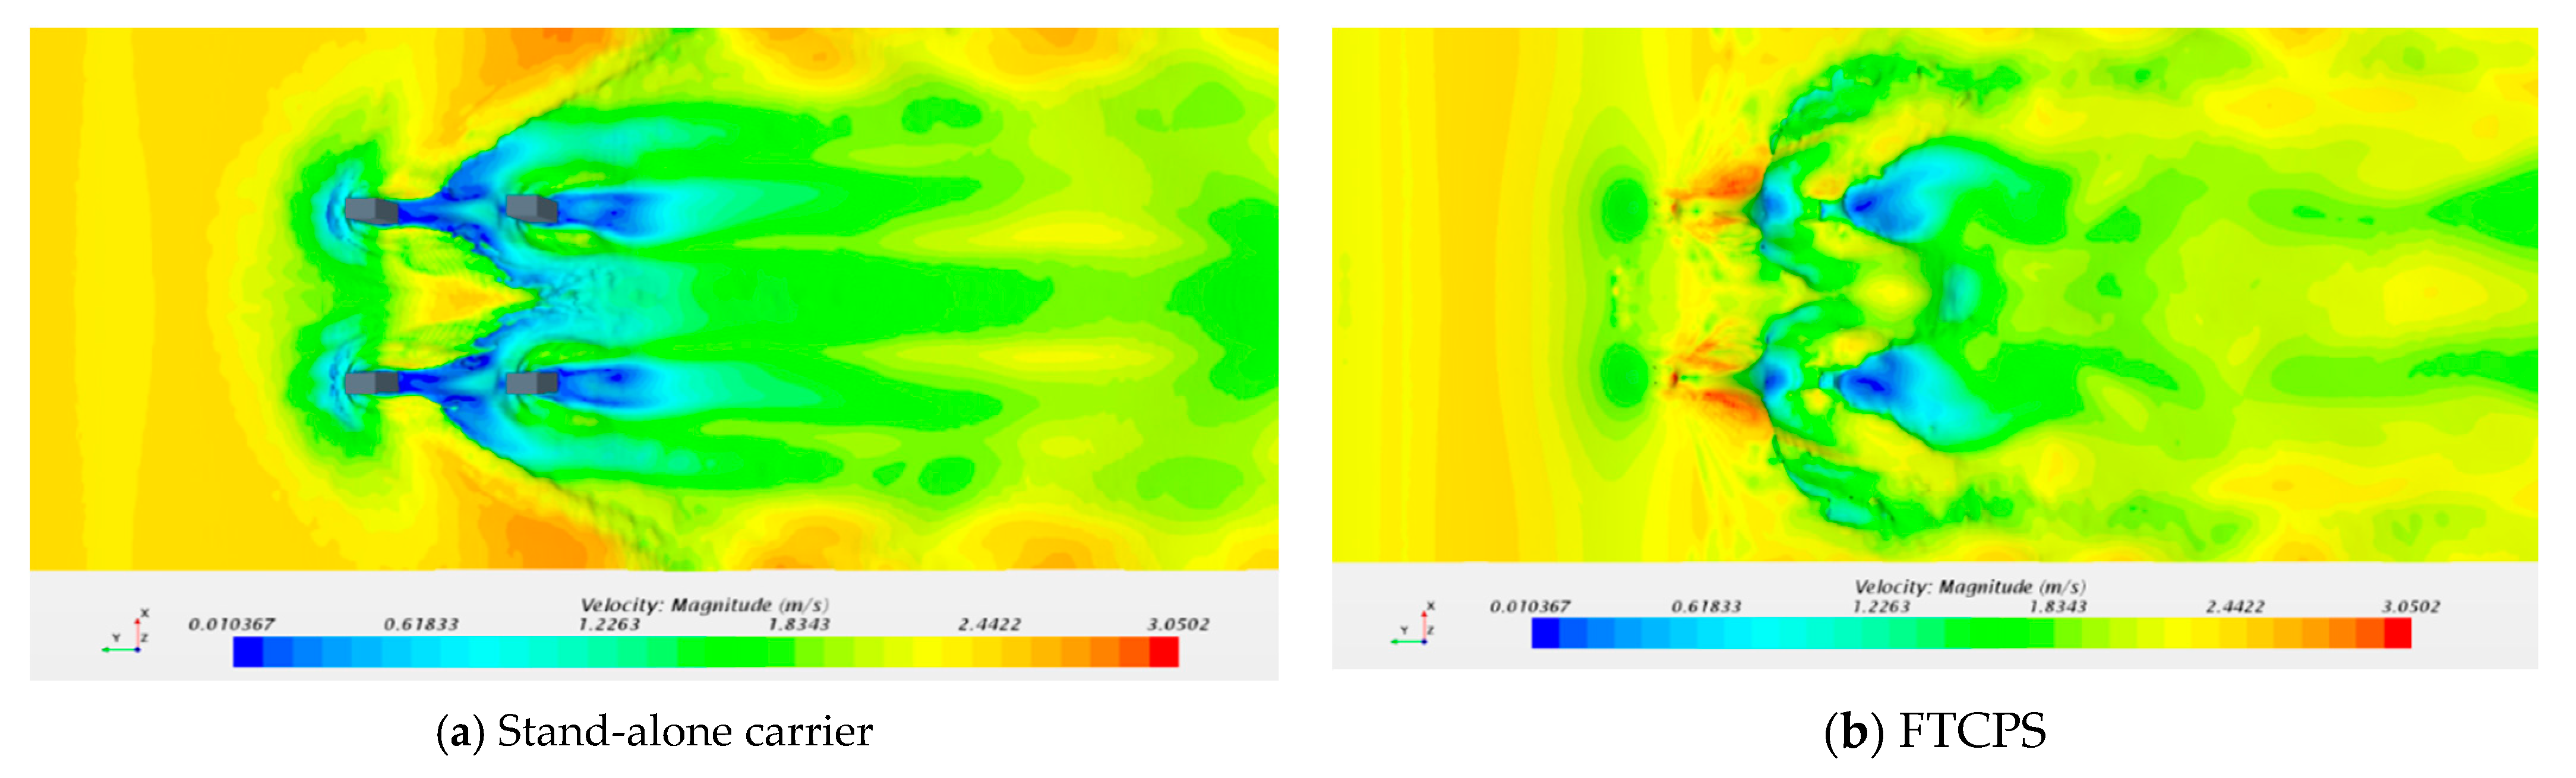
4.4.1. Flow Velocity

To investigate the hydrodynamics of the turbine and carrier dynamic motion response in detail, the flow field chosen from different sections in the computational domain is analyzed. Figure 25, Figure 26, Figure 27, Figure 28, Figure 29 and Figure 30 show the instantaneous iso-velocity contours of the turbine with rotating blades and the carrier with 6-DOF motions in the computational domain.
Figure 25 shows the comparison of velocity field around the blade cross section between the fixed stand-alone twin-rotor turbine and the twin-rotor turbine with 6-DOF motion. It can be seen that the velocities around the leading edge of the blade cross section are all less than 2 m/s, forming an obvious velocity stagnation area, which produces the pressure difference and makes the turbine rotate. The velocity difference for the turbine with 6-DOF motion is much bigger than the fixed turbine, which explains that the thrust and lateral force of turbine with 6-DOF motion is larger than the other.
Figure 26 shows the comparison of horizontal section iso-velocity field for the fixed stand-alone turbine and the turbine with 6-DOF motions. For the fixed stand-alone turbine, the velocity flow field is almost symmetrical, and a minimum velocity area could be observed at about 1D (D is the diameter of the rotor) downstream. The velocity flow field would recover at about 5D downstream. An obvious velocity stagnation area could be seen between 2D~5D downstream in the facing-flow side. Meanwhile, the facing-flow side velocity recovery is faster than the downflow side. For the twin-rotor turbine with 6-DOF motion, due to the blockage effect of the carrier, the flow velocity in the facing-flow side has been accelerated, which led to the increasing of power output [23]. Compared to the fixed stand-alone turbine, the facing-flow side velocity recovery for the twin-rotor turbine with 6-DOF motion is much faster, and there is no velocity stagnation area in the facing-flow side. Therefore, more fluid could pass across the turbine in a period, and more kinetic energy could be captured by the turbine.
Figure 27 shows the comparison of vertical section iso-velocity field of the fixed turbine and the turbine with 6-DOF motion. It can be seen that flow fields around carriers are distributed symmetrically. There is a clear speed-dividing line of the flow field around the middle section of the carrier without turbines. The backstream velocity around the carrier support structure has a clear stagnation zone. With the development of the flow field, the carrier wake field gradually recovers at a slower speed. However, for the carrier with turbines, the rotational motion of the turbines makes the fluid velocity flowing through the carrier have no clear dividing line. The backflow velocity of the carrier support structure has a smaller stagnation zone. The velocity increases, and the internal wake field velocity gradually decreases, forming a clear deceleration zone and, finally, mixing with the surrounding flow field.
Figure 28 shows the comparison of the vertical section iso-velocity flow field for the stand-alone carrier and the carrier with twin-rotor turbine. The velocity flow field for the stand-alone turbine at the vertical section is almost symmetrical. A funnel-shaped velocity acceleration area could be both observed for the two scenarios. However, the funnel-shaped velocity acceleration area for the stand-alone carrier is smaller and the funnel shape is more cuspidal than the other. The low velocity area of the carrier with the rotating turbine is smaller than the other, which implies that the rotation of the turbine accelerates the velocity recovery of the flow field.
It can be seen that the wave run-up effect is more obvious for the carrier with the rotating turbine in Figure 29. Compared to the symmetrical velocity flow field of the stand-alone turbine, the free surface flow field of the carrier with the rotating turbine is more disorganized than the other. Meanwhile, the rotation of the turbine enlarged the influenced flow velocity recovery area at the free surface area.

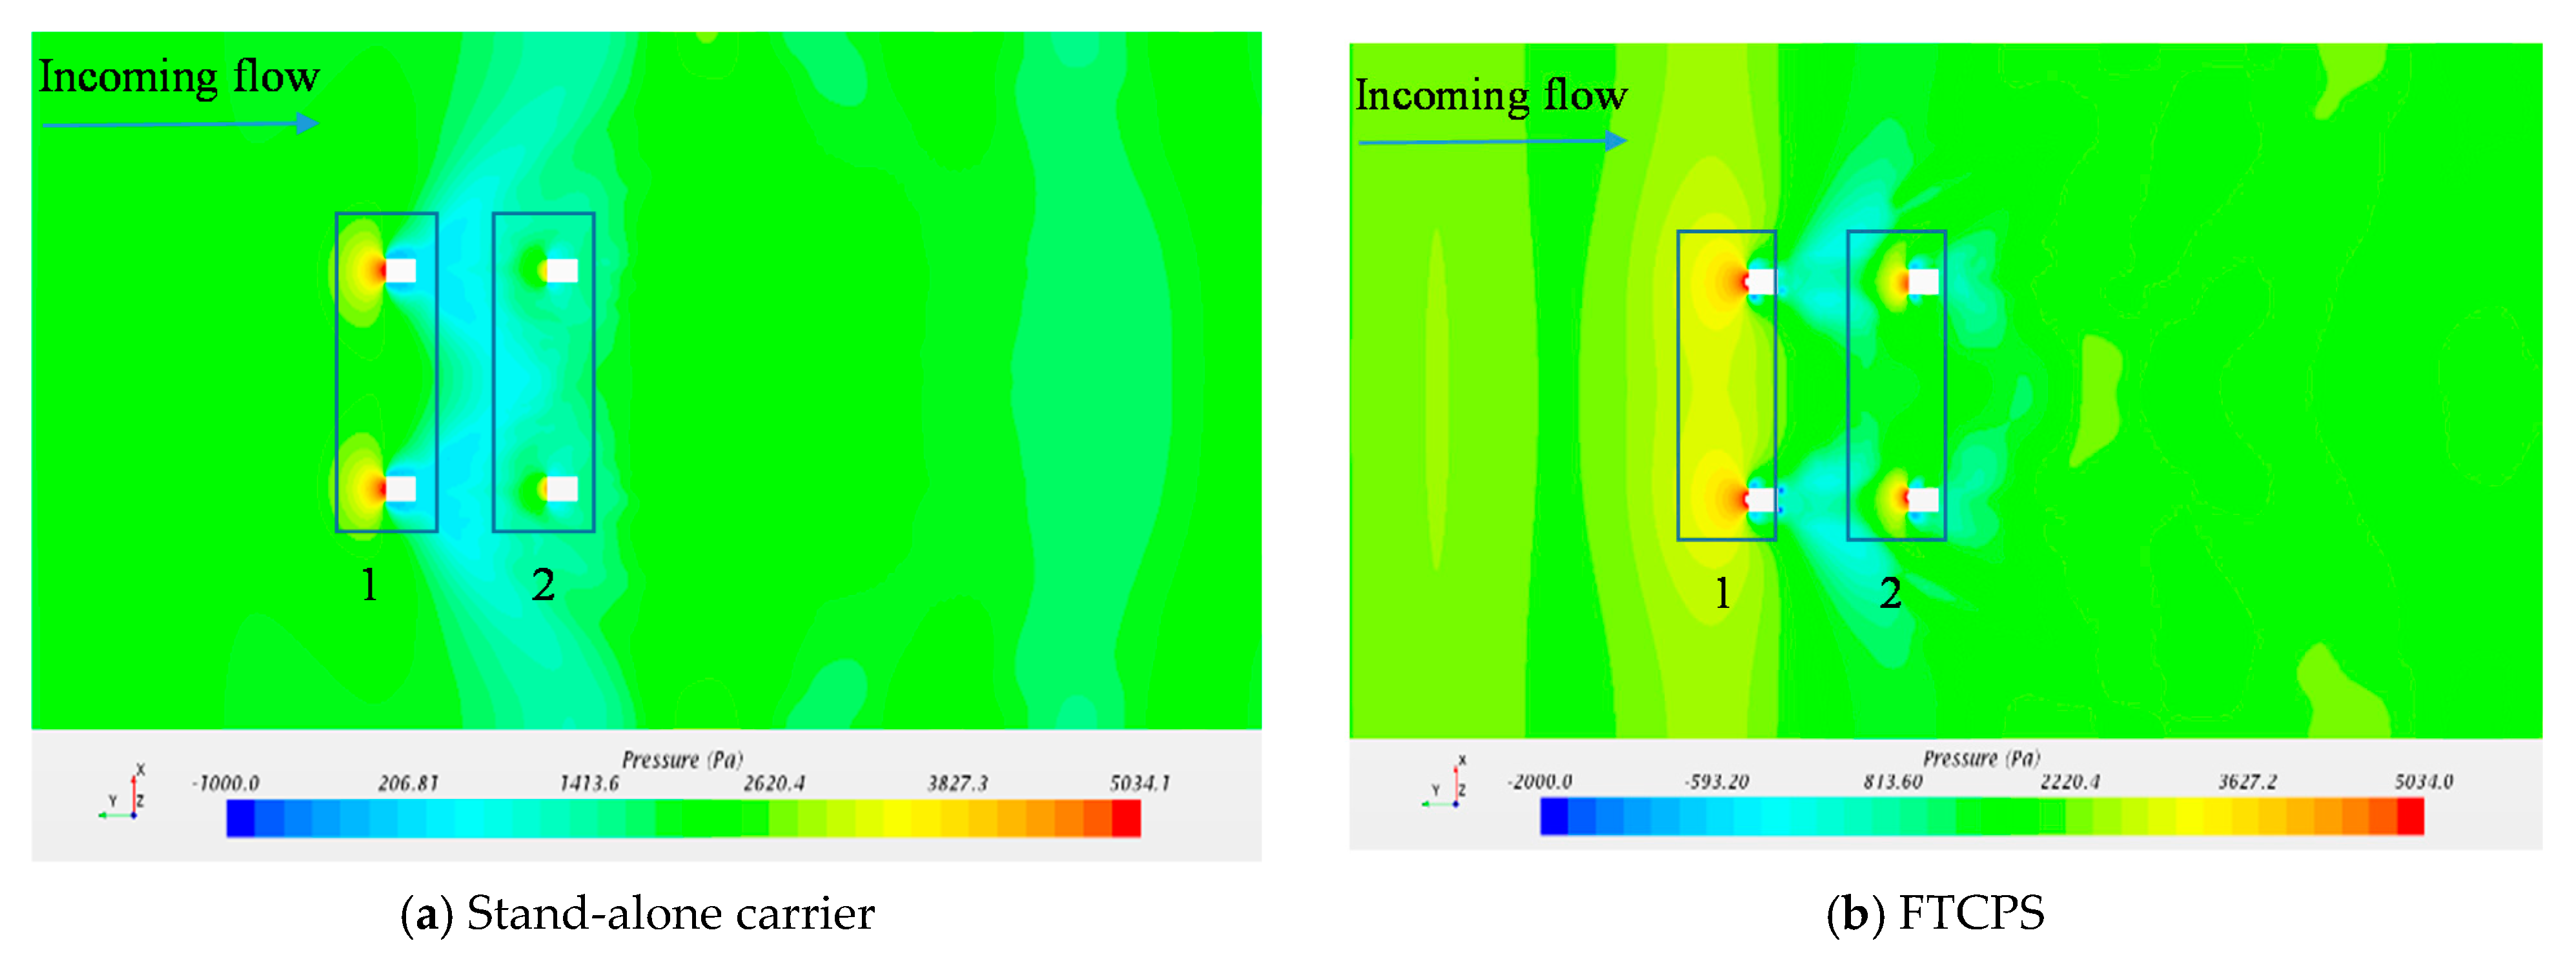
4.4.2. Flow Pressure

Figure 30 shows the flow pressure contour field for the stand-alone carrier and the carrier with twin-rotor turbine. It can be seen that both contours are symmetric. Due to the blockage effect of the twin-rotor turbine, the pressure field in front of the FTCPS is much larger than the stand-alone turbine. The fluid velocity passing across the turbine decreased due to turbine energy capturing, which leads to the pressure field increasing for the FTCPS. Meanwhile, the pressure field before the second row columns for the FTCPS is much increased due to the operation of the turbine. Therefore, the operation of the turbine can dramatically change the flow pressure field around the turbine, and the structure strength of the FTCPS should be given more consideration during the construction stage.

5. Conclusions

This research establishes a numerical simulation method for the fully coupled viscous turbine-carrier-mooring system simulation based on body fluid boundary interaction approach. The STAR-CCM+ software was used to compute the hydrodynamic performance of the vertical axis turbine and compared with the experimental results, which verified the reliability of the CFD numerical simulation method. Then, the DFBI approach was used to compute the coupled motion of the carrier, turbine, and mooring system under uniform flow conditions. The hydrodynamic characteristics, flow field characteristics, and speed ratio effects of the carrier and turbine were analyzed. According to the numerical results, the following conclusions were obtained:
(1) The average value of power output efficiency for the twin-rotor turbine reaches the maximum value when the TSR is around 2. Lateral force coefficient and the fluctuation amplitude of turbine thrust coefficient increase with the increase of speed ratio.
(2) The blockage effect caused by the columns of the carrier can increase the power output efficiency of the turbine. In the meantime, the complex flow field change also increases the fluctuation range of the thrust and lateral force of the turbine.
(3) The motion response of the carrier with the turbine in swaying and pitching will increase, but the influence of turbine rotation on the carrier heaving motion response is relatively small.
(4) The turbine output efficiency benefits from the blockage effect of the carrier. However, the existence of the carrier would increase the pressure acting on the columns of the carrier, which should be given more consideration during the construction stage of the carrier.

Author Contributions

C.H. Conceptualization, methodology, software, review and editing; C.T. Original draft preparation, formal analysis; C.Y. Data curation, software, investigation; Y.M. Supervision, project administration, funding acquisition. All authors have read and agreed to the published version of the manuscript.

Funding

This paper was funded by the National Natural Science Foundation of China grant number 51779062, 51879064,52071348, the General Project of Guangdong Province Department of Natural Resources to Promote High-quality Economic Development grant number GDOE [2020]026), the Innovation Group Project of Southern Marine Science and Engineering Guangdong Laboratory (Zhuhai) grant number 311021014.

Institutional Review Board Statement

Not applicable.

Informed Consent Statement

Not applicable.

Data Availability Statement

Not applicable.

Conflicts of Interest

The authors declare no conflict of interest.

References

  1. Khan, N.; Kalair, A.; Abas, N.; Haider, A. Review of ocean tidal, wave and thermal energy technologies. Renew. Sustain. Energy Rev. 2017, 72, 590–604. [Google Scholar] [CrossRef]
  2. Nachtane, M.; Tarfaoui, M.; Goda, I.; Rouway, M. A review on the technologies, design considerations and numerical models of tidal current turbines. Renew. Energy 2020, 157, 1274–1288. [Google Scholar] [CrossRef]
  3. Zhang, L.; Li, X.; Jing, G.; Zhang, X. Tidal enery updates 2013. Adv. New Renew. Energy 2013, 1, 53–68. [Google Scholar]
  4. Zhou, Z.; Benbouzid, M.; Charpentier, J.-F.; Scuiller, F.; Tang, T. Developments in large marine current turbine technologies—A review. Renew. Sustain. Energy Rev. 2017, 71, 852–858. [Google Scholar] [CrossRef]
  5. Ma, Y.; Li, B.; Xu, Y.; Dong, Y. Design and structural strength analysis of the gate-type tidal current energy converter. In International Conference on Offshore Mechanics and Arctic Engineering; American Society of Mechanical Engineers: New York, NY, USA, 2016. [Google Scholar]
  6. Uihlein, A.; Magagna, D. Wave and tidal current energy—A review of the current state of research beyond technology. Renew. Sustain. Energy Rev. 2016, 58, 1070–1081. [Google Scholar] [CrossRef]
  7. Jing, F.; Sheng, Q.; Zhang, L. Experimental research on tidal current vertical axis turbine with variable-pitch blades. Ocean Eng. 2014, 88, 228–241. [Google Scholar] [CrossRef]
  8. Zhang, Y.; Zhang, J.; Lin, X.; Wang, R.; Zhang, C.; Zhao, J. Experimental investigation into downstream field of a horizontal axis tidal stream turbine supported by a mono pile. Appl. Ocean Res. 2020, 101, 102257. [Google Scholar] [CrossRef]
  9. Tran, T.; Kim, D.; Song, J. Computational Fluid Dynamic Analysis of a Floating Offshore Wind Turbine Experiencing Platform Pitching Motion. Energies 2014, 7, 5011–5026. [Google Scholar] [CrossRef]
  10. Fu, S.; Jin, Y.; Zheng, Y.; Chamorro, L. Wake and power fluctuations of a model wind turbine subjected to pitch and roll oscillations. Appl. Energy 2019, 253, 113605. [Google Scholar] [CrossRef]
  11. Tran, T.; Kim, D.-H. Fully coupled aero-hydrodynamic analysis of a semi-submersible FOWT using a dynamic fluid body interaction approach. Renew. Energy 2016, 92, 244–261. [Google Scholar] [CrossRef]
  12. Guo, X.; Yang, J.; Lu, W.; Li, X. Dynamic responses of a floating tidal turbine with 6-DOF prescribed floater motions. Ocean Eng. 2018, 165, 426–437. [Google Scholar] [CrossRef]
  13. Guo, X.; Yang, J.; Li, X.; Lu, W.; Peng, T.; Li, J. Dynamic responses of a floating tidal turbine considering prescribed wave-frequency motion. In International Conference on Offshore Mechanics and Arctic Engineering; American Society of Mechanical Engineers: New York, NY, USA, 2018; Volume 10. [Google Scholar]
  14. Brown, S.; Ransley, E.; Greaves, D. Developing a coupled turbine thrust methodology for floating tidal stream concepts: Verification under prescribed motion. Renew. Energy 2020, 147, 529–540. [Google Scholar] [CrossRef]
  15. Wang, S.-Q.; Sun, K.; Zhang, J.-H.; Zhang, L. The effects of roll motion of the floating platform on hydrodynamics performance of horizontal-axis tidal current turbine. J. Mar. Sci. Technol. 2017, 22, 259–269. [Google Scholar] [CrossRef]
  16. Wang, K.; Sun, K.; Sheng, Q.-H.; Zhang, L.; Wang, S.-Q. The effects of yawing motion with different frequencies on the hydrodynamic performance of floating vertical-axis tidal current turbines. Appl. Ocean Res. 2016, 59, 224–235. [Google Scholar] [CrossRef] [Green Version]
  17. Xu, G.; Sun, S.; Liu, F. Motion response analysis of floating tidal current power station. Zhong Guo Shui Yun. J. 2015, 15, 137–140. [Google Scholar]
  18. Lynch, C.; Smith, M. Unstructured overset incompressible computational fluid dynamics for unsteady wind turbine simulations. Wind. Energy 2012, 16, 1033–1048. [Google Scholar] [CrossRef]
  19. Rogers, S.E.; Suhs, N.E.; Dietz, W.E. PEGASUS 5: An Automated Preprocessor for Overset-Grid Computational Fluid Dynamics. AIAA J. 2003, 41, 1037–1045. [Google Scholar] [CrossRef]
  20. Park, S.; Jeun, G. Coupling of rigid body dynamics and moving particle semi-implicit method for simulating isothermal multi-phase fluid interactions. Comput. Methods Appl. Mech. Eng. 2011, 200, 130–140. [Google Scholar] [CrossRef]
  21. Hirt, C.W.; Nichols, B.D. Volume of fluid (VOF) method for the dynamics Free Boundaries. J. Comput. Phys. 1981, 39, 201–225. [Google Scholar] [CrossRef]
  22. Xie, Y. Hydrodynamic Performance Research and Experiment of Vertical Axis Tidal Current Turbine; Dalian University of Technology: Dalian, China, 2016. [Google Scholar]
  23. Zhang, Y.; Zhang, Z.; Zheng, J.; Zhang, J.; Zheng, Y.; Zang, W.; Lin, X.; Fernandez-Rodriguez, E. Experimental investigation into effects of boundary proximity and blockage on horizontal-axis tidal turbine wake. Ocean Eng. 2021, 225, 108829. [Google Scholar] [CrossRef]
Figure 1. Fixed and floating tidal current turbine worldwide. (a) SeaGen; (b) AK-1000; (c) “Hai Ming” I; (d) BlueTec; (e) Evopod; (f) “Hai Neng” II.
Jmse 09 00958 g001
Figure 2. Effect picture of floating tidal current power station.
Jmse 09 00958 g002
Figure 3. Twin-rotor turbine. (a) Blade airfoil; (b) sketch of a single turbine.
Jmse 09 00958 g003
Figure 4. Simplified numerical model of floating tidal current power station.
Jmse 09 00958 g004
Figure 5. Coordinate system establishment. (a) Coordinate system of the twin-rotor turbine; (b) Coordinate system of the FTCPS.
Jmse 09 00958 g005
Figure 6. Mooring design. (a)Top view; (b) Front view.
Jmse 09 00958 g006
Figure 7. Schematic diagram of the computational domain.
Jmse 09 00958 g007
Figure 8. Geometry layout of the computational domain.
Jmse 09 00958 g008
Figure 9. Grid settings. (a) Computational domain grid of the turbine; (b) Boundary layer grid; (c) Blade surface mesh.
Jmse 09 00958 g009
Figure 10. Refined grid of the FTCPS model.
Jmse 09 00958 g010
Figure 11. Power output efficiency.
Jmse 09 00958 g011
Figure 12. Comparison of computational results and experiment results.
Jmse 09 00958 g012
Figure 13. Time history curves of power output efficiency at different speed ratios.
Jmse 09 00958 g013
Figure 14. The value of C p and C ¯ p at different speed ratios. (a) Average power output; (b) Fluctuation of power output.
Jmse 09 00958 g014
Figure 15. Time history curve of thrust coefficient at different TSRs.
Jmse 09 00958 g015
Figure 16. Average of thrust coefficient at different TSRs.
Jmse 09 00958 g016
Figure 17. Time history curves of the lateral force coefficient of a single turbine at different speed ratios.
Jmse 09 00958 g017
Figure 18. Average of lateral force at different TSRs.
Jmse 09 00958 g018
Figure 19. Influence of the carrier motion on the power output efficiency. (a) Time history curves of turbine power output efficiency; (b) Average power output efficiency.
Jmse 09 00958 g019
Figure 20. Time history curve of thrust coefficient.
Jmse 09 00958 g020
Figure 21. Time history curves of the lateral force coefficient.
Jmse 09 00958 g021
Figure 22. Time history curve of surge motion.
Jmse 09 00958 g022
Figure 23. Time history curves of pitch motion.
Jmse 09 00958 g023
Figure 24. Time history curves of heave motion.
Jmse 09 00958 g024
Figure 25. Comparison of velocity field between the fixed stand-alone twin-rotor turbine and the twin-rotor turbine with 6-DOF motion. (a) Stand-alone turbine; (b) Turbine with 6-DOF motion.
Jmse 09 00958 g025
Figure 26. Comparison of horizontal iso-velocity field for the fixed stand-alone turbine and the turbine with 6-DOF motions. (a) Fixed stand-alone turbine; (b) Turbine with 6-DOF motions.
Jmse 09 00958 g026
Figure 27. Comparison of vertical iso-velocity field for the fixed stand-alone turbine and the turbine with 6-DOF motions. (a) Fixed stand-alone turbine; (b) Turbine with 6-DOF motions.
Jmse 09 00958 g027
Figure 28. Comparison of the vertical section iso-velocity flow field for the stand-alone carrier and the carrier with twin-rotor turbine. (a) Stand-alone carrier; (b) FTCPS.
Jmse 09 00958 g028
Figure 29. Comparison of the free surface iso-velocity flow field for the stand-alone carrier and the carrier with twin-rotor turbine. (a) Stand-alone carrier; (b) FTCPS.
Jmse 09 00958 g029
Figure 30. Flow pressure for the stand-alone carrier and FTCPS. (a) Stand-alone carrier; (b) FTCPS.
Jmse 09 00958 g030
Table 1. Specific design parameters of the computational model.
CaseVelocity (m/s)TSRComputational Domain
A2.52.0Stand-alone turbine
B2.52.0FTCPS
Table 2. Specific design parameters of the computational domain.
CaseVelocity (m/s)TSRComputational Domain
C2.52.0Stand-alone carrier
D2.5 m/s2.0FTCPS
Publisher’s Note: MDPI stays neutral with regard to jurisdictional claims in published maps and institutional affiliations.

