
Structural Integrity of Fixed Offshore Platforms by Incorporating Wave-in-Deck

 ,
,
Abstract
1. Introduction
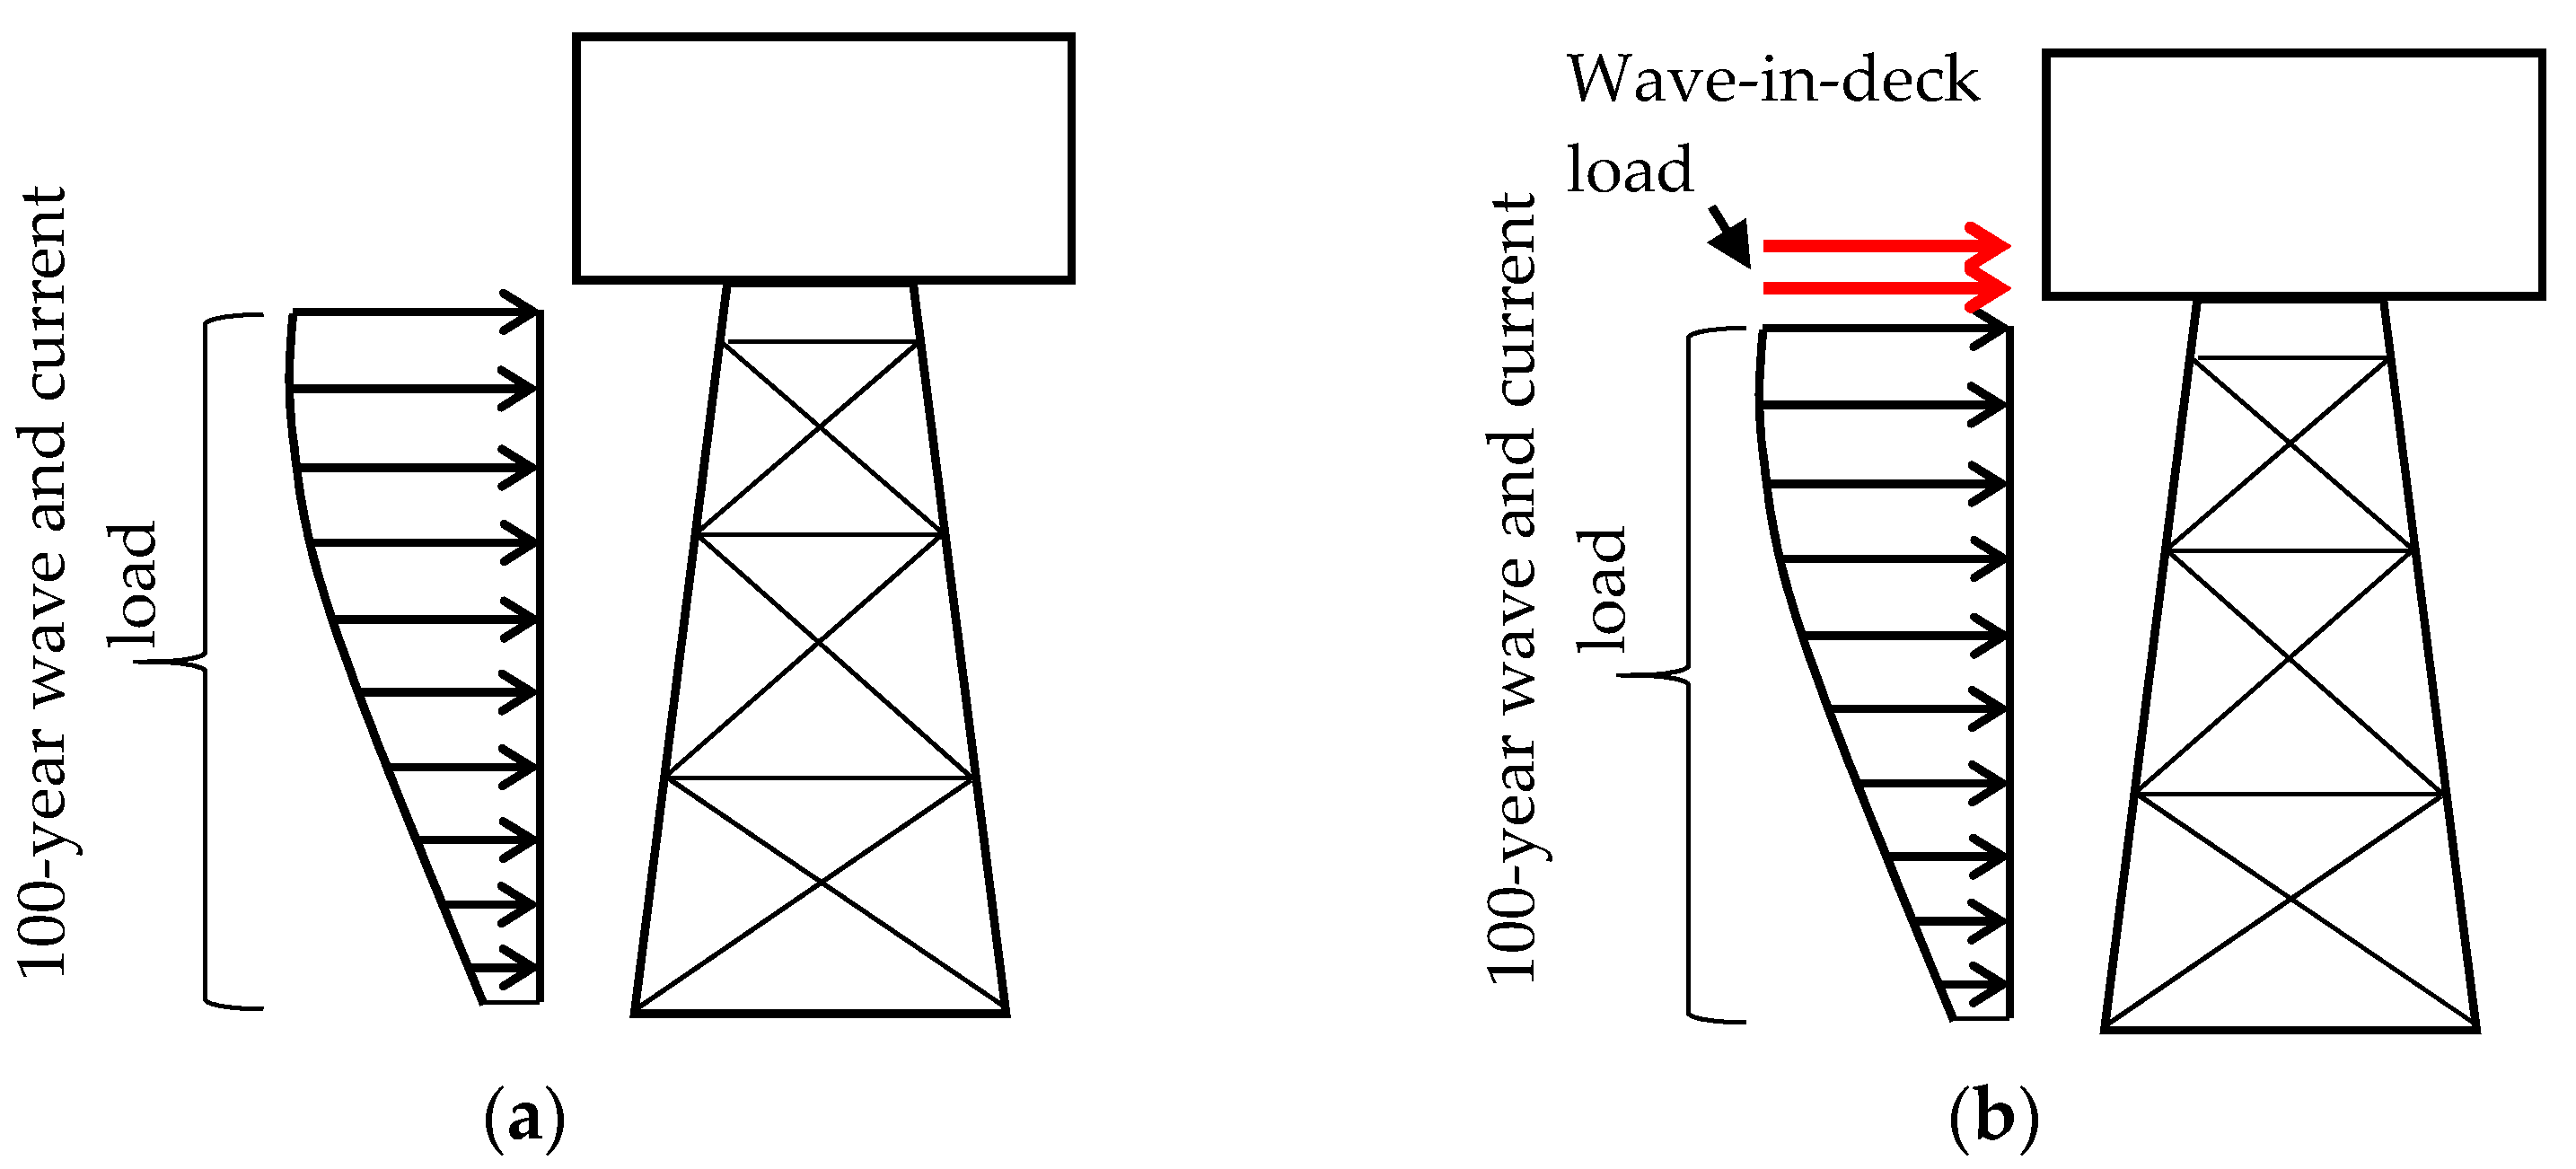
2. Wave-in-Deck Load and Reserve Strength Ratio
3. Methodology
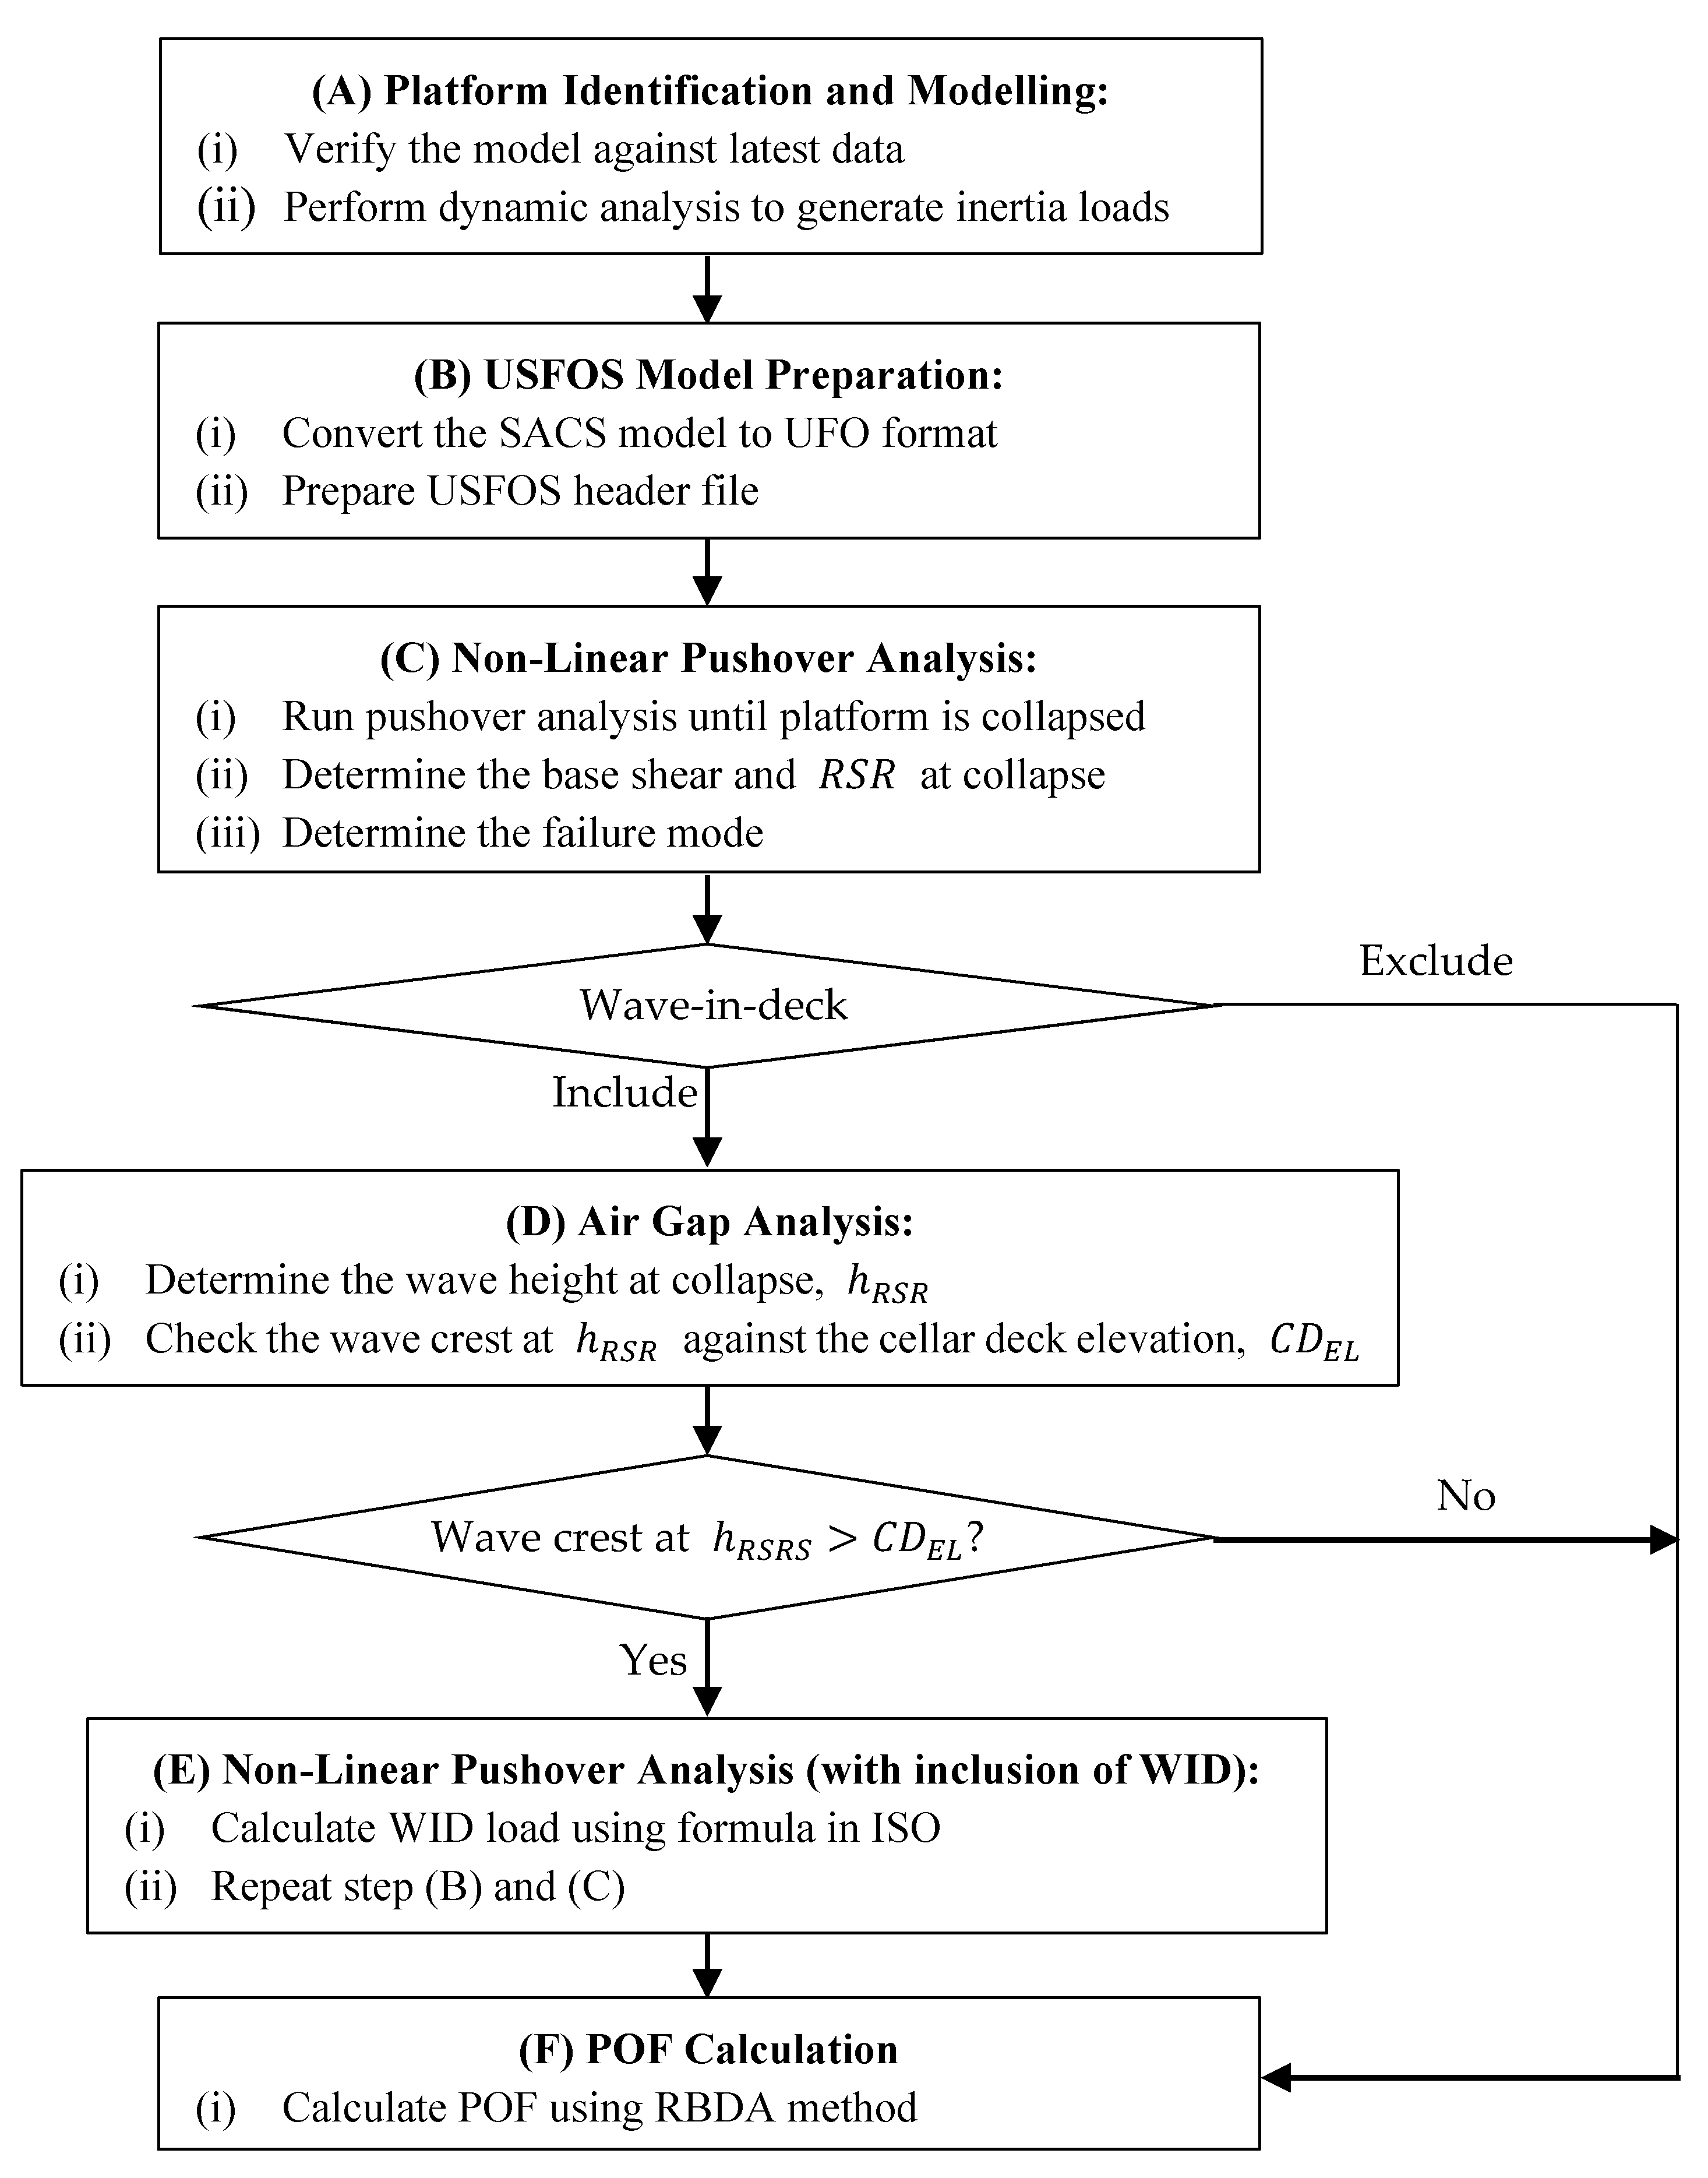
- (A)
- Platform Identification and Modelling.Selected platform was verified against latest as-built drawings, weight control report and inspection report to ensure that the analysis will represent the actual condition at site. Latest metocean data for 100-year return period were utilized consisting of maximum wave height, h100, and associated period, tass, and performed long-term distribution. Dynamic analysis was carried out to generate inertia loads. In this step, SACS software was used.
- (B)
- USFOS Model PreparationThe analysis model from step (A) was then converted to a suitable format, in this case, user-friendly (UFO) format for the subsequence pushover analysis [58]. The converted model, known as the “model.fem” file, was verified to ensure that all items such as geometries, section properties and loading were properly converted. In this study, Struman software was used for the conversion. After that, the header file was prepared. The header, known as the “header.fem” file, consists of sets of commands for the software to execute pushover analysis.
- (C)
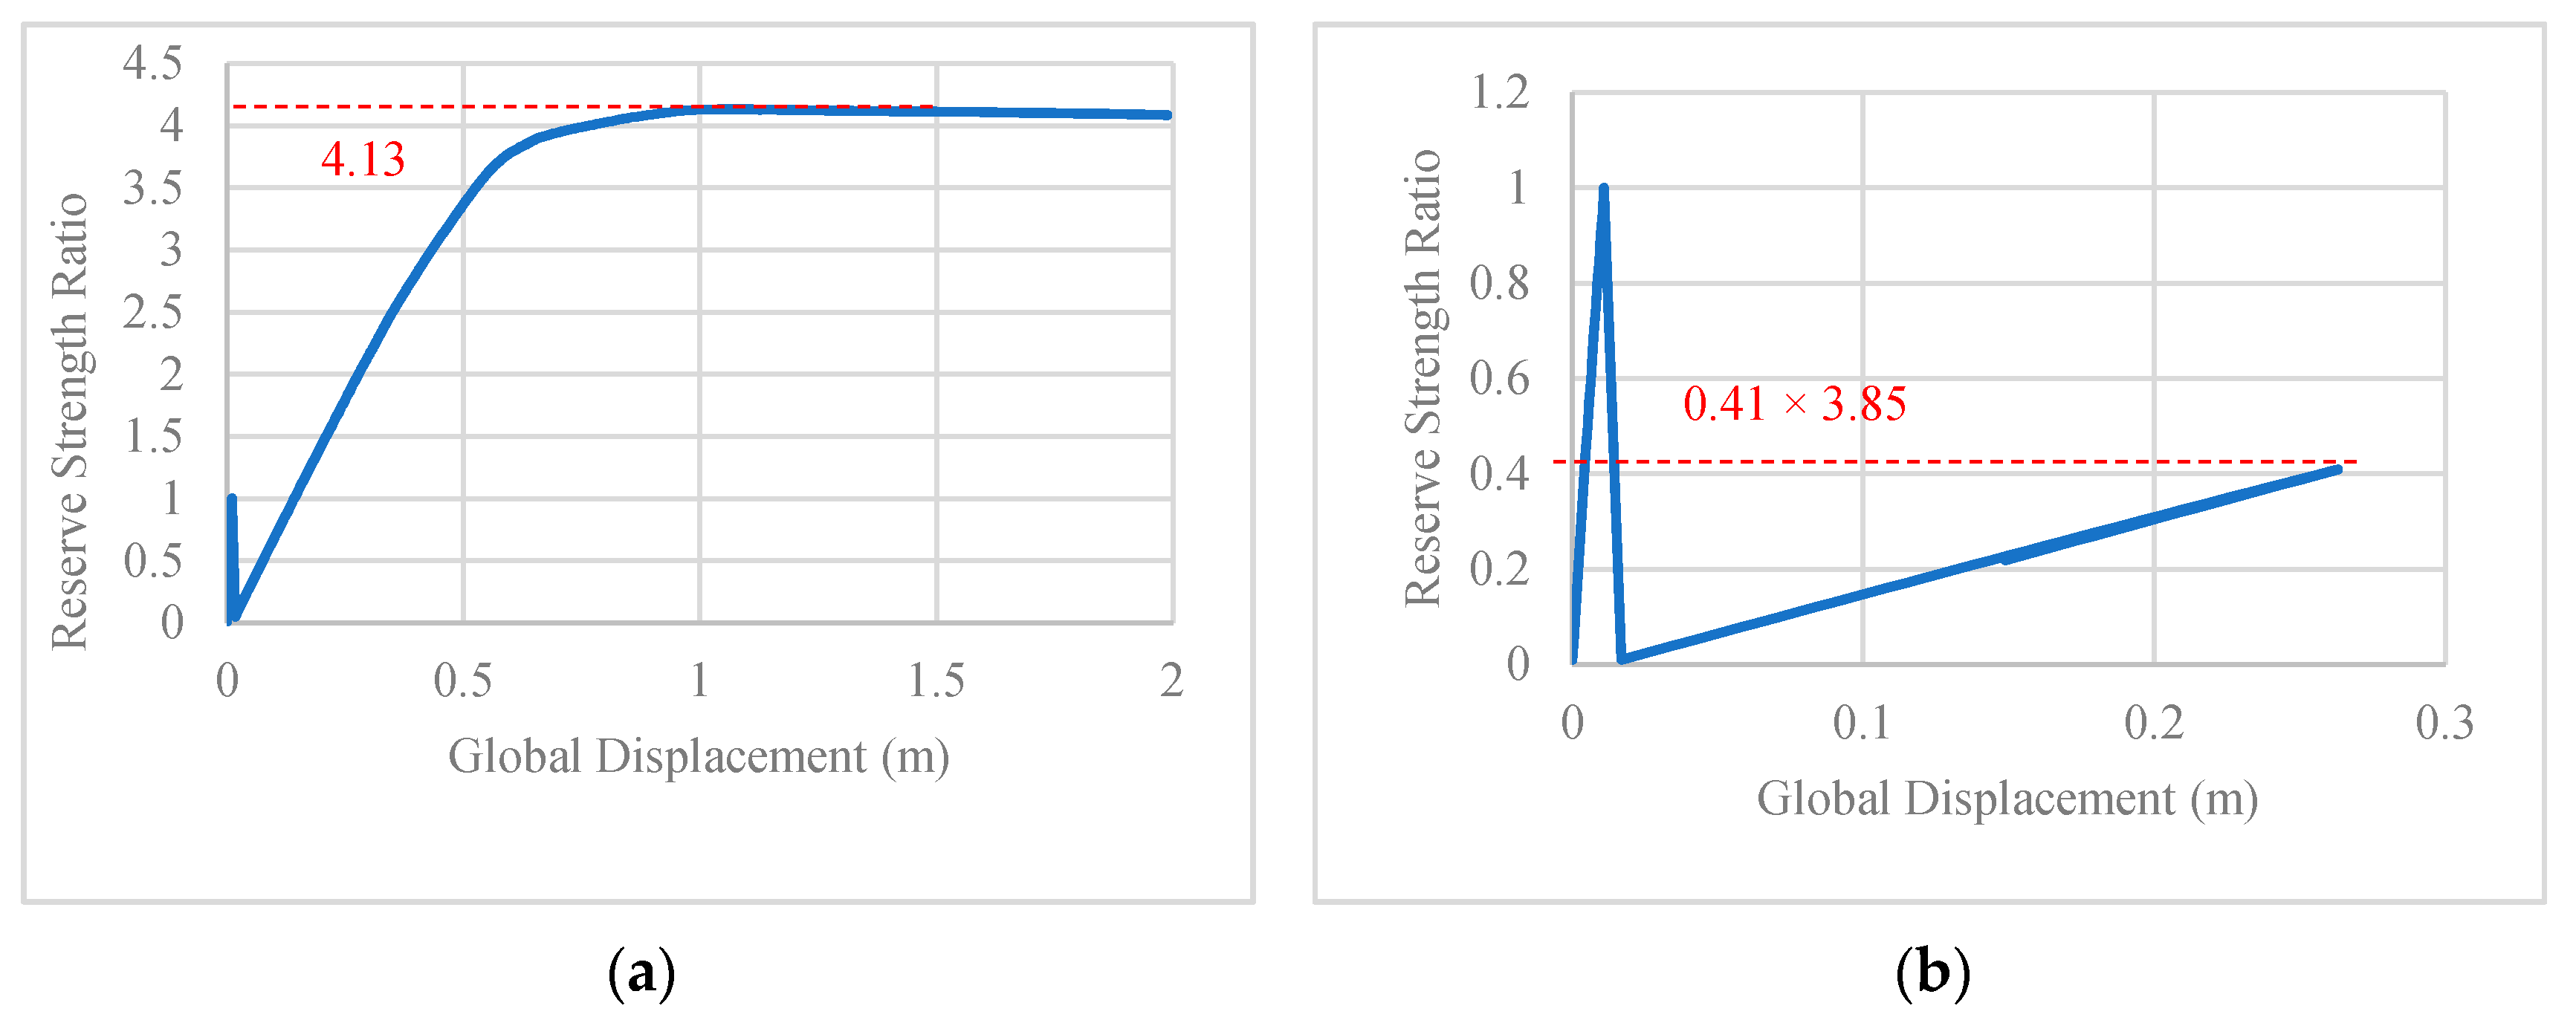
- Non-Linear Pushover Analysis and RSR DeterminationTwo input files are required to perform the pushover analysis, which are model file and header file. The pushover analysis was performed by incrementing the 100-year environmental loads until the platform collapses. The RSR was determined based on the base shear at collapse load divided by the base shear of 100-year environmental loads, as per Equation (1). The failure mode of the platform was also determined to identify the governing failure.
- (D)
- Air Gap AnalysisFrom the RSR produced in Step 3, the wave height at collapse was calculated using the limit state equation for probabilistic model equation introduced by Ayob et al. [5] as per Equation (2). Next, the wave height at collapse, hRSR, was compared against the bottom steel of cellar deck, CDEL.
- (E)
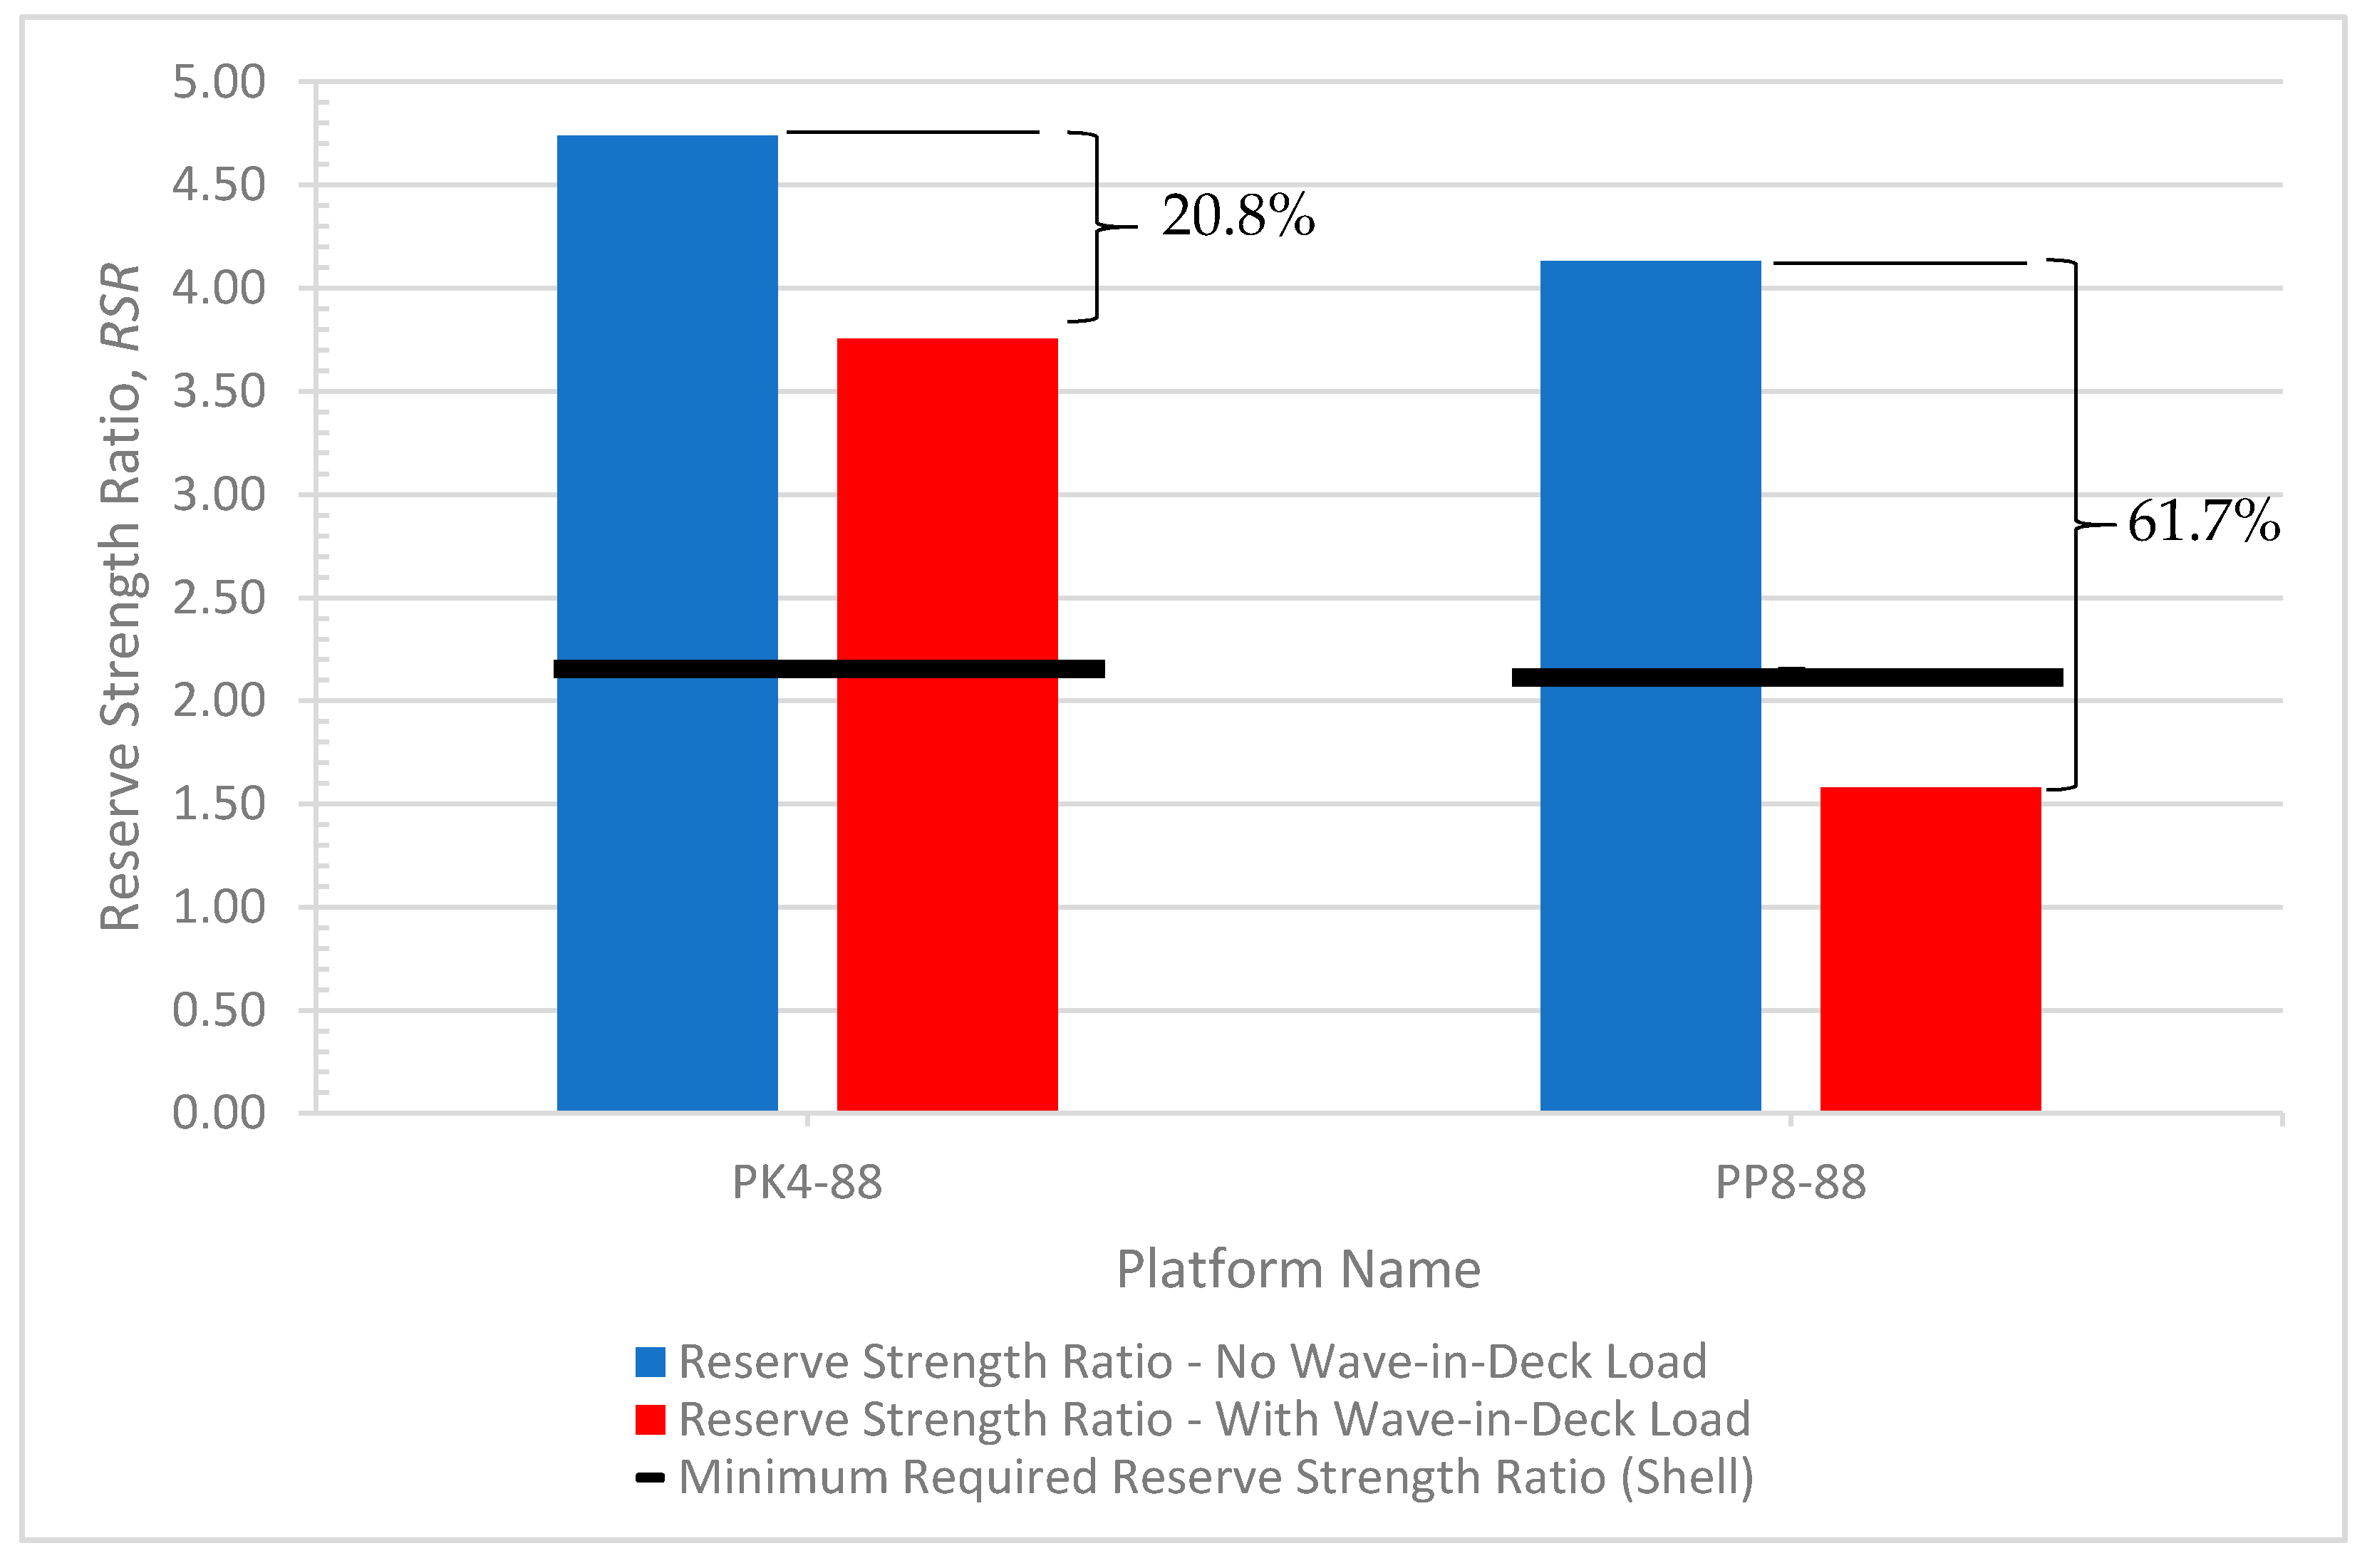
- Non-Linear Pushover Analysis and RSR Determination (with Inclusion of Wave-in-Deck)Wave-in-deck load was calculated for platform, which has the wave hitting the deck, as outlined by the ISO [44]. Dynamic analysis, considering wave-in-deck load, was also performed to generate new inertia loads. The wave-in-deck and inertia loads were then included in the pushover analysis and the new RSR was defined.
- (F)
- Probability of Failure (POF) Calculation
4. Test Structure Specification
5. Results
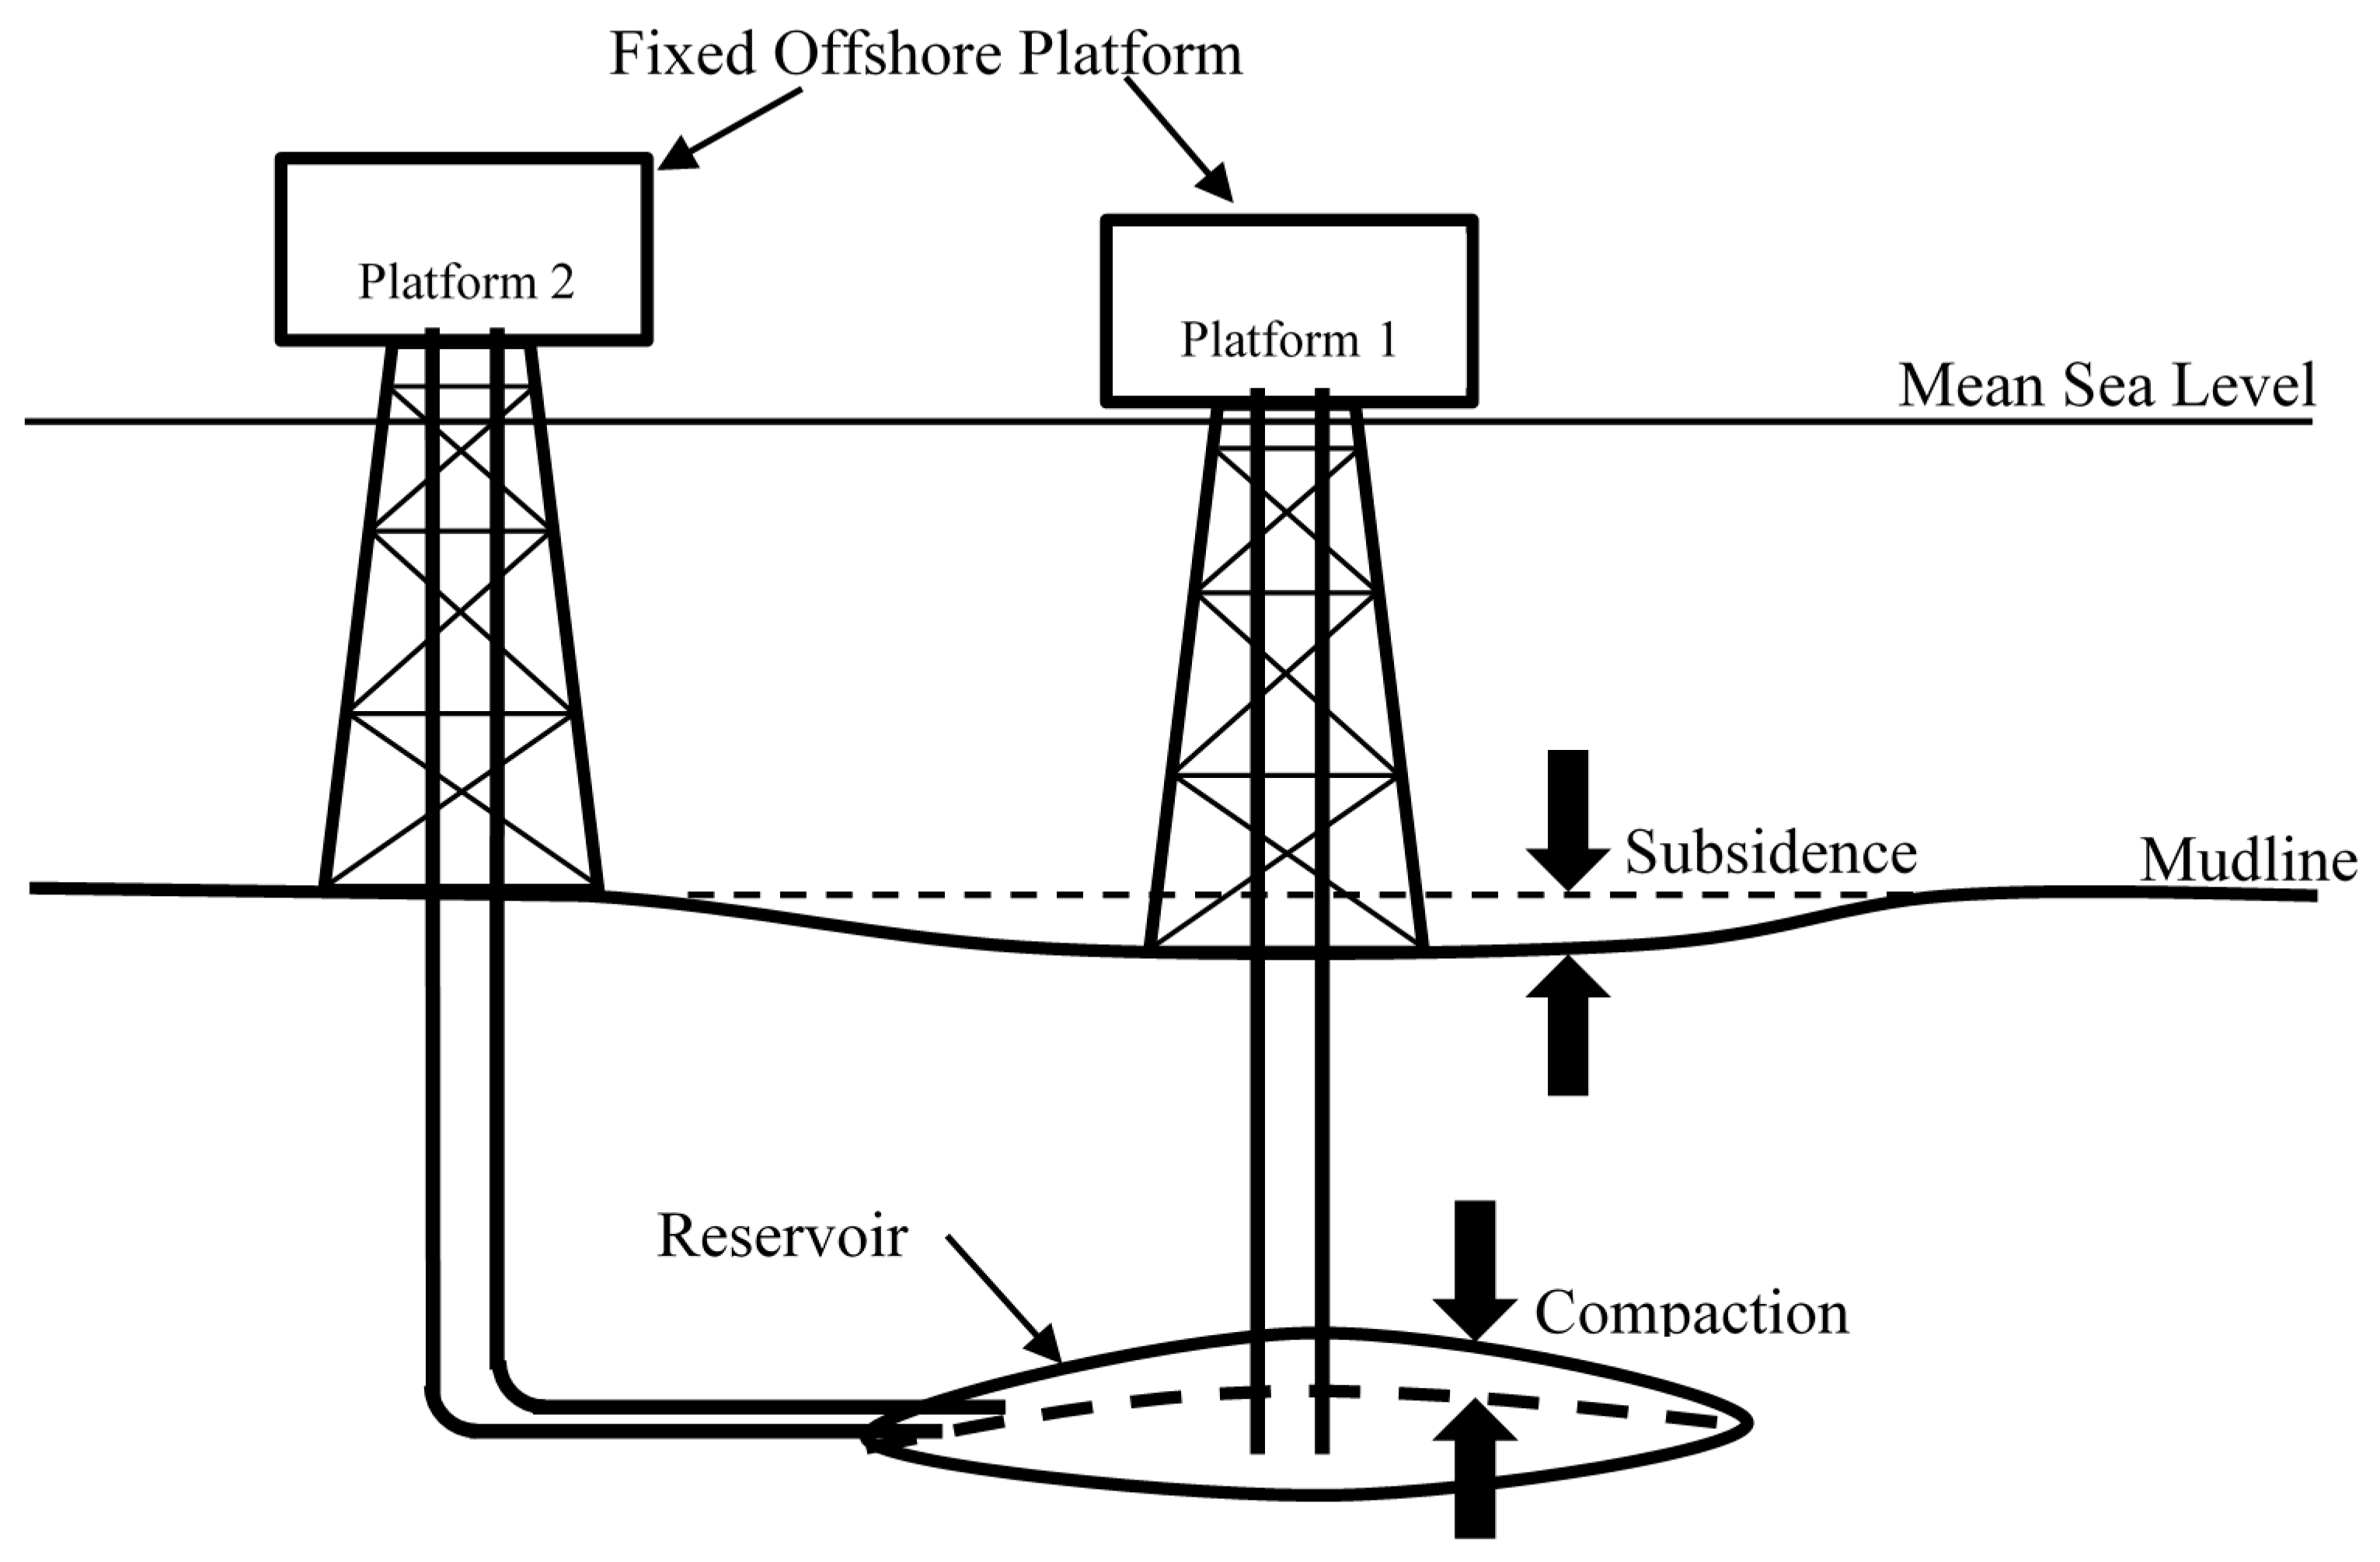
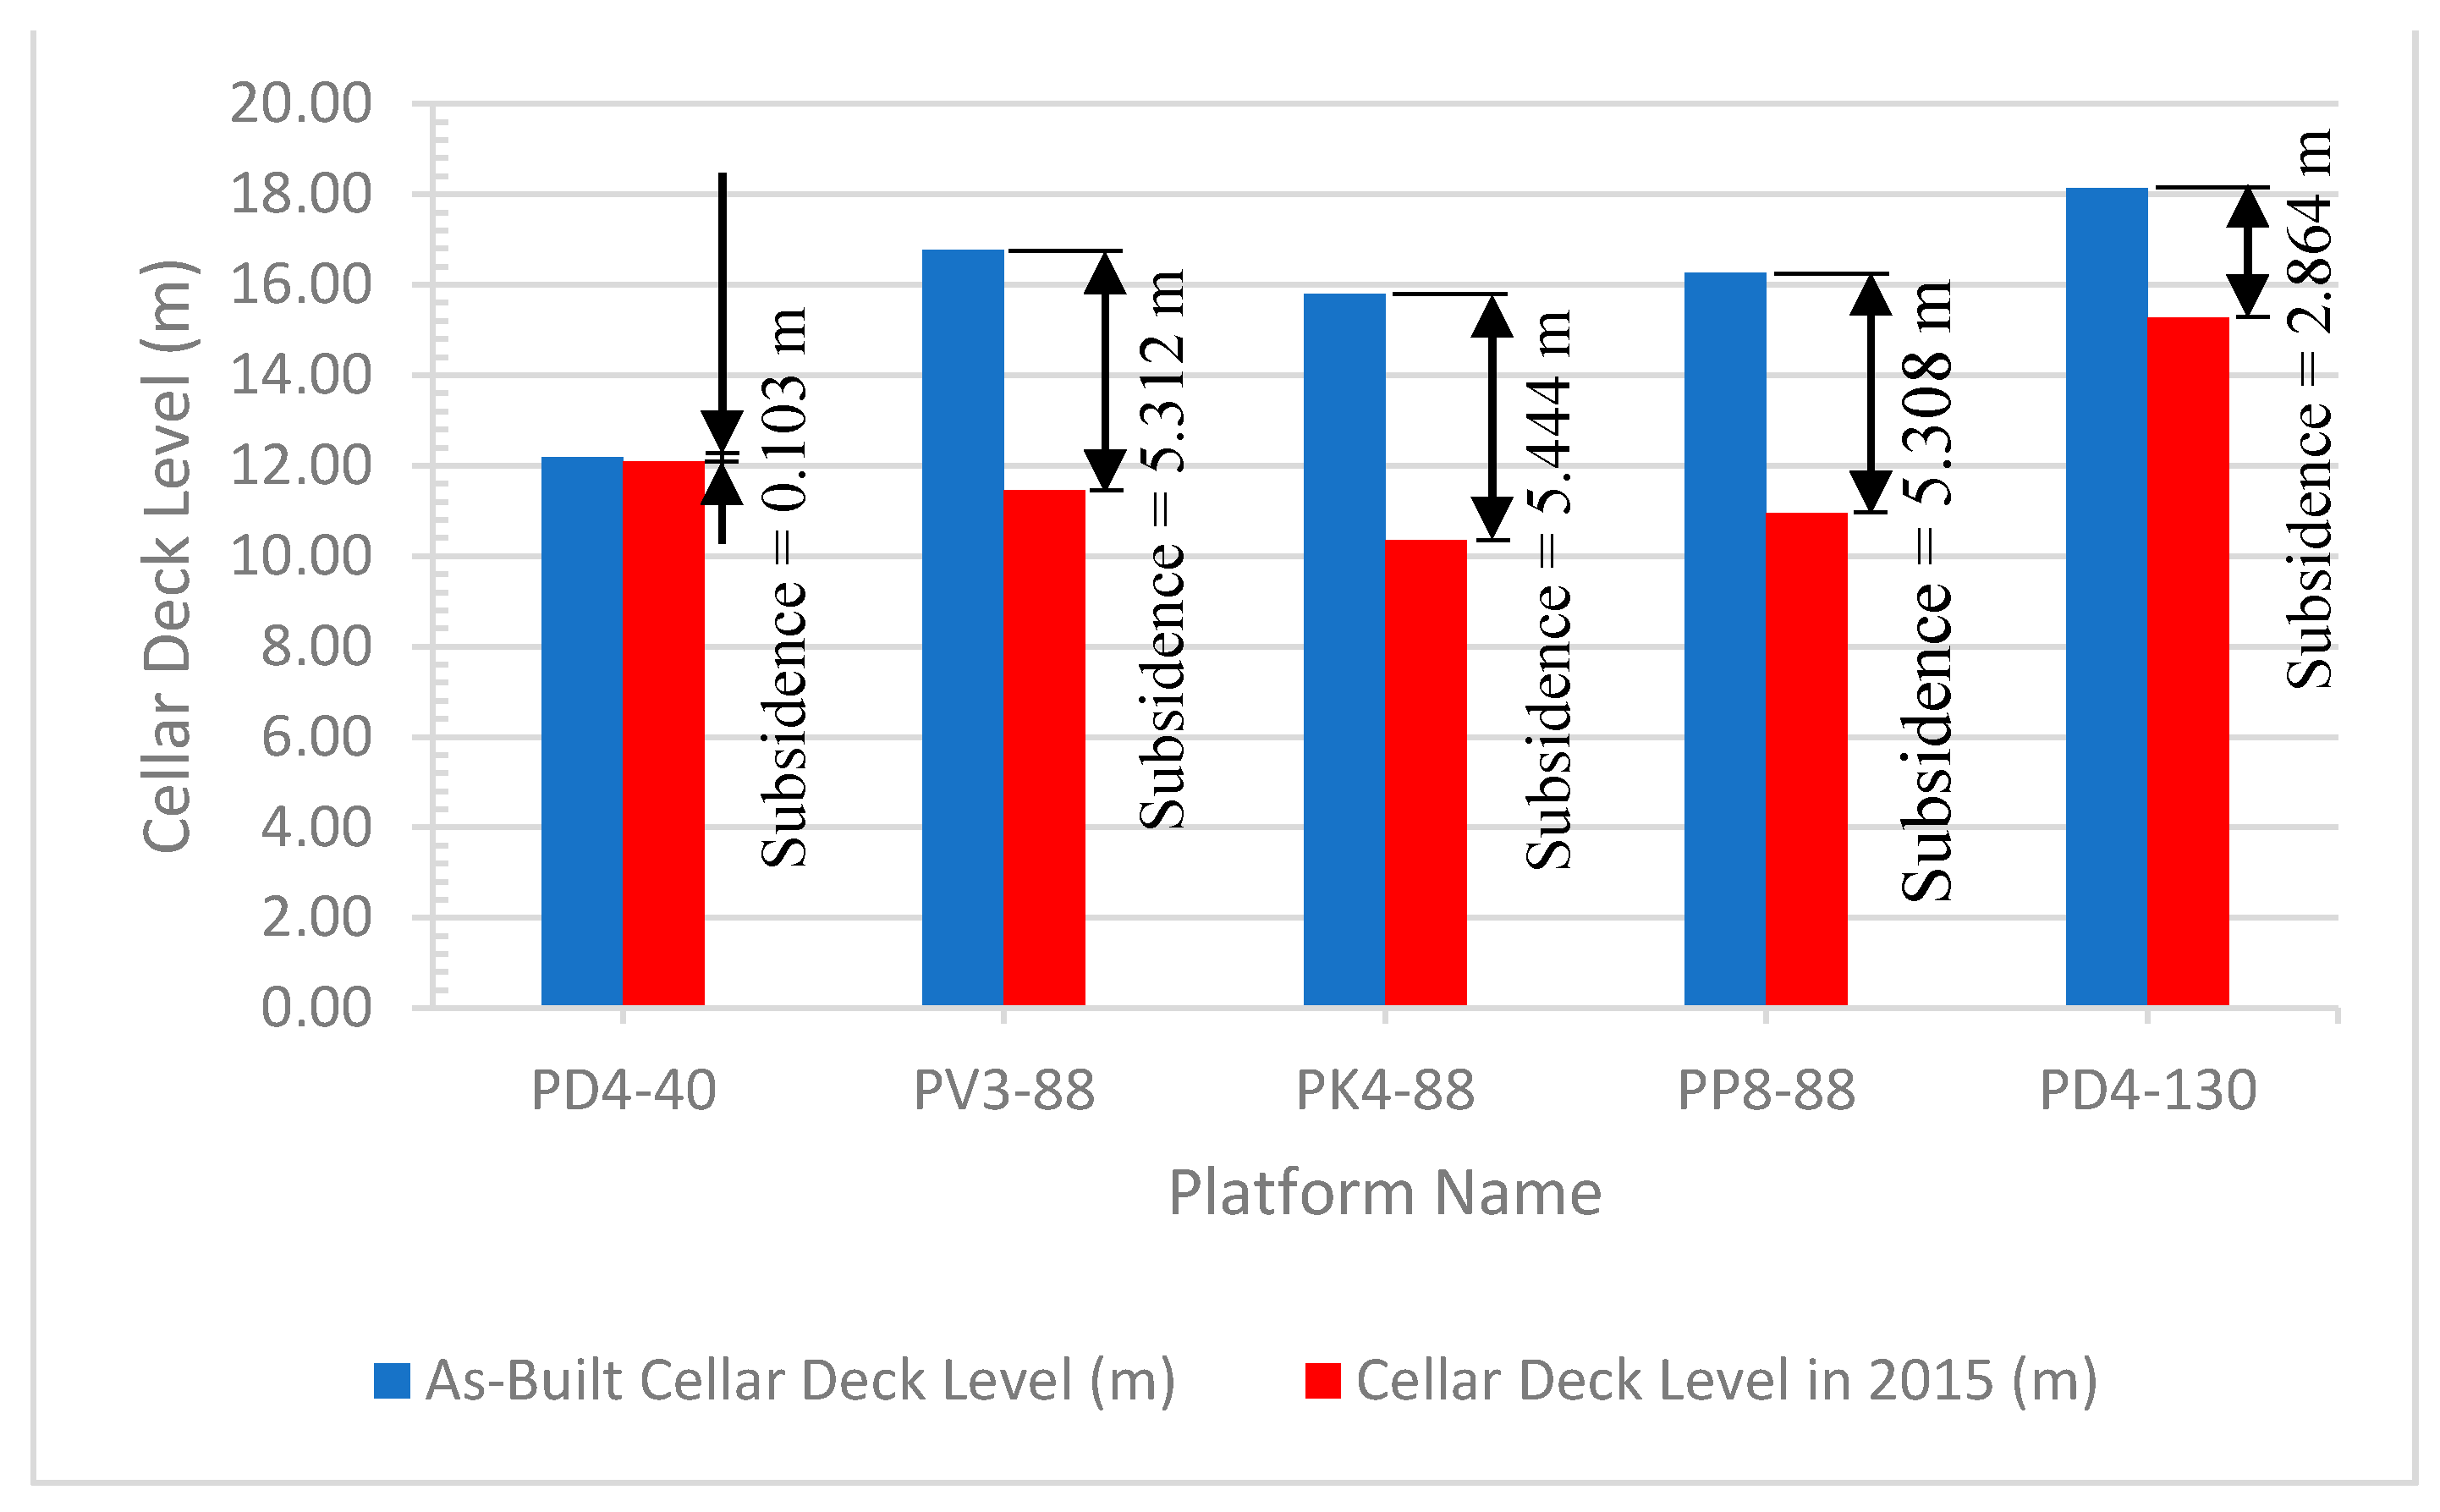
5.1. Platform Subsidence
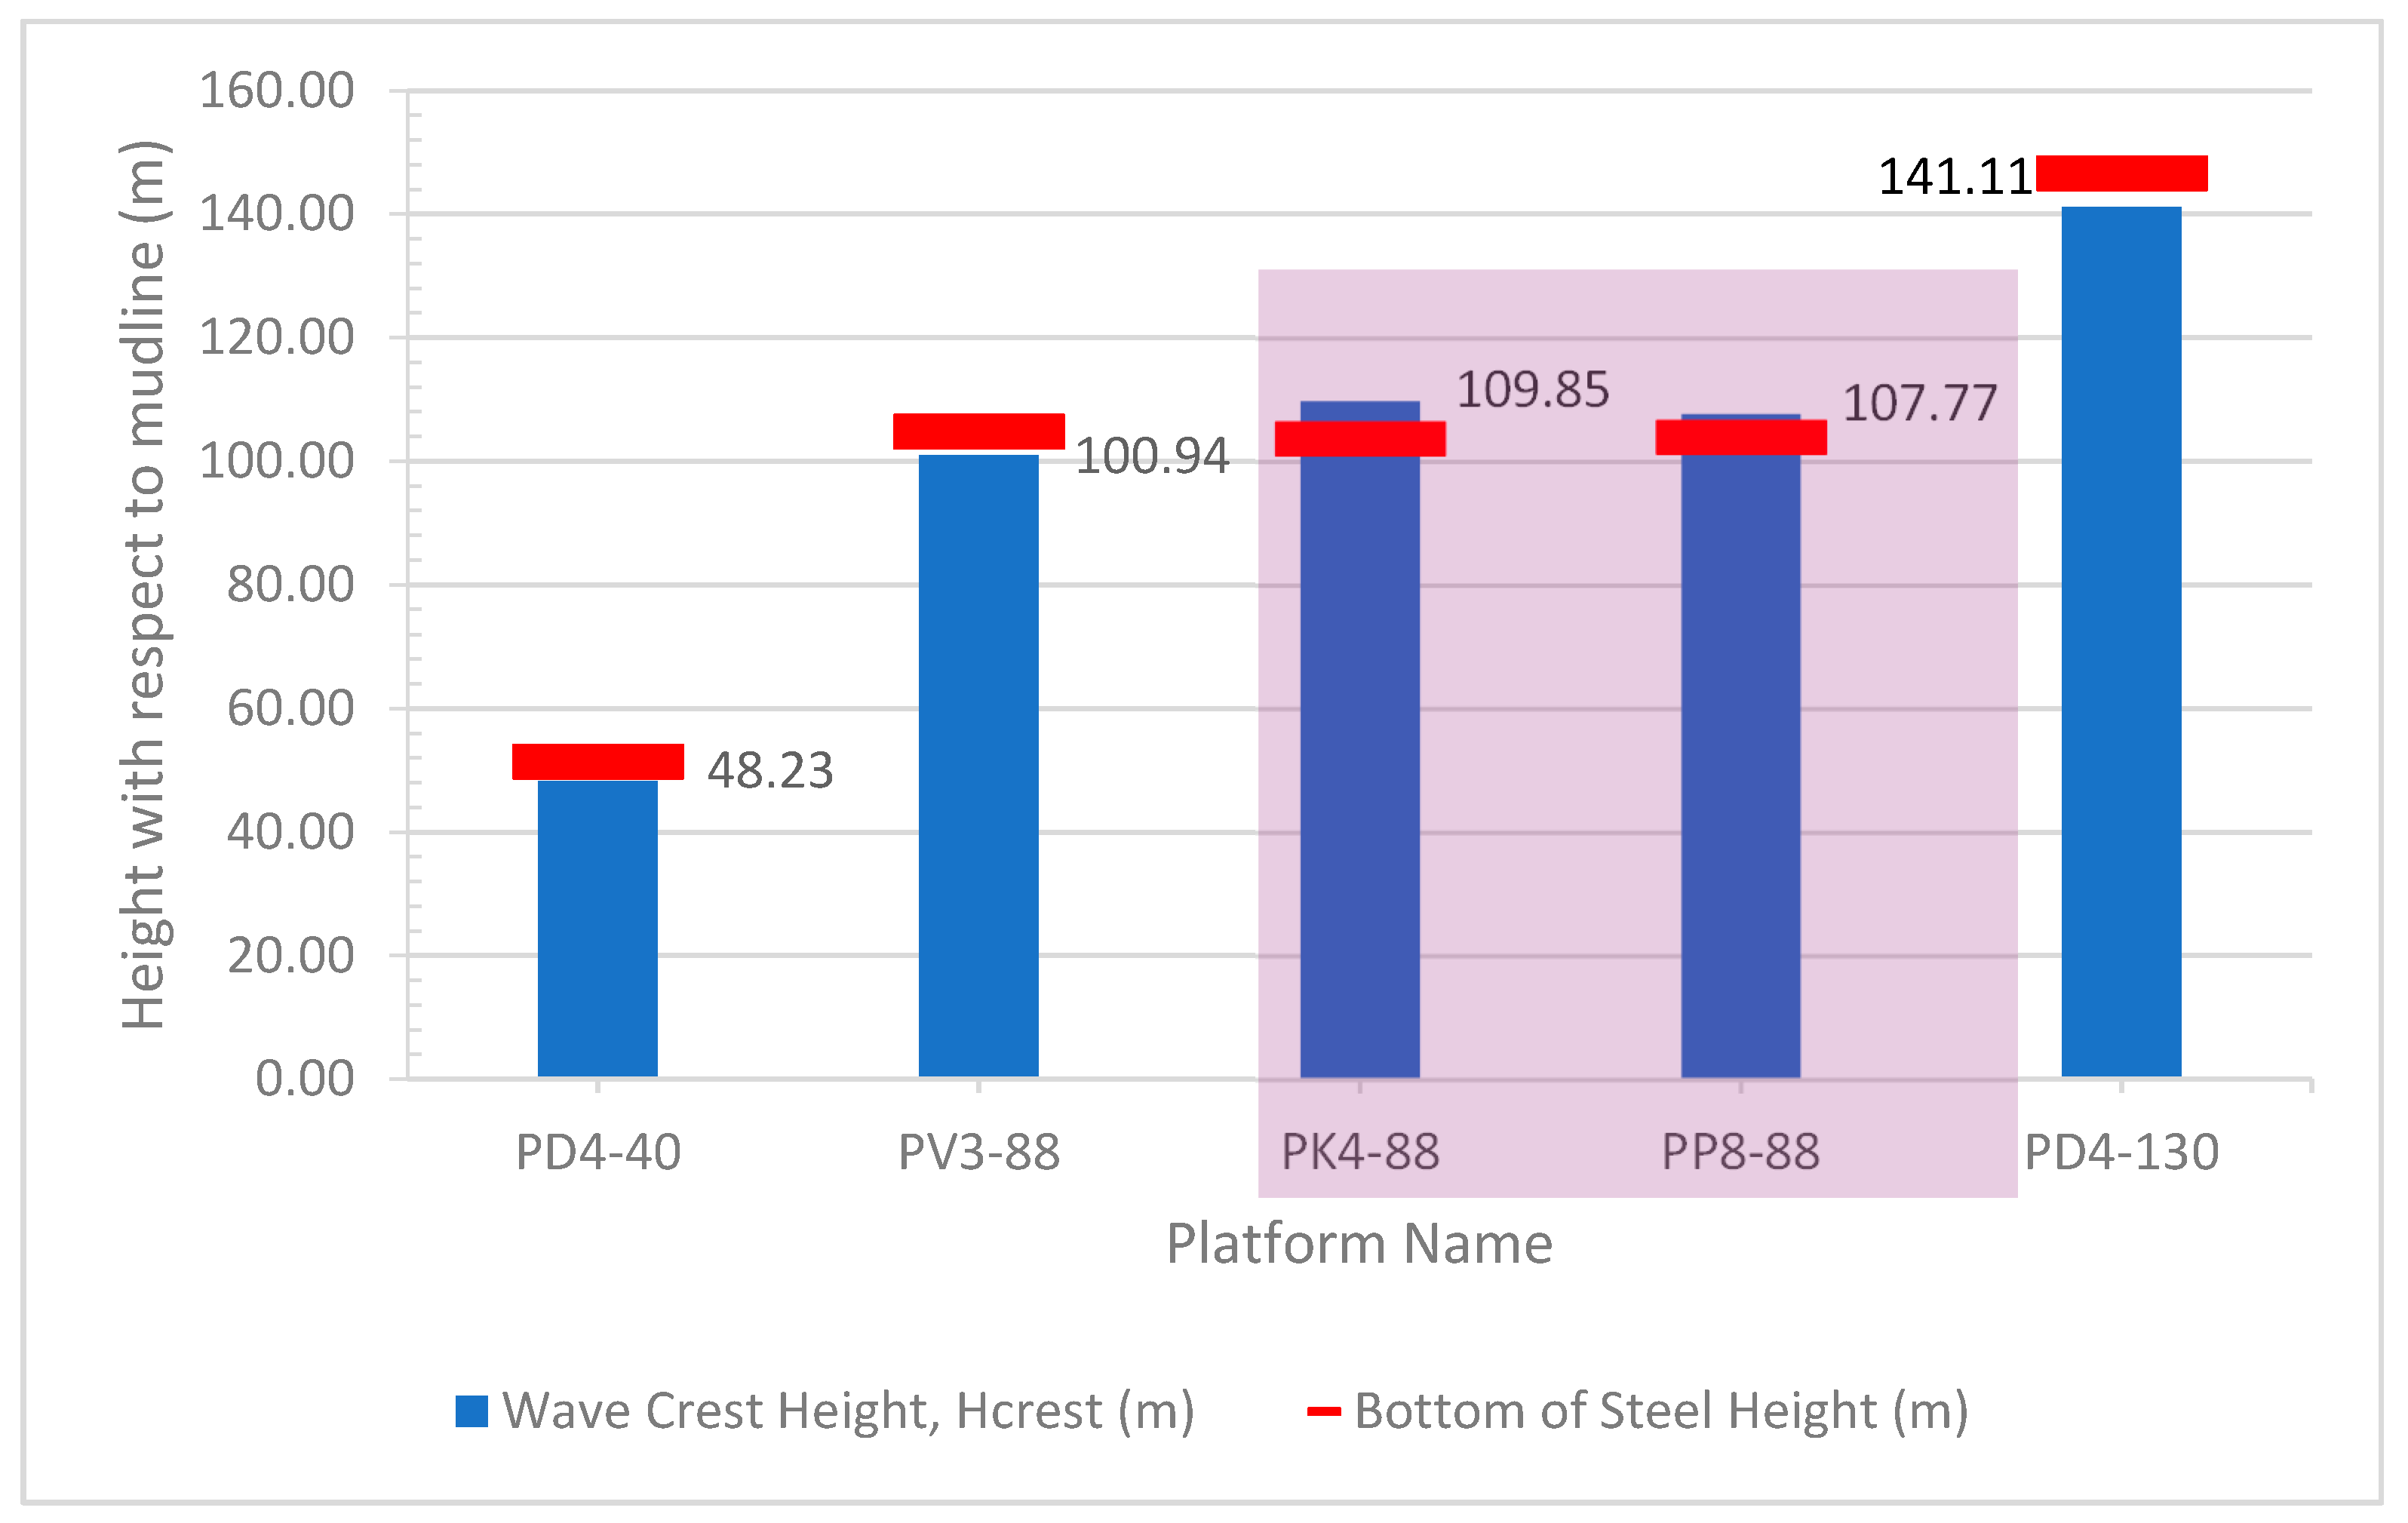
5.2. Wave Height
5.3. Wave-in-Deck Load
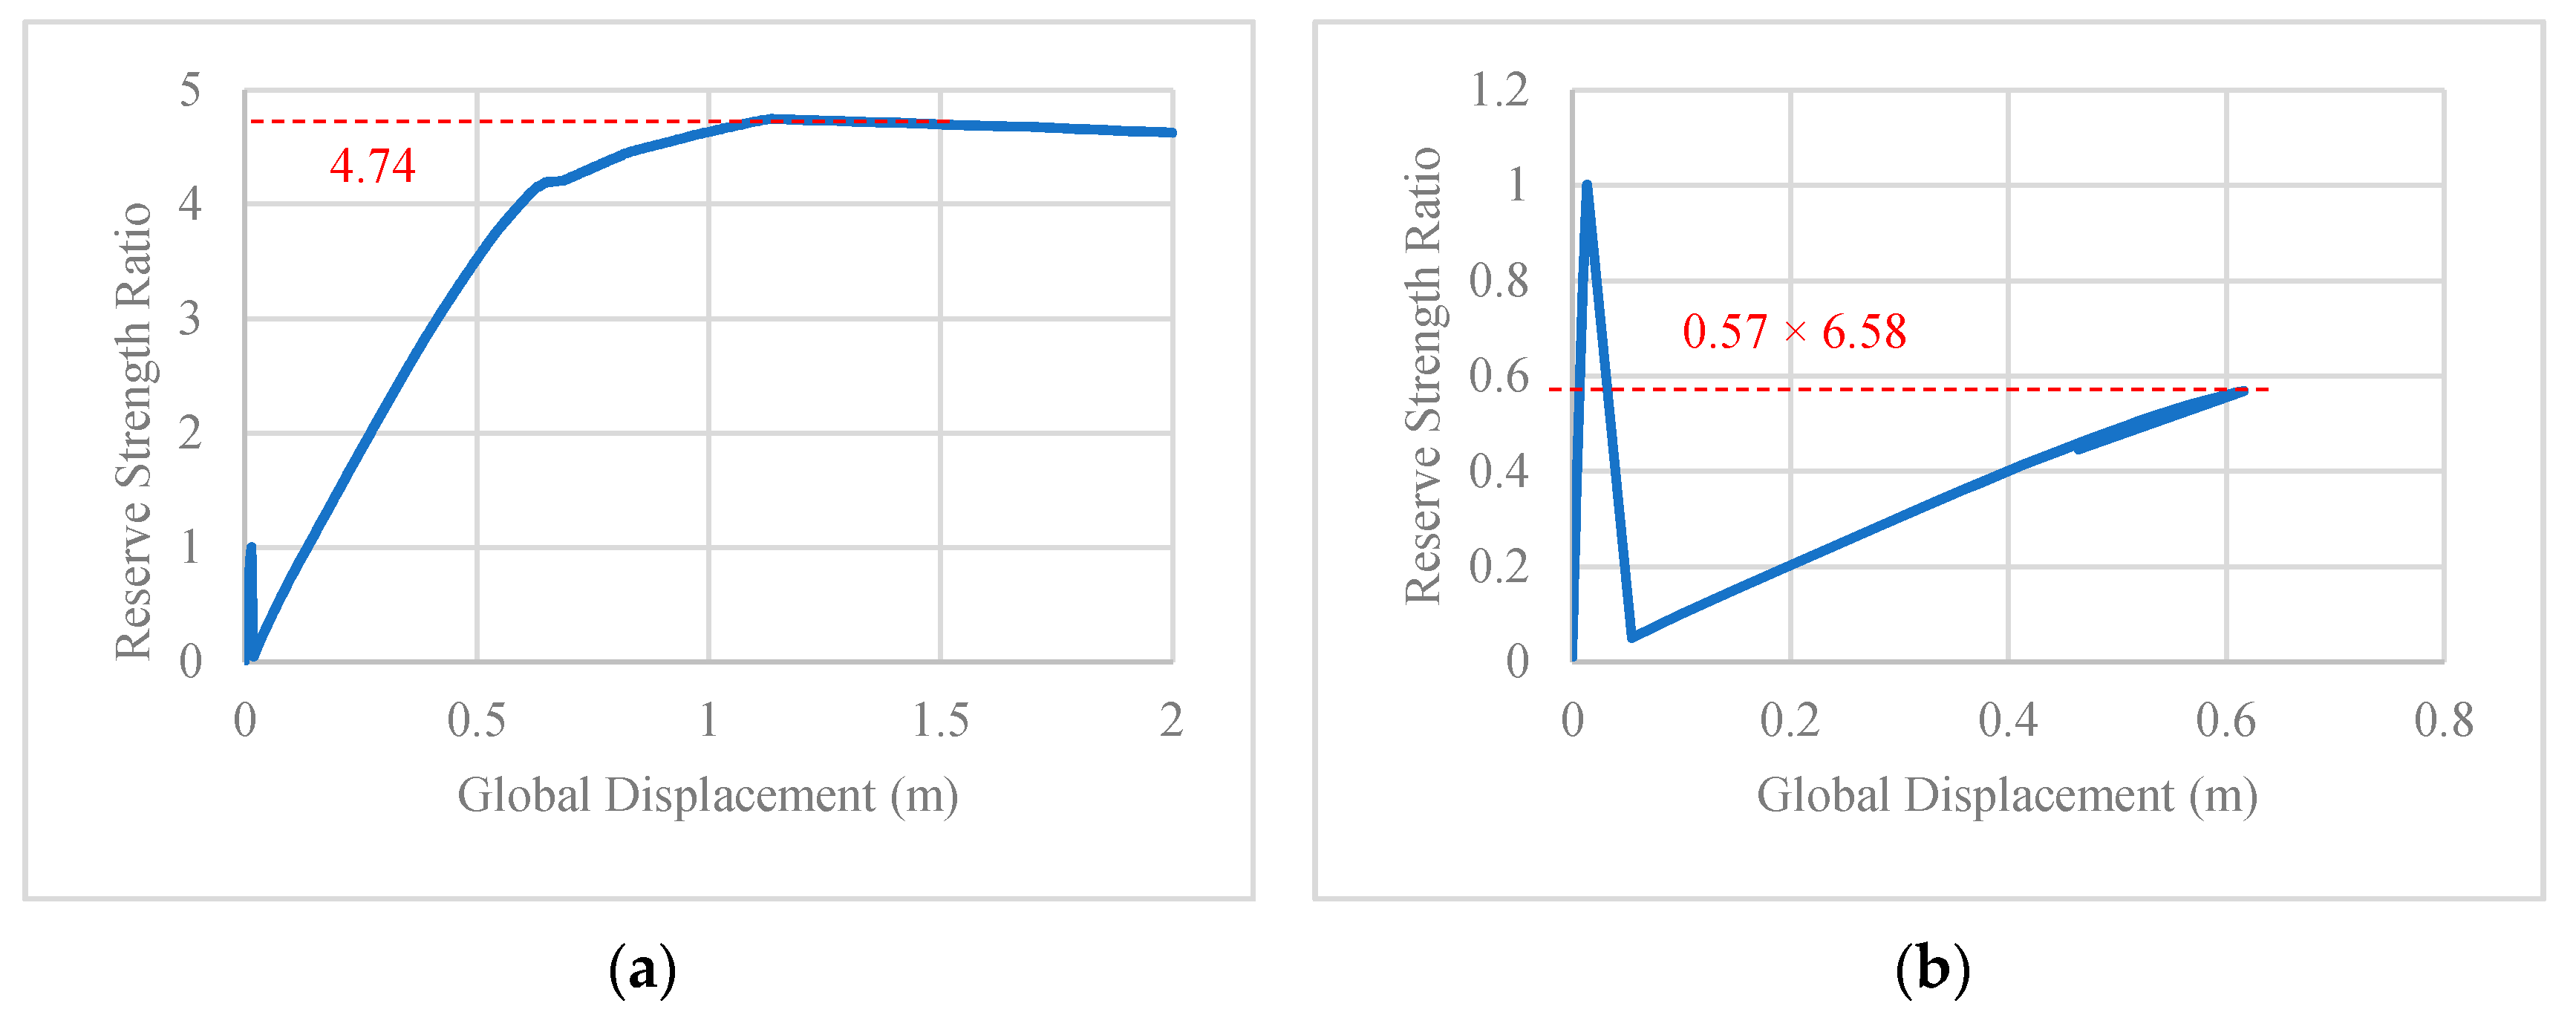
5.4. Reserve Strength Ratio
5.5. Probability of Failure
6. Conclusions
- The metocean constant, α used in this research may be further studied depending on the location of the offshore platform. Currently, α is conservatively taken as equal to 1.7, as suggested by Ayob et al. [5], for Malaysia waters of fixed offshore platform.
- Current study focuses on horizontal wave-in-deck only. It is recommended that investigation on the impact of vertical wave-in-deck load should also be carried out.
- Current study does not consider the dynamic effect of the structure when exposed to the wave-in-deck load as the analysis is performed under static non-linear pushover.
Author Contributions
Funding
Institutional Review Board Statement
Informed Consent Statement
Data Availability Statement
Acknowledgments
Conflicts of Interest
References
- Seong, C.K.; Hong, T.Y. A Review of Offshore Oilfields Development in Malaysia. In Proceedings of the SPE Oil and Gas India Conference, Kuala Lumpur, Malaysia, 20–22 March 1995. [Google Scholar]
- Sorkhabi, R. Miri 1910: The Centenary of oil Discovery in Sarawak. Geoexpro 2010, 7, 44–49. [Google Scholar]
- Zawawi, N.A.W.A.; Liew, M.S.; Na, K.L. Decommissioning of offshore platform: A sustainable framework. In 2012 IEEE Colloquium on Humanities, Science and Engineering (CHUSER); IEEE: Piscataway, NJ, USA, 2012; pp. 26–31. [Google Scholar]
- PETRONAS. PETRONAS Activity Outlook 2021–2023. In Annual Report; PETRONAS, 2020; Available online: https://www.petronas.com/sites/default/files/PAO/PETRONAS-Activity-Outlook-2021-2023.pdf (accessed on 13 September 2021).
- Ayob, M.S.; Kajuputra, A.E.; Wong, B.S. Global Ultimate Strength Assessment for Existing Offshore Jacket Structures. In Proceedings of the Off-shore Technology Conference Asia, Kuala Lumpur, Malaysia, 25–28 March 2014. [Google Scholar]
- Fazeres-Ferradosa, T.; Rosa-Santos, P.; Taveira-Pinto, F.; Vanem, E.; Carvalho, H.; Correia, J.A.F.D.O. Editorial: Advanced research on offshore structures and foundation design: Part 1. Proc. Inst. Civ. Eng. Marit. Eng. 2019, 172, 118–123. [Google Scholar] [CrossRef]
- Fazeres-Ferradosa, T.; Rosa-Santos, P.; Taveira-Pinto, F.; Pavlou, D.; Gao, F.-P.; Carvalho, H.; Oliveira-Pinto, S. Preface: Advanced Research on Offshore Structures and Foundation Design: Part 2. Proc. Inst. Civ. Eng. Marit. Eng. 2020, 173, 96–99. [Google Scholar] [CrossRef]
- Zaki, N.M.; Abu Husain, M.; Najafian, G. Extreme structural response values from various methods of simulating wave kinematics. Ships Offshore Struct. 2014, 11, 1–16. [Google Scholar] [CrossRef]
- Lopez-Ortega, A.; Bayon, R.; Arana, J.L. Evaluation of Protective Coatings for Offshore Applications. Corrosion and Tribocor-rosion Behaviour in Synthetic Seawater. Surf. Coat. Technol. 2018, 349, 1083–1097. [Google Scholar]
- Kang, B.J.; Kim, J.H.; Kim, Y. Engineering Criticality Analysis on an Offshore Structure using the First and Second-Order Reli-ability Method. Int. J. Nav. Archit. Ocean. Eng. 2016, 8, 577–588. [Google Scholar] [CrossRef]
- Yu, Z.; Amdahl, J. A review of structural responses and design of offshore tubular structures subjected to ship impacts. Ocean Eng. 2018, 154, 177–203. [Google Scholar] [CrossRef]
- Fazeres-Ferradosa, T.; Chambel, J.; Taveira-Pinto, F.; Rosa-Santos, P.; Taveira-Pinto, F.; Giannini, G.; Haerens, P. Scour Protections for Offshore Foundations of Marine Energy Harvesting Technologies: A Review. J. Mar. Sci. Eng. 2021, 9, 297. [Google Scholar] [CrossRef]
- Ng, S.M.; Khan, R.; Isnadi, B.; Lee, L.A.; Saminal, S.N. A Holistic Approach to Life Extension of Fixed Offshore Platforms in Malaysian Waters. In Proceedings of the International Petroleum Technology Conference, Beijing, China, 26–28 March 2019. [Google Scholar]
- Hokstad, P.; Håbrekke, S.; Johnsen, R.; Sangesland, S. Ageing and Extension for Offshore Facilities in General and for Specific Systems. In SINTEF Technology and Society; SINTEF Technology and Society: Trondheim, Norway, 2010. [Google Scholar]
- Abu Husain, M.; Zaki, N.M.; Mallahzadeh, H.; Najafian, G. Short-term probability distribution of the extreme values of offshore structural response by an efficient time simulation technique. Ships Offshore Struct. 2014, 11, 1–14. [Google Scholar] [CrossRef]
- Mukhlas, N.A.; Zaki, N.I.M.; Abu Husain, M.K.; Najafian, G. Efficient derivation of extreme offshore structural response exposed to random wave loads. Ships Offshore Struct. 2018, 13, 719–733. [Google Scholar] [CrossRef]
- Ersdal, G.; Ho¨rnlund, E. Assessment of Offshore Structures for Life Extension. In Proceedings of the 27th International Conference on Offshore Mechanics and Arctic Engineering, Estoril, Portugal, 15–20 June 2008; pp. 277–284. [Google Scholar]
- Zaki, N.M.; Abu Husain, M.; Najafian, G. Extreme structural responses by nonlinear system identification for fixed offshore platforms. Ships Offshore Struct. 2018, 13, 251–263. [Google Scholar] [CrossRef]
- Zaman, M.M.; Abdulraheem, A.; Roegiers, J. Reservoir Compaction and Surface Subsidence in the North Sea Ekofisk Field. In Subsidence Due to Fluid Withdrawal. Development in Petroleum Science; Chilingarian, G.V., Donaldson, E.C., Yen, T.F., Eds.; Elsevier Science B.V.: Amsterdam, The Netherlands, 1995; Volume 41, pp. 373–423. [Google Scholar]
- Nagel, N. Compaction and subsidence issues within the petroleum industry: From wilmington to ekofisk and beyond. Phys. Chem. Earth Part A Solid Earth Geod. 2001, 26, 3–14. [Google Scholar] [CrossRef]
- Amdahl, J.; Holmas, T. ISUM for Offshore Frame Structures. Ocean. Eng. 2016, 7. [Google Scholar] [CrossRef]
- Hansen, K.; Gudmestad, O.T. Reassessment of Jacket Type of Platforms Subject to Wave-in-Deck Forces: Current Practice and Future Development. In Proceedings of the Eleventh (2001) International Offshore and Polar Engineering Conference, Stavanger, Norway, 17–22 June 2001. [Google Scholar]
- Kurian, V.J.; Voon, M.C.; Wahab, M.M.A.; Liew, M.S. System Reliability Assessment of Existing Jacket Platform in Malay-sian Waters. Res. J. Appl. Sci. Eng. Technol. 2014, 8, 2305–2314. [Google Scholar] [CrossRef]
- Elsayed, T.; El-Shaib, M.; Gbr, K. Reliability of fixed offshore jacket platform against earthquake collapse. Ships Offshore Struct. 2016, 11, 167–181. [Google Scholar] [CrossRef]
- Singh, D.; Panneerselvam, N.; Kumar, D. Reliability Analysis of Strength of Offshore Jackets in Indian Western Offshore. In Proceedings of the SPE Oil and Gas India Conference and Exhibition, Mumbai, India, 24–26 November 2015. [Google Scholar]
- Mat Soom, E.; Abu Husain, M.K.; Mohd Zaki, N.I.; Azman, N.U.; Najafian, G. Reliability-Based Design and Assessment for Lifetime Extension of Ageing Offshore Structures. In Proceedings of the 35th International Conference on Ocean, Offshore and Arctic Engineering, Busan, Korea, 19–24 June 2016; p. V003T002A044. [Google Scholar]
- Libot, M.A. Wave-in-Deck Loading. In Proceedings of the 1st Civil and Environmental Engineering Student Conference, Imperial College, London, UK, 25–26 June 2012. [Google Scholar]
- Lubeena, R.; Gupta, V. Hydrodynamic Wave Loading on Offshore Structures. In Proceedings of the All Days; Society of Petroleum Engineers (SPE), Houston, TX, USA, 6–9 May 2013. [Google Scholar]
- Fayazi, A.; Aghakouchak, A. Reliability Based Assessment of Existing Fixed Offshore Platforms Located in the Persian Gulf. Int. J. Marit. Technol. 2015, 4, 37–50. [Google Scholar]
- Øistein, H.; Johannessen, T.B.; Birknes-Berg, J. Airgap and Wave in Deck Impact Statistics. Ocean. Eng. 2016, 7. [Google Scholar] [CrossRef]
- Ma, L. The Effective Modelling of Wave-In-Deck Loads. Ph.D. Thesis, Department of Civil and Environmental Engineering, Imperial College London, London, UK, 2018. [Google Scholar]
- Scharnke, J.; Lindeboom, R.; Duz, B. Wave-in-deck Impact Loads in Relation with Wave Kinematics. In Proceedings of the ASME 2017 36th International Conference on Ocean, Offshore and Arctic Engineering, Trondheim, Norway, 25–30 June 2017. [Google Scholar]
- Wang, Y.; Mallahzadeh, H.; Abu Husain, M.K.; Mohd Zaki, N.I.; Najafian, G. Probabilistic Modelling of Extreme Offshore Structural Response Due to Random Wave Loading. In Proceedings of the 32nd International Conference on Ocean, Offshore and Arctic Engineering, Nantes, France, 9–14 June 2013; p. V02BT02A007. [Google Scholar]
- Abu Husain, M.; Zaki, N.M.; Najafian, G. Derivation of the Probability Distribution of Extreme Values of Offshore Structural Response by Efficient Time Simulation Method. Open Civ. Eng. J. 2013, 7, 261–272. [Google Scholar] [CrossRef][Green Version]
- Abu Husain, M.; Zaki, N.M.; Najafian, G. Prediction of offshore structural response extreme values by three different approaches of efficient time simulation technique. Ships Offshore Struct. 2016, 12, 1–12. [Google Scholar] [CrossRef]
- Abdussamie, N.; Drobyshevski, Y.; Ojeda, R.; Thomas, G.; Amin, W. Experimental investigation of wave-in-deck impact events on a TLP model. Ocean Eng. 2017, 142, 541–562. [Google Scholar] [CrossRef]
- Vanem, E.; Fazeres-Ferradosa, T.; Rosa-Santos, P.; Taveira-Pinto, F. Statistical description and modelling of extreme ocean wave conditions. Proc. Inst. Civ. Eng. Marit. Eng. 2019, 172, 124–132. [Google Scholar] [CrossRef]
- Golafshani, A.A.; Hossein, E.; Vahid, B.; Tore, H. Assessment of Offshore Platforms under Extreme Waves by Probabilistic Incremental Wave Analysis. J. Constr. Steel Res. 2011, 67, 759–769. [Google Scholar] [CrossRef]
- Mat Soom, E.; Abu Husain, M.K.; Mohd Zaki, N.I.; Mohd Nor, M.N.K.; Ayob, M.S.; Najafian, G. Global Ultimate Strength Assessment (GUSA) for Lifetime Extension of Ageing Offshore Structures. In Proceedings of the Twenty-Fifth International Ocean and Polar Engineering Conference, Kona, HI, USA, 21–26 June 2015. [Google Scholar]
- Ayob, M.S.; Mukherjee, K.; Kajuputra, A.E.; Wong, B.S.; Salleh, F.M. Requalification of Offshore Jacket Structures in Ma-laysian Waters. In Proceedings of the Offshore Technology Conference Asia, Kuala Lumpur, Malaysia, 25–28 March 2014. [Google Scholar]
- Tromans, P.S.; van de Graaf, J.W. A Substantiate Risk Assessment of a Jacket Structure. In Proceedings of the Offshore Technology Conference, Houston, TX, USA, 4–7 May 1992. [Google Scholar]
- Dalane, J.I.; Haver, S. Requalification of an Unmanned Jacket Structure Using Reliability Methods. In Proceedings of the Offshore Technology Conference, Houston, TX, USA, 1–4 May 1995. [Google Scholar]
- American Petroleum Institute. Recommended Practice for Planning, Designing, and Constructing Fixed Offshore Platforms—Working Stress Design; American Petroleum Institute: Washington, DC, USA, 2010. [Google Scholar]
- International Organization for Standardization. Petroleum and Natural Gas Industries—Fixed Steel Offshore Structures; HIS: Geneva, Switzerland, 2007. [Google Scholar]
- Kaplan, P.; Murray, J.; Yu, W.C. Theoretical Analysis of Wave Impact Forces on Platform Deck Structures. In Proceedings of the 14th International Conference on Offshore Mechanics and Artic Engineering, Copenhagen, Denmark, 18–22 June 1995. [Google Scholar]
- Finnigan, T.D.; Petrauskas, C. Wave-in-Deck Forces. In Proceedings of the Seventh International Offshore and Polar Engineering Conference, Honolulu, HI, USA, 25–30 May 1997. [Google Scholar]
- Iwanowski, B.; Grigorian, H.; Scherf, I. Subsidence of the Ekofisk Platforms: Wave in Deck Impact Study. Various Wave Mod-els and Computational Method. In Proceedings of the 21st International Conference on Offshore Mechanics and Artic Engineering, Oslo, Norway, 23–28 June 2002. [Google Scholar]
- Abdussamie, N.; Thomas, G.; Amin, W.; Ojeda, R. Wave-in-Deck Forces on Fixed Horizontal Decks of Offshore Platforms. In Proceedings of the ASME 33rd International Conference on Ocean, Offshore and Arctic Engineering, San Francisco, CA, USA, 8–13 June 2014. [Google Scholar]
- Chen, Y.; Wu, Y.; Bahuguni, A.; Gullman-Strand, J.; Zhang, Y.; Stewart, G.; Lv, X. Advances in Computational Hydrodynam-ics Applied to Wave-in-Deck. In Proceedings of the Offshore Technology Conference Asia, Kuala Lumpur, Malaysia, 22–25 March 2016. [Google Scholar]
- Van Raaij, K. Dynamic Behaviour of Jackets Exposed to Wave-in-Deck Forces. Ph.D. Thesis, University of Stavanger, Stavanger, Norway, 2005. [Google Scholar]
- Van Raaij, K.; Gudmestad, O.T. Wave-in-deck loading on fixed steel jacket decks. Mar. Struct. 2007, 20, 164–184. [Google Scholar] [CrossRef]
- Iwanowski, B.; Vestbostad, T.; Lefranc, M. Wave-in-Deck Load on a Jacket Platform, CFD Calculations Compared with Experi-ments. In Proceedings of the 33rd International Conference on Offshore Mechanics and Artic Engineering, San Francisco, CA, USA, 8–13 June 2014. [Google Scholar]
- Lu, L.; Liang, W.; Zhang, L.; Zhang, H.; Lu, Z.; Shan, J. A comprehensive risk evaluation method for natural gas pipelines by combining a risk matrix with a bow-tie model. J. Nat. Gas Sci. Eng. 2015, 25, 124–133. [Google Scholar] [CrossRef]
- Vileiniskis, M.; Remenyte-Prescott, R. Quantitative risk prognostics framework based on Petri Net and Bow-Tie models. Reliab. Eng. Syst. Saf. 2017, 165, 62–73. [Google Scholar] [CrossRef]
- Valeur, J.R. Integrated HSE ALARP Assessment—Reducing HSE Risk and Impacts in Same Processes. In Proceedings of the SPE Middle East Health, Safety, Environment & Sustainable Development Conference and Exhibition, Doha, Qatar, 22–24 September 2014. [Google Scholar]
- Wan Abdul Majid, W.M.; Haji Hashim, A.R.; Embong, M. Determination of Structural Reserve Strength Ratio (RSR) of an Existing Offshore Structure. In Proceedings of the Eigth (1998) International Offshore and Polar Engineering Conference, Motreal, QC, Canada, 24–29 May 1998. [Google Scholar]
- Efthymiou, M.; van de Graaf, J.W. Reliability and (Re)Assessment of Fixed Steel Structures. In Proceedings of the ASME 2011 30th International Conference on Ocean, Offshore and Arctic Engineering, Rotterdam, The Netherlands, 19–24 June 2011. [Google Scholar]
- SINTEF Group. USFOS Getting Started. In Marintek, Structural Engineering; SINTEF Group: Trondheim, Norway, 2001. [Google Scholar]
- Gebara, J.M.; Dolan, D.; Pawsey, S.; Jeanjean, P.; Dahl-Stamnes, K. Assessment of Offshore Platforms Under Subsidence—Part I: Approach. J. Offshore Mech. Arct. Eng. 2000, 122, 260–266. [Google Scholar] [CrossRef]
- Jha, A.K.; Kiciman, O.K.; Gebara, J.M.; Stahl, B.; Dahl-Stamnes, K.H. Assessment of Offshore Platforms Under Subsidence—Part II: Analysis and Results. J. Offshore Mech. Arct. Eng. 2000, 122, 267–273. [Google Scholar] [CrossRef]
- Smith, A.G.; Smith, T.E.; Monshaugen, T. Ekofisk Subsidence: Conceptual and Design Considerations Along the Road to Jack-ing. In Proceedings of the Offshore Technology Conference, Houston, TX, USA, 2–5 May 1988. [Google Scholar]
- Botelho, D.L.R.; Ullmann, R.R.; Chancellor, D.P.; Versowsky, P.E. A Survey of The Structural Damage Caused by Hurricane Andrew on Some of The Platforms Located in The South Timbalier Area. In Proceedings of the Offshore Technology Conference, Houston, TX, USA, 2–5 May 1994. [Google Scholar]
- Puskar, F.; Spong, R.; Ku, A.; Gilbert, R.; Choi, Y. Assessment of fixed offshore platform performance in Hurricane Ivan. In Proceedings of the Offshore Technology Conference, Houston, TX, USA, 1–4 May 2006. [Google Scholar]
- Forristall George, Z. Wave Crest Heights and Deck Damage in Hurricanes Ivan, Katrina, and Rita. In Proceedings of the Offshore Technology Conference, Houston, TX, USA, 30 April–3 May 2007. [Google Scholar]


| No. | Platform Name | Field | Operation | No. of Leg | Installation Year | Water Depth As-Installed (m) | Water Depth in 2015 (m) |
|---|---|---|---|---|---|---|---|
| 1 | PD4-40 | Sabah Operation (SKO) | Drilling | 4 | 1980 | 40.3 | 40.4 |
| PV3-88 | Sarawak Operation (SKO) | Vent | 3 | 1982 | 88.4 | 93.7 | |
| 2 | PK4-88 | Compression | 4 | 1999 | 93.8 | ||
| PP8-88 | Production | 8 | 1982 | 93.7 | |||
| 3 | PD4-130 | Sarawak Operation (SKO) | Drilling | 4 | 2002 | 129.9 | 132.8 |
| Features | Description | |||||
|---|---|---|---|---|---|---|
| Platform | PD4-40 | PV3-88 | PK4-88 | PP8-88 | PD4-130 | |
| Design Safety Category | Unmanned | Unmanned | Manned | Manned | Unmanned | |
| Brace Type | K-brace | K-brace | Combination of X-brace and K-brace | K-brace | X-brace | |
| Number of Legs | 4 (46.5″Ø) | 3 (46.5″Ø) | 4 (60″Ø) | 8 (60″Ø) | 4 (80″Ø) | |
| Number of Pile | 4 (42″Ø)—Through Leg | 3 (42″Ø)—Through Leg | 4 (54″Ø)—Through Leg | 8 (54″Ø)—Through Leg | 8 (84″Ø)—Skirt Pile | |
| Number of Risers | 4 (1 × 8″Ø and 3 × 6″Ø) | 2 (18″Ø) | None | 2 (1 × 30″Ø and 1 × 18″Ø) | 3 (2 × 24″Ø and 1 × 20″Ø) | |
| Number of Caisson | 1 (24″Ø) | None | 2 (30″Ø) | 1 (24″Ø) | 1 (30″Ø) | |
| Boat Landing | 1 | 1 | None | 2 | 2 | |
| Conductor | 6 (2 × 36″Ø and 4 × 26″Ø) | None | None | None | 12 (26″Ø) | |
| Bridge Link | None | None | 2 | 3 | None | |
| Deck Configuration | 2-Level Deck: Wireline Deck and Cellar Deck | 1-Level Deck: Cellar Deck | 2-Level Deck with 2-Modules: Module Support Frame Deck and Cellar Deck | 2-Level Deck: Upper Deck and Cellar Deck | 3-Level Deck: Helideck, Main Deck and Cellar Deck | |
| Material | Carbon Steel—Mild Strength (248 MPa) | Carbon Steel—Mild Strength (248 MPa) | Carbon Steel—High Strength (345–355 MPa) | Carbon Steel—Mild Strength (248 MPa) | Carbon Steel—High Strength (340–355 MPa) | |
| Item | PK4-88 | PP8-88 |
|---|---|---|
| Deck width perpendicular to the wave (m) | 32.000 | 55.860 |
| (m) | 6.064 | 3.720 |
| (MT/m3) | 1.025 | 1.025 |
| 2.000 | 2.000 | |
| 1.000 | 1.000 | |
| (m/s) | 10.225 | 9.238 |
| 1.000 | 1.000 | |
| (m/s) | 0.900 | 0.900 |
| Projected area of the wave-in-deck, (m2) | 194.048 | 207.799 |
| Wave-in-deck load (MT) | 2522.918 | 2231.533 |
| Platform | Wave-in-Deck | Return Period | RSR | Base Shear (MN) | POF | |||
|---|---|---|---|---|---|---|---|---|
| PK4-88 | Without | 100 | 4.74 | 4.46 | 0.31 | 15.34 | 0.14 | 2.64 × 10⁻¹² |
| 1000 | 3.86 | 5.86 | ||||||
| With | 100 | 3.75 | 4.46 | 5.03 × 10⁻¹⁰ | ||||
| 1000 | 3.86 | 5.86 | ||||||
| PP8-88 | Without | 100 | 4.13 | 7.69 | 0.36 | 5.52 | 0.16 | 5.39 × 10⁻¹⁰ |
| 1000 | 2.90 | 10.50 | ||||||
| With | 100 | 1.58 | 7.69 | 3.97 × 10⁻⁴ | ||||
| 1000 | 2.9 | 10.5 |
Publisher’s Note: MDPI stays neutral with regard to jurisdictional claims in published maps and institutional affiliations. |
© 2021 by the authors. Licensee MDPI, Basel, Switzerland. This article is an open access article distributed under the terms and conditions of the Creative Commons Attribution (CC BY) license (https://creativecommons.org/licenses/by/4.0/).
Share and Cite
Azman, N.U.; Abu Husain, M.K.; Mohd Zaki, N.I.; Mat Soom, E.; Mukhlas, N.A.; Syed Ahmad, S.Z.A. Structural Integrity of Fixed Offshore Platforms by Incorporating Wave-in-Deck. J. Mar. Sci. Eng. 2021, 9, 1027. https://doi.org/10.3390/jmse9091027
Azman NU, Abu Husain MK, Mohd Zaki NI, Mat Soom E, Mukhlas NA, Syed Ahmad SZA. Structural Integrity of Fixed Offshore Platforms by Incorporating Wave-in-Deck. Journal of Marine Science and Engineering. 2021; 9(9):1027. https://doi.org/10.3390/jmse9091027
Chicago/Turabian StyleAzman, Nurul Uyun, Mohd Khairi Abu Husain, Noor Irza Mohd Zaki, Ezanizam Mat Soom, Nurul Azizah Mukhlas, and Sayyid Zainal Abidin Syed Ahmad. 2021. "Structural Integrity of Fixed Offshore Platforms by Incorporating Wave-in-Deck" Journal of Marine Science and Engineering 9, no. 9: 1027. https://doi.org/10.3390/jmse9091027
APA StyleAzman, N. U., Abu Husain, M. K., Mohd Zaki, N. I., Mat Soom, E., Mukhlas, N. A., & Syed Ahmad, S. Z. A. (2021). Structural Integrity of Fixed Offshore Platforms by Incorporating Wave-in-Deck. Journal of Marine Science and Engineering, 9(9), 1027. https://doi.org/10.3390/jmse9091027