1. Introduction
As the largest area on the earth, the ocean is of great significance for regulating the global environment and climate, maintaining the global ecosystem. Abundant natural resources and economic benefits are obtained by reasonable exploration and utilization of the ocean [
1,
2]. However, frequent marine disasters cause a considerable threat to human life and property in individual productive marine activities. Therefore, the forecast of marine disasters has become a key issue in marine research. On this basis, researchers pointed out that the establishment of seafloor observatories could solve this problem effectively [
3]. Seafloor observatories can detect the ocean internal environment stably during a long period and provide long-term, real-time submarine data. With the aid of the inversion of the sampled data, the early warning capabilities of marine disasters can be highly improved.
More than 85 percent natural earthquakes take place in the ocean; however, their monitoring have been still relatively weak. Nowadays, natural submarine earthquakes observation, based on the seafloor observatories, has become a novelty type of observed method. In the international, it is represented by American-MARS [
4], Canadian-NEPTURE [
5], Japanese-DONET [
6] and EU-EMSO [
7]. As for in China, the research team of Tongji University has done a lot of work in this field and put forward many innovative design schemes in the East China Sea [
8,
9,
10]. From the operation of the seafloor observatories, we can recognize that seabed seismic observatories can be more effectively for monitoring small earthquakes that occur on the seabed and provide early warning for marine disasters [
11]. To summarize, in addition to Japan’s seafloor observatories, others are still single-point, seafloor surface monitoring. The seismograph and the junction station can only be within a short distance (50 m), which cannot meet the requirements for networked monitoring of submarine earthquakes [
12,
13,
14].
With continuous investigation on seafloor observatories, some novelty or improved seafloor earthquake observed schemes have been proposed. Yu et al. first proposed an object model for regulating the sensor control and data sampling of seafloor observatories, which is conceptually designed as a group of sensor resource objects. Based on the properties and operations of these objects, the client-server sensor control architecture can realize bidirectional information flow of control commands and sampled data [
8]. Zhan et al. successfully sensed earthquake waves and water waves over a 10,000-km submarine cable connecting Los Angeles, California and Valparaiso, Chile by monitoring the polarization of conventional optical communication channels. Without special equipment, laser sources or dedicated fibers requirements, their method exhibits very convenient scalability to convert global submarine cables into continuous real-time seismic and tsunami observatories [
15]. Diouf et al. created a PoF and communication system for extending seafloor observatories, which is based on an optical structure to simultaneously transmit power and data through the same single-mode fiber. Raman scattering effect is used to amplify the optical data signal, reducing the power consumption of sensor nodes [
16]. Bruce et al. discussed the blueprint of intelligent submarine cable system, which integrated sensors into the future submarine telecommunication cables. The simulation results showed that cable-based pressure and seismic acceleration sensors could effectively improve the tsunami warning time and seismic parameters [
17].
In this paper, we investigate a chained data sampling and transmission system (SQSTS), based on Zynq-7000 Soc and clock synchronization, which can be used as a prototype and foundation for a new seafloor observatory. Compared with conventional sensor web prototype [
9], SQSTS replaced the traditional undersea junction box with the control module based of Zynq-7000 Soc. In this way, we can keep the overall architecture of the usual seafloor observatory system and expand its functions. Besides that, we also introduce the clock synchronization module to ensure that the time stamp in each seismometer node can reach the μs level, laying a solid foundation for supporting subsequent seismic data inversion operations. Compared with the ocean bottom cabled seismometer system, which is similar to our system in structure, the main control module of SQSTS uses the Zynq7000 Soc with both FPGA (PL side) and ARM (PS side) [
11]. In consequence, an additional CPU is not demanded to control data acquisition and data transmission functions. The transmission between nodes of SQSTS uses the gigabit transceiver in the physical layer of the Zynq7000 Soc. Compared with Ethernet transmission (100 Mbps), it can achieve 4 Gbps high-speed data transmission. Furthermore, in contrast to the previous clock synchronization system with a time stamp accuracy of 0.1 ms, SQSTS adopts a new method based on the PPS signal and the internal clock cycle of the FPGA to extend the minimum time unit of the time stamp to the μs level and the theoretical accuracy is 1 μs.
The content of our article is organized as follows: In
Section 1, the expected goals that SQSTS needs to achieve, and the overall system design scheme are introduced. In
Section 2, the classification of nodes in SQSTS and the selection of hardware modules in nodes are proposed. In
Section 3, the software functions to be realized by each node in SQSTS and their designs are shown. In
Section 4, the SQSTS model and experimental results, as well as a discussion of the results, are presented.
2. Materials and Methods
2.1. System Overall Scheme Design
As the prototype of the seafloor observatories, the SQSTS designed in this paper have the basic function of the seafloor observatories: data acquisition. Thus, a data acquisition module is indispensable in our system. Considering that SQSTS is mainly used for the observation and early warning of submarine earthquakes, the submarine data in this article therefore specifically refers to submarine seismic signals. In addition, in order to support the subsequent processing and analysis of the sampled data, it is also necessary to add a clock synchronization module to the SQSTS to provide accurate time stamps for the data sampled at each moment. Finally, a specific control module is also required, which is similar to a traditional junction box to realize functions such as controlling data collection and transmission. The specific design of each module is as follows.
With the increase of the number of submarine sensors and sensor signal channels, the high-speed data transmission of the link is much more desirable than before. In order to realize high-speed data transmission between nodes of submarine optical cable link, SerDes (SERializer/DESerializer) communication technology is adopted in this paper. SerDes is a point-to-point, time-division multiplexed transmission technology, which can greatly decrease the number of channels and chip pins required for data transmission thus, reduce the cost of data transmission. As an important serial communication bus, SerDes offers advantages of low power consumption, strong anti-interference ability, fast speed, long transmission distance, etc. Hence, it is very suitable for application in SQSTS.
For the control module of each node in the SQSTS, it is inevitable to own the ability of controlling multiple secondary devices at the same time, facilitating data reading and fusion processing, and interacting with the other main control chips of the last/next level nodes by using SerDes communication technology. Considering the massive application in the future networking, the cost should be minimized as much as possible on the premise of satisfying the chip function and reliability.
In order to meet the requirements of the high-precision seismic signals sampling and have the ability to communicate with the main control chip in full duplex working mode, we intend to adopt an AD sampling module with an accuracy of up to 24-bit, high sampling rate, and supporting for SPI protocol. Moreover, in the clock synchronization module, the clock synchronization accuracy is demanded to reach ns level, and the time stamp is required to reach μs level.
2.2. System Hardware Design
2.2.1. Overall Design
SQSTS is composed of three types of seismometer nodes, which are classified as the front node, the intermediate node and the end node according to their distribution locations. The components of the hardware circuit of each node are divided into three parts: the control part (primary device), the data sampling part (secondary device), and the clock synchronization part (secondary device). The components of each part are shown in
Table 1.
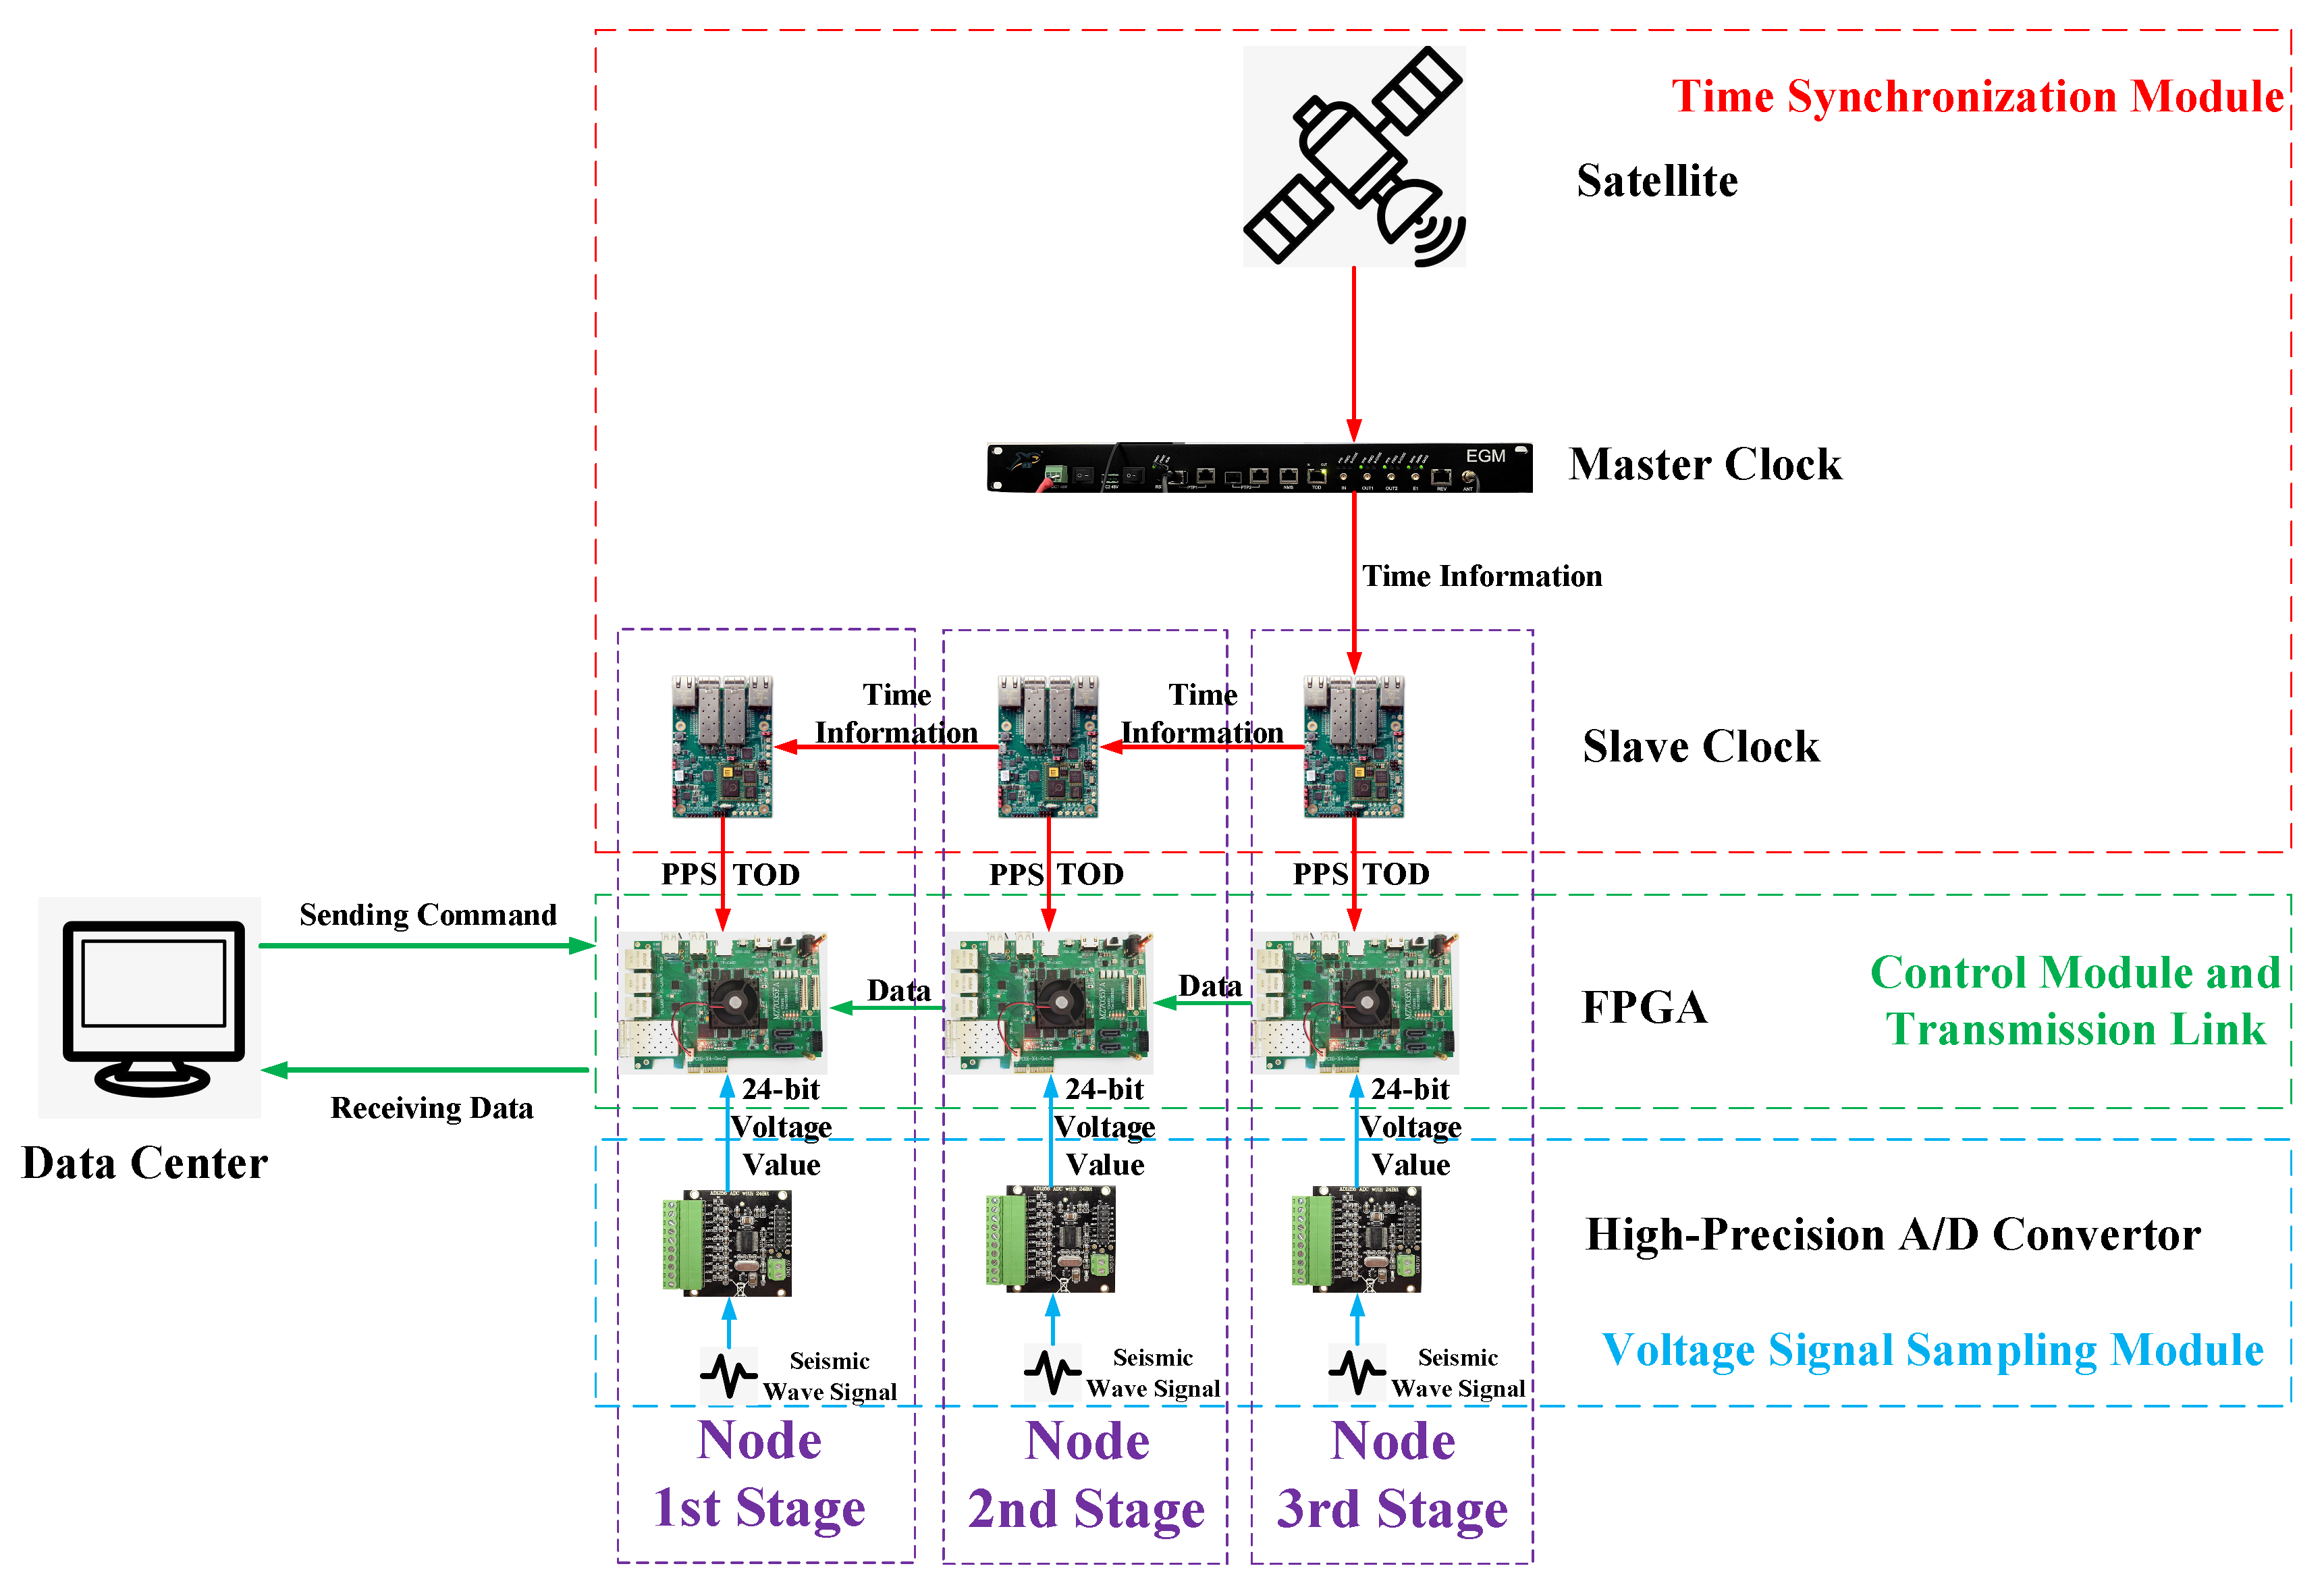
In each node, the control part is responsible for receiving and fusing the data uploaded by each secondary device; the data sampling part is responsible for sampling submarine data; the clock synchronization part is responsible for synchronizing with the master clock and providing time stamp. The nodes are connected by optical cables to form a transmission link. Each node packs its own data and data from the last level node, and then sends them to the next level node. Finally, the end node sends all nodes’ data, the link data to the data center through the Gigabit Ethernet. The whole system block diagram is shown in
Figure 1.
2.2.2. Component Design
Considering the design requirements of the main control module of each node, the zynq7000 Soc developed by Xilinx company, which adopts the ARM Cortex A9 architecture, is chosen as the main control chip. The chip has PL side (FPGA) and PS side (ARM) and supports multiple secondary interfaces to meet the interface requirements of the peripherals used in each node. PL side means the side of programmable logic, which contains a Field Programmable Gate Array (FPGA) and owns parallel processing capability. PS side means the side of processing system, which contains an ARM cortex- A9 processor, and owns serial processing capability. Apart from that, the Gigabit Transceivers (GTX) and Ethernet PHY chips are used in the system.
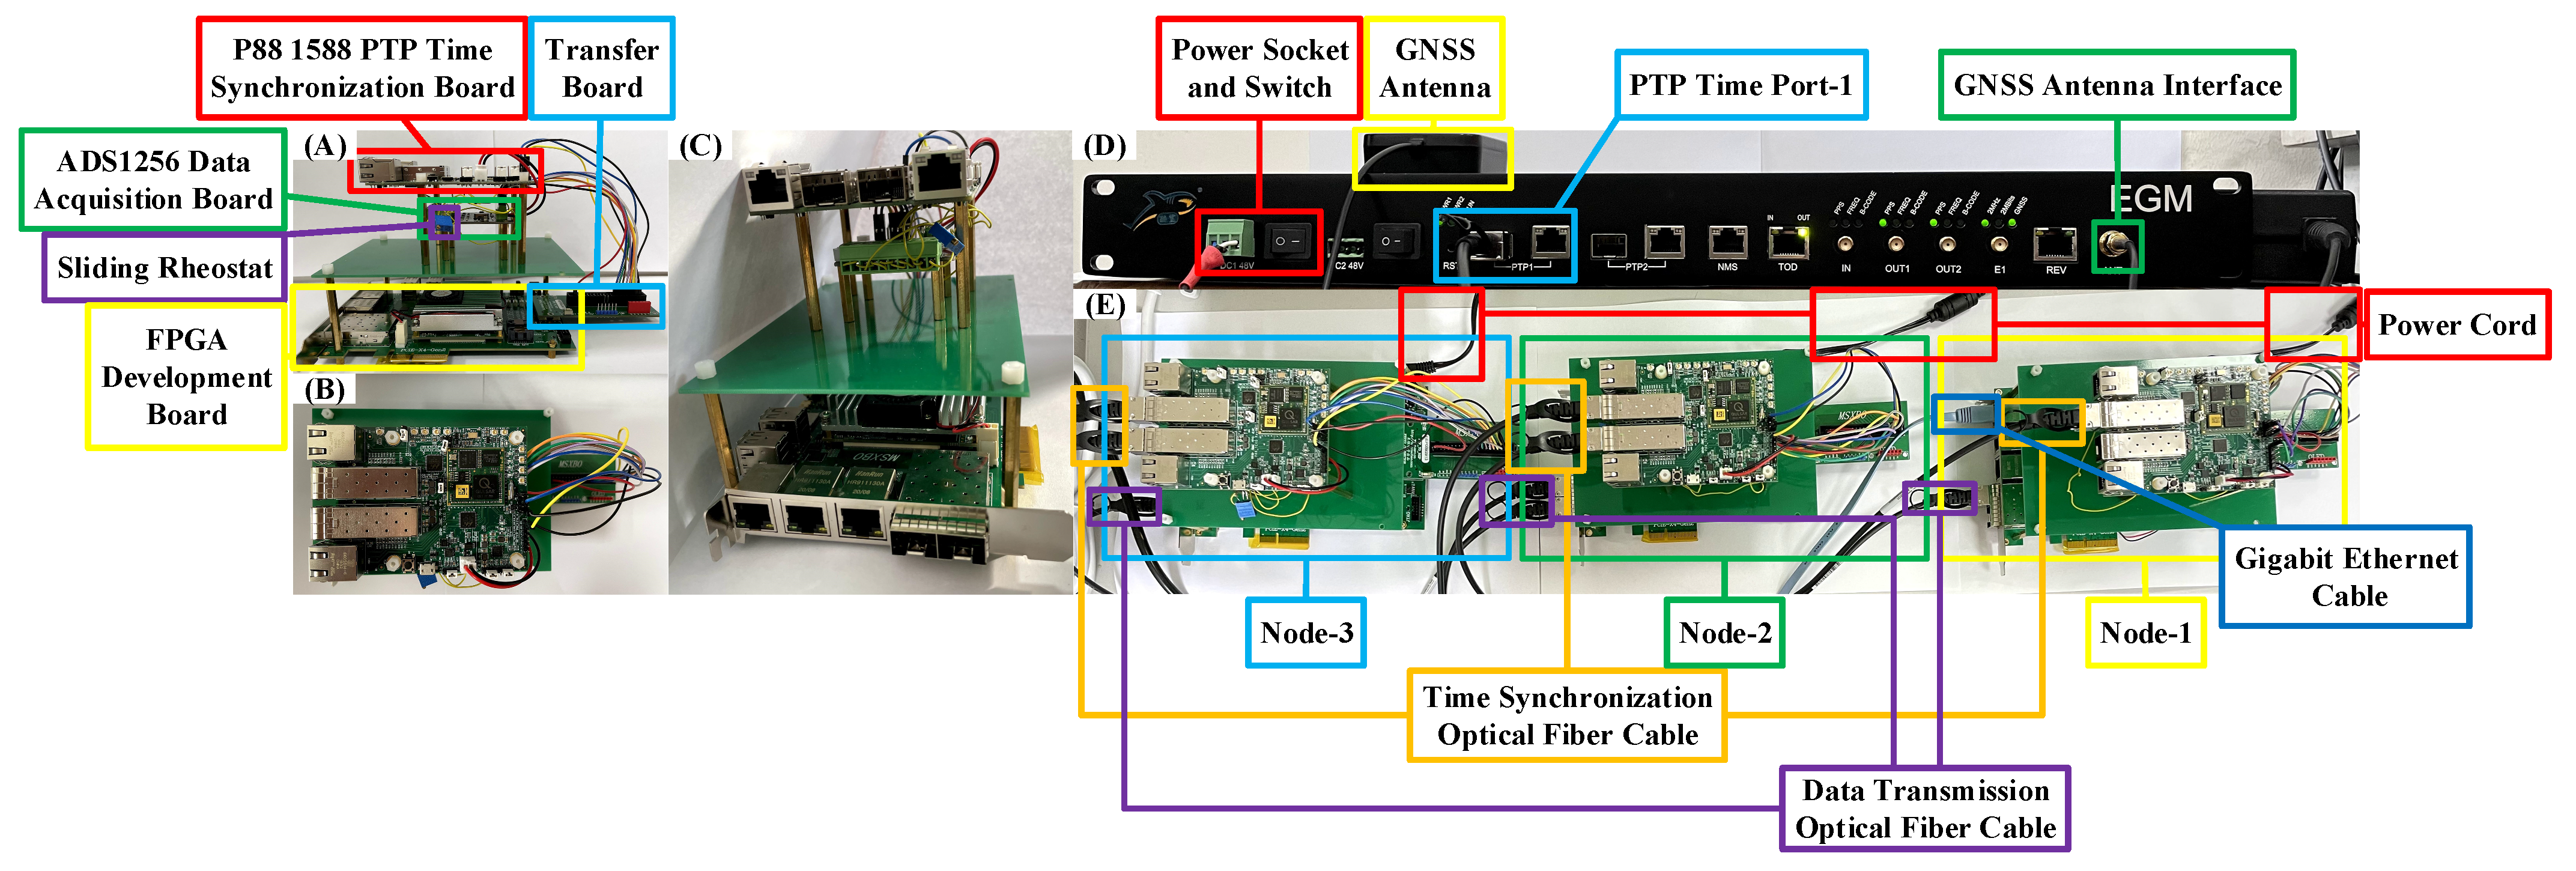
ADS1256 data sampling chip produced by TI Company is selected for data sampling. The accuracy of the chip can reach 24 bits, and the chip has 8 channels with the sampling rate of 30KSPS, which satisfies the performance requirements of the data sampling part of our system. The external 5 V input required by the chip can be directly provided by the control part, and the SPI bus is connected with the MIO ports on the PL side of zynq-7000 SOC.
In order to ensure that the time information of each node is synchronized so as to obtain accurate time stamp, a clock synchronization system needs to be added to each node; thus, the P88 1588 PTP clock synchronization board (Produced by Coolshark Company) is selected as the slave clock in the node. The board can be connected to the master clock through an optical cable, keeping the time consistent with the master clock. Meanwhile, the board can be connected to Zynq-7000 Soc through the GPIO port to provide synchronized time information (in PPS and ToD formats). The EGM master clock (Produced by Coolshark Company, Beijing, China) is selected as the master clock, whose clock source is satellite (GPS, Beidou, Glonass). The output form can be set up as IEEE1588 PTP, SyncE and time signals (frequency, PPS, ToD) through optical ports. It has a distributed synchronous design architecture, which can expand the number of unicast slaves up to 450. It features all the characteristics of the IEEE1588 master clock and boundary clock, also achieves effective management and maintenance, and provides a continuous and accurate time information after the loss of the relevant reference source signal.
2.3. System Software Design
2.3.1. Software Architecture Design
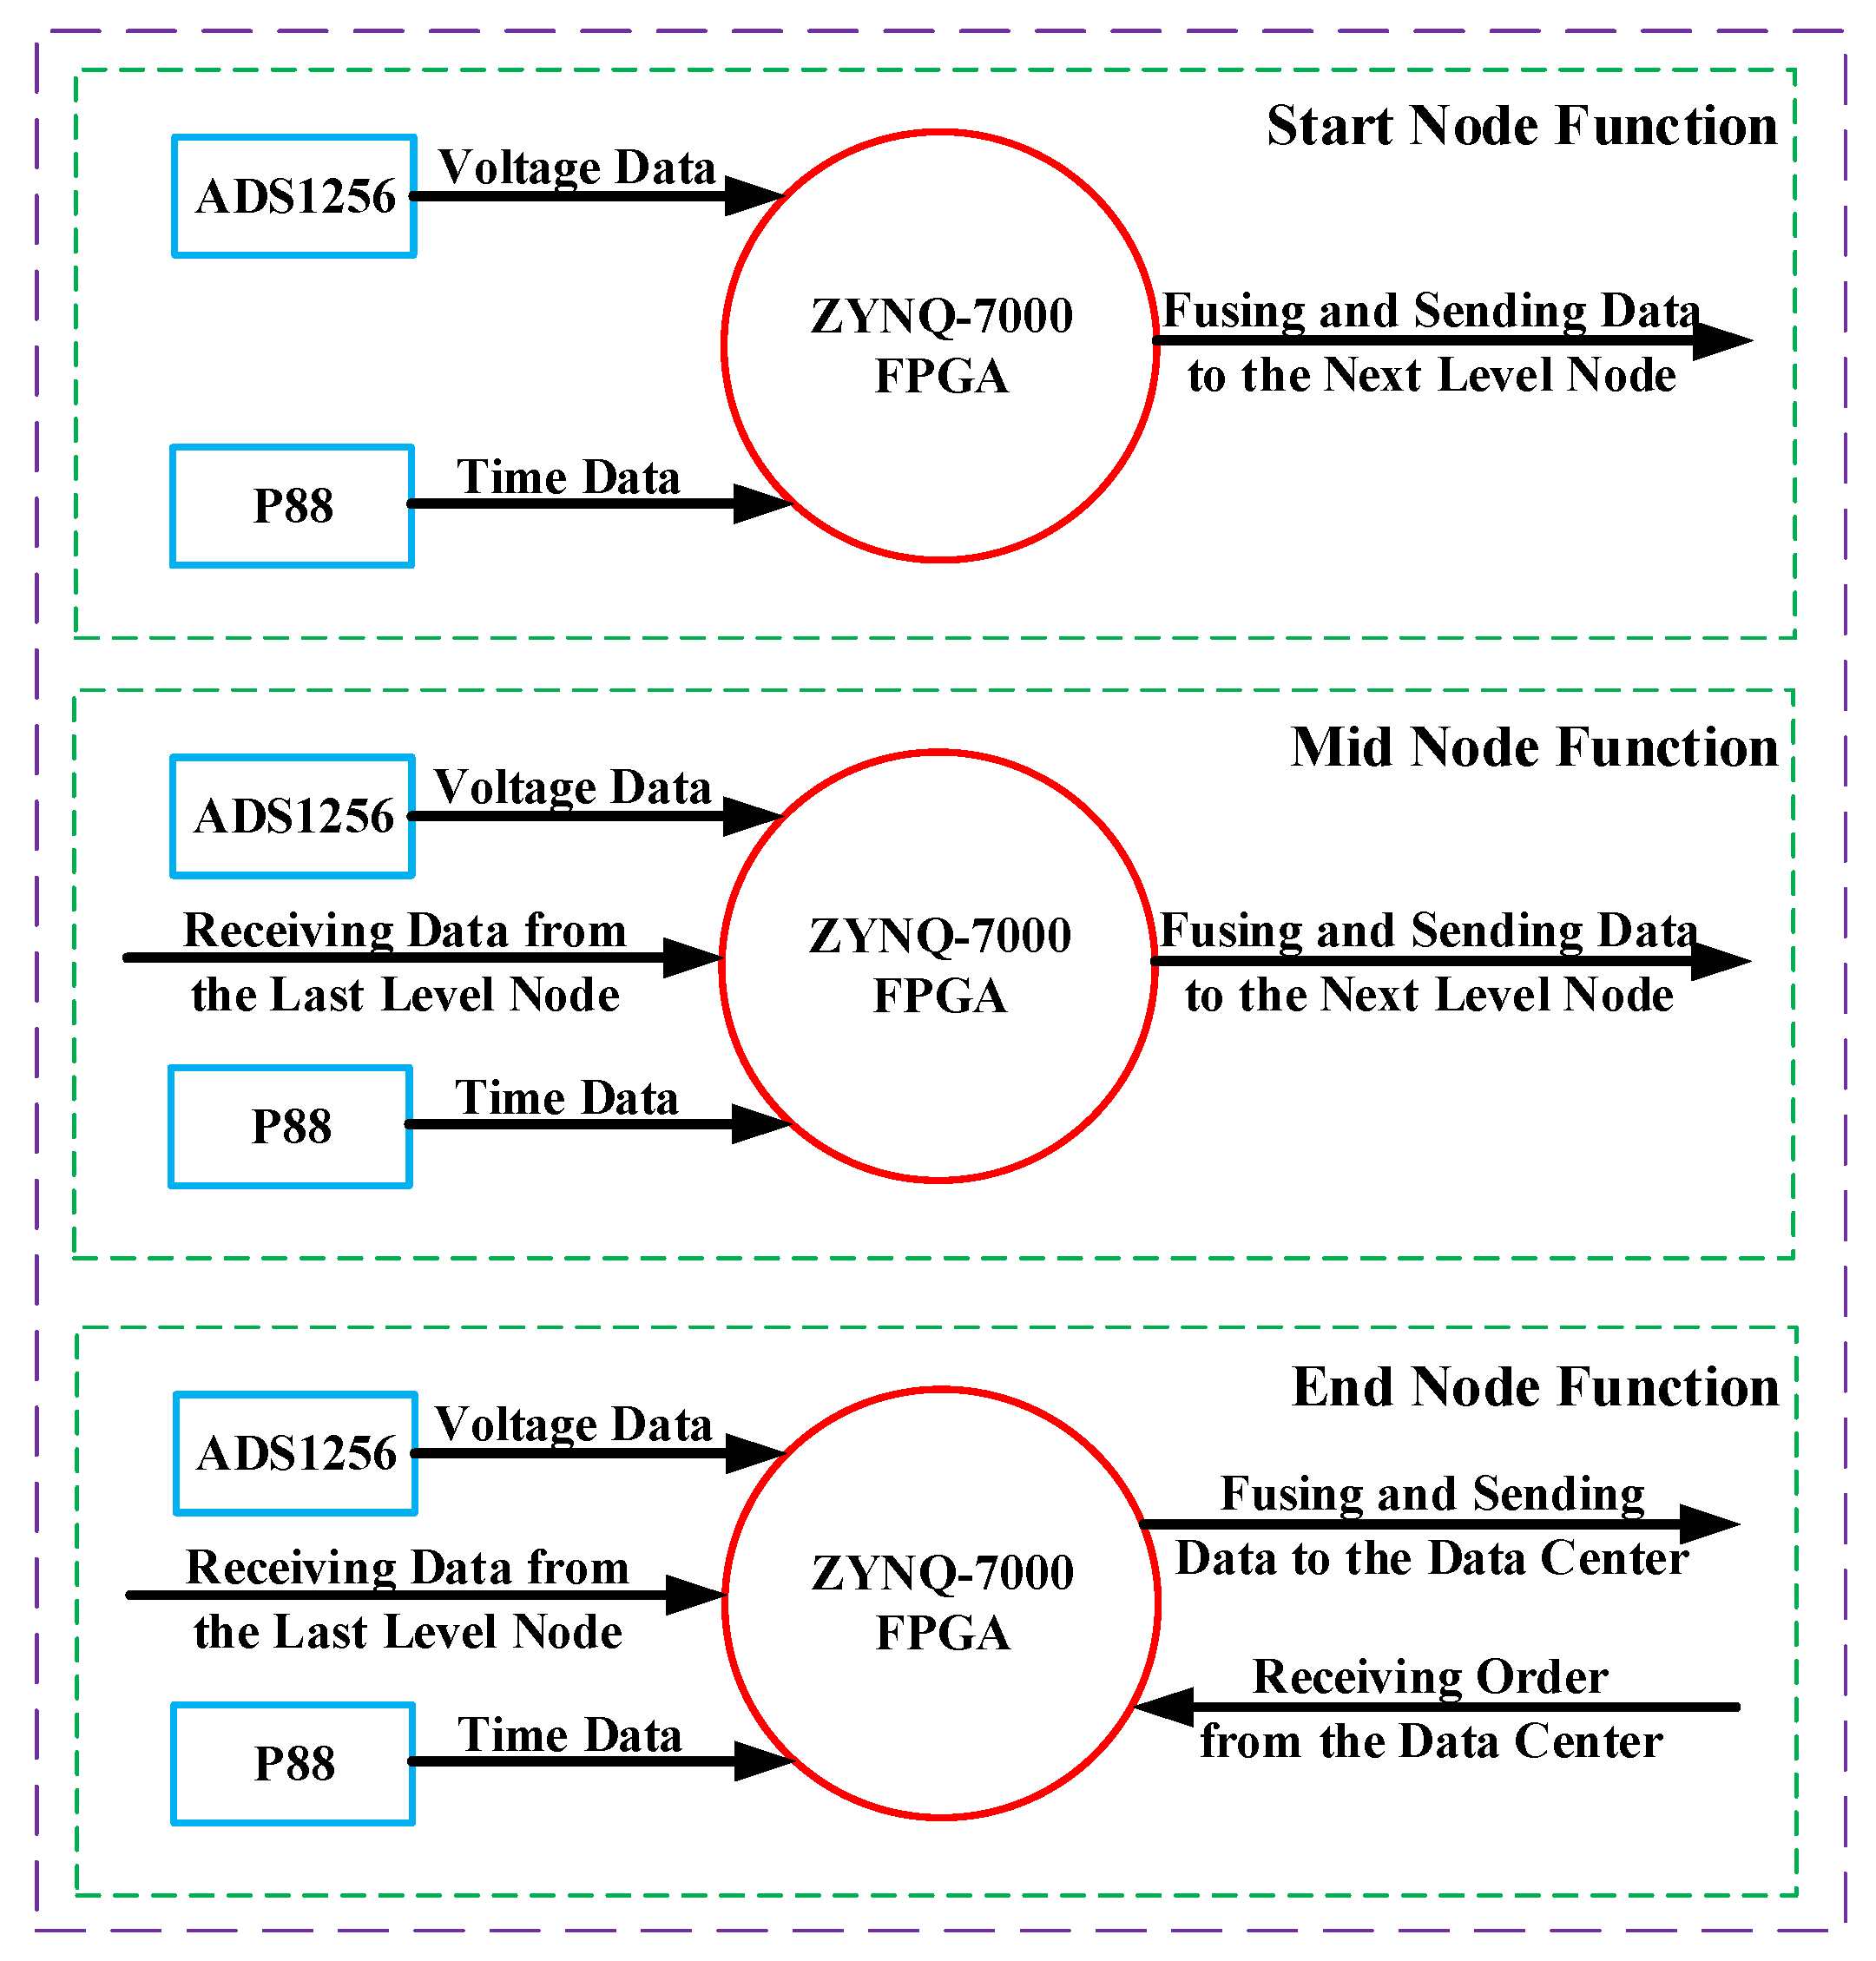
Considering the functional distinctions caused by the different distribution positions of the nodes, it is necessary to divide the nodes into three categories: front node, intermediate node and end node, and write corresponding Verilog HDL programs according to the functions of each class. For the front node, the functions that need to be achieved include the controlling and reading the data sampling part and the clock synchronization part, as well as the fusing and packaging of time, MAC address, sampled data and other data, and finally sending it to the next level node through the optical cable. For the intermediate node, besides the whole functions of the front node, it also needs to have the functions of receiving data from the last level node and merging and repackaging with its own data. Finally, for the end node, not only all functions of intermediate node except the function of sending data to the next level node are required, but also the PS side of the end node needs to be used to send the data of the entire link to the data center through Gigabit Ethernet. The functions of different types of nodes are shown in
Figure 2.
2.3.2. Data Sampling Module Design
Zynq-7000 Soc reads the sampled data in ADS1256 through the SPI protocol. The specific process is as follows: When Zynq-7000 Soc needs to communicate with ADS1256, it pulls down the chip selection signal-CS, and uses the clock signal SCLK to control the data reading and writing of ADS1256. The MOSI signal is responsible for configuring the state of the registers in the ADS1256. When detecting that the DRDY signal is set in the high voltage level, the Zynq-7000 Soc can obtain the sampled data of the ADS1256 from the MISO signal.
2.3.3. Clock Synchronization Module Design
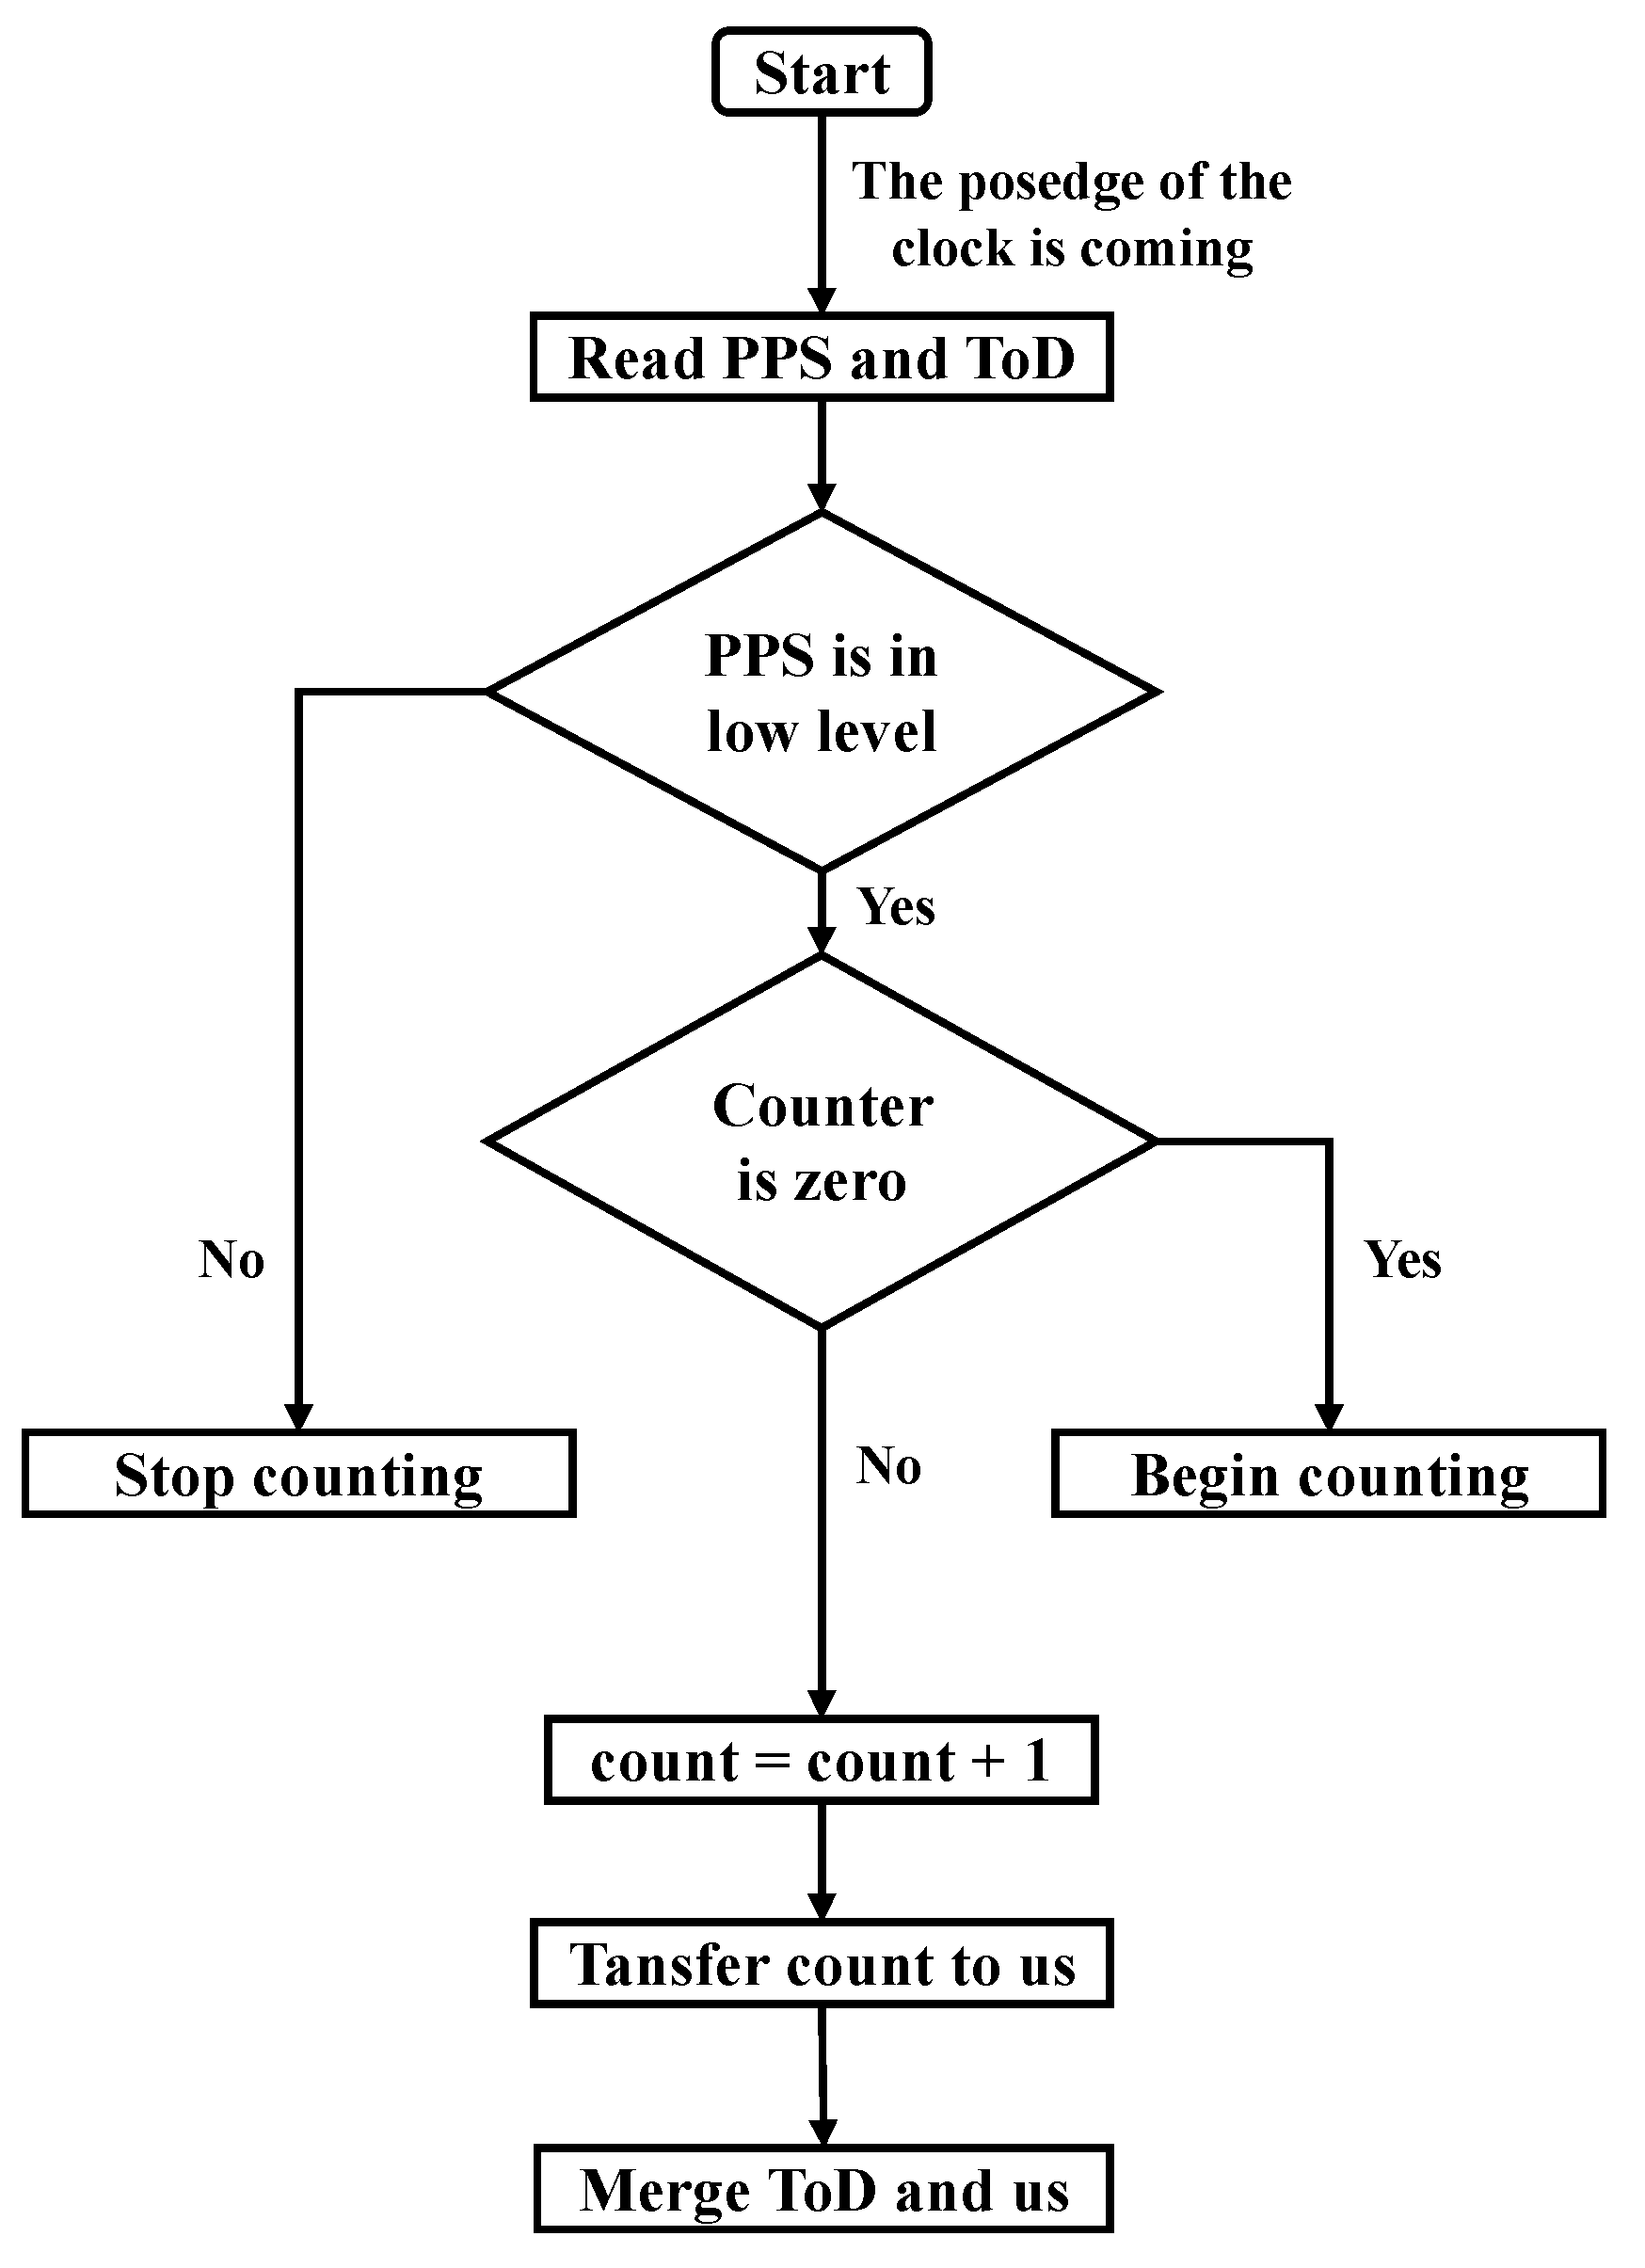
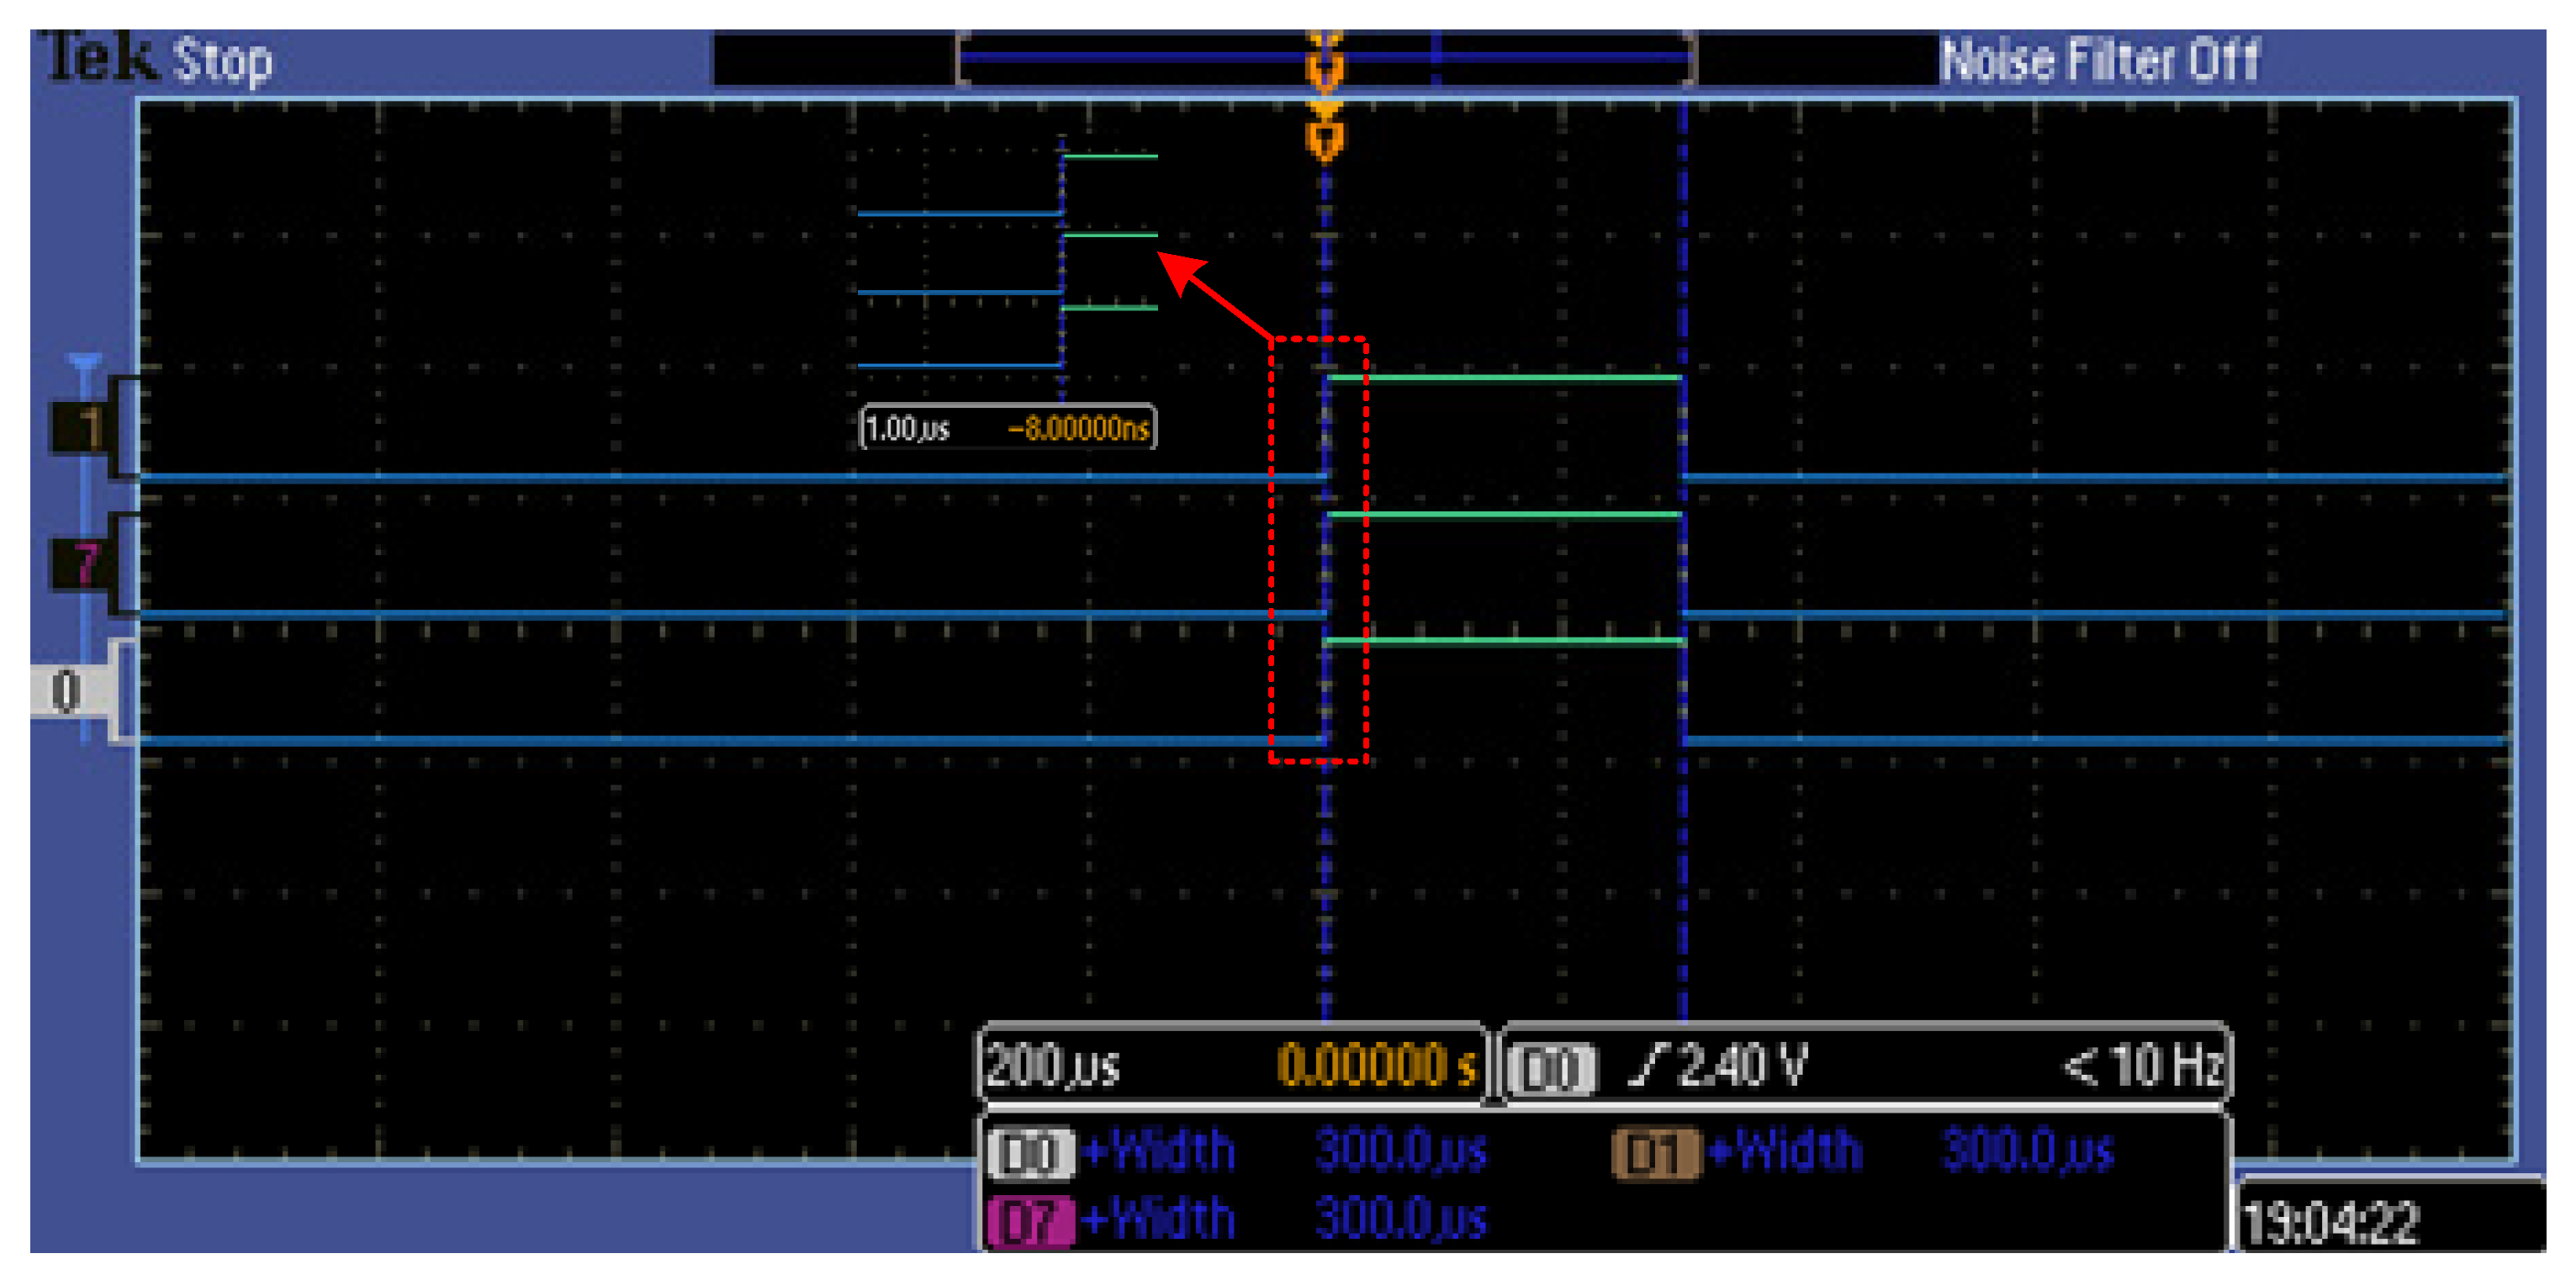
The P88 1588 PTP clock synchronization board transmits the ToD information which is in the NMEA ZDA format and PPS information to the Zynq-7000 Soc. The Zynq-7000 Soc can use the ToD information to obtain a time stamp of the second level. However, the requirements of our system are time stamps up to the microsecond level. Thus, we designed a program to obtain microsecond level time information by using the PPS signal provided by the P88 1588 PTP clock synchronization board and the inner crystal oscillator of the Zynq-7000 Soc. The specific process is as follows: Set the period of the PPS signal to 1 s with the pulse width of 300 μs. The crystal oscillator used on the PL side of the Zynq-7000 Soc is 100 MHz, which means that its clock cycle is 10 ns. When the rising edge of each clock cycle arrives, the Zynq-7000 Soc reads the PPS signal. If the PPS signal is set in the low voltage level at this time, it starts to count the clock cycle. When the Zynq-7000 Soc detects that the PPS signal is set in the high voltage level, the counter returns to zero and stops counting. It can be seen that this method does not need to add any other peripherals and makes full use of the resources inside the node. It is simple and reliable, and its theoretical error accuracy is ±1 μs.
The equation can be used to obtain microsecond level time information:
The flow chart of the control of clock synchronization module is shown in
Figure 3.
2.3.4. Design of Transmission Link Module
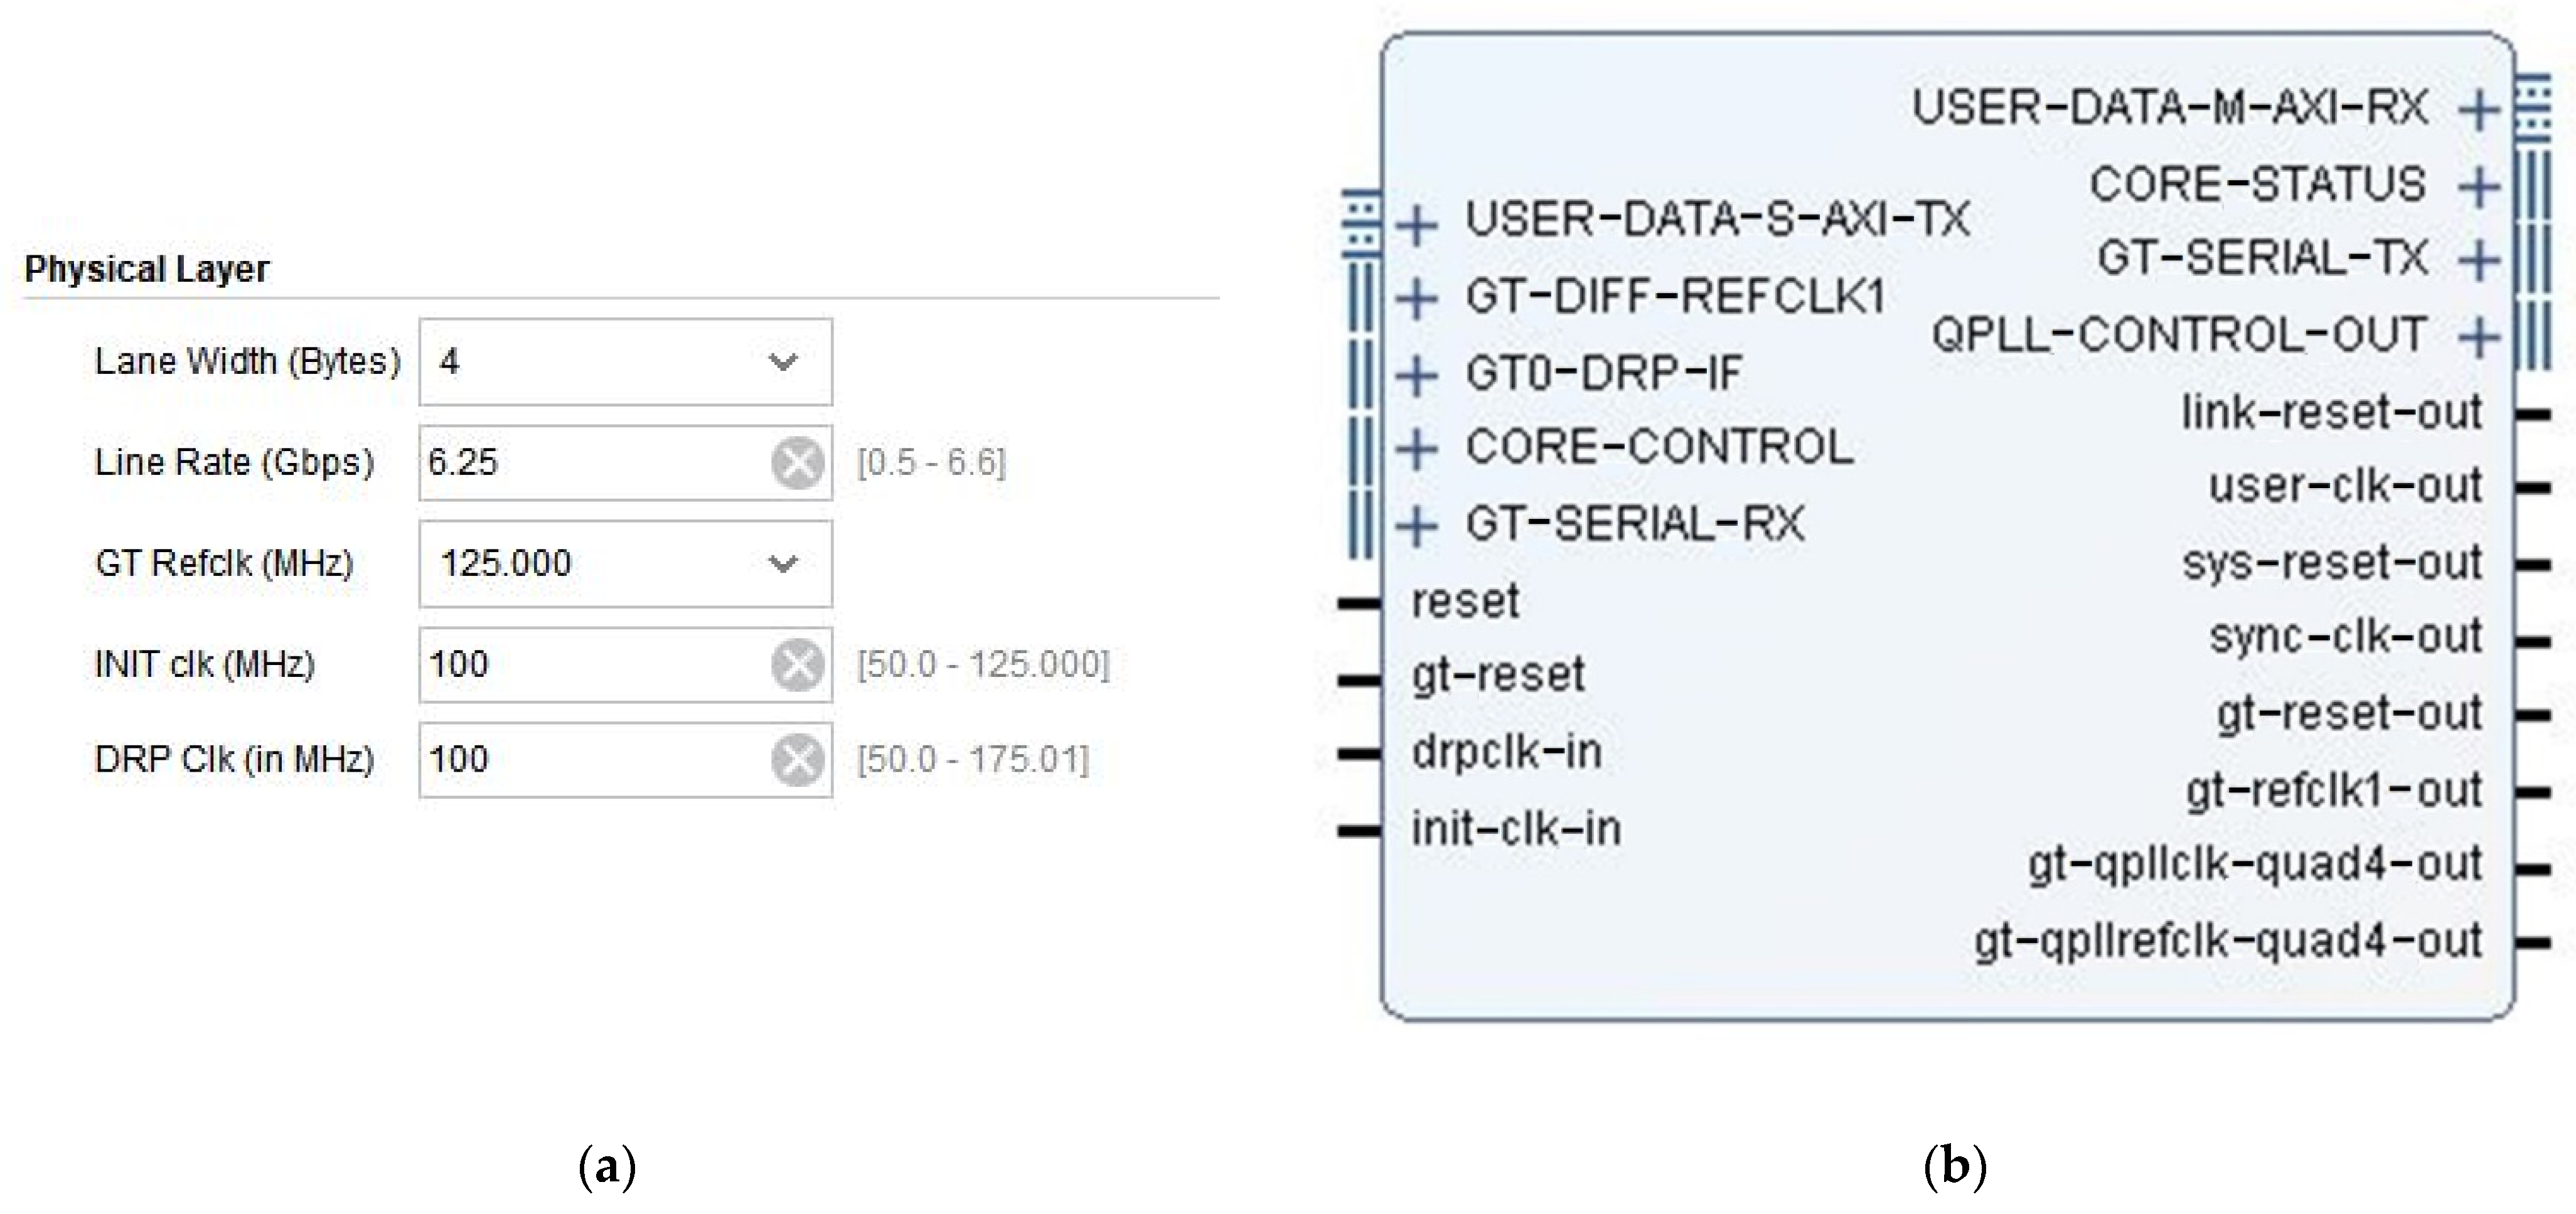
In the optical cable transmission design between nodes, we used the Aurora IP core, which was embedded in the Vivado compilation environment by Xilinx Company. The IP core can conveniently call the physical layer device—Gigabit transceiver for optical cable data transmission. The schematic diagram and design configuration parameters of the IP core are shown in
Figure 4.
From the figure, it can be seen that the maximum bandwidth is set to 6.5 Gbps, the data length of each transmission is 4 bytes, and the reference clock is 125 MHz. The link bus bandwidth can be 4 Gbps according to the following calculation equation:
In the procedure of data transmission between nodes, we use the similar Aurora IP core, and the design parameters, working mode and other configurations. As a result, a unified design of the IP core can be customized. However, we must consider the functional distinctions caused by the different locations of each node, which further leads to differences in the timing design of various types of nodes. The specific timing design of this paper are as follows: In the timing design of the transmission program of the front node, only the function of sending data packets to the next level node needs to be operated. Therefore, it can be sent as soon as the data packet is packaged. In the timing design of the transmission program of the intermediate node, not only the function of sending data packets to the next level node, but also the function of receiving data packets from the last level node must be deliberated. Hence, in the design, the data packet sent by the last level node must be received first, and then the received data from the last level node and the data of this level node are packaged and sent. In the timing design of the transmission program of the end node, it is necessary to consider not only its function of receiving data packets from the last level node, but also its function of sending data packets to the data center. Consequently, in the design, the data packet sent by the last level must be received first, and then the received data from the last level node and the data of this level node can be packaged and sent to the data center.
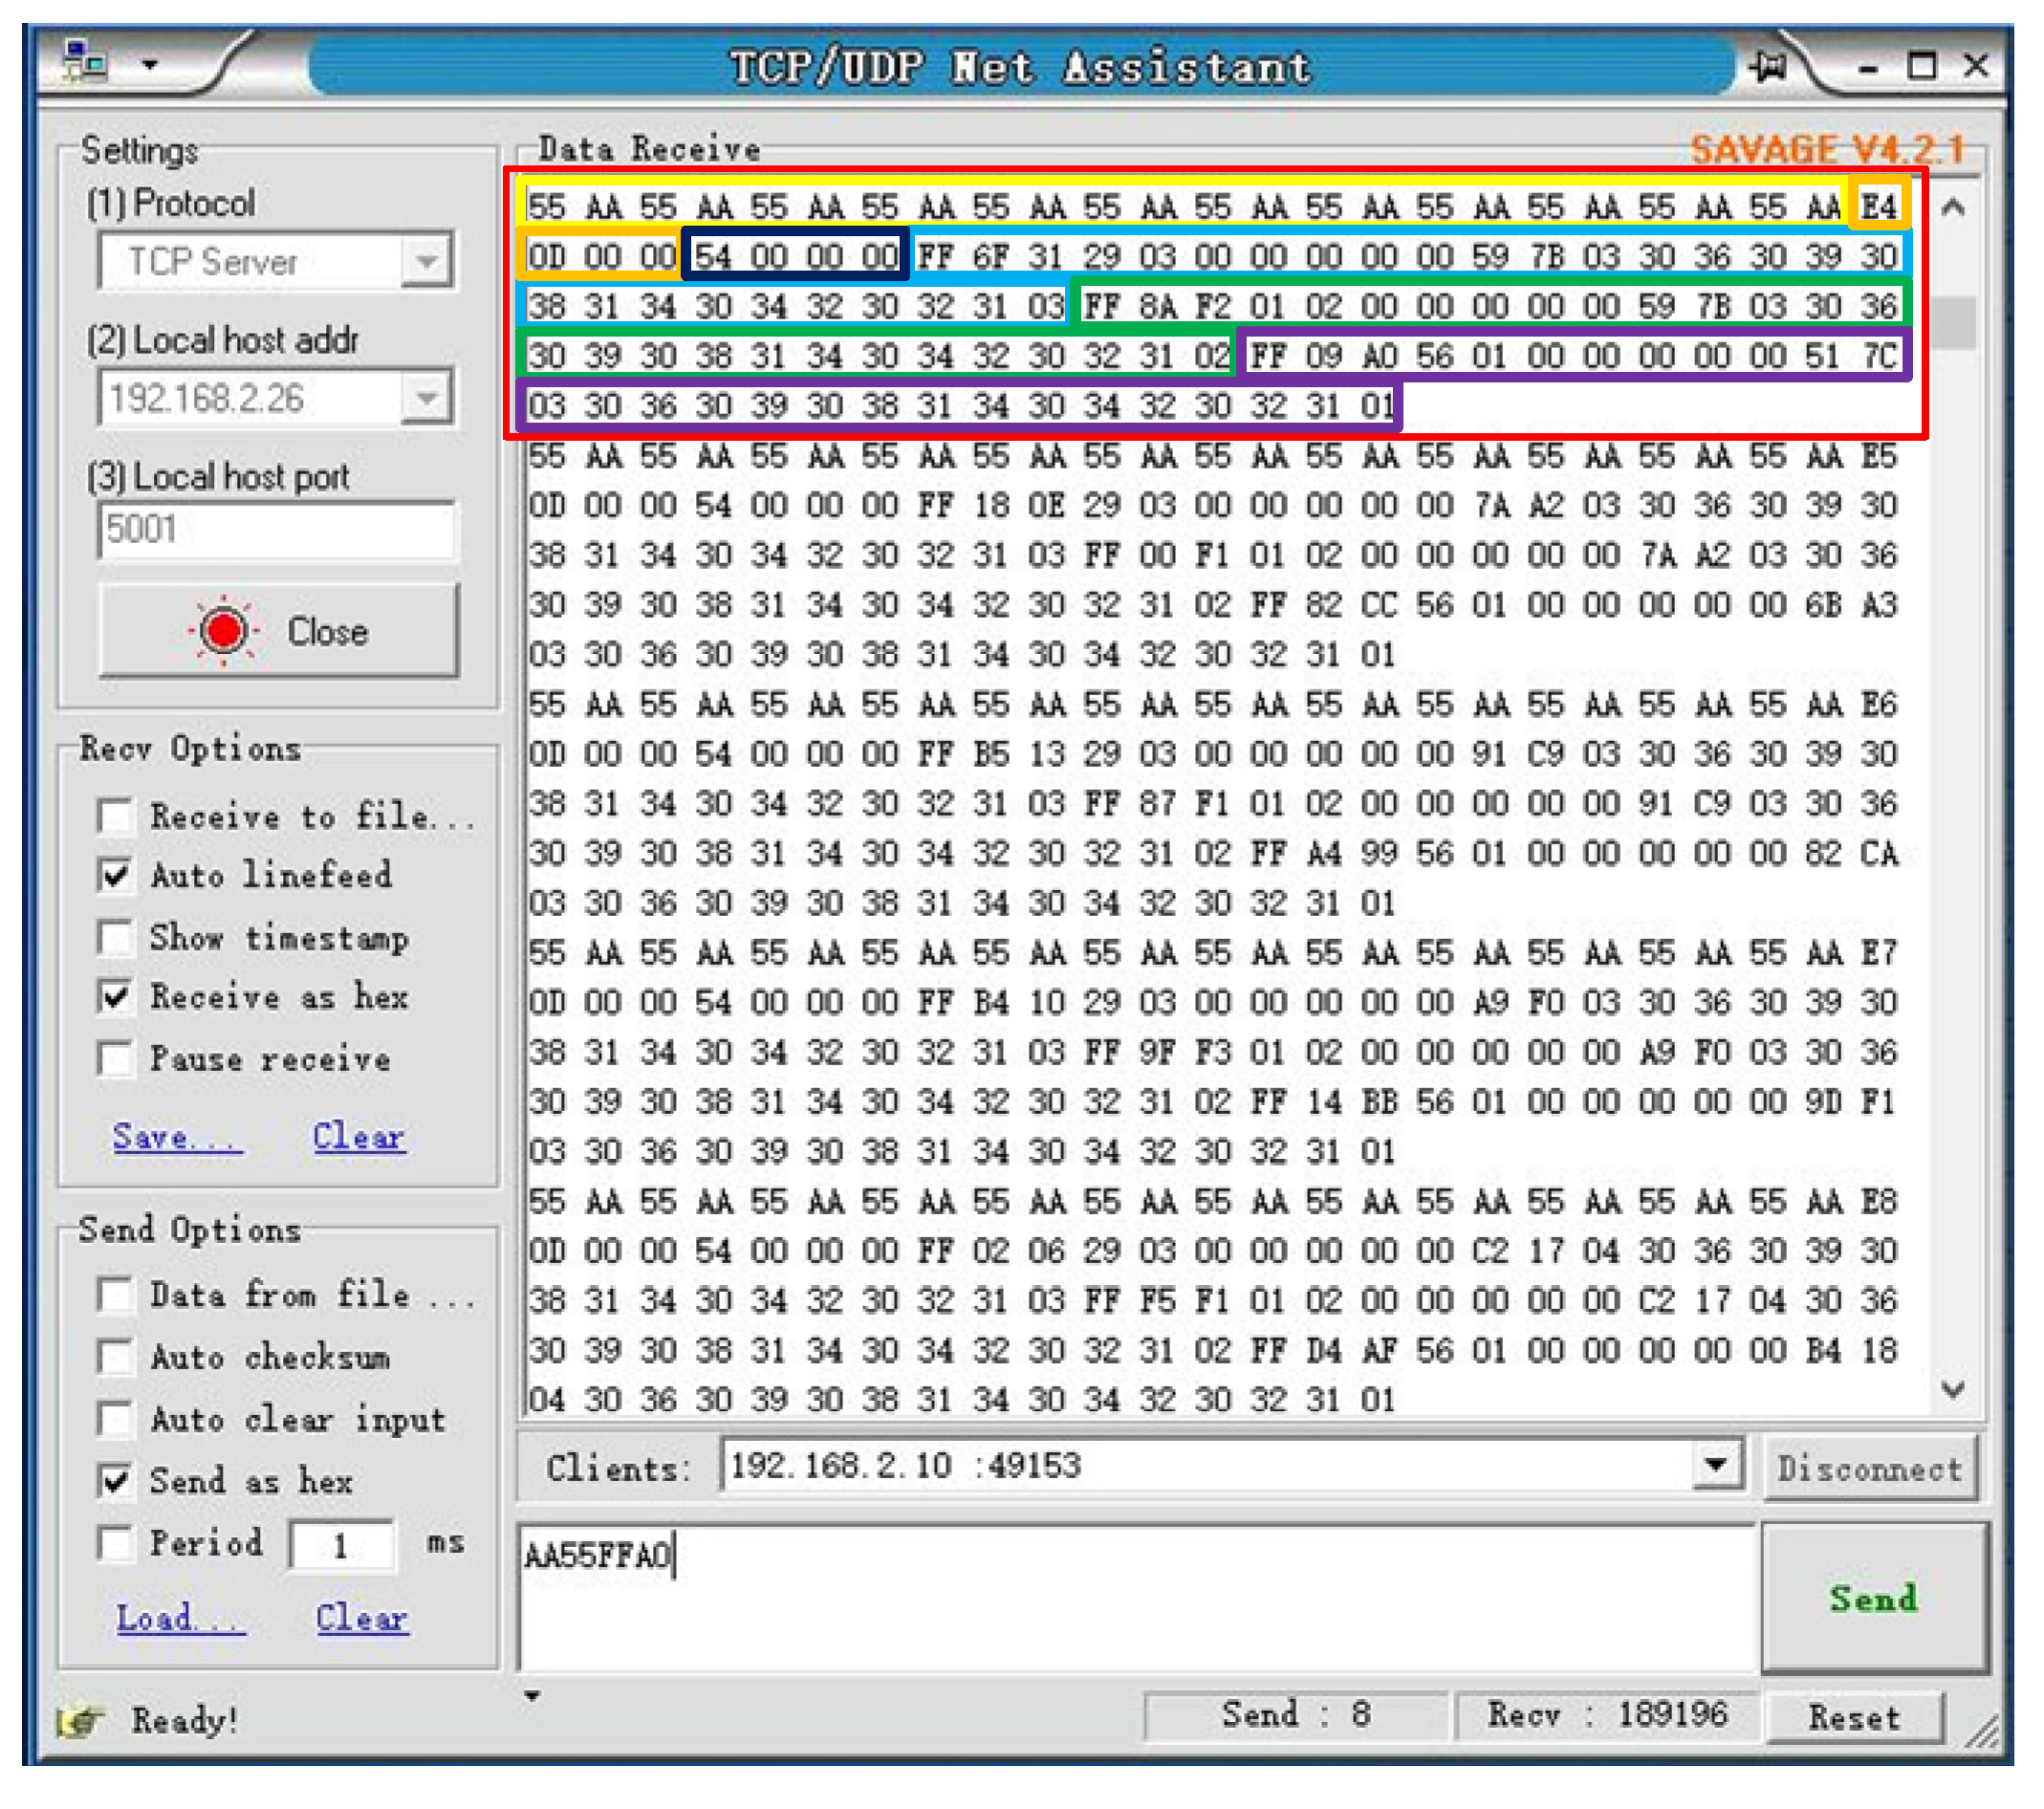
The composition sequence of the data packet between nodes is Header, Seismometer number, Time stamp, Sampling data, MAC address, Separator, and its format is defined as follows in
Table 2.
This section may be divided by subheadings. It should provide a concise and precise description of the experimental results, their interpretation, and the experimental conclusions that can be drawn.
In our design, the end node of the transmission link needs to merge and package the data of all nodes and send it to the data center. Taking into account the practicality of implementation and security of the transmission form, as well as the scalability of the transmission data width, Gigabit Ethernet is adopted as the information transmission method between the end node and the data center. This method takes advantage of both the PL side and the PS side of the Zynq-7000 Soc at the same time: the data fusion and package on the PL side can fully utilize the efficient parallel processing capabilities of the PL side. Data transmission is carried out on the PS side, which can take full advantage of the soft-core architecture on the PS side and program to realize Gigabit Ethernet transmission easily.
Xilinx company provides LwIP function support package in the development environment of PS side. By using it, the Gigabit Ethernet transmission based on the TCP server protocol can be quickly realized. PL side and PS side interact with each other through AXI bus. PL side transmits link data to PS side through AXI bus, and the PS side can transmit the user’s control commands for link data transmission to the PL side through AXI bus: transmission start, stop and reset too. We set the PS side to send a data packet to the data center every 10 ms.
The data packet transmitted between the PS side and the data center is composed of Header, Packet Index, Length, Data (combined end node data, intermediate node data with front node data), and its format is defined as shown in
Table 3.


