Article

Study on the Correlation between Soil Consolidation and Pile Set-Up Considering Pile Installation Effect

1
China Construction Eighth Engineering Division Corporation, Ltd., Shanghai 200122, China
2
State Key Laboratory of Ocean Engineering, Department of Civil Engineering, Shanghai Jiao Tong University, Shanghai 200240, China
*
Author to whom correspondence should be addressed.
J. Mar. Sci. Eng. 2021, 9(7), 705; https://doi.org/10.3390/jmse9070705
Submission received: 2 June 2021 / Revised: 20 June 2021 / Accepted: 23 June 2021 / Published: 26 June 2021
(This article belongs to the Special Issue Structure-Seabed Interactions in Marine Environments)

Abstract

:
In saturated fine-grained soil, the development and dissipation of excess pore water pressure (EPWP) during and after pile jacking change the effective stress of the surrounding soil, and thereby affect the pile set-up. In this paper, the entire process of steel-pipe pile jacking (the installation process and the subsequent consolidation phase) is simulated with three-dimensional (3D) finite element models, considering the pore water effect. After the model verification, a comprehensive numerical analysis was performed to investigate the development and dissipation of EPWP, changes in soil stress state, and the side shear resistance of pile with time after installation. On this basis, not only the influence of ks, cu, E, and OCR on EPWP generation during pile jacking and subsequent soil consolidation effect after pile installation but also the correlation between pile set-up and EPWP dissipation is investigated.

1. Introduction

The environmental condition of the construction site is an important reference for the selection of steel-pipe pile construction methods. The pile jacking-in method is suitable for urban areas and public buildings with high noise and vibration requirements. However, the installation of pile plays an important impact on not only the safety of adjacent structures [1] but the penetration resistance and pile set-up [2]. The installation effects include the following three steps: the development of excess pore water pressure (EPWP), the dissipation of EPWP, and soil aging [3,4]. In cohesive soils, the first two steps are predominant and play roles on the pile set-up by changing the effective stress of the surrounding soil. However, soil aging is predominant in granular soils, and pile set-up has no dependence on the stress state of surrounding soil. Taking advantage of the effect of pile set-up during pile design can offer substantial benefits by reducing one or a combination of pile lengths, pile sections, and the size of driving equipment [3]. Thus, in saturated fine-grained soil, it is essential to study the impact of the development and dissipation of EPWP on pile set-up during history of jacked pile.
To date, previous studies on the time histories of EPWP during and after pile installation mainly focus on field research through piezometers placed at special locations [5,6,7,8,9]. It is generally acknowledged that a positive EPWP field will exist along the pile shaft and ahead of the pile tip during pile installation, which decreases effective stress of the surrounding soil; after pile installation, the dissipation of EPWP increases effective stress of soil immediately around the pile, and the pile set-up predominantly occurs. However, some studies [6,10,11] have indicated that the negative EPWP, which is counterproductive to the pile set-up, occurs near the ground surface and at a certain depth below the pile tip. The negative EPWP induced by pile jacking is easily ignored in the field data due to the limited precision and quantity of piezometers. Besides, the influence of geotechnical soil parameters on the time history of EPWP and pile set-up is not well understood through field trials.
The abovementioned drawbacks in field measurements can be well solved by the finite element method (FEM). Simulating the pile installation process by FEM usually encounters mesh distortion, frictional contact, and elastoplasticity [12]. To simulate the entire pile installation process, a pre-bored pile or cavity expansion theory is adopted to establish the pile installation process avoiding excessive mesh distortion, and the theory of consolidation is adopted to model the dissipation of EPWP after pile installation. Some previous studies resort to the assumption of a pre-bored pile with the surrounding in situ stresses remaining unchanged, then an additional penetration is applied [13,14]. The drawback is that pre-bored modeling cannot capture the generated EPWP of the soil immediately around the pile shaft. Therefore, based on the phenomenon that the soil is radially displaced predominantly outwards at greater pile jacking depth, some studies simulate the pile installation process by integrating FEM with cavity expansion theory [15,16,17]. However, the application of cylindrical expansion takes no account of the effect of the ground surface and the pile tip, and the EPWP generated due to pure shear. The above shortcomings can be partly overcome by imposing an incremental vertical displacement on the pile after the volumetric cavity expansion phase, which can generate EPWP around the pile tip [18,19,20]. The inherent drawback of cavity expansion theory is that it cannot simulate the pile installation from ground surface. Besides, the strain paths followed by soil elements and the pile –soil frictional interaction cannot be correctly captured with the application of cylindrical expansion [21].
The coupled Eulerian–Lagrangian (CEL) method or arbitrary Lagrangian–Eulerian (ALE) method has been applied to simulate pile installation from ground surface to the desired depth [22,23,24,25]. In these two methods, a Lagrangian phase is firstly performed, in which the element nodes move temporarily with the material; in the second phase, the displaced mesh at the Lagrangian phase is remapped into an arbitrary undistorted mesh for ALE formulation, or back to its initial mesh for Eulerian formulation. However, the ALE or CEL method is limited to total stress analysis in commercially available software, and a user subroutine is needed to consider the pore water effect [26,27,28,29], which requires outstanding programming skills [30]. Given this situation, a hybrid Lagrangian–ALE approach, which combines the advantages of the Lagrangian and ALE or CEL approaches, comes into view [10,31,32]. This method is applied to simulate the undrained pile jacking in saturated fine-grained soil, which can not only solve the mesh distortion near the pile–soil interface, but also obtain the EPWP response of far field soil around pile.
The entire process of steel-pipe pile jacking (the installation process and the soil consolidation phase after installation) in saturated fine-grained soil is simulated in this paper with the hybrid Lagrangian–ALE approach based on a field trial reported by Roy et al. [33]. The pile jacking from the ground surface to the desired depth considering the pore water effect via the Biot consolidation theory is simulated by establishing three-dimensional (3D) finite element models. The saturated soil is set to be undrained during pile installation and drained after installation. Results from the finite element modeling include the development and dissipation of EPWP, changes in the stress state of the surrounding soil and pile shaft resistance with time after installation. On this basis, not only the influence of ks, cu, E, and OCR on EPWP generation during pile jacking and subsequent soil consolidation effect after pile installation but also the correlation between pile set-up and EPWP dissipation is investigated.

2. Numerical Model

Numerical modeling of the pile installation process into saturated soil usually encounters nonlinear material behavior, pore water effect, and pile–soil frictional interaction, as well as large mesh deformation. The solutions for the above problems have been described in detail by Dou et al. [10], and a brief explanation will be provided in this article.

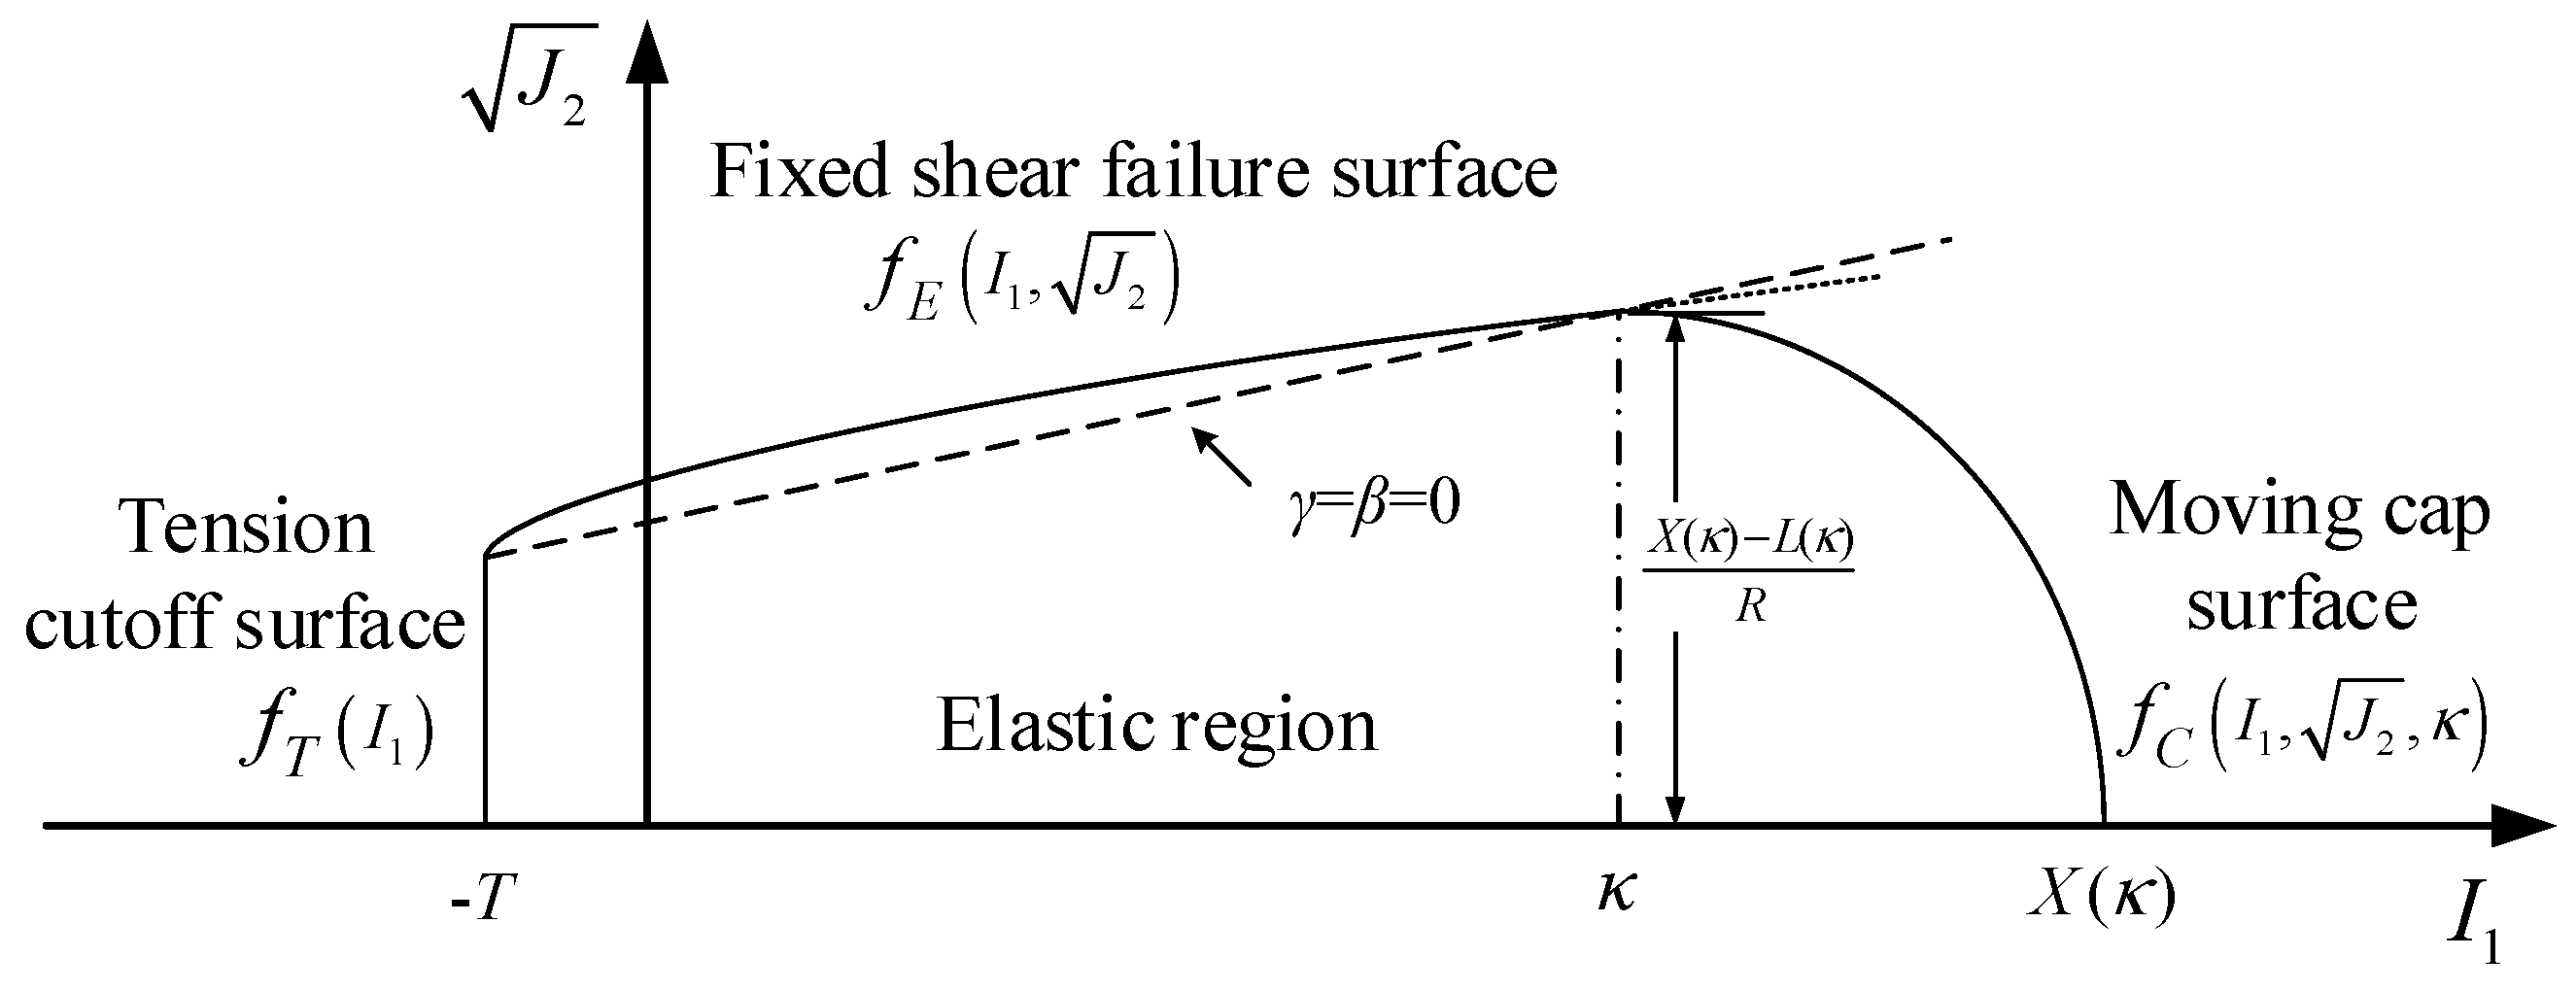
2.1. Soil Model Description

The cap model, which is based on the idea of Drucker [34], is applied to capture the non-linear behavior of the soil constituent [10,32,35]. One of the major advantages of the cap model over other classical pressure-dependent plasticity models such as the Drucker-Prager and Mohr–Coulomb models is the ability to control the amount of dilatancy produced under shear loading. Another advantage is the ability to model plastic compaction. As an inviscid model, the cap model cannot capture time-dependent soil behaviors, such as strain rate effect, creep, and stress relaxation. Besides, the cap model cannot take into account the strain softening of structural soft soils [36].
The plastic yield function f (i.e., to the yield surface) is adopted in the form of the inviscid cap model based on the formulations of Sandler and Rubin [37]. The yield surfaces are comprised of a tension cut-off surface fT, a movable cap surface fC, and a shear failure surface fE, as shown in Figure 1, which are defined by:
{ f E = J 2 α + γ exp ( β I 1 ) θ I 1 f C = J 2 1 R [ X ( κ ) L ( κ ) ] 2 [ I 1 L ( κ ) ] 2 f T = I 1 ( T )
where
  • J2 is the second invariant of the deviatoric stress tensor,
  • I1 is the first stress invariant,
  • α, γ, β and θ are the material parameters of the failure surface [38], which can be defined by α = 6 c cos φ 3 ( 3 sin φ ) and θ = 2 sin φ 3 ( 3 sin φ ) ,
  • c, φ are the frictional and cohesive strengths of the material,
  • R is the curvature of the hardening cap, which can be defined by R = 6 ( 1 + v ) 1 2 v ,
  • v is the Poisson’s ratio,
  • X(κ) is the intersection of the cap surface with the I1 axis,
  • L(κ) is the value of I1 at the location of the start of the cap,
  • κ is the I1 coordinate of the intersection of the cap surface and the failure surface,
  • T is the maximum allowable hydrostatic tension.
An exponential decay shear failure surface fE is proposed to predict the dilatancy, and given the material parameter γ = β = 0, fE will degenerate into the Drucker–Prager surface.
X ( κ ) = κ + R [ α γ exp ( β κ ) + θ k ]
L ( κ ) = { κ   if   κ > 0 0   if   κ 0
The hardening parameter κ is related to the plastic volume change ε v p through the hardening law. The hardening law permits the cap surface to contract until the cap intersects the failure envelope at the stress point, and the cap remains at that point. By allowing the stress to migrate back onto the cap, further dilation is avoided.
ε v p [ X ( κ ) ] = W { 1 exp [ D ( X ( κ ) X 0 ) ] }
where
  • W is related to the porosity n and the degree of saturation Sr, W = n ( 1 S r ) [38], which represents the void fraction of the uncompressed sample,
  • D governs the slope of the initial loading curve in hydrostatic compression, and
  • X0 is thought of as the preconsolidation hydrostatic pressure, which is the product of OCR and the overburden pressure σz (i.e., X0 = OCR·σz) [38].
Mathematically, the total strain increment d ε i j is assumed to be the sum of the elastic strain increment d ε i j e and the plastic strain increment d ε i j p . According to the incremental theory of plasticity, the mathematical relationship between the effective stress increment and the strain increment can be expressed as [38]:
d σ i j = D i j k l d ε i j e = D i j k l ( d ε i j d ε i j p )
D i j k l = ( K 2 3 G ) δ i j δ k l + G ( δ i k δ j l + δ i l δ j k )
where
  • Dijkl is elastic stiffness matrix,
  • K is the bulk modulus of soil,
  • G is the shear modulus of soil, and
  • δij is the Kronecker operator, δij = 1 when i = j; δij = 0 when ij.
Associated plastic flow is adopted, when the stress path reaches the shear yield surface, associated flow assumption leads to dilatancy, and reduction in X(κ), thereby leading to a shrinkage and movement of the cap towards the origin. Dilation can continue until the cap catches up with the stress point on the shear yield surface [39]. In addition, the plastic strain increment d ε i j p is given as the sum of contributions from all of the active yield surfaces following Koiter’s flow rule:
d ε i j p = m = 1 3 λ m f m σ i j
where λ i is the plastic consistency parameter for yield surfaces (fE, fC, and fT) and σ is the stress.

2.2. Pore Water Pressure Effect Description

In commercial software environment, when the soil model adopts Euler or ALE algorithm, modeling pile installation is mainly limited to total stress analysis; when the soil model adopts the Lagrangian algorithm, modeling pile installation can use coupled pore pressure analysis based on the continuum medium mechanics and Biot consolidation theory [40,41,42].
The so-called u-p formulation of Biot consolidation theory, which ignores the acceleration of the fluid component of the soil, is adopted in this paper. When the pile installation is displacement-controlled, the u-p formulation can degenerate into quasi-static form, as shown in Equation (8), in which the superimposed dot represents the time derivative of the variable.
[ C 0 Q S ] [ U ˙ P ˙ ] + [ B Q T 0 H ] [ U P ] = [ F U F P ]
where
  • B, C, H, Q, and S are the stiffness, damping, permeability coefficient, coupling, and flow compressibility matrices respectively, and the superimposed dot represents the time derivative of variables, and
  • FP and FU are the vectors of fluid supply and external nodal forces, respectively.
After pile installation, the saturated soil is set to be drained. The generated EPWP during pile installation dissipates with time, that is, the soil consolidation is a function of time. For time dependent consolidation, pressure gradients follow Darcy’s law:
v f = k s ( p w + z c o )
where
  • ks is the permeability coefficient of soil,
  • pw is the pressure head,
  • vf is the fluid velocity vector, and
  • zco is z-coordinate.
A time factor is used to simulate the consolidation process, the permeability of the soil is increased by the time factor so that consolidation occurs more quickly in numerical calculation [43]. The time factor is adjusted according to how quickly the pore pressure is changing: the time factor usually changes quickly and has a small value at the start of consolidation, then increases gradually as the rate of pore pressure change reduces. The time taken in the real-life consolidation process is usually much larger than the analysis time and is represented by the product of the analysis time and time factor.

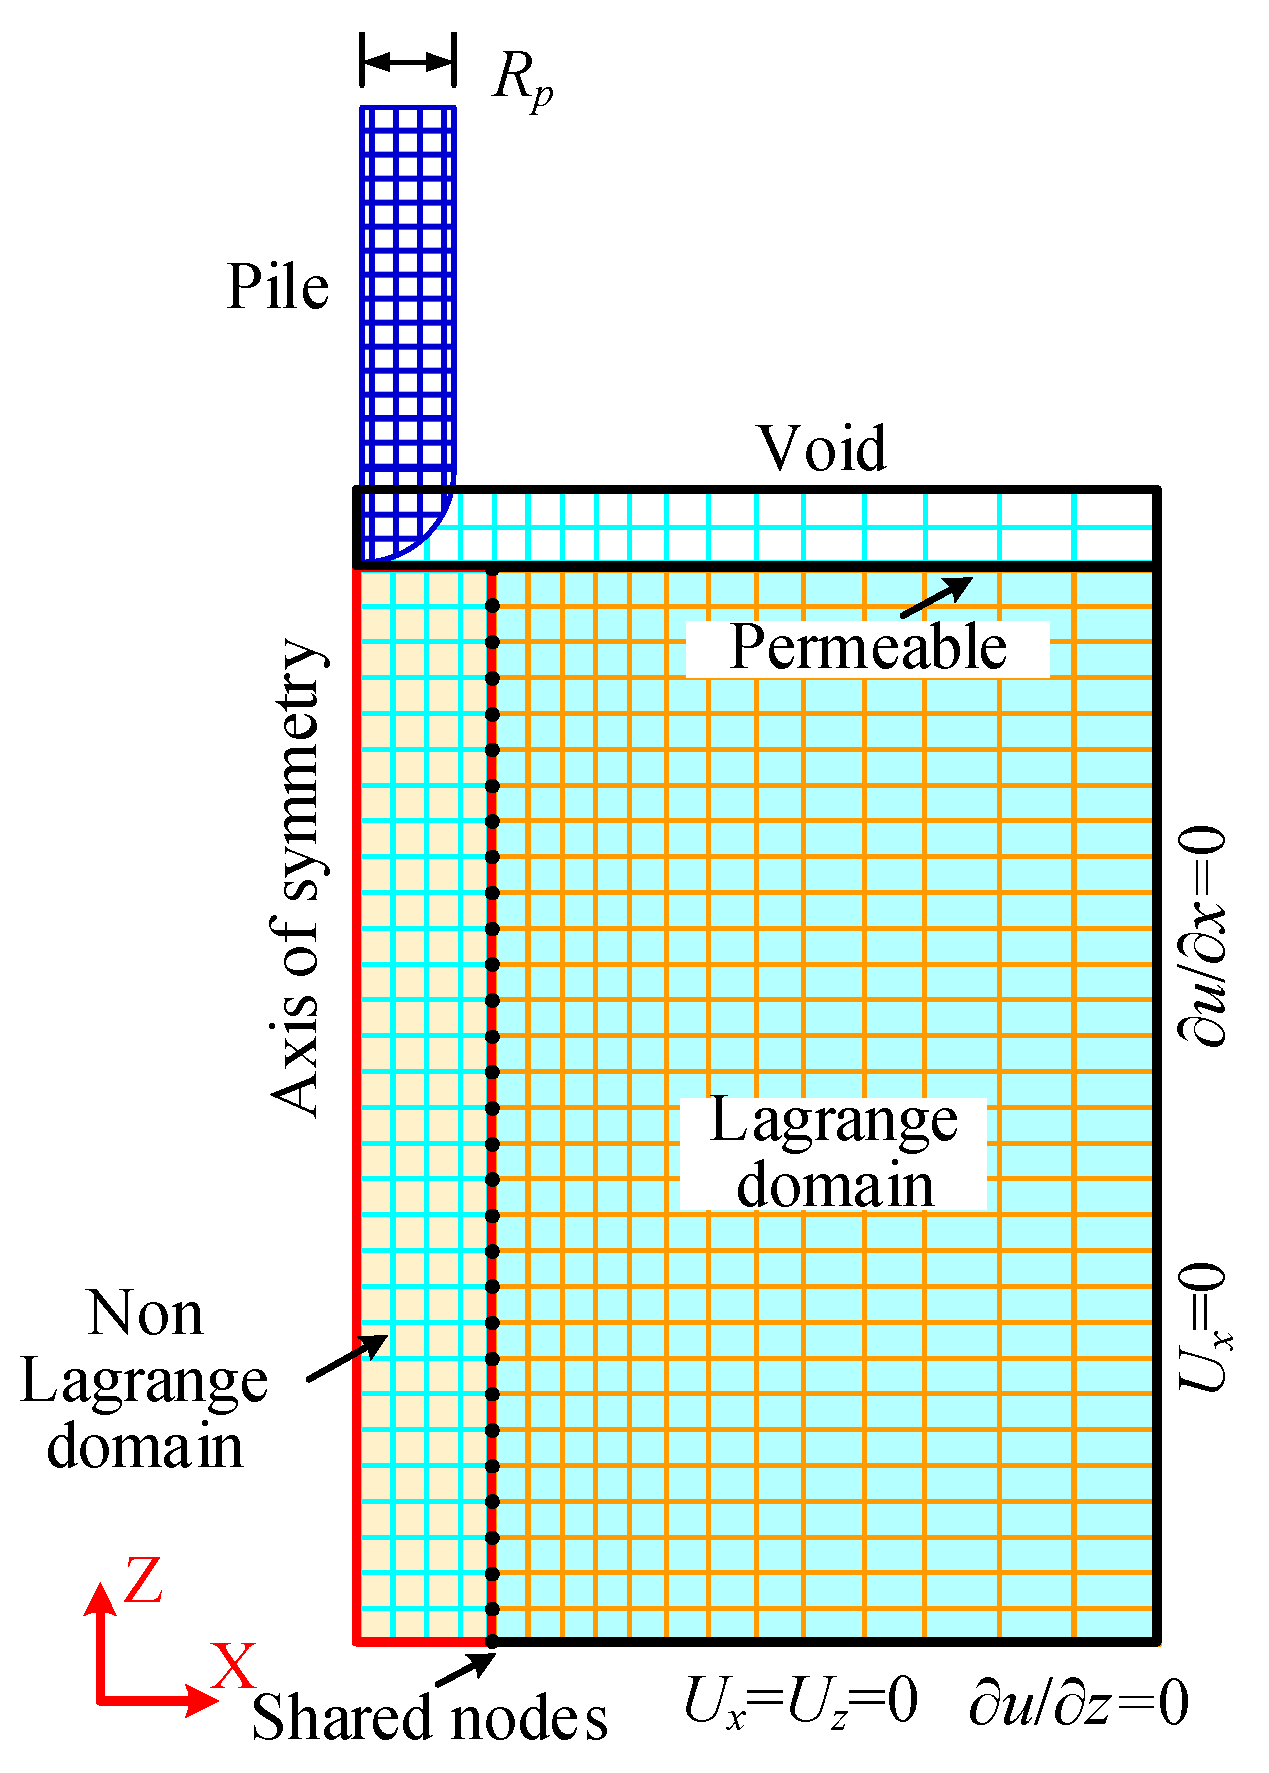
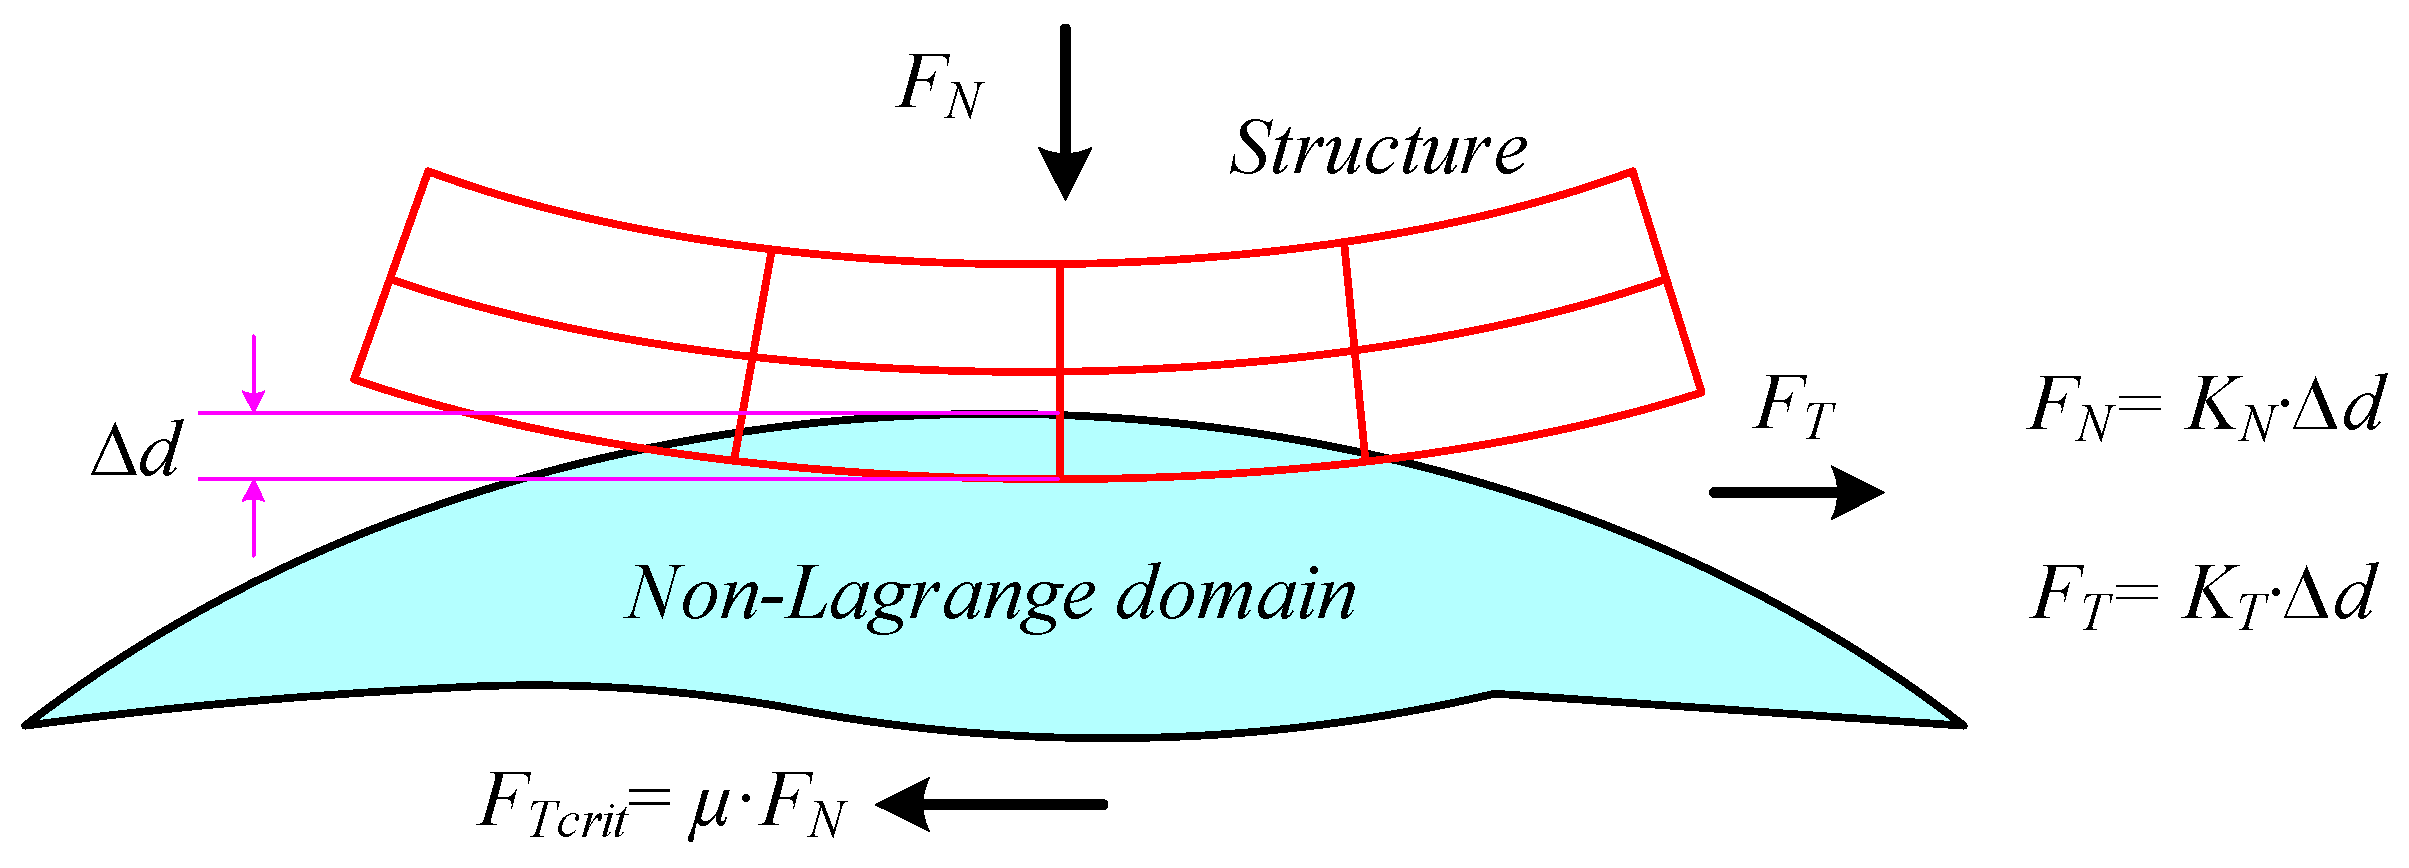
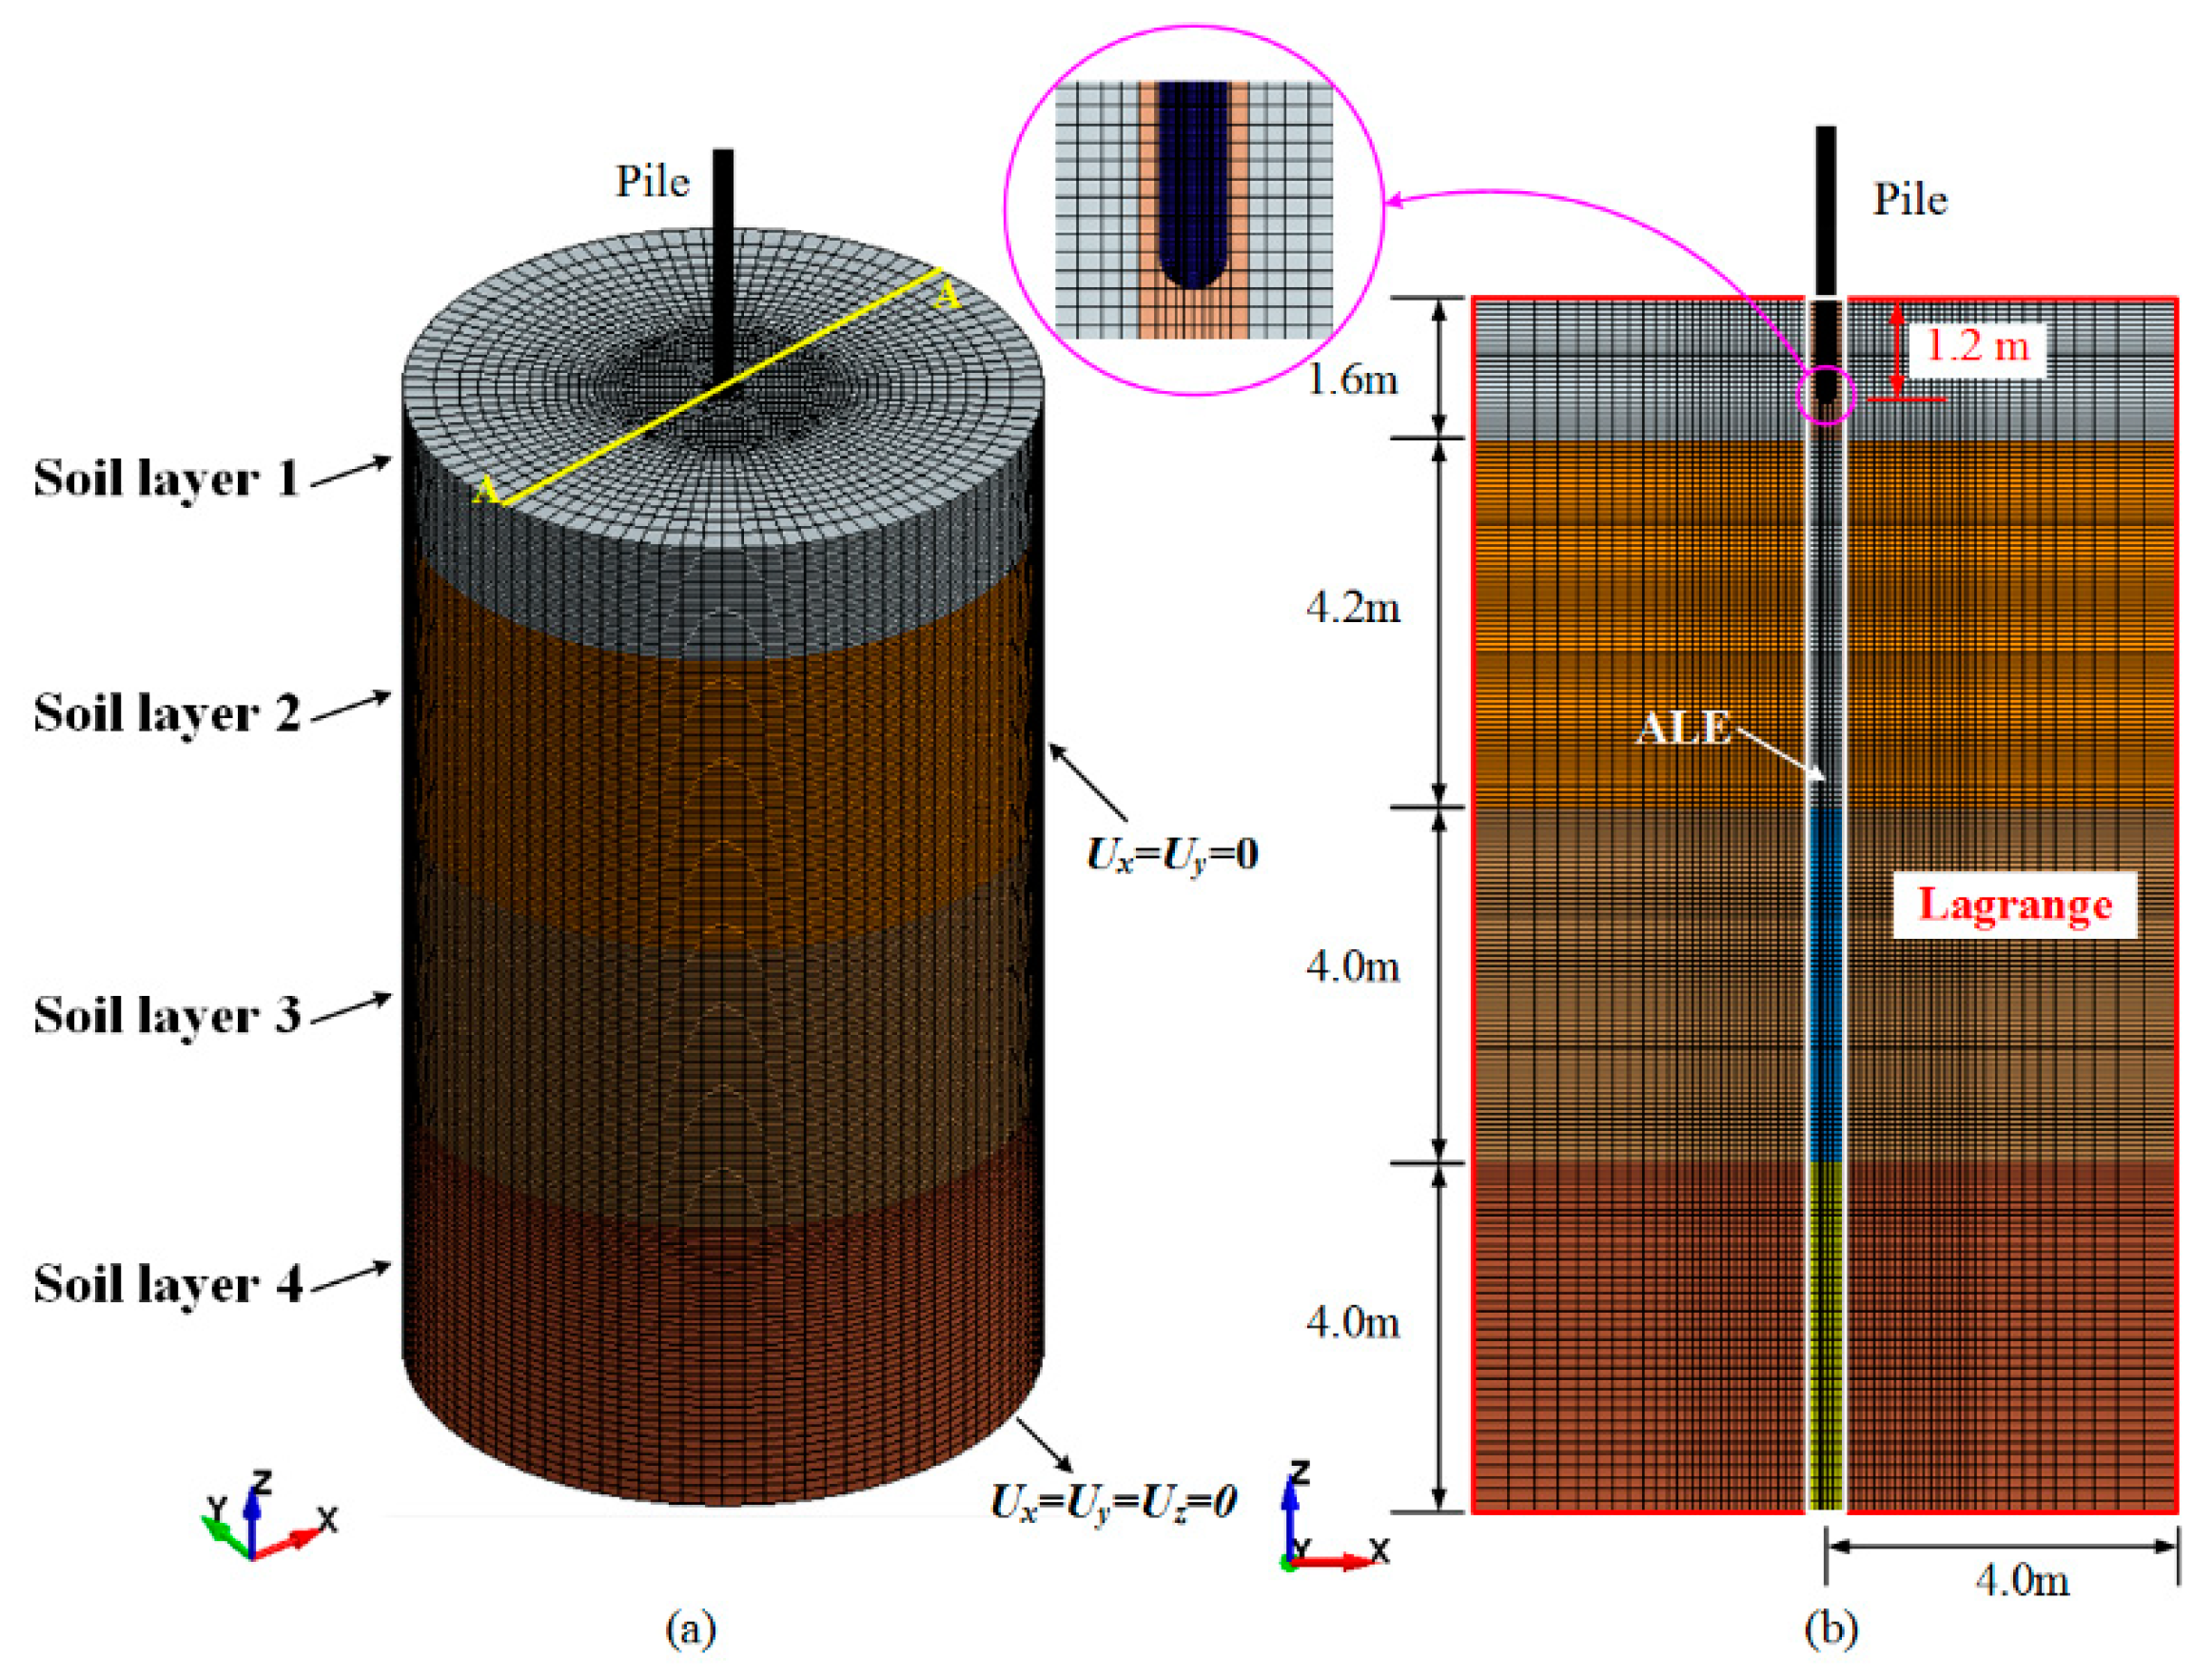
2.3. Interface Modeling in Pile Jacking Simulation

One of problems encountered in simulating the pile installation by FEM is the high mesh distortions in the vicinity of the pile–soil interface. To solve this problem, the hybrid Lagrangian–ALE approach is applied, as shown in Figure 2, in which the soil model around the pile–soil interface is set as the non-Lagrange grid and the rest soil model is set as the Lagrange grid. The mesh of the non-Lagrange domain adopts the ALE algorithm in the close-ended steel-pipe pile jacking simulation, which is applied in this study. Besides, in the open-ended steel-pipe pile jacking simulation, the mesh of the non-Lagrange domain adopts the Euler algorithm to simulate the soil plug, and the potential soil heave can be accommodated by a void domain with no material atop the soil.
The non-Lagrange domain is connected directly to the far field Lagrange domain via one-to-one node matching, and the shared nodes are treated as Lagrange [43]. The soil parameters under the condition of total stress analysis are adopted in the non-Lagrange domain, and those related to effective stress analysis are used in the far field. Thus, to ensure the continuity of soil stress at the interface of the mixed grid in undrained conditions is necessary. Assuming the decoupling between volumetric and shearing effects under the two stress analysis conditions, it can be obtained that the shear moduli of isotropic soil at the elastic deformation stage are equal (see Equation (10)) [38]. Besides, both elastic modulus E and bulk modulus K can be expressed in terms of shear modulus G and Poisson’s ratio v (see Equations (11) and (12)). On this basis, the fitting of soil model parameters under the two stress analysis conditions can be ensured.
G u = G = G
K = E 3 ( 1 2 v )
E u = 2 G ( 1 + v u ) = 2 E 2 ( 1 + v ) ( 1 + v u ) = 3 E 2 ( 1 + v )
where
  • Eu, E′ are the elastic moduli in undrained and drained conditions, respectively,
  • Gu, G′ are the shear moduli in undrained and drained conditions, respectively,
  • v′, vu are the Poisson’s ratios in drained and undrained conditions, respectively, and vu is assumed as 0.49 to avoid numerical troubles.
Another problem encountered in simulating the pile installation by FEM is the pile–soil frictional interface modeling. The interaction between the Lagrange rigid pile and the non-Lagrange soil in the vicinity of the pile–soil interface is simulated by a penalty-based algorithm. As shown in Figure 3, there is a coupling force to ensure that the fluid (soil material) flows outside of the pile. The coupling force is calculated with a spring-like system and is computed by contact stiffness and the penetration displacement of the structure into the non-Lagrange domain Δd. The pile–soil interaction is based on the Coulomb friction contact law (see Equation (13)).
F T F T c r i t = F T μ F N 0
where
  • μ is the friction coefficient of the pile–soil interface,
  • d is the penetration displacement of the structure into the non-Lagrange domain,
  • FT is the tangential force,
  • FN is the normal coupling nodal force,
  • FTcrit is the maximum tangential force.

2.4. Establishment and Parameters of Modeling Pile Jacking

A finite element model is established to model the pile installation process and subsequent soil consolidation after installation, referring to a field case of close-ended steel-pipe pile jacking [33]. In the field trial, the steel-pipe pile is 7.5 m long with an external diameter of 0.22 m and a wall thickness of 0.01 m. The density of the steel-pipe pile is given as 7850 kg/m3, the Young’s modulus E is given as 210 GPa, and Poisson’s ratio is given as 0.3. A starting hole filled with water is augured to a depth of 1.2 m before pile jacking. The average pile installation rate vc is approximately 7 cm/min. Besides, pore pressure cells were installed at a distance of 0.2 m from the pile wall at four different levels (at depths of 3.1, 4.6, 6.1, and 7.6 m) to measure the pore pressures induced by pile jacking.
Geotechnical investigation shows that the typical soil profile consists of four distinct layers resting on a deep layer of dense sand. The corresponding geotechnical properties have been described in Roy et al. [33] and Dou et al. [10] and are tabulated in Table 1, where ρ is the natural density of soil, K0 is the coefficient of earth pressure at rest, cu is the undrained shear strength of soil, ω is the water content, Ip is the plastic index, and IL is the liquidity index. The surrounding soil adjacent to the jacked pile is generally remolded, which leads to the strength loss of soil. The rigidity indexes (Ir = E/cu) of intact and disturbed soil are in the order of 900 and 450, respectively. The rigidity index of disturbed soil rather than intact soil is taken herein in order to well agree with the observations. The deposit was subjected to a slight geological preconsolidation, and the measured values of OCR are in the order of 2.0–2.3. The average permeability of soil (ks), which is estimated from the coefficient of consolidation, is about 3.5 × 10⁻¹⁰ m/s. A normalized permeability Kn = ks/vc has been proposed by Abu-Farsakh et al. [19] to reflect whether the soil is in the drainage state during pile installation. It indicates that the saturated soil is close to the undrained condition when Kn is less than 10 × 10−6. The value of Kn is 3 × 10⁻⁷, thus the saturated soil can be set to be undrained during pile jacking.
In the numerical modeling, a full model is discretized to simulate the pile installation process and subsequent soil consolidation after installation in saturated fine-grained soil, as shown in Figure 4. The full model size is 13.6 m in height and 8.0 m in diameter. The pile tip is spherical in order to reduce the oscillation intensity of soil response. The fractures or cracks of soil in vicinity of the pile–soil interface induced by increased EPWP may cause a rapid dissipation of EPWP temporarily by increasing the permeability of the soil [44,45]. Thus, the soil within (1/3)Rp from the pile wall is set as a fixed ALE grid, and the total stress analysis is adopted. The far field soil model is set as the Lagrange grid, and the effective stress analysis is adopted. The piling rate is about millimeters-level per second, which can be considered to be a slow process, thus the strain rate effect is not a decisive factor. The cap model is applied to all soil layers. The model parameters corresponding to the effective stress analysis are tabulated in Table 2, and a detail explanation is provided by Dou et al. [10] due to referring to the same field case. Besides, without considering the influence of soil shell effect, which will increase the contact area of pile soil and the roughness of pile to a certain extent after pile installation, the friction coefficient of the pile–soil interface is set to tan (φ/3) = 0.2 [29].
The sideways boundary of soil model is only free in vertical direction and the bottom is a fixed boundary. The rigid pile can only move freely in the vertical direction. Only ground surface is drainage boundary, and others are impermeable. The pile jacking is displacement-controlled in numerical simulation. The soil is in an undrained condition during pile jacking, and the cap model takes no account for strain rate. Thus, the calculation efficiency can be improved by appropriately increasing the pile installation rate on the premise of ensuring the calculation accuracy, and the piling rate is set as 1.0 m/s.

2.5. Comparison with Field Data

A good agreement between calculated and measured time histories of EPWP around the jacking pile has been obtained in Dou et al. [10]. Besides, the continuity of soil stress at the interface of the mixed grid has been also verified. The two are no longer discussed in detail in this article. On the basis of Dou et al. [10], this paper further models the dissipation of EPWP after pile installation via adopting the theory of consolidation. As shown in Figure 5, the dissipation of EPWP after installation at a distance of 0.2 m from the pile wall and a depth of 4.9 m is obtained. Close agreement is observed between the calculated dissipation of EPWP and field data. Figure 5 also shows that the predicted duration of EPWP dissipation is about 600 h, which is consistent with that observed by Roy et al. [33]. Thus, the proposed numerical model is sufficient to simulate the process of pile installation into saturated fine-grained soil and subsequent soil consolidation after installation.

3. Numerical Simulation Results

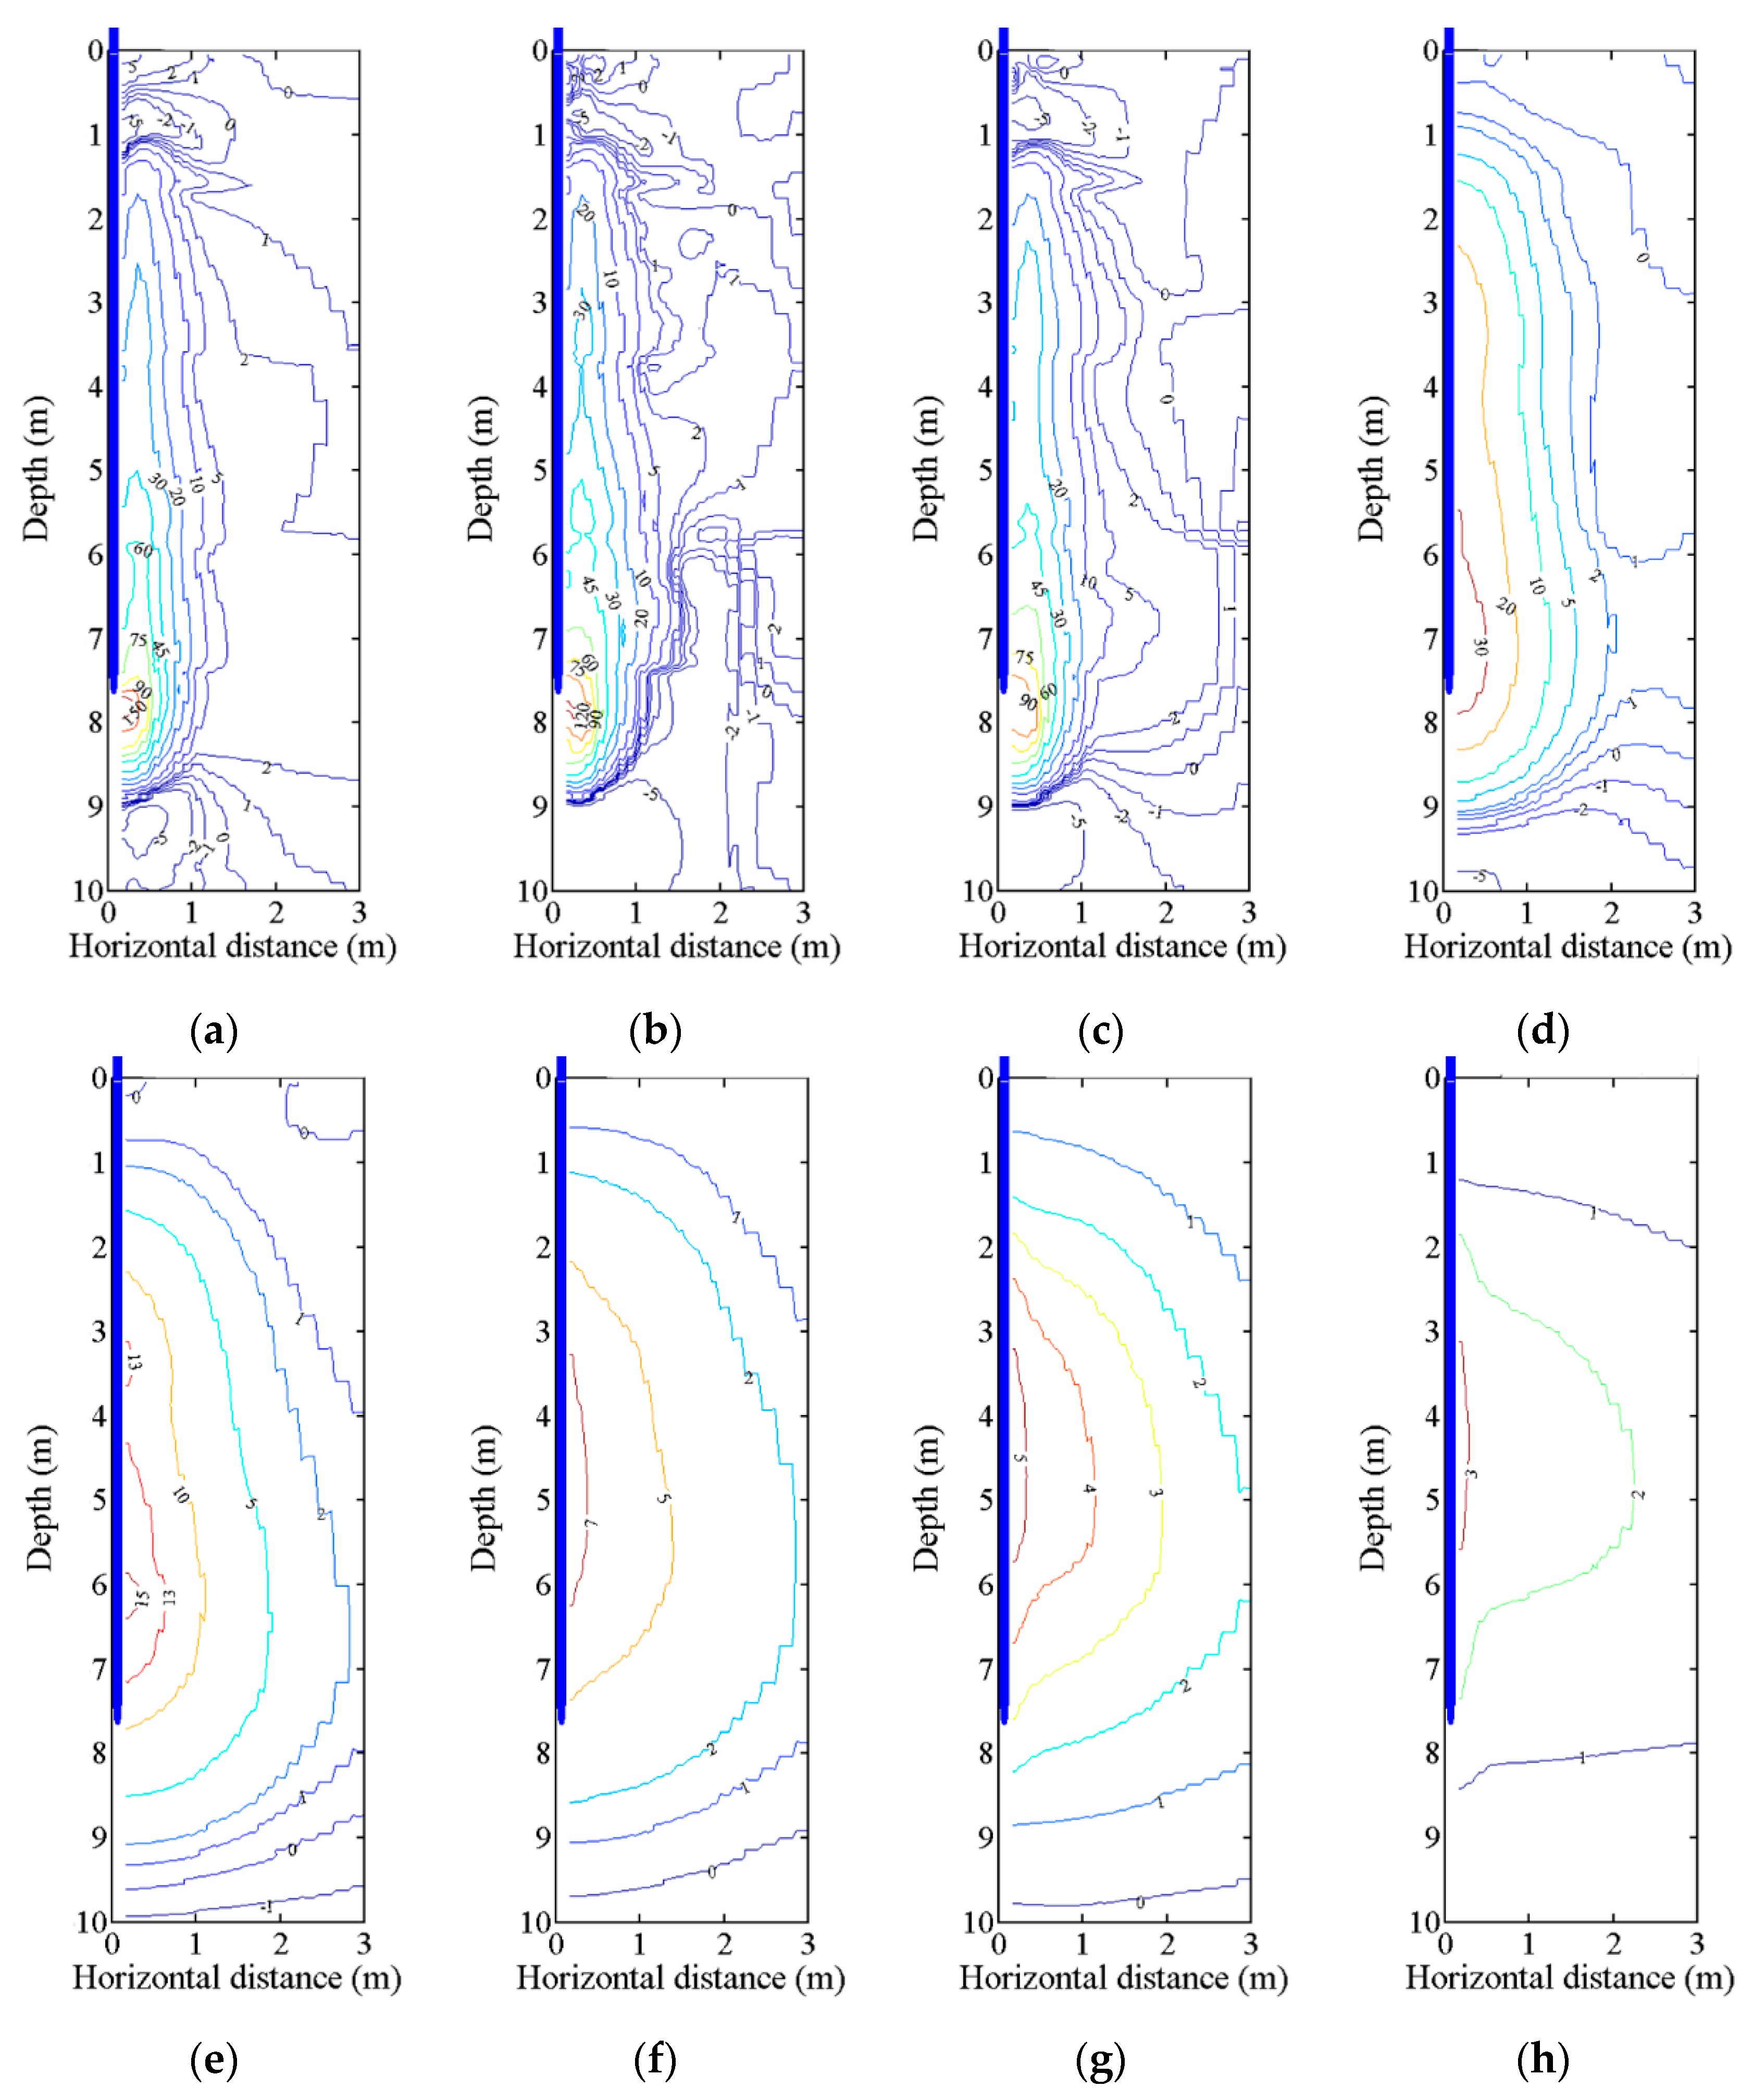
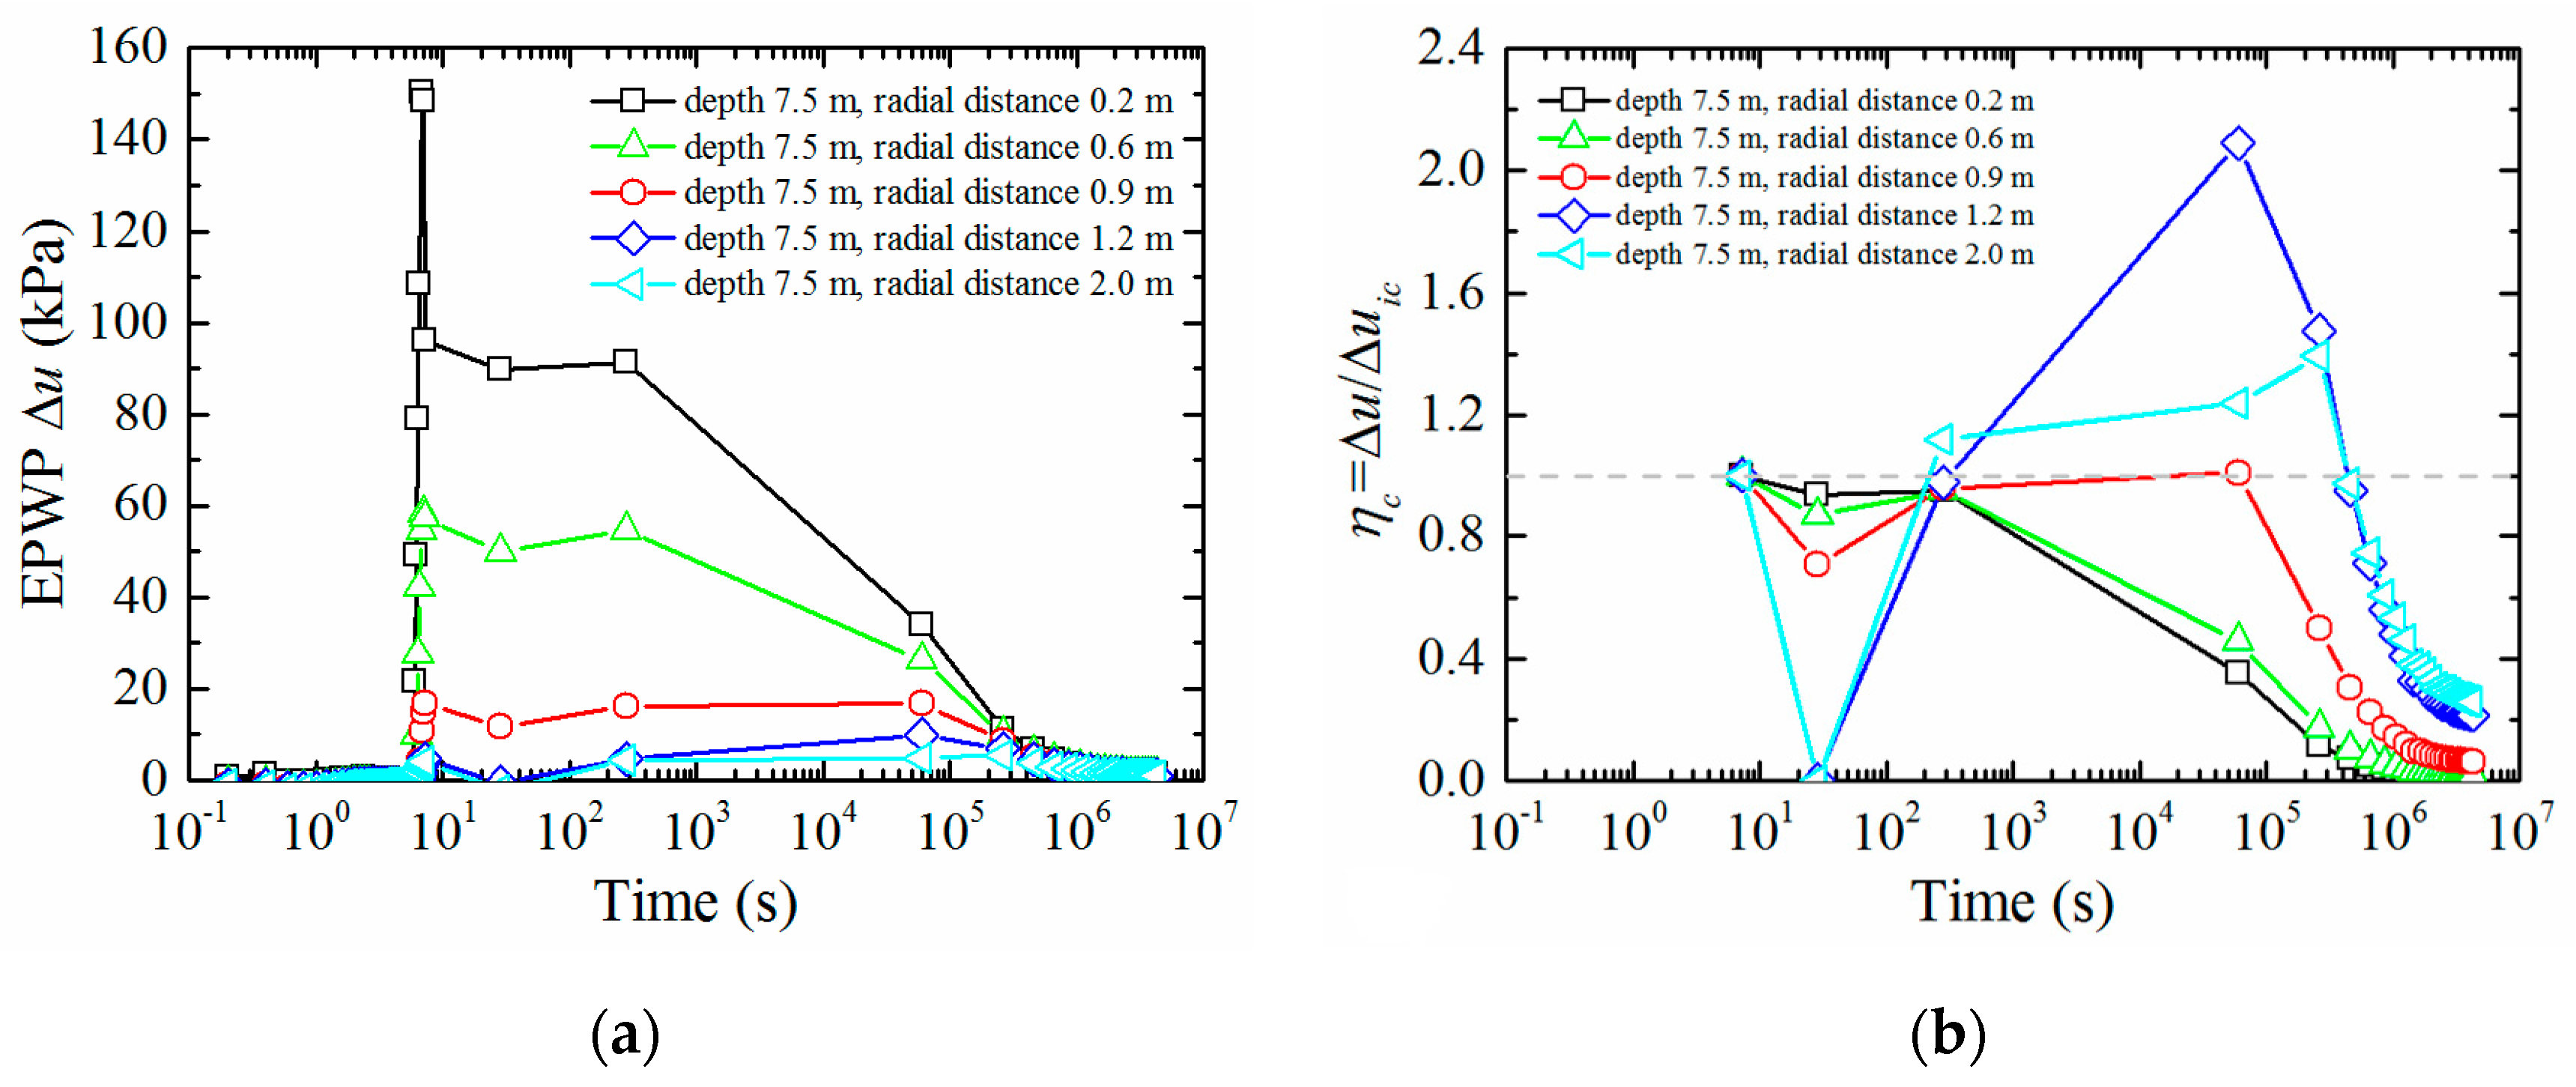
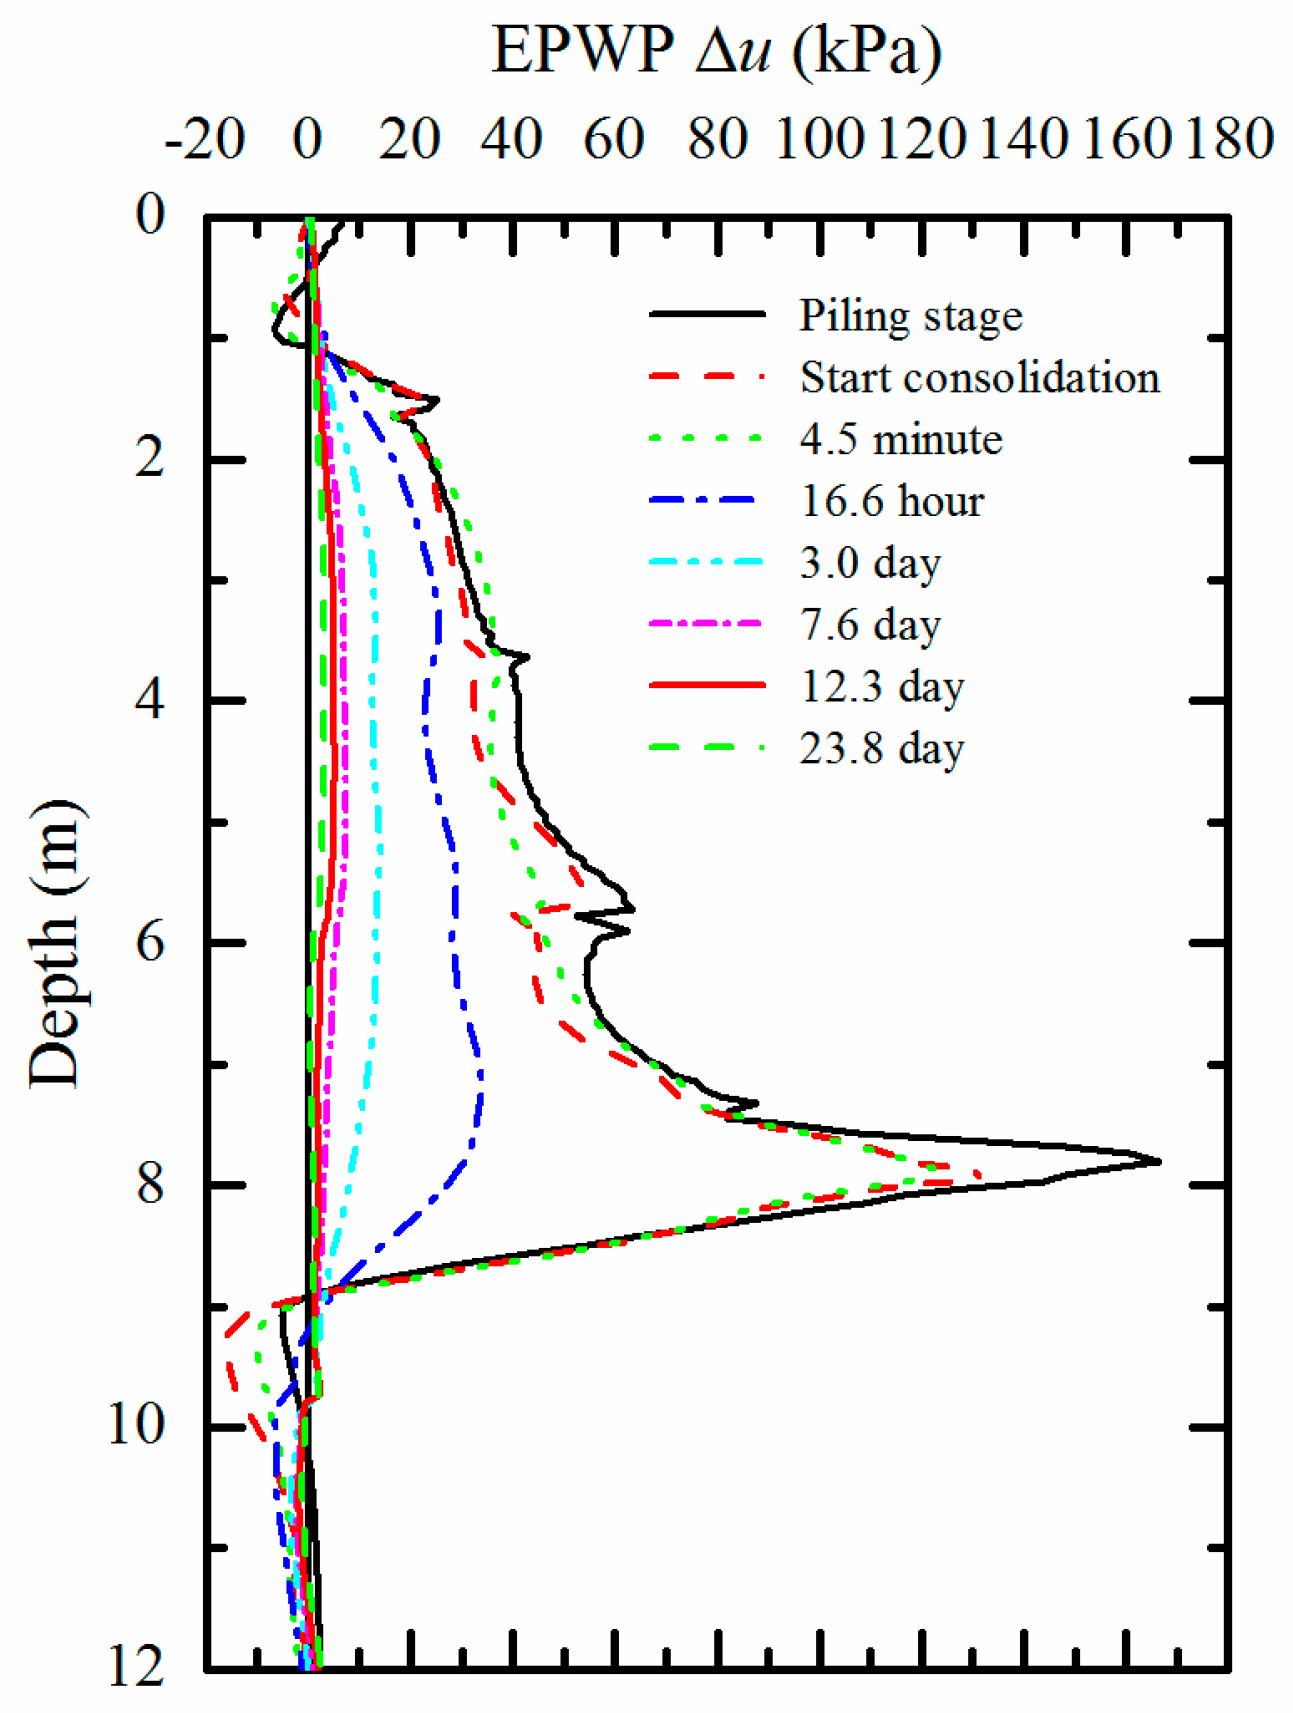
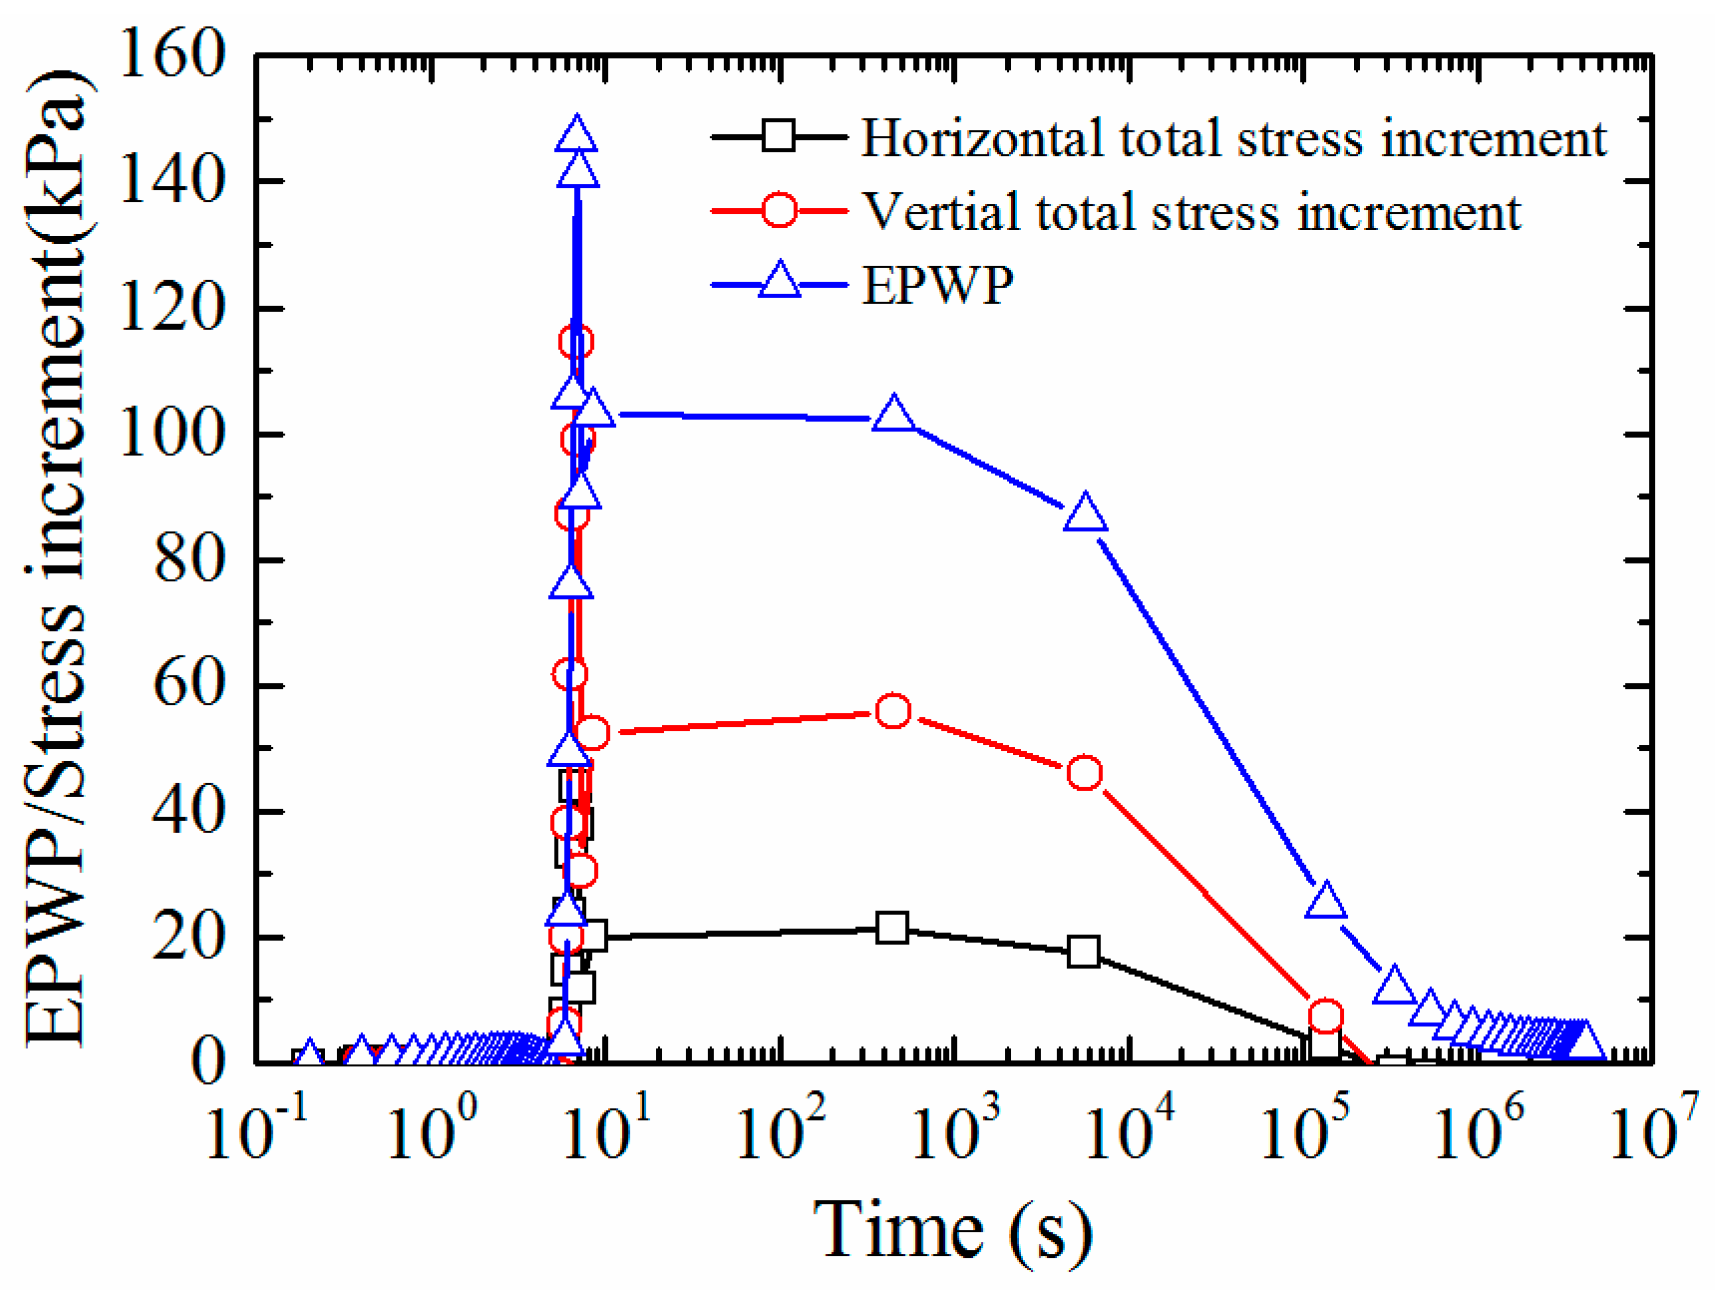
3.1. Mechanism Analysis of Consolidation Effect of Soil around Pile

The mechanism analysis of consolidation effect of soil around pile is based on the model shown in Figure 4, and the model parameters adopted are consistent with those in Table 2. Taking an initial depth of 1.2 m to a final jacking depth zp of 7.8 m as an example, contours of EPWP during piling stage and at different times after end of pile jacking are depicted in Figure 6. Figure 7 shows the distribution curves of EPWP in depth at a distance of 0.2 m from the pile wall during and after pile installation. Figure 6 and Figure 7 indicate that the maximum EPWP in depth occurs near the pile tip, and the negative EPWP occurs near the initial depth of 1.2 m and at a certain depth below the pile tip during pile installation and at the initial consolidation phase after installation (i.e., at the end of pile jacking); the negative EPWP induced by pile jacking increases gradually to a positive value at the early consolidation phase; with the increase of consolidation duration, the EPWP in the vicinity of pile gradually decreases and the far field EPWP gradually increases, as well as the location where the maximum EPWP occurs, gradually moves up.
Taking a distance of 0.2 m from the pile wall as an example, Figure 8a shows time histories of EPWP at different depths during and after pile installation. The depths of 3.0, 4.9, 6.0, and 7.5 m are selected to reflect the trend of EPWP in depth, and the similar trends are observed at any other depths less than zp. During pile jacking, the EPWP increases with pile jacking depth and reaches a maximum when the pile tip is near the selected depth, and once the pile tip passes that, the EPWP decreases rapidly. Similar trends are observed if the selected depths is less than zp. Figure 8b shows the dissipation of normalized EPWP (Δuuic) after installation at different depths, where Δuic is the EPWP at the initial consolidation phase. The dissipation duration of normalized EPWP increases with depth, and the normalized EPWP of shallow soil increases initially before starting to secondly dissipate, which demonstrates that the consolidation occurs as a vertical diffusion of pore fluid.
Taking a depth of 7.5 m as an example, Figure 9a presents the time histories of EPWP at different distances from the pile wall during and after pile installation. The distances of 0.2, 0.6, 0.9, 1.2, and 2.0 m from the pile wall are selected to reflect the trend of EPWP in radial direction. During pile jacking, the EPWP decreases with the distance from the pile wall. Figure 9b shows the dissipation of the normalized EPWP (Δuuic) after installation at different distances from the pile wall. The dissipation duration of normalized EPWP is greater at a larger distance from the pile wall. Before the second dissipation, the normalized EPWP increases initially, the greater increment occurs at a larger distance from the pile wall, which demonstrates the consolidation after installation occurs as a radial diffusion away from the pile.
As mentioned above, the time histories of EPWP at different depths and at different distances from the pile wall are given respectively, from which the similar spatial trends are observed. The EPWP decreases with distance from the pile wall, and the maximum EPWP in depth occurs near the pile tip. Thus, there exists a hydraulic gradient in radial and vertical directions, and the pore fluid occurs radial and vertical diffusions from high pore water pressure to low. A similar phenomenon has been described in the field trial reported by Roy et al. [6,33].

3.2. Parametric Studies of Consolidation Effect

Taking a final jacking depth zp = 7.8 as an example, the time histories of EPWP at a distance of 0.2 m from the pile wall are obtained to investigate the influence of ks, cu, E, and OCR on EPWP generation during pile jacking and subsequent soil consolidation effect after pile installation. A small distance from the pile wall is selected to avoid the influence of radial diffusion of pore fluid. The following investigations refer to the model shown in Figure 4, except that the model parameters are replaced by those of the third layer soil from Table 2 because the final jacking depth of the pile is located in this layer. Note that the effect of each parameter is investigated separately, and all the other parameters are kept constant when the effect of one parameter is investigated.

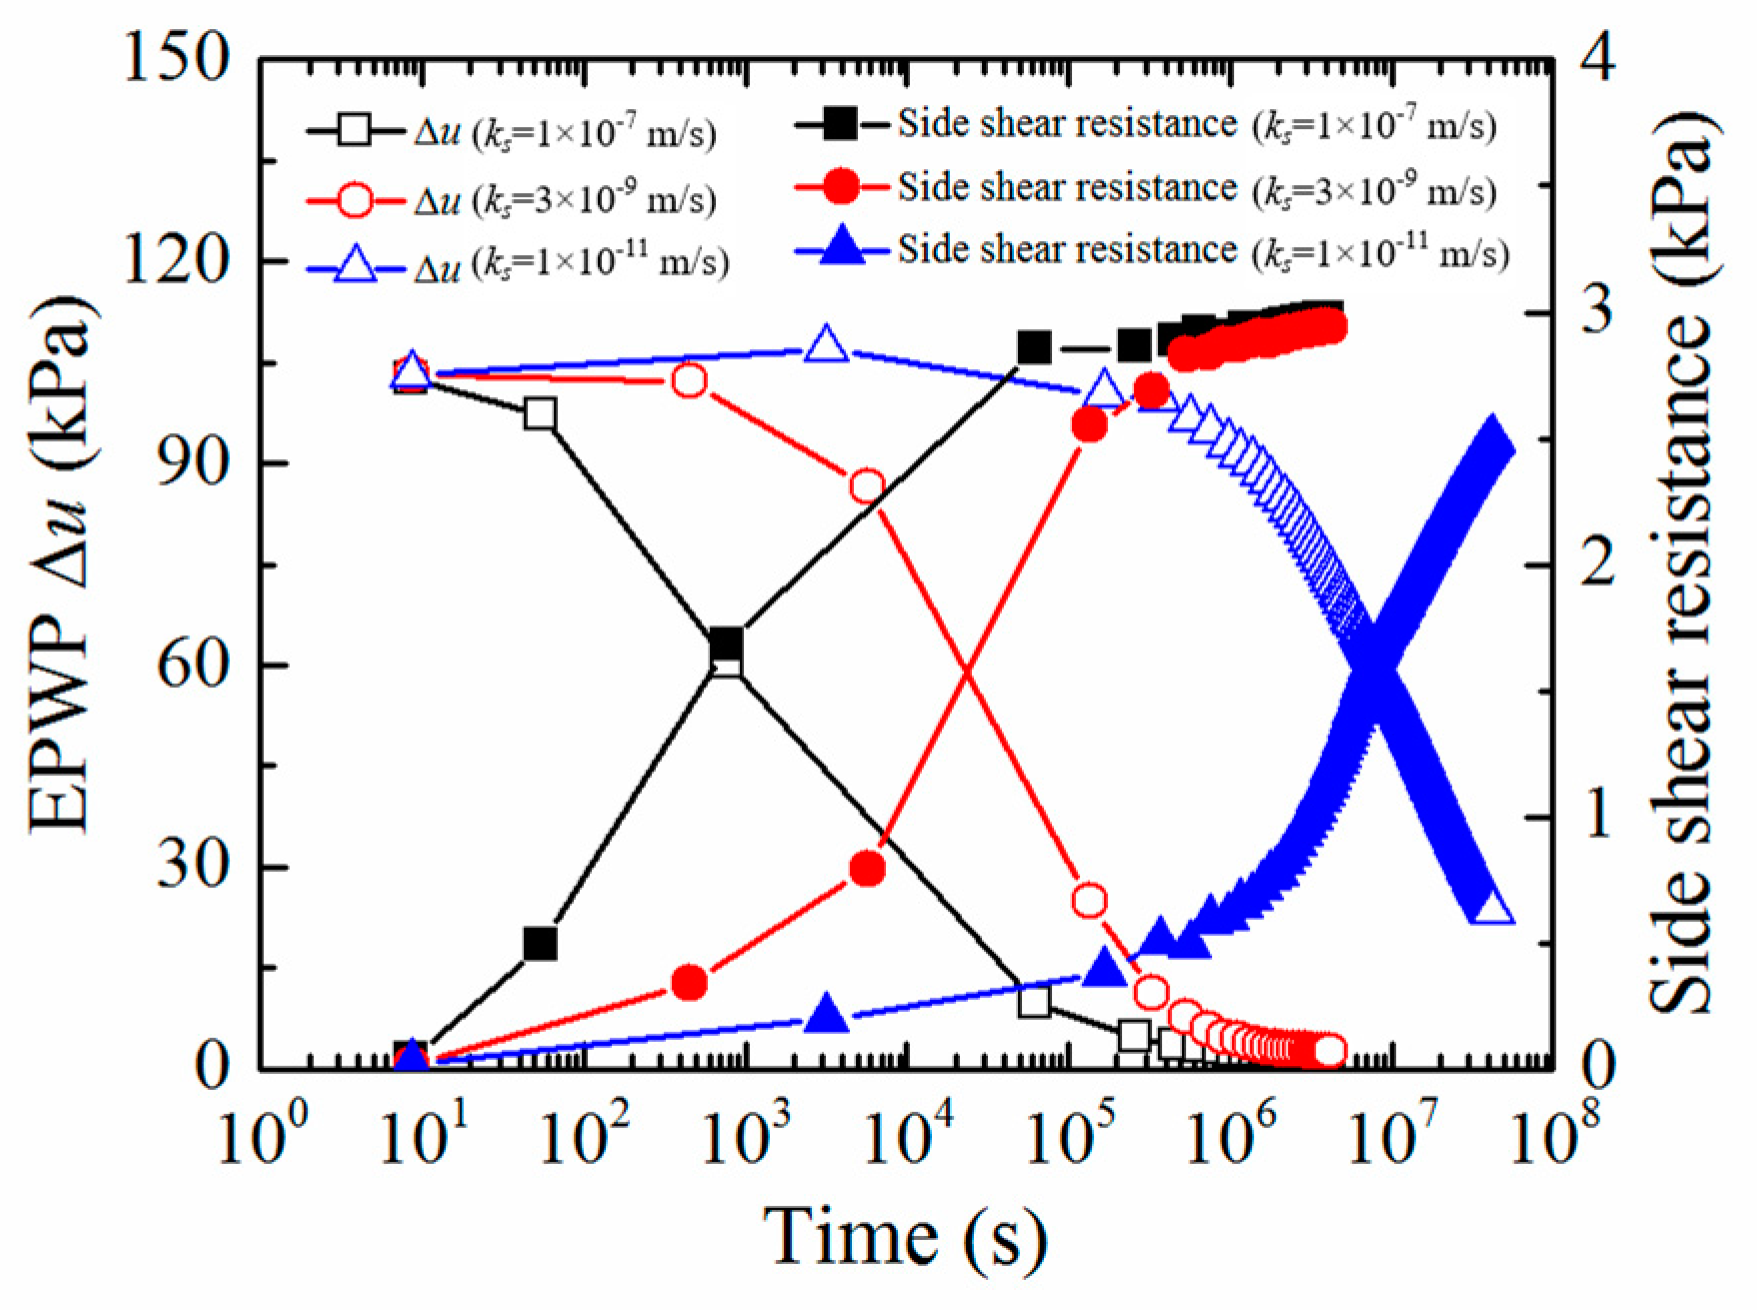
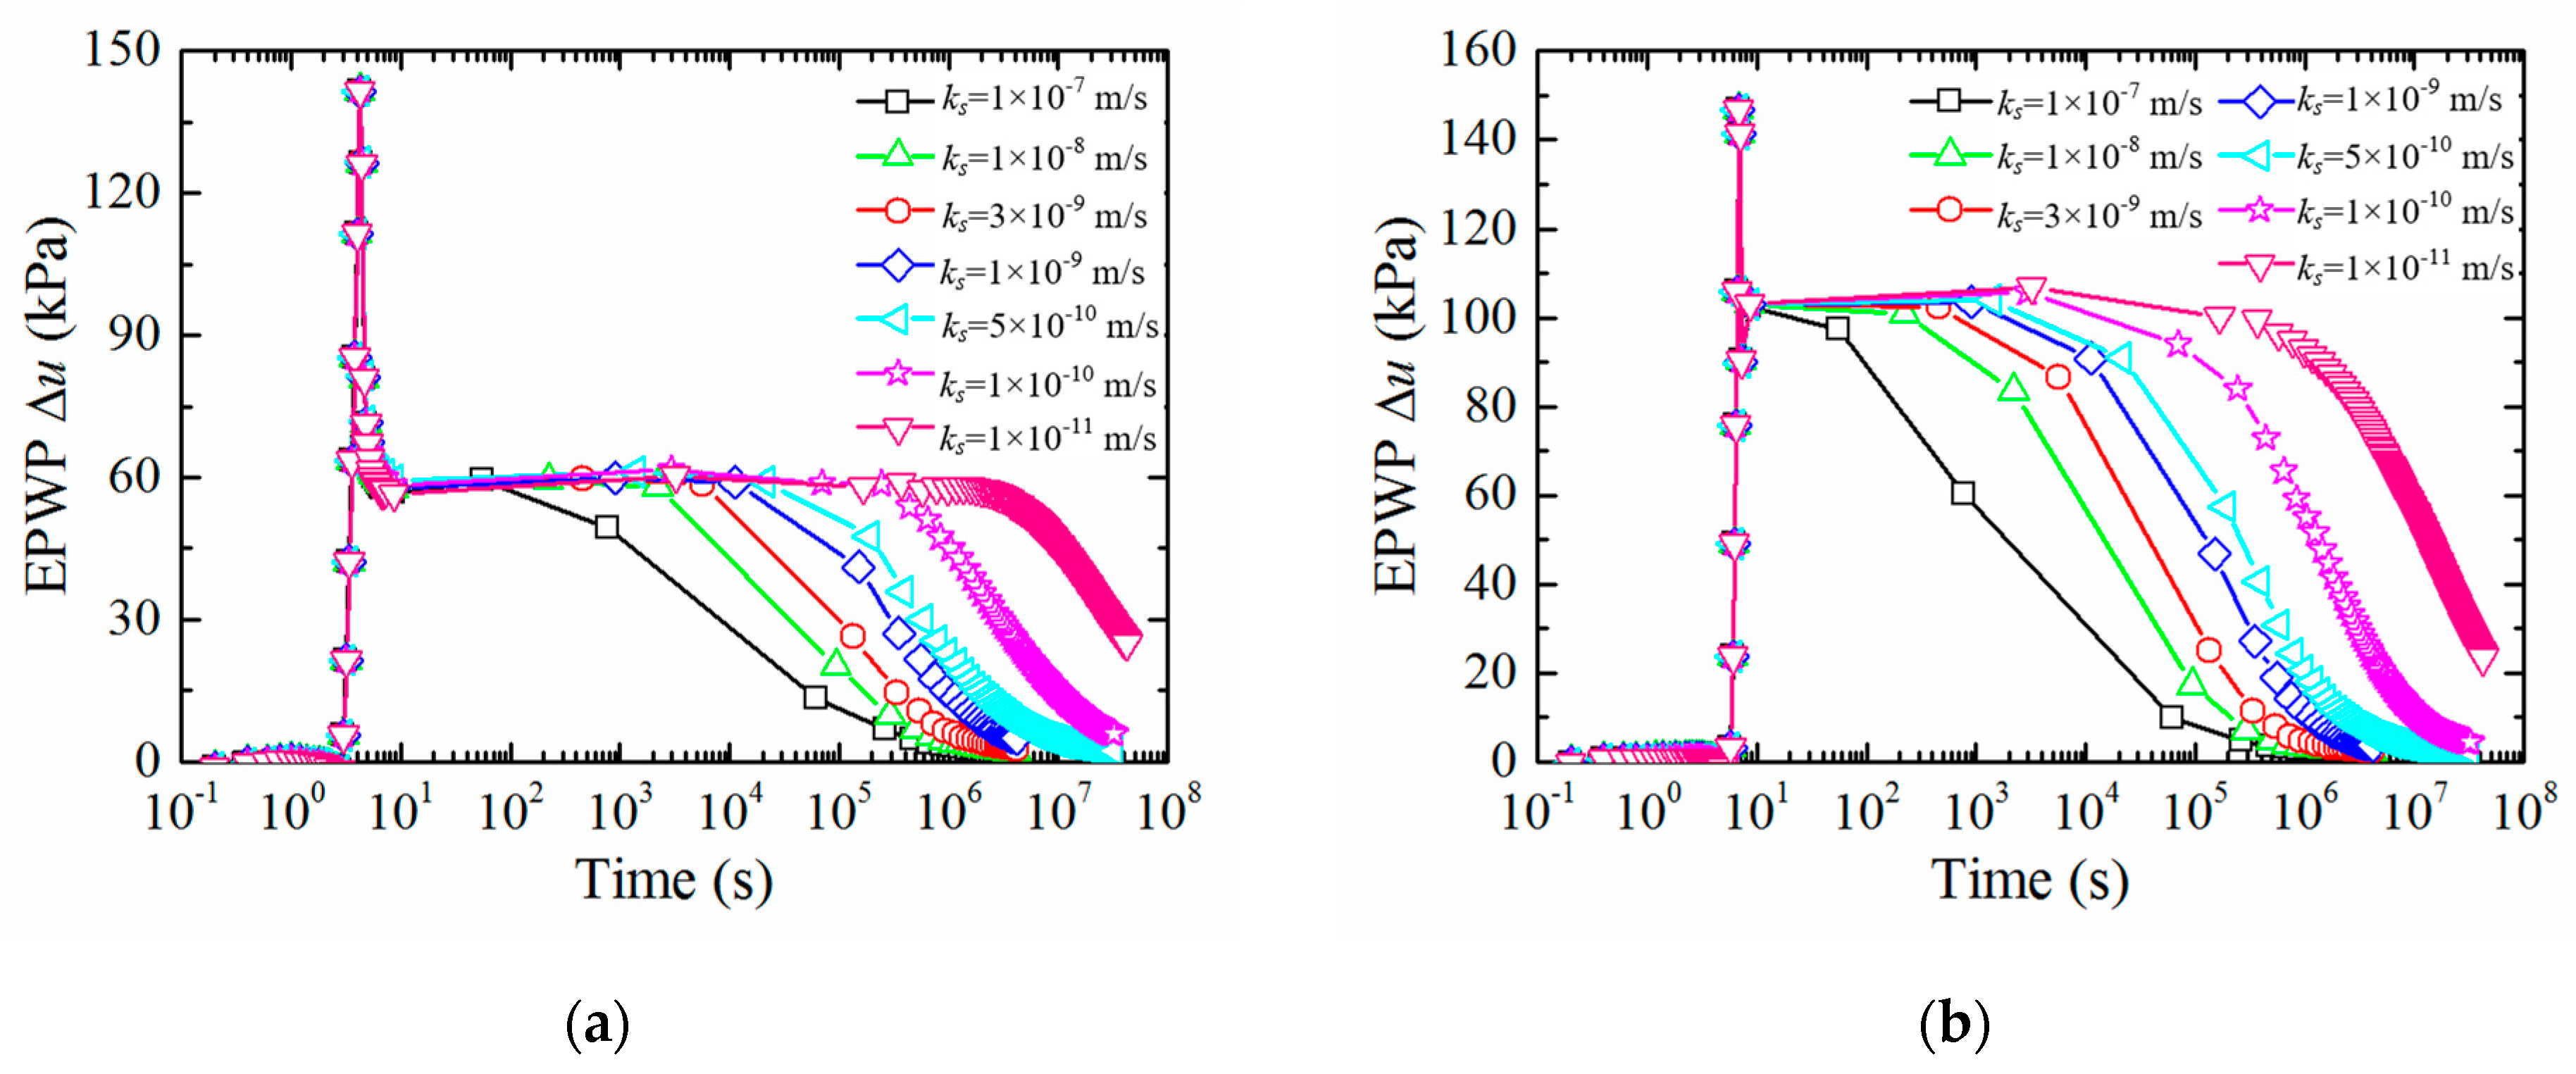
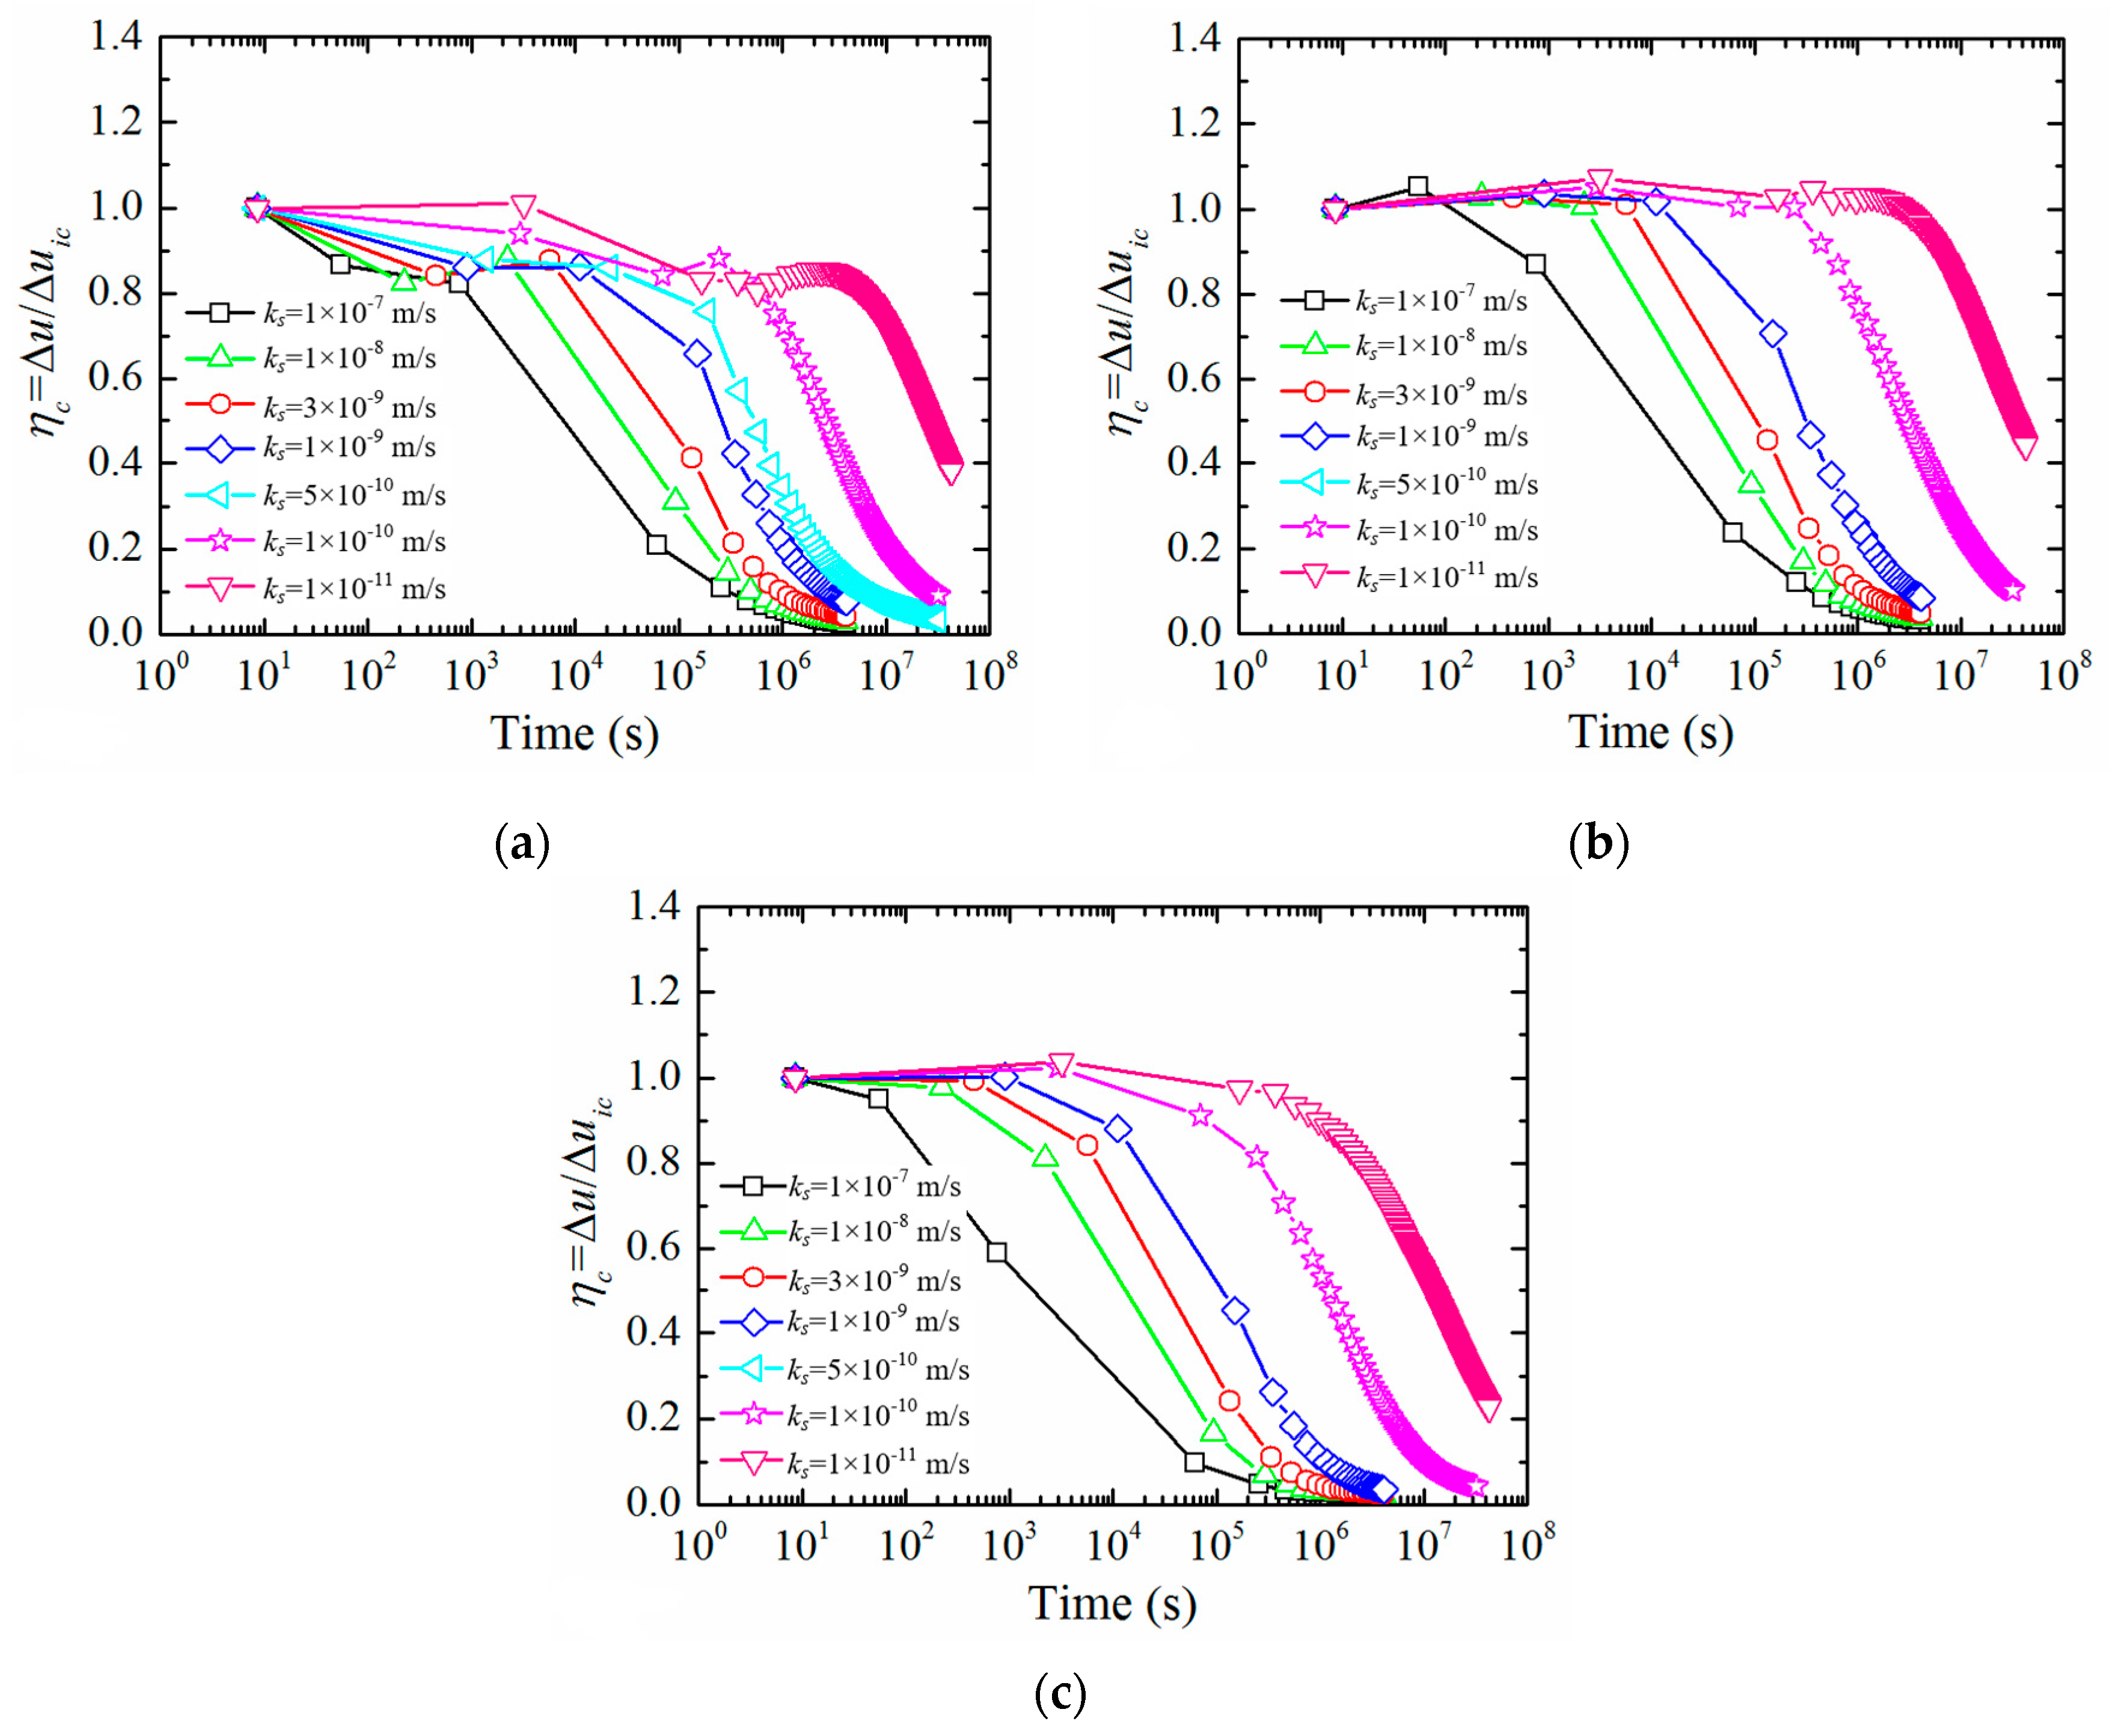
3.2.1. Effect of Soil Permeability Coefficient ks

Investigating the effect of soil permeability coefficient ks, modeling the entire process of steel-pipe pile jacking is performed with ks ranging from 1 × 10⁻⁷ to 1 × 10⁻¹¹ m/s.
Figure 10 shows time histories of EPWP with different permeability coefficients at different depths. During pile jacking, ks has no obvious influence on the EPWP; the dissipation rate increases with ks after the end of pile jacking, but the duration of EPWP dissipation is the opposite.
Figure 11 shows the normalized EPWP dissipation (Δuuic) after pile installation with different permeability coefficients at different depths. The dissipation rate of EPWP is positively correlated with ks, while the duration of consolidation after installation is just the opposite. A suggestion is that the static load test should be carried out after a period of time to avoid low effective stresses after pile jacking in soil with small permeability. Figure 11a shows that the normalized EPWP of shallow soil increases initially before starting to secondly dissipate, and the time when EPWP begins to increase after the first dissipation is negatively correlated to ks. Comparison of Figure 11a,c shows that the dissipation rate increases and the duration of consolidation increases with depth, which demonstrates again that the consolidation occurs as a vertical diffusion of pore fluid.

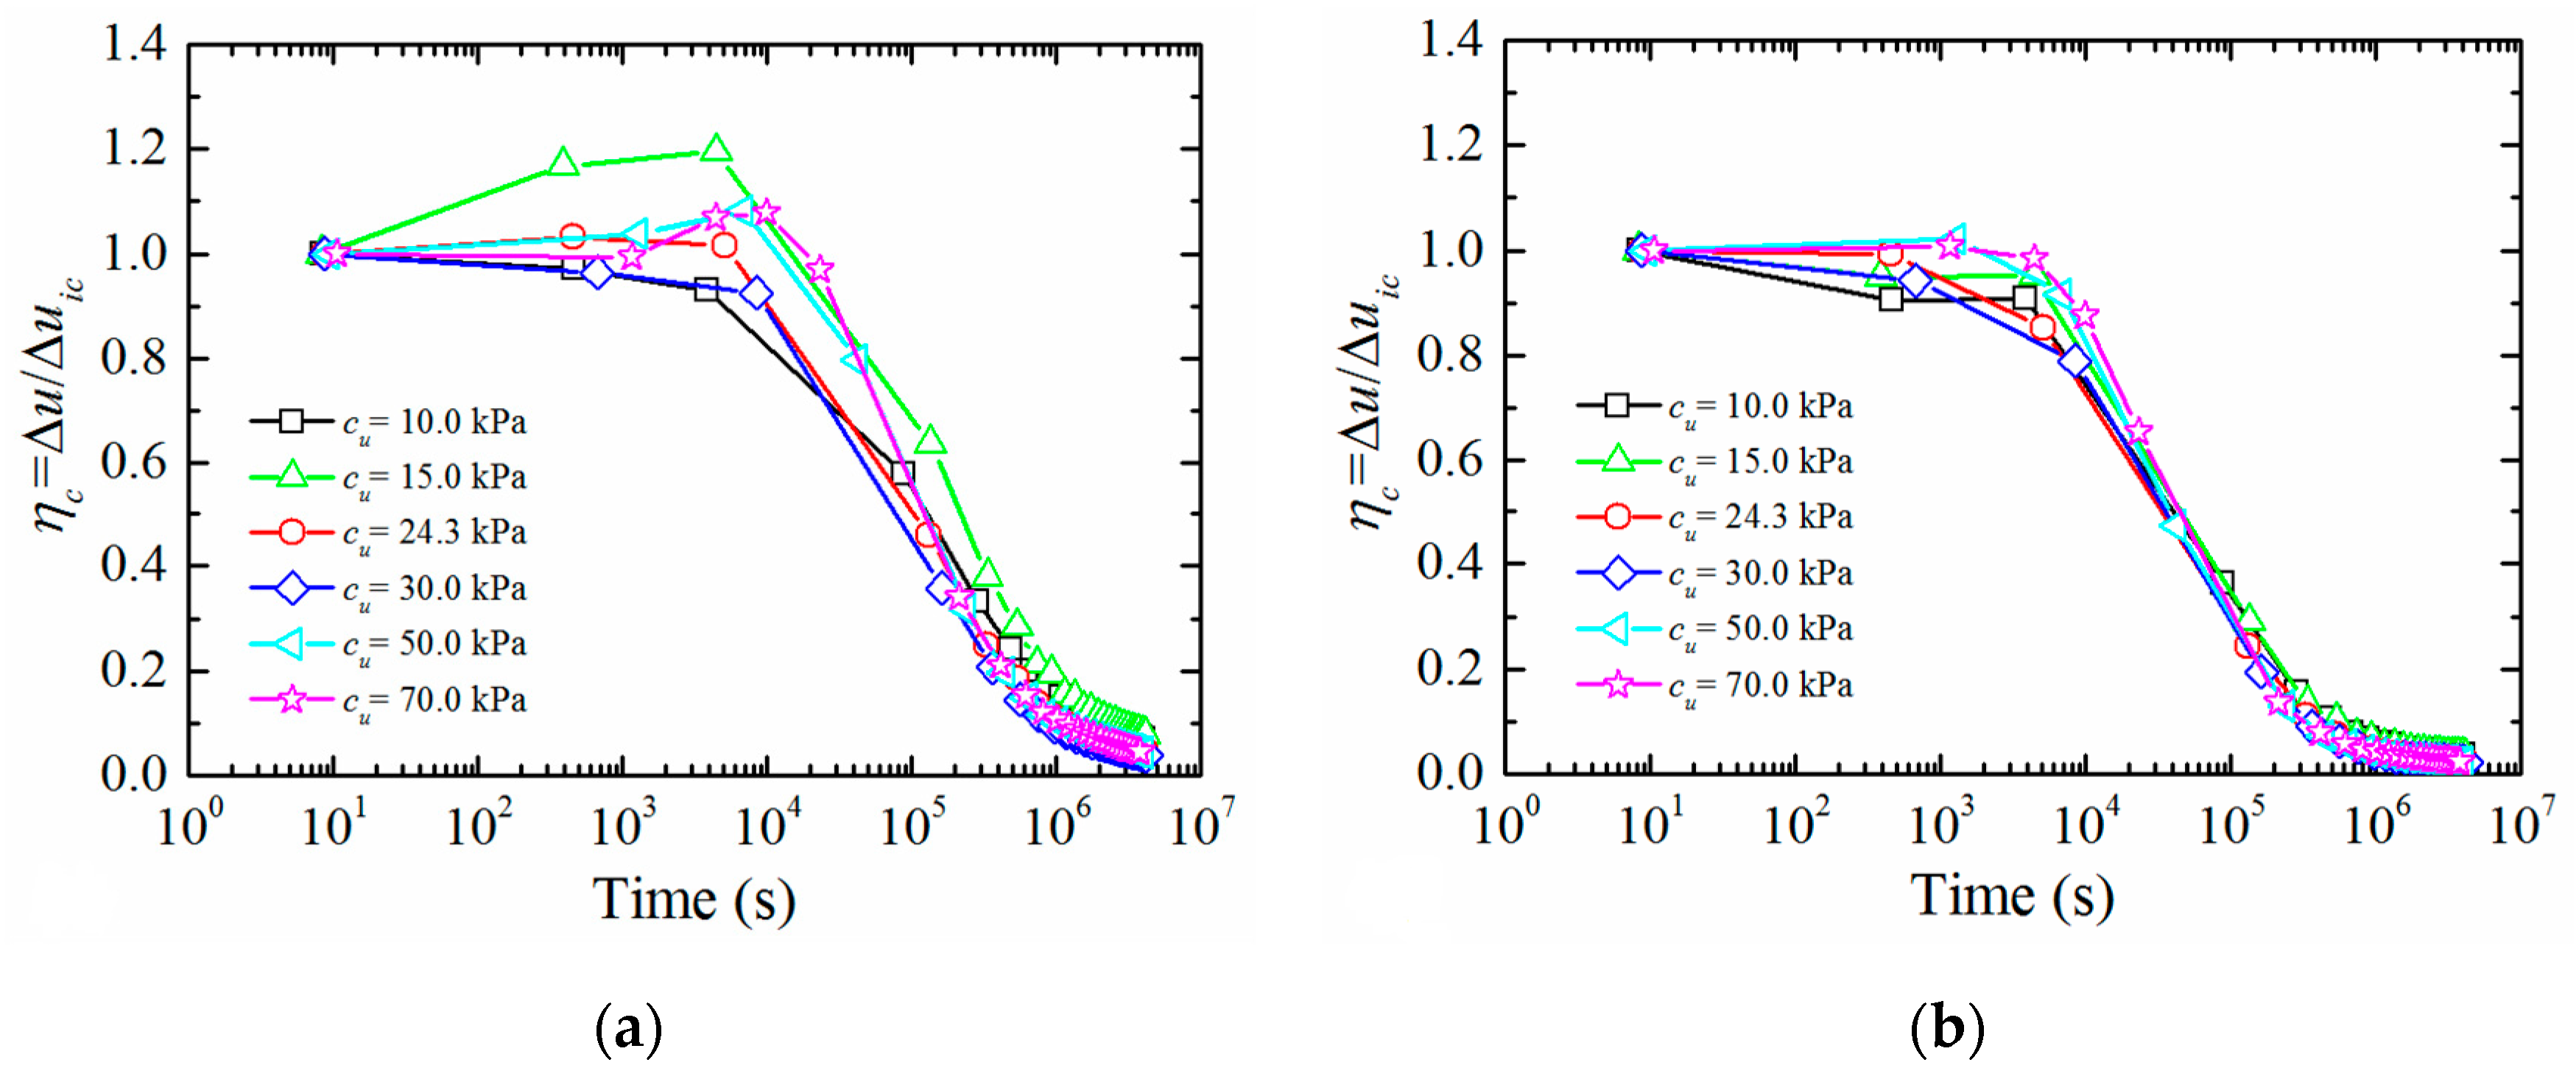
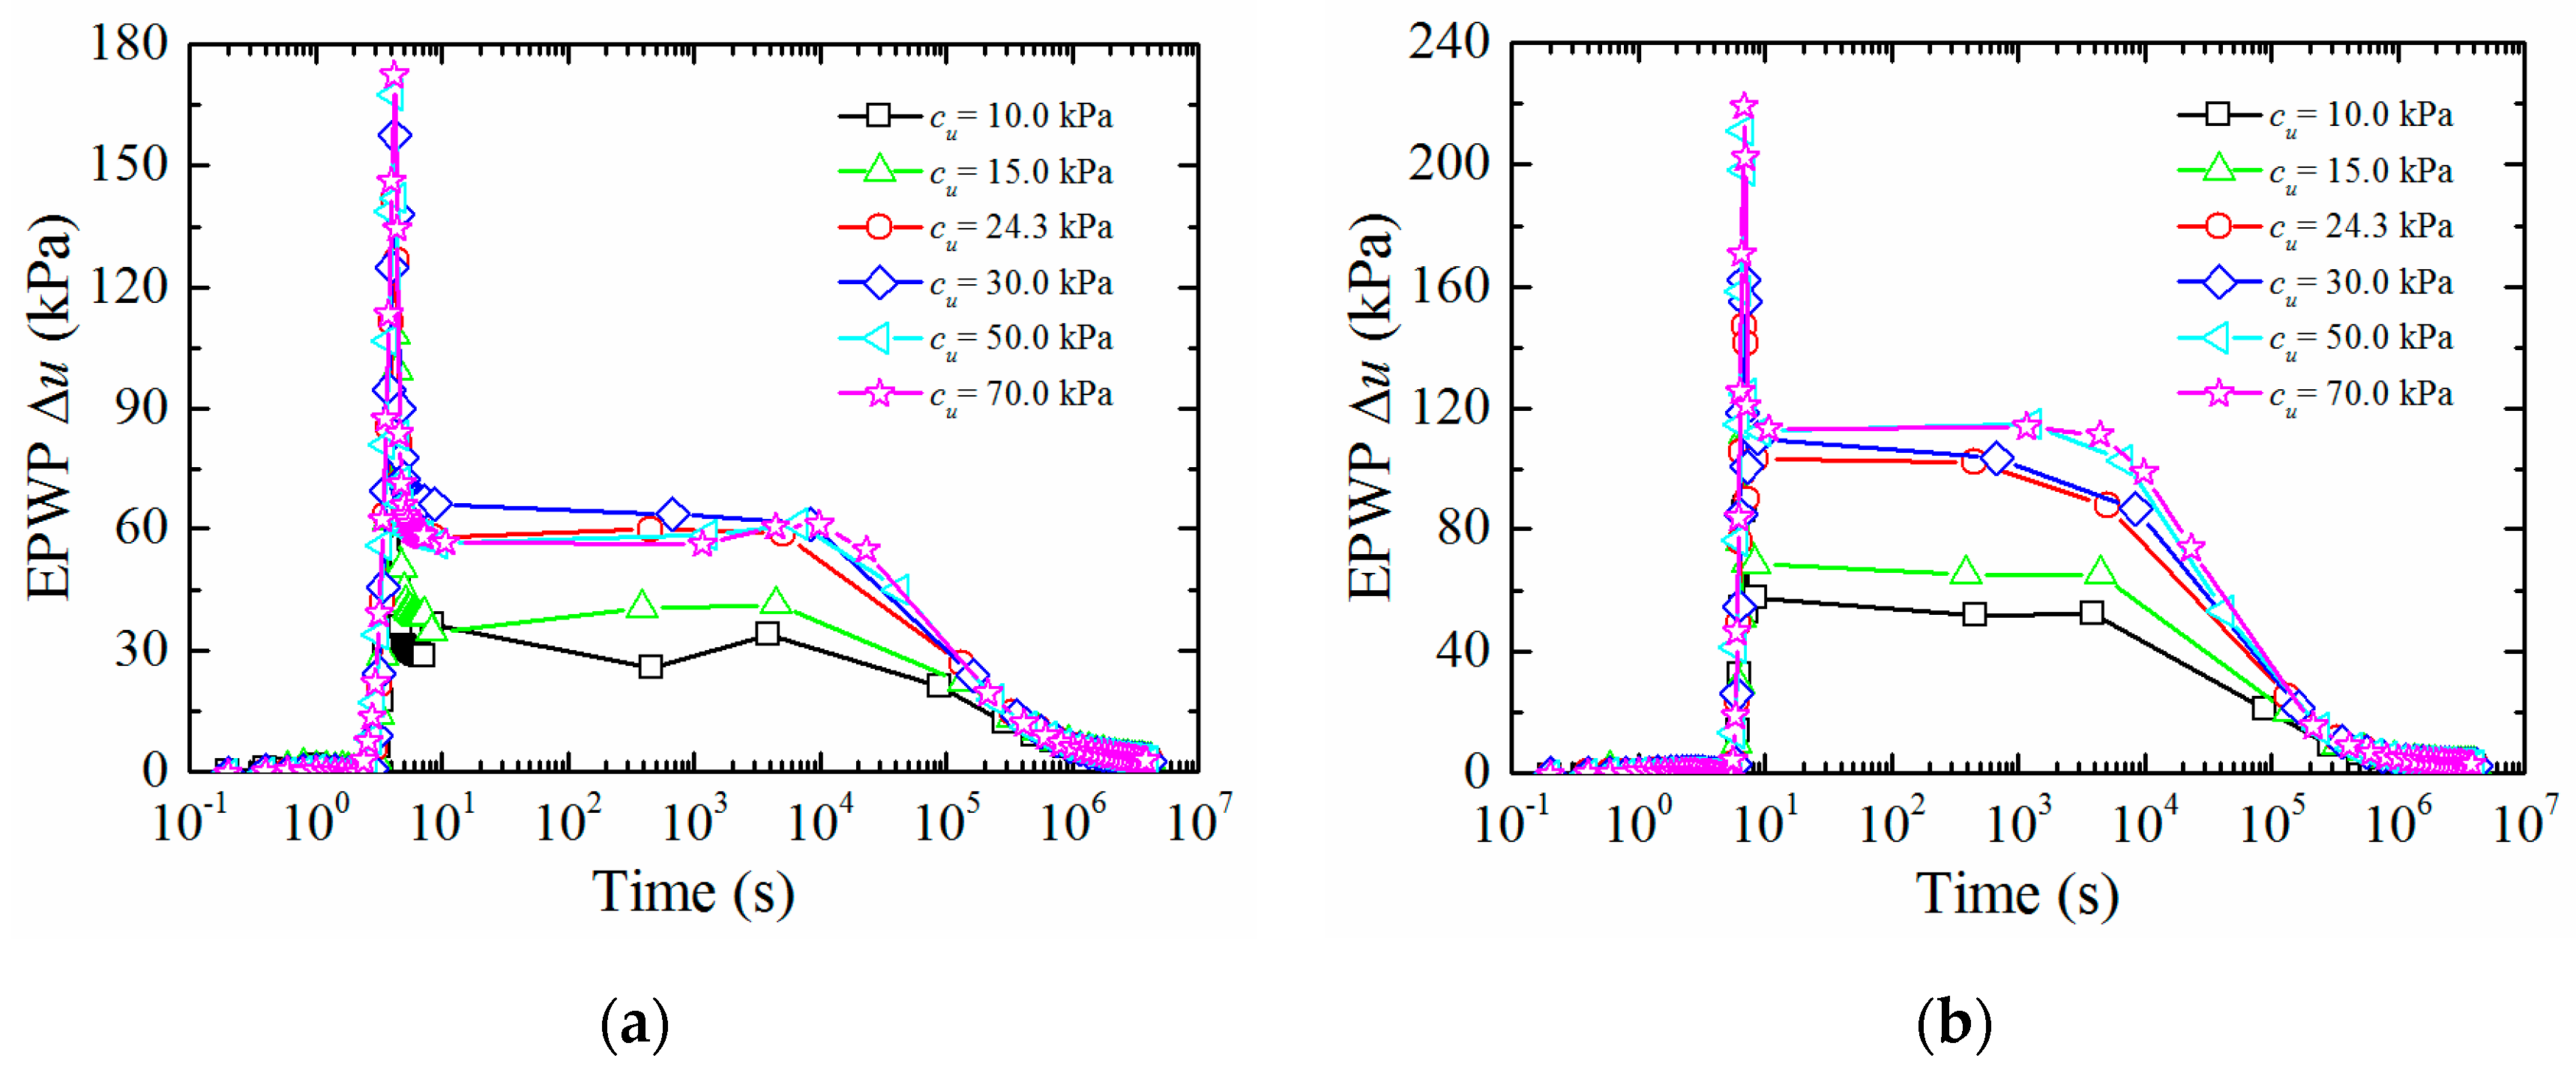
3.2.2. Effect of Soil Undrained Shear Strength cu

The solution of EPWP based on the cavity expansion theory uses the undrained soil shear strength cu to normalize the maximum EPWP, and the extent of the plastic zone is dependent on rigidity ratio Ir (Ir = E/cu) [46,47]. To investigate the effect of cu, modeling the entire process of steel-pipe pile jacking is performed with cu ranging from 10.0 to 70.0 kPa.
Figure 12 shows time histories of EPWP with various undrained shear strengths at different depths. The EPWPs both during and after pile jacking show positive correlation to cu. Further, the EPWP is sensitive to the smaller value of cu.
The dissipation of normalized EPWP (Δuuic) after pile installation with various undrained shear strengths at different depths are depicted in Figure 13, in which the influence of cu on Δu at the end of pile jacking has been eliminated by Δuuic. Variations in dissipation rate of EPWP after installation are independent from cu, the scatter of EPWP dissipation curves of shallow soil at the early consolidation phase is mainly due to the vertical diffusion of pore fluid.

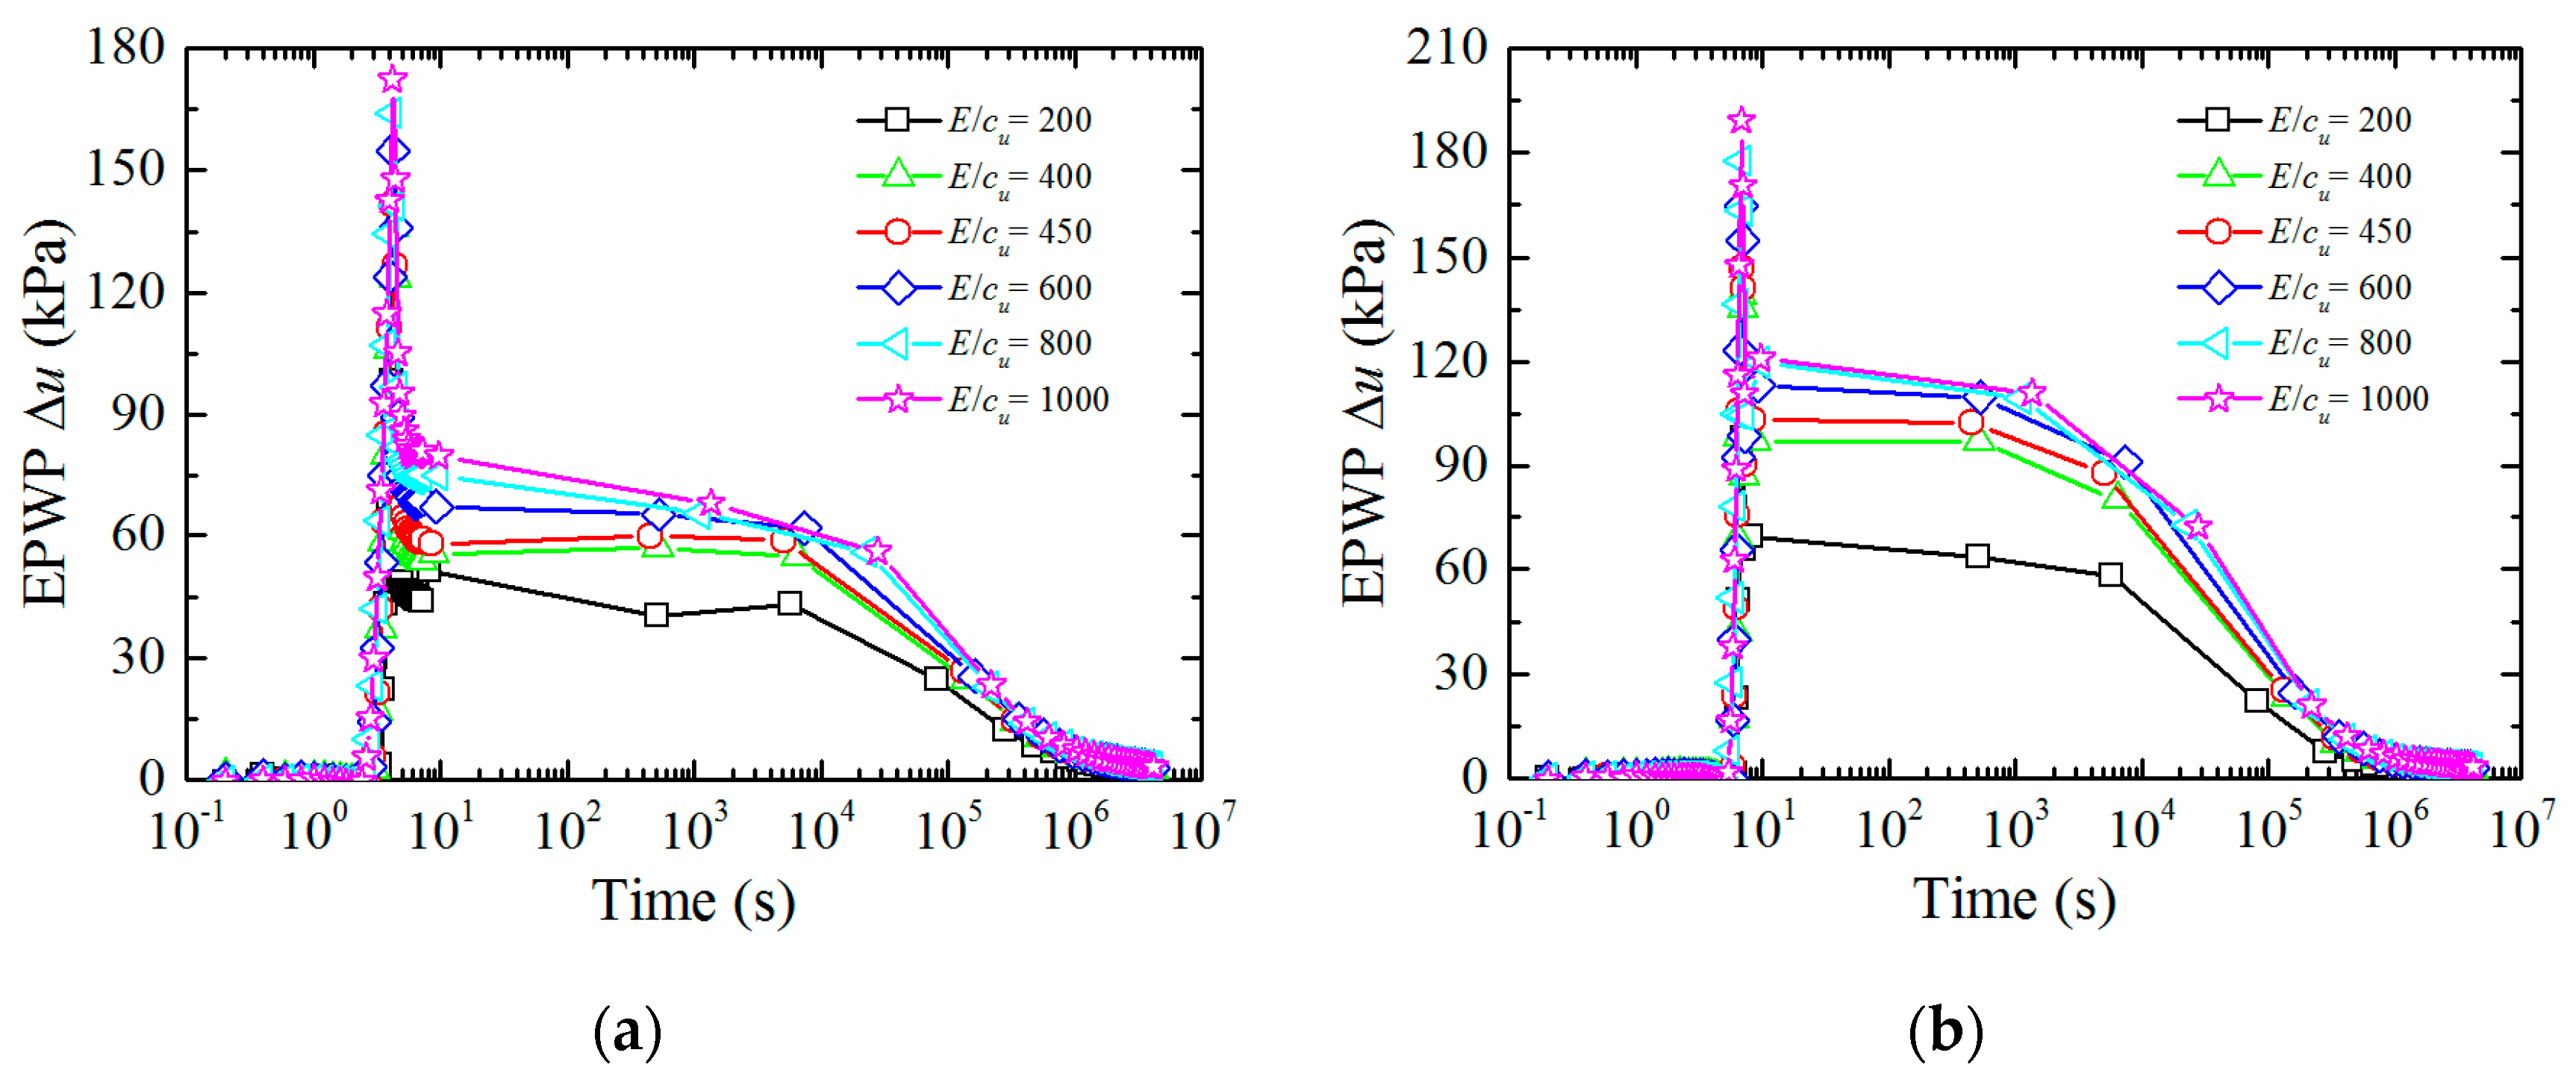
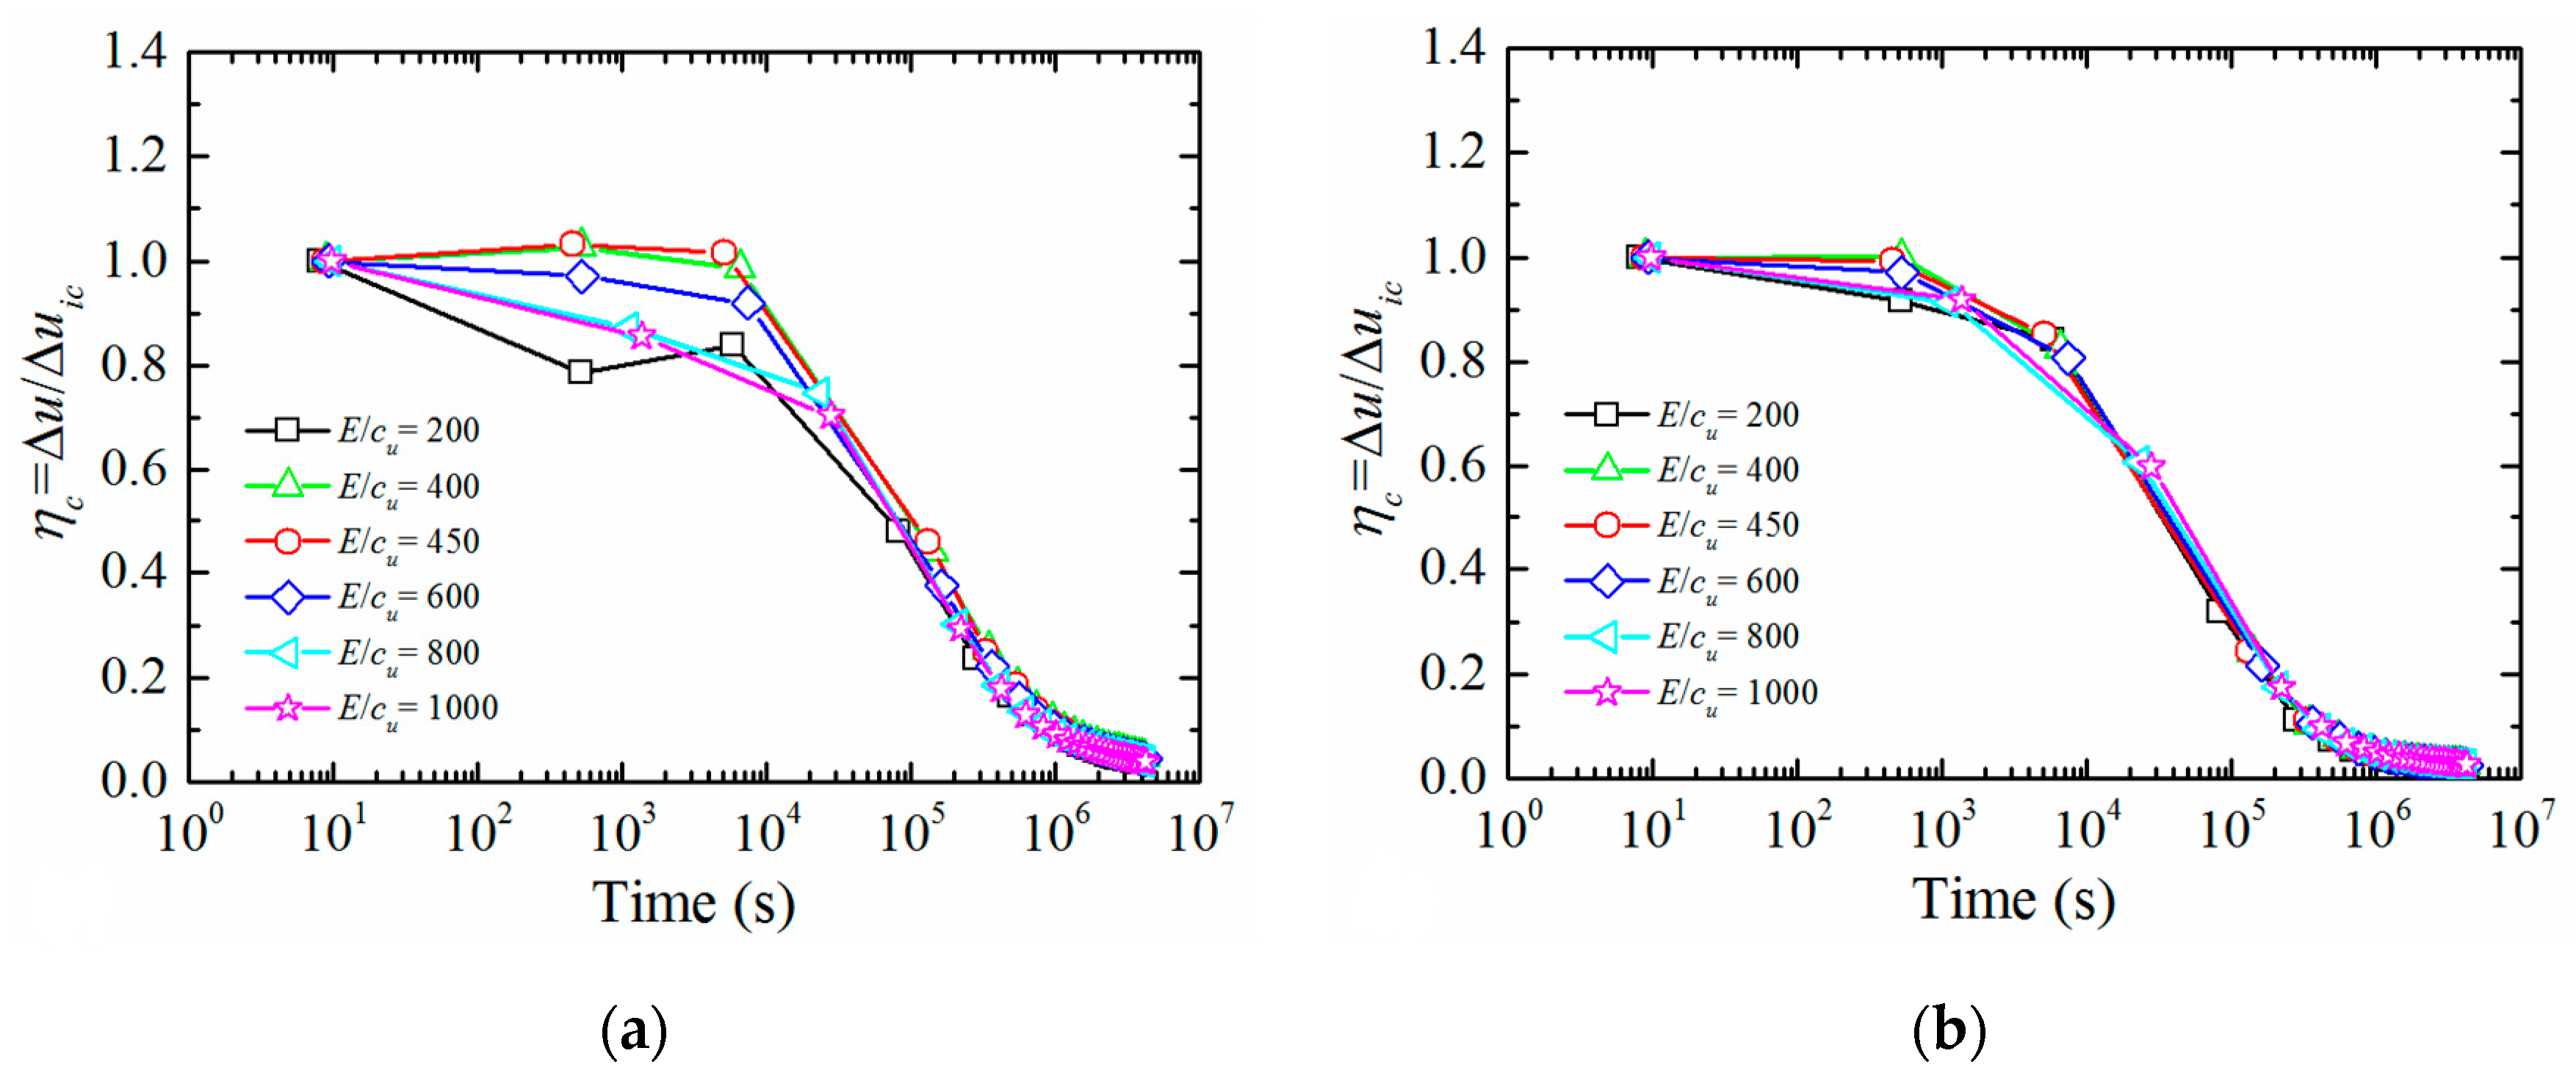
3.2.3. Effect of Soil Elastic Modulus E

The extent of the plastic zone is dependence on rigidity ratio Ir (Ir = E/cu), to investigate the effect of soil elastic modulus E, modeling the entire process of steel-pipe pile jacking is performed with E/cu ranging from 200 to 1000, and cu is set as 24.3 kPa.
Time histories of EPWP with various soil elastic moduli at different depths are depicted in Figure 14. The EPWP both during and after pile jacking are positively correlated to E. Figure 15 shows the dissipation of normalized EPWP (Δuuic) after installation with different soil elastic moduli. The influence of E on Δu at the end of pile jacking has been eliminated by Δuuic. Variations in dissipation rate of EPWP after installation are independent from E, the scatter of EPWP dissipation curves of shallow soil at the early consolidation phase is mainly due to the vertical diffusion of pore fluid.

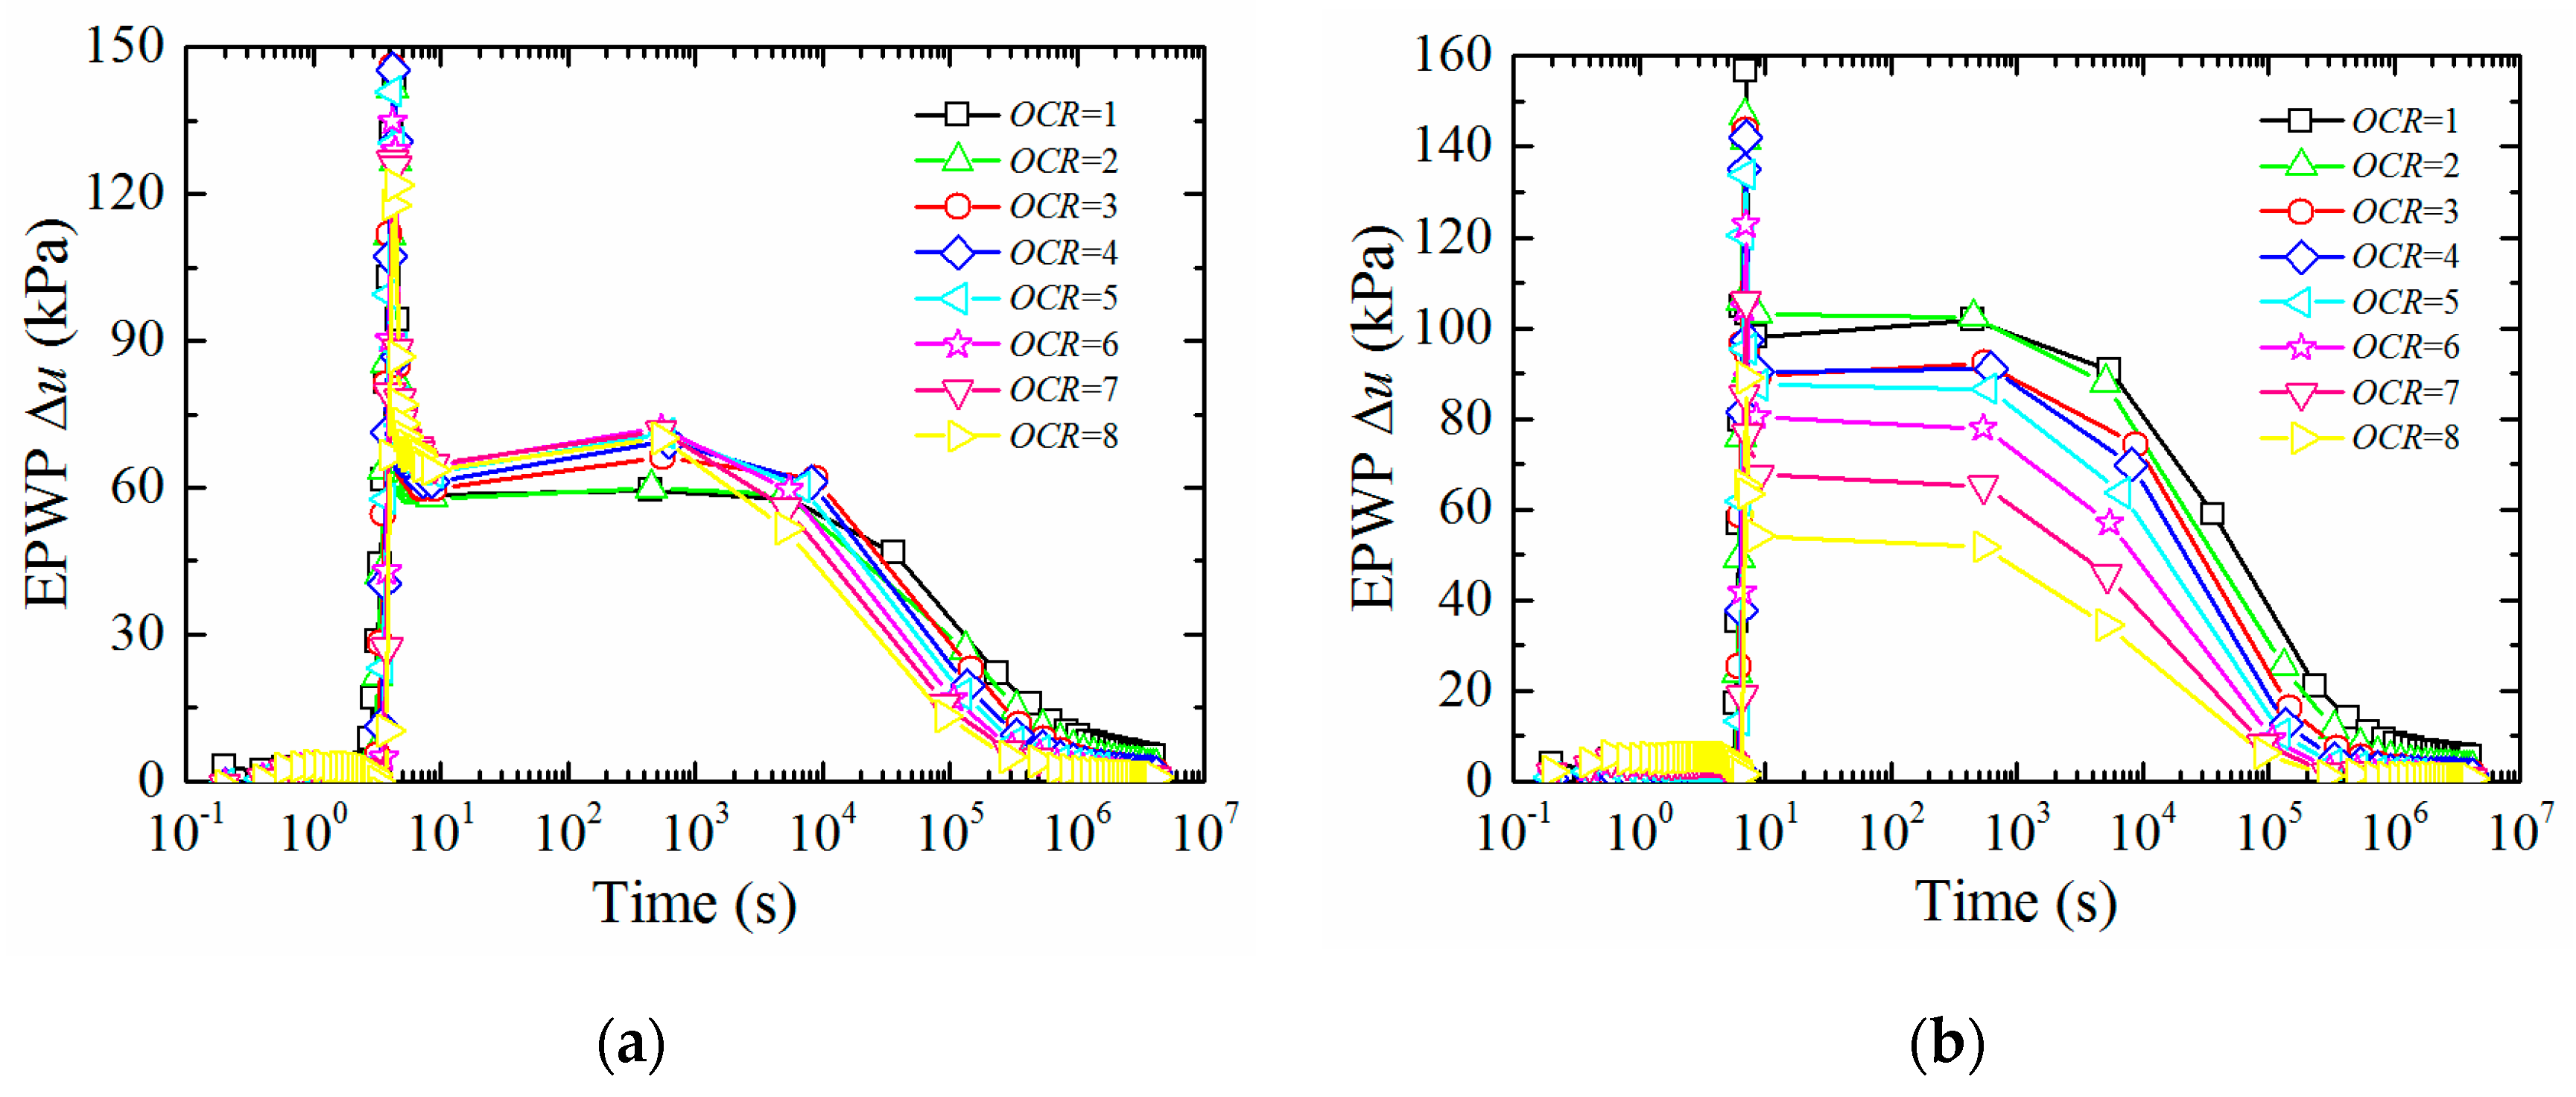
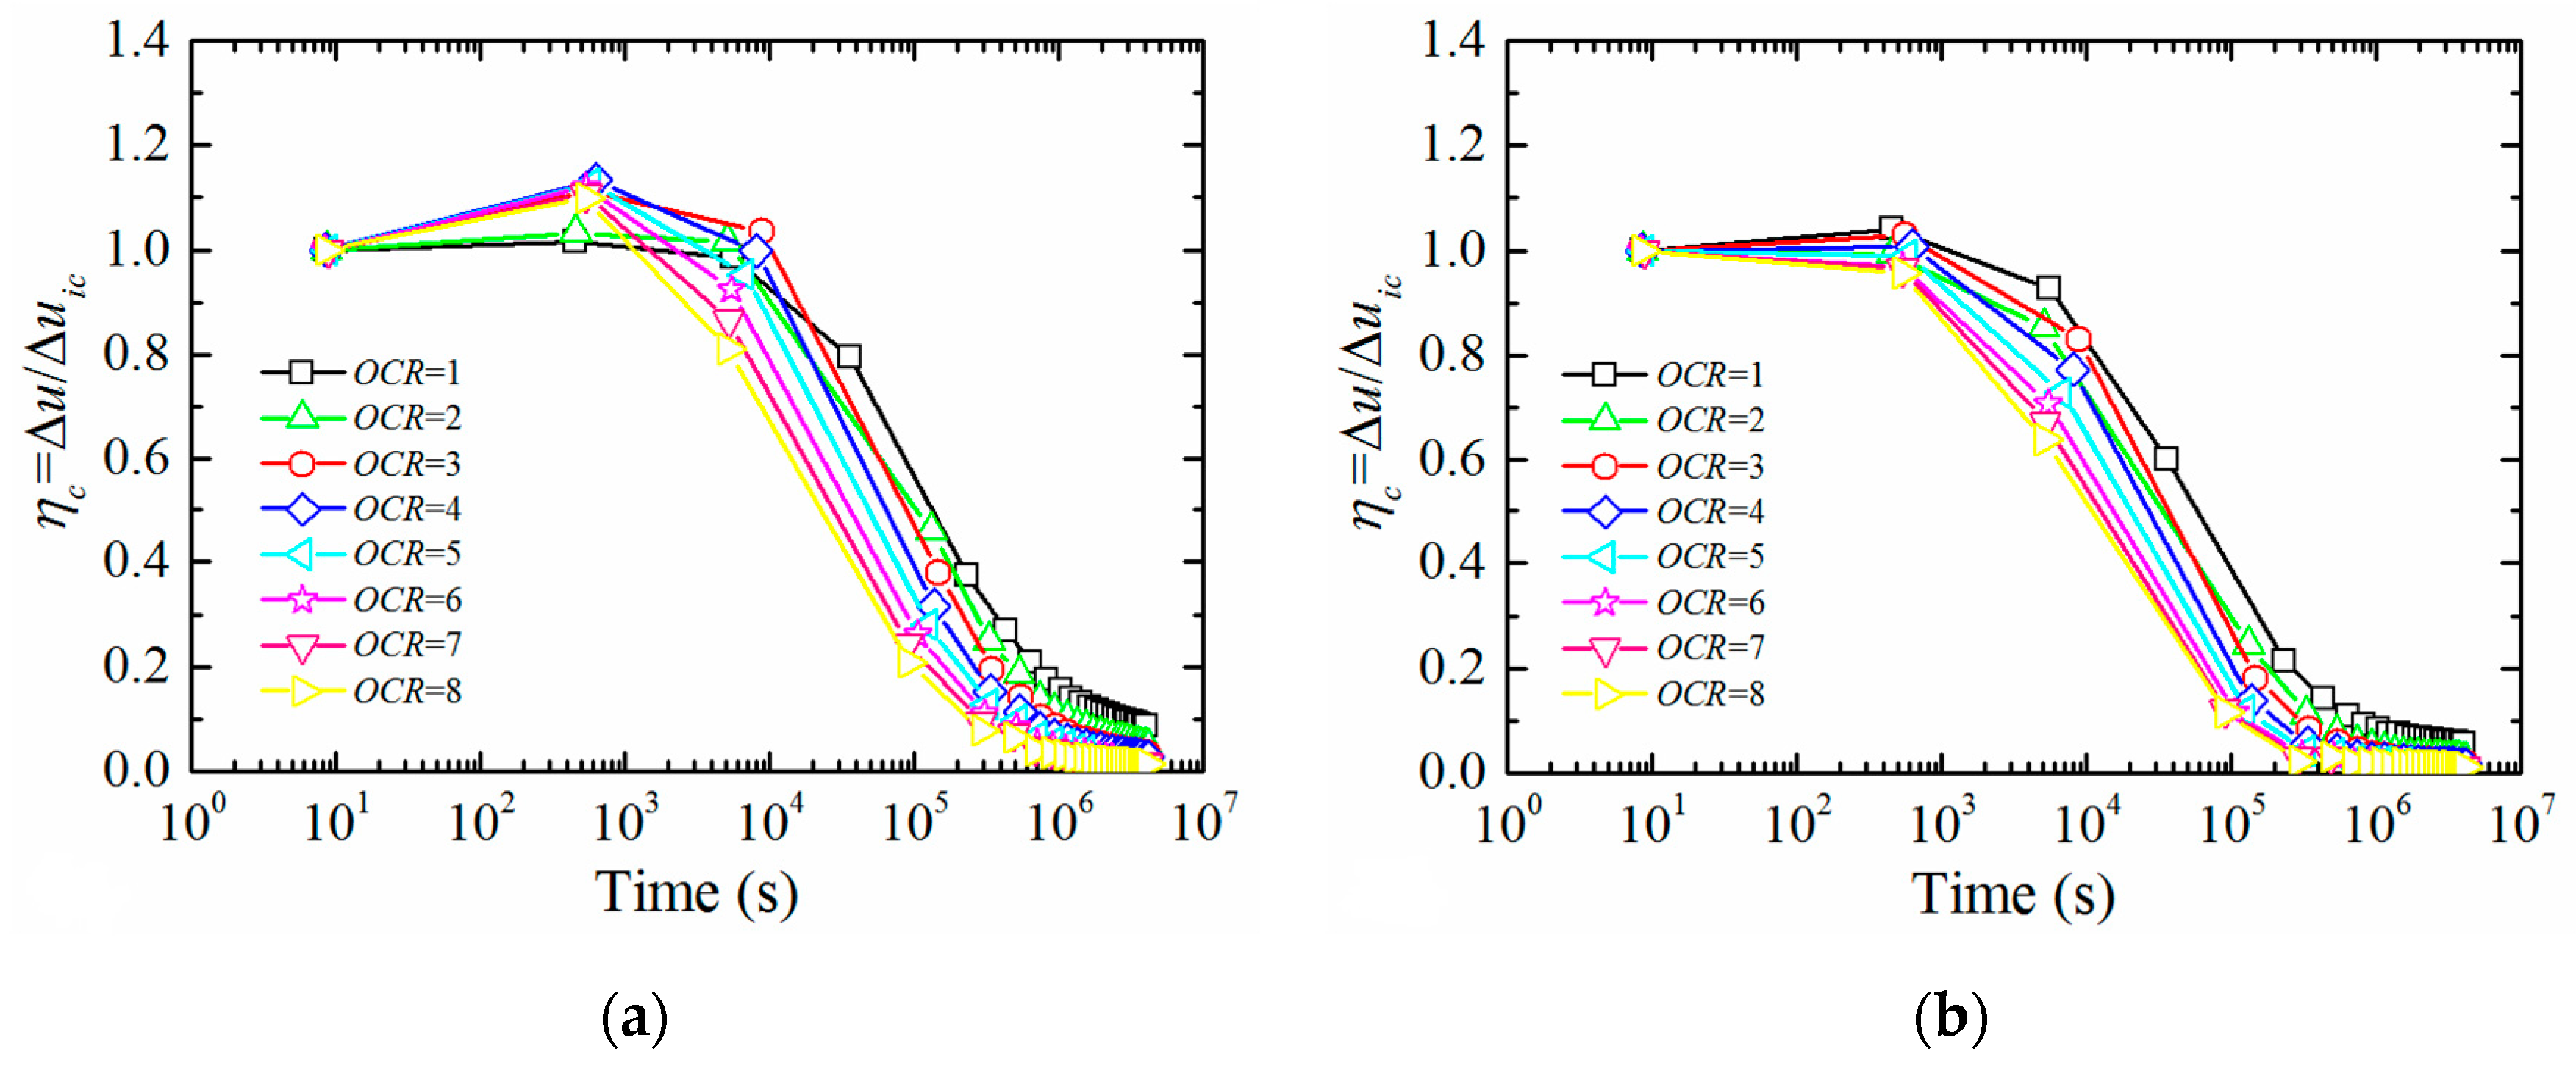
3.2.4. Effect of Soil Overconsolidation Ratio OCR

The coefficient of earth pressure K0 is interdependent with soil overconsolidation ratio OCR [15] and can be expressed by K 0 = K 0 n c O C R , where K 0 n c is the coefficient of earth pressure of normally consolidated soil [18]. Besides, the cap model parameter X0 can be defined by X0 = OCR·σz [37]. To investigate the effect of OCR, modeling the entire process of steel-pipe pile jacking is performed with OCR ranging from 1 to 8.
Time histories of EPWP with various OCRs at different depths are depicted in Figure 16. The EPWP both during and after pile jacking show negative correlations to OCR. Figure 17 shows the dissipation of normalized EPWP (Δuuic) after installation with various OCRs, in which the influence of OCR on Δu at the end of pile jacking has been eliminated by Δuuic. The increase of OCR contributes to the dissipation of EPWP and decreasing the duration of consolidation after installation. A suggestion is that the static load test should be carried out after a period of time to avoid low effective stresses after pile jacking in soil with low OCR.

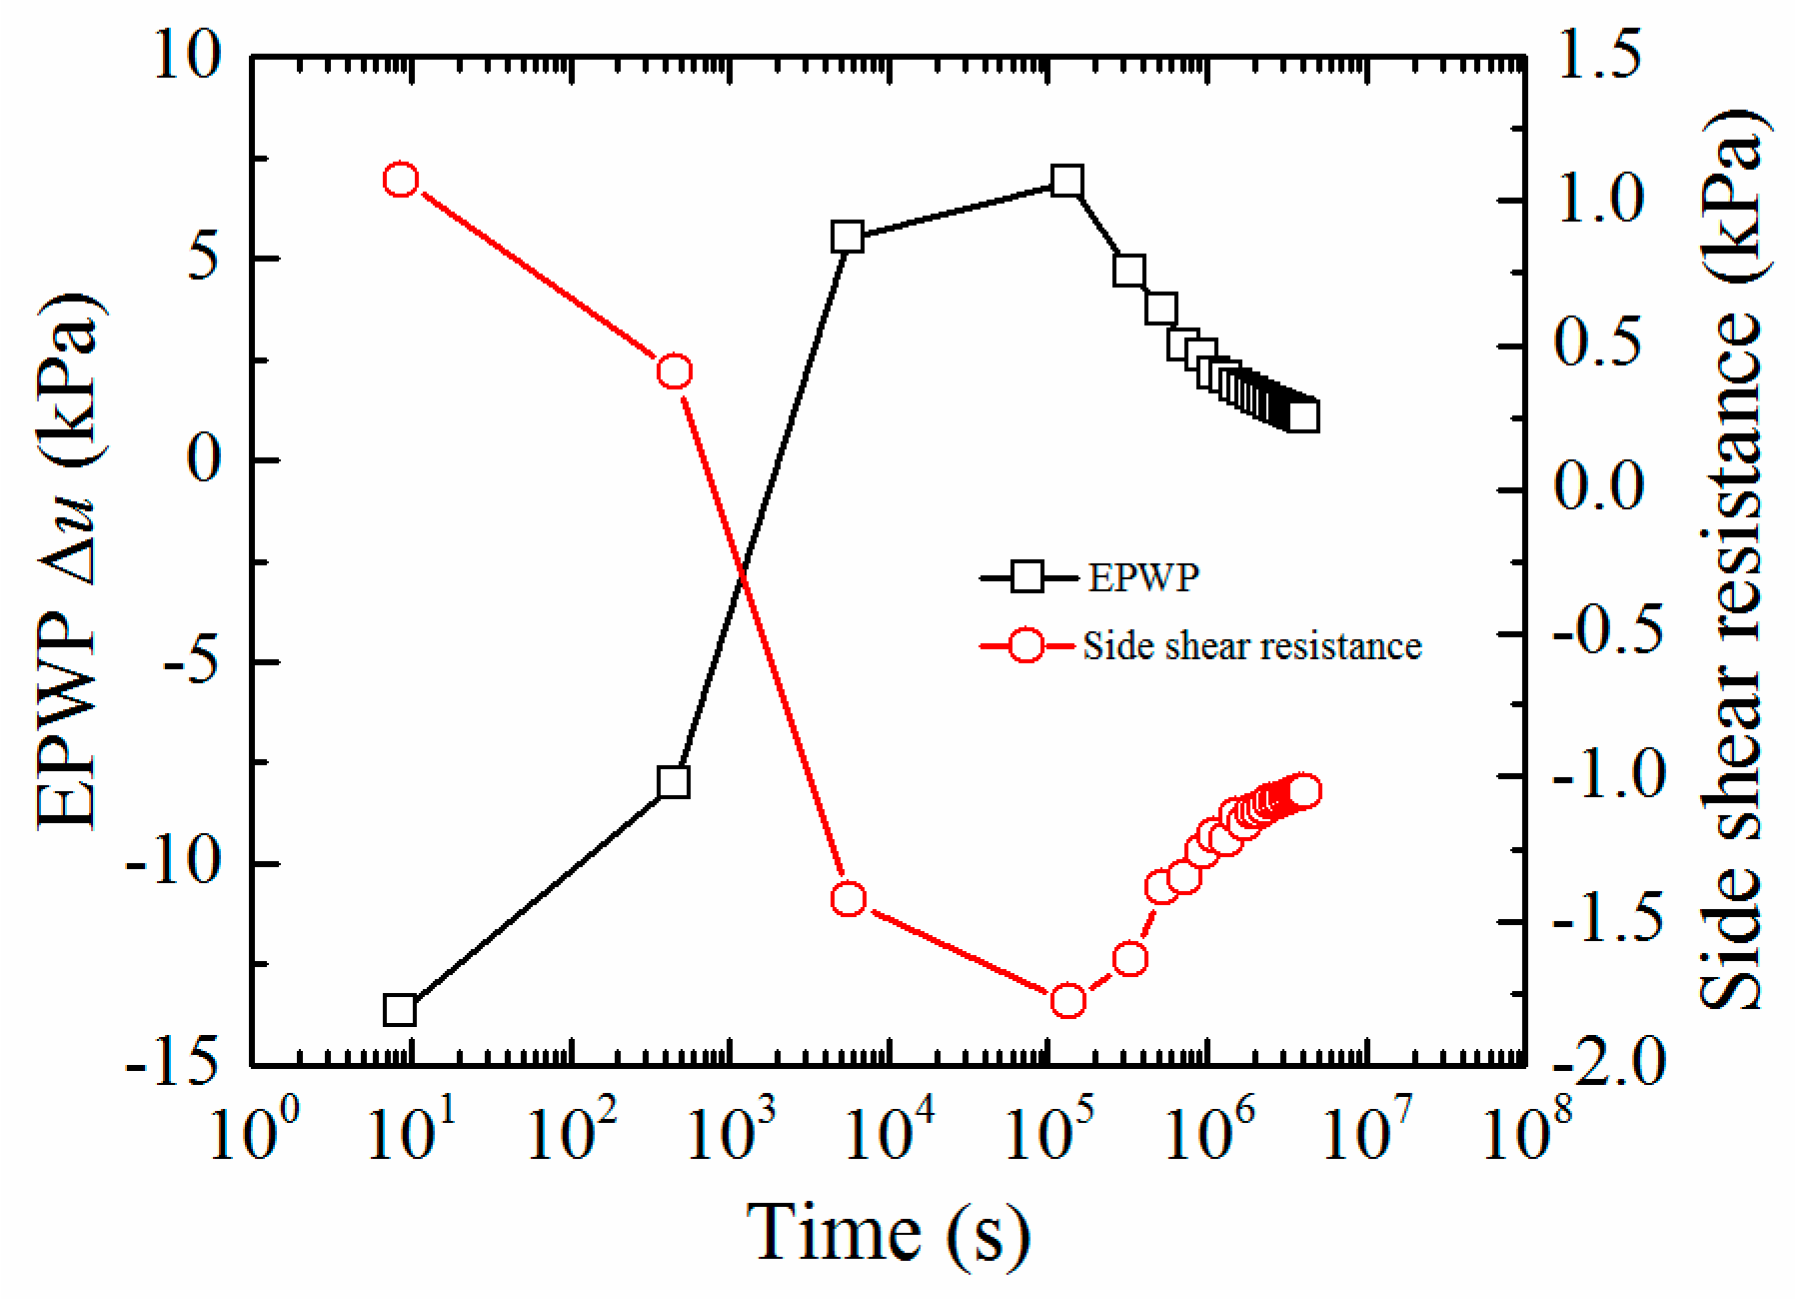
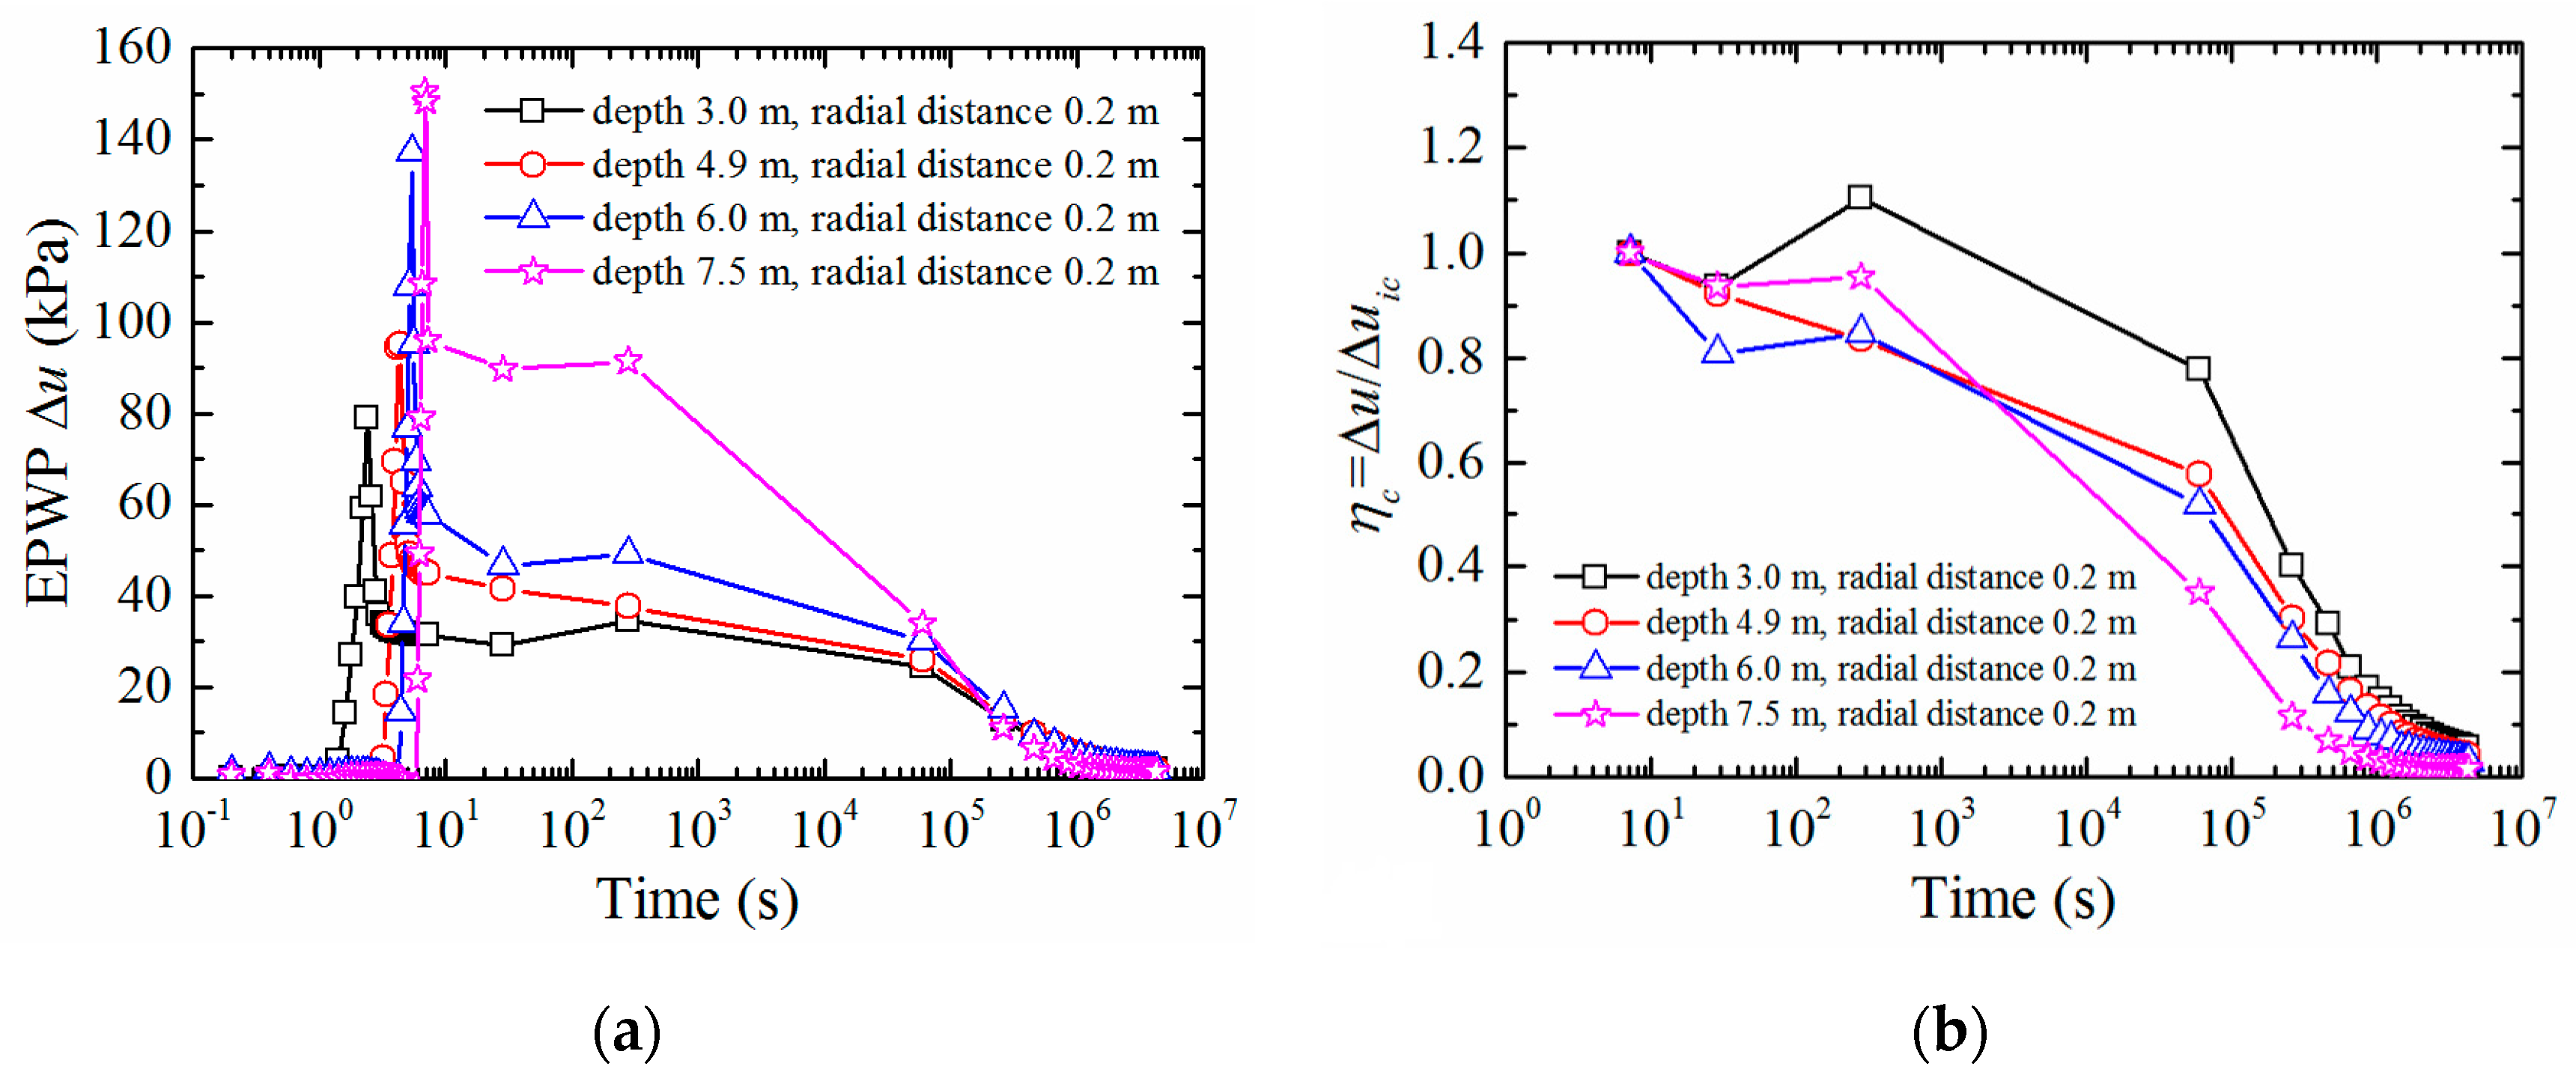
3.3. Time-Dependent Analysis of Pile Set-Up Based on Consolidation Effect

In uncemented soil, Coulomb friction contact law holds for the pile–soil interface, so the effective stress β-approach is adopted, the local unit shaft resistance is defined by:
τ f = σ h i tan δ = K 0 σ v i tan δ = β f σ v i
where
  • τf is the local unit shaft resistance,
  • δ is the friction angle of the pile–soil interface,
  • σ v i , σ h i are the vertical and horizontal effective stress acting on the pile, respectively,
  • βf is expressed by β f = K 0 tan δ .
Taking zp = 7.8 m as an example, time histories of EPWP and total stress increment at depth of 7.5 m at a distance of 0.2 m from the pile wall are depicted in Figure 18. During pile jacking, the total stress and EPWP increase simultaneously, and the total stress increment is generally less than EPWP, thus temporarily reducing the effective stress and hence shear strength of the surrounding soil [48]. Water starts to drain away under a relatively high gradient after pile installation (see Figure 6), the dissipation of positive EPWP increases the horizontal effective stress, and the dissipation of negative EPWP is opposite, and thereby affects the side shear resistance of the pile.
Figure 19 shows time histories of EPWP and effective vertical stress at depth of 1.4 m during and after pile jacking. The selected depth is near the ground surface. During pile jacking, the EPWP near the ground surface increases rapidly and reaches a maximum when the pile tip is near the selected depth; and once the pile tip passes the selected depth, the EPWP decreases rapidly to negative value, thus temporarily increasing the effective stress and hence the penetration resistance. After pile installation, the negative EPWP generally increases to positive value and reaches a maximum, then the positive EPWP begins to decrease gradually. The development of effective vertical stress is just the opposite.
Figure 20 shows the comparison between the dissipation of EPWP and pile set-up at depth of 1.4 m after pile jacking. At the early consolidation phase, the negative EPWP near the ground surface gradually increases to positive value, simultaneously reducing the side shear resistance of the pile, and even leading to the static load test pile sank suddenly in engineering practice. When the consolidation time reaches a certain value, the EPWP reaches a maximum, then the dissipation of positive EPWP will increase the side shear resistance of the pile to a certain extent.
Figure 21 shows time histories of EPWP and effective vertical stress at depth of 7.5 m during and after pile jacking. During pile jacking, the EPWP reaches a maximum when the pile tip is near the selected depth, and even exceeds the initial overburden effective stress; and once the pile tip passes the selected depth, the EPWP decreases rapidly. After pile installation, water starts to drain away under a relatively high gradient, the dissipation of positive EPWP increases the effective stress, simultaneously increasing the side shear resistance of the pile.
Figure 22 shows comparisons between the dissipation of EPWP and pile set-up at depth of 7.5 m under various soil permeability coefficients after pile jacking. The side shear resistance of the pile increases gradually with the dissipation of positive EPWP. The side shear resistance of the pile is positively correlated to ks. Besides, at the initial consolidation phase, as the effective stress of the surrounding soil at the selected depth is close to zero, the side shear resistance of the pile calculated by Equation (14) is also close to zero. In engineering practice, the adhesion at the pile–soil interface cannot be neglected. The adhesion reduces due to the surrounding soil in remolded state during pile jacking and recovers due to the aging effect after pile installation.
Figure 23 shows time histories of EPWP and effective vertical stress at depth of 9.0 m during and after pile jacking. The selected depth is located at 1.2 m below the pile tip when zp = 7.8 m. The soil at the selected depth is subjected to the radial and circular bidirectional tensile stresses due to the fracturing effect, the EPWP is negative. The existent of negative EPWP temporarily increases the effective stress and hence the penetration resistance, and even leads to the failure of the pile penetration. After pile installation, the negative EPWP generally increases to positive value and reaches a maximum, then the positive EPWP begins to decrease gradually. The development of effective vertical stress is just the opposite.
Figure 24 shows the comparison between the dissipation of EPWP and pile set-up at depth of 9.0 m after pile jacking. The negative EPWP generally increases to positive value and reaches a maximum, which induces the decrease of the side shear resistance of the pile, and even leads to the static load test pile sank suddenly in engineering practice. Besides, when the consolidation time reaches a certain value, the EPWP reaches a maximum, then the dissipation of the positive EPWP will increase the side shear resistance of pile to a certain extent.

4. Conclusions

In this paper, the entire process of steel-pipe pile jacking in saturated fine-grained soil is simulated with the hybrid Lagrangian–ALE approach. The 3D finite element models are established considering the pore water effect via the Biot consolidation theory. On this basis, this paper investigates not only the influence of ks, cu, E, and OCR on EPWP generation during pile jacking and subsequent soil consolidation effect after pile installation but also the correlation between pile set-up and EPWP dissipation. Based on the numerical results, the following conclusions can be drawn:
(1)
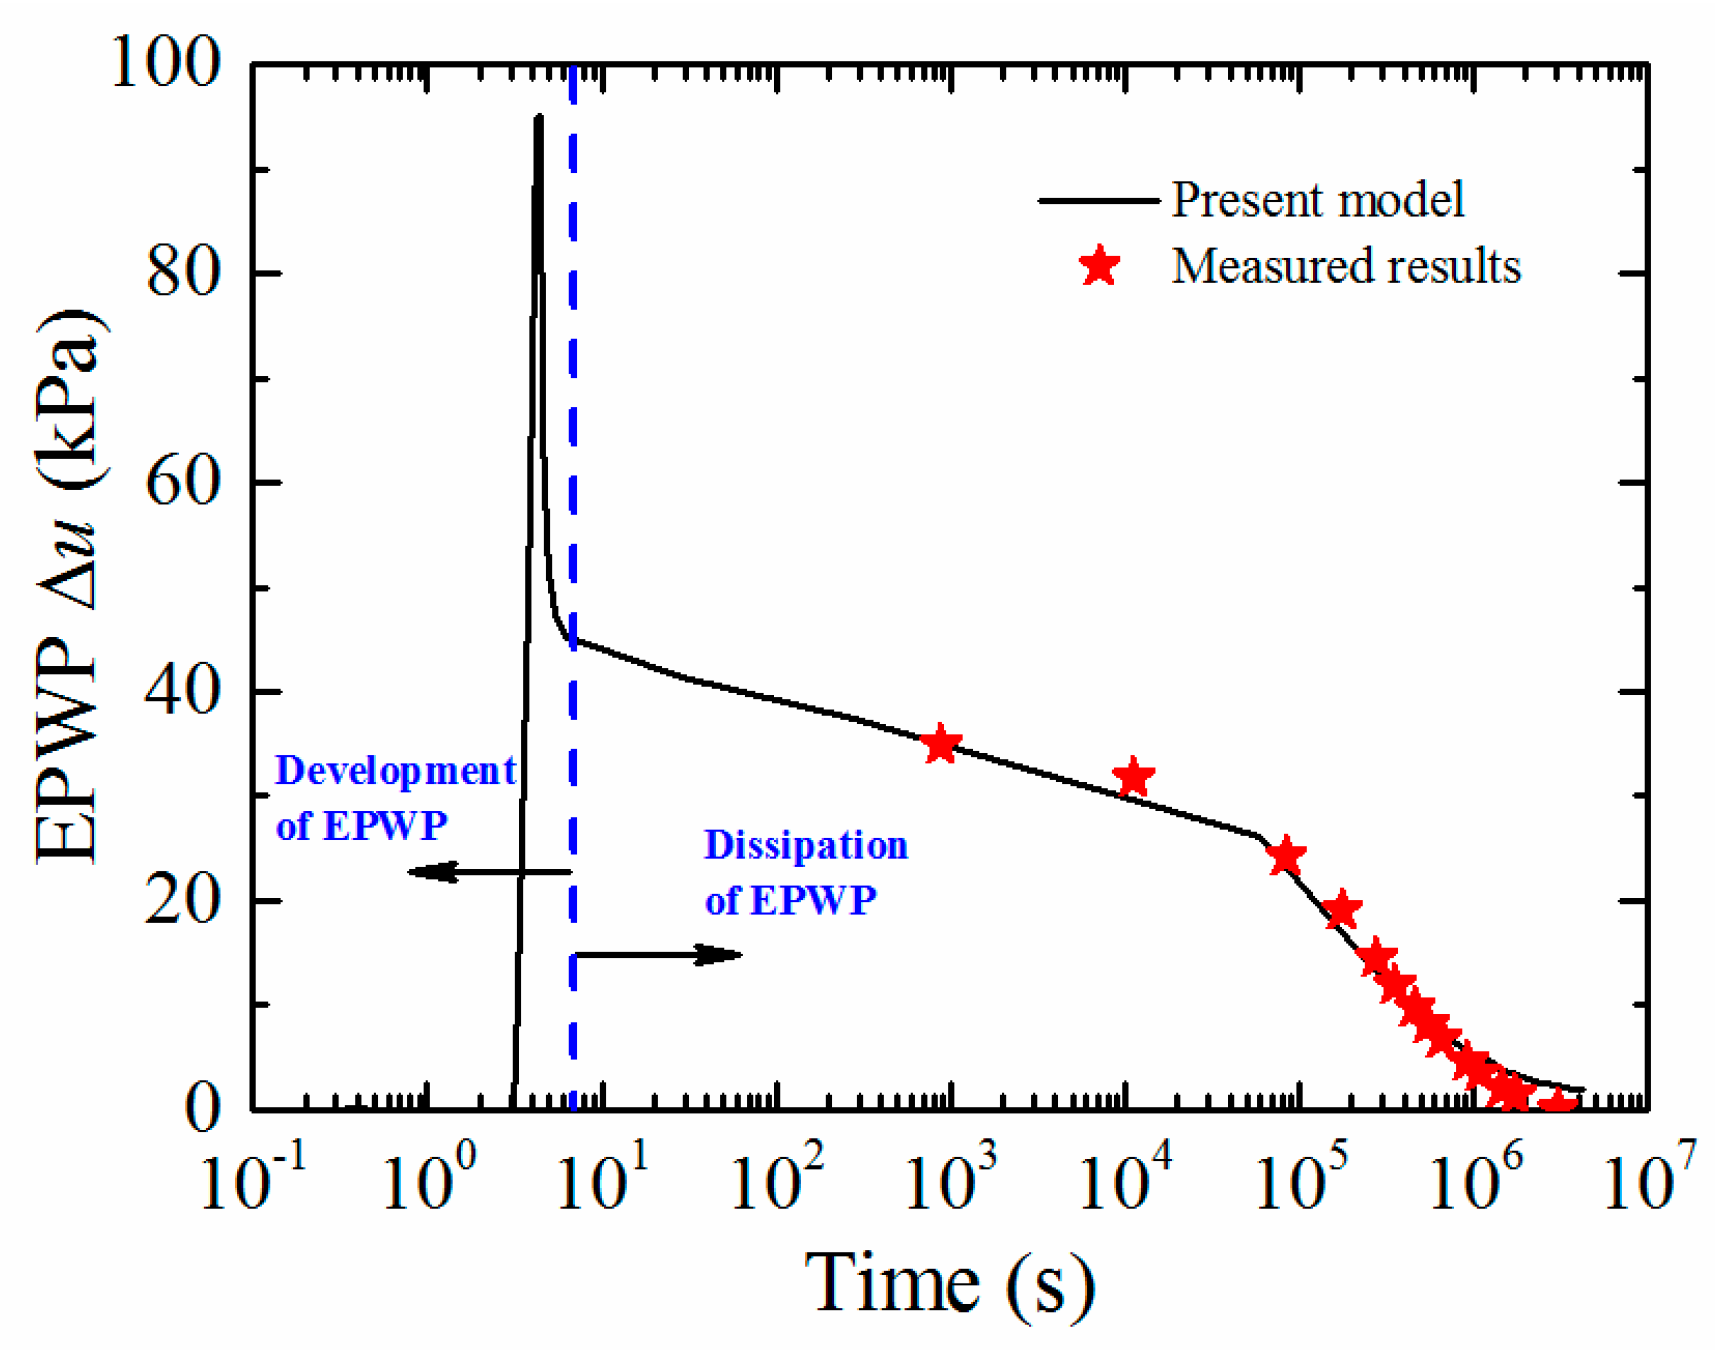
Good agreements between the calculated and measured time histories of EPWP are obtained. Besides, the continuity of soil stress at the interface of the mixed grid has been observed. Thus, the feasibility and reliability of the hybrid Lagrangian–ALE approach to establish finite element model to simulate the installation process of jacked pile and subsequent consolidation phase after installation in saturated fine-grained soil are verified.
(2)
When the entire process of pile jacking is conducted in saturated fine-grained soil, of which the normalized permeability Kn is less than 10 × 10−6, ks and OCR affect the rate and duration of EPWP dissipation; OCR also affects the value of EPWP at the end of pile jacking; however, cu and E only affect the value of EPWP at the end of pile jacking. A suggestion is that the static load test should be carried out after a period of time to avoid low effective stress after pile installation in soil with low ks and OCR.
(3)
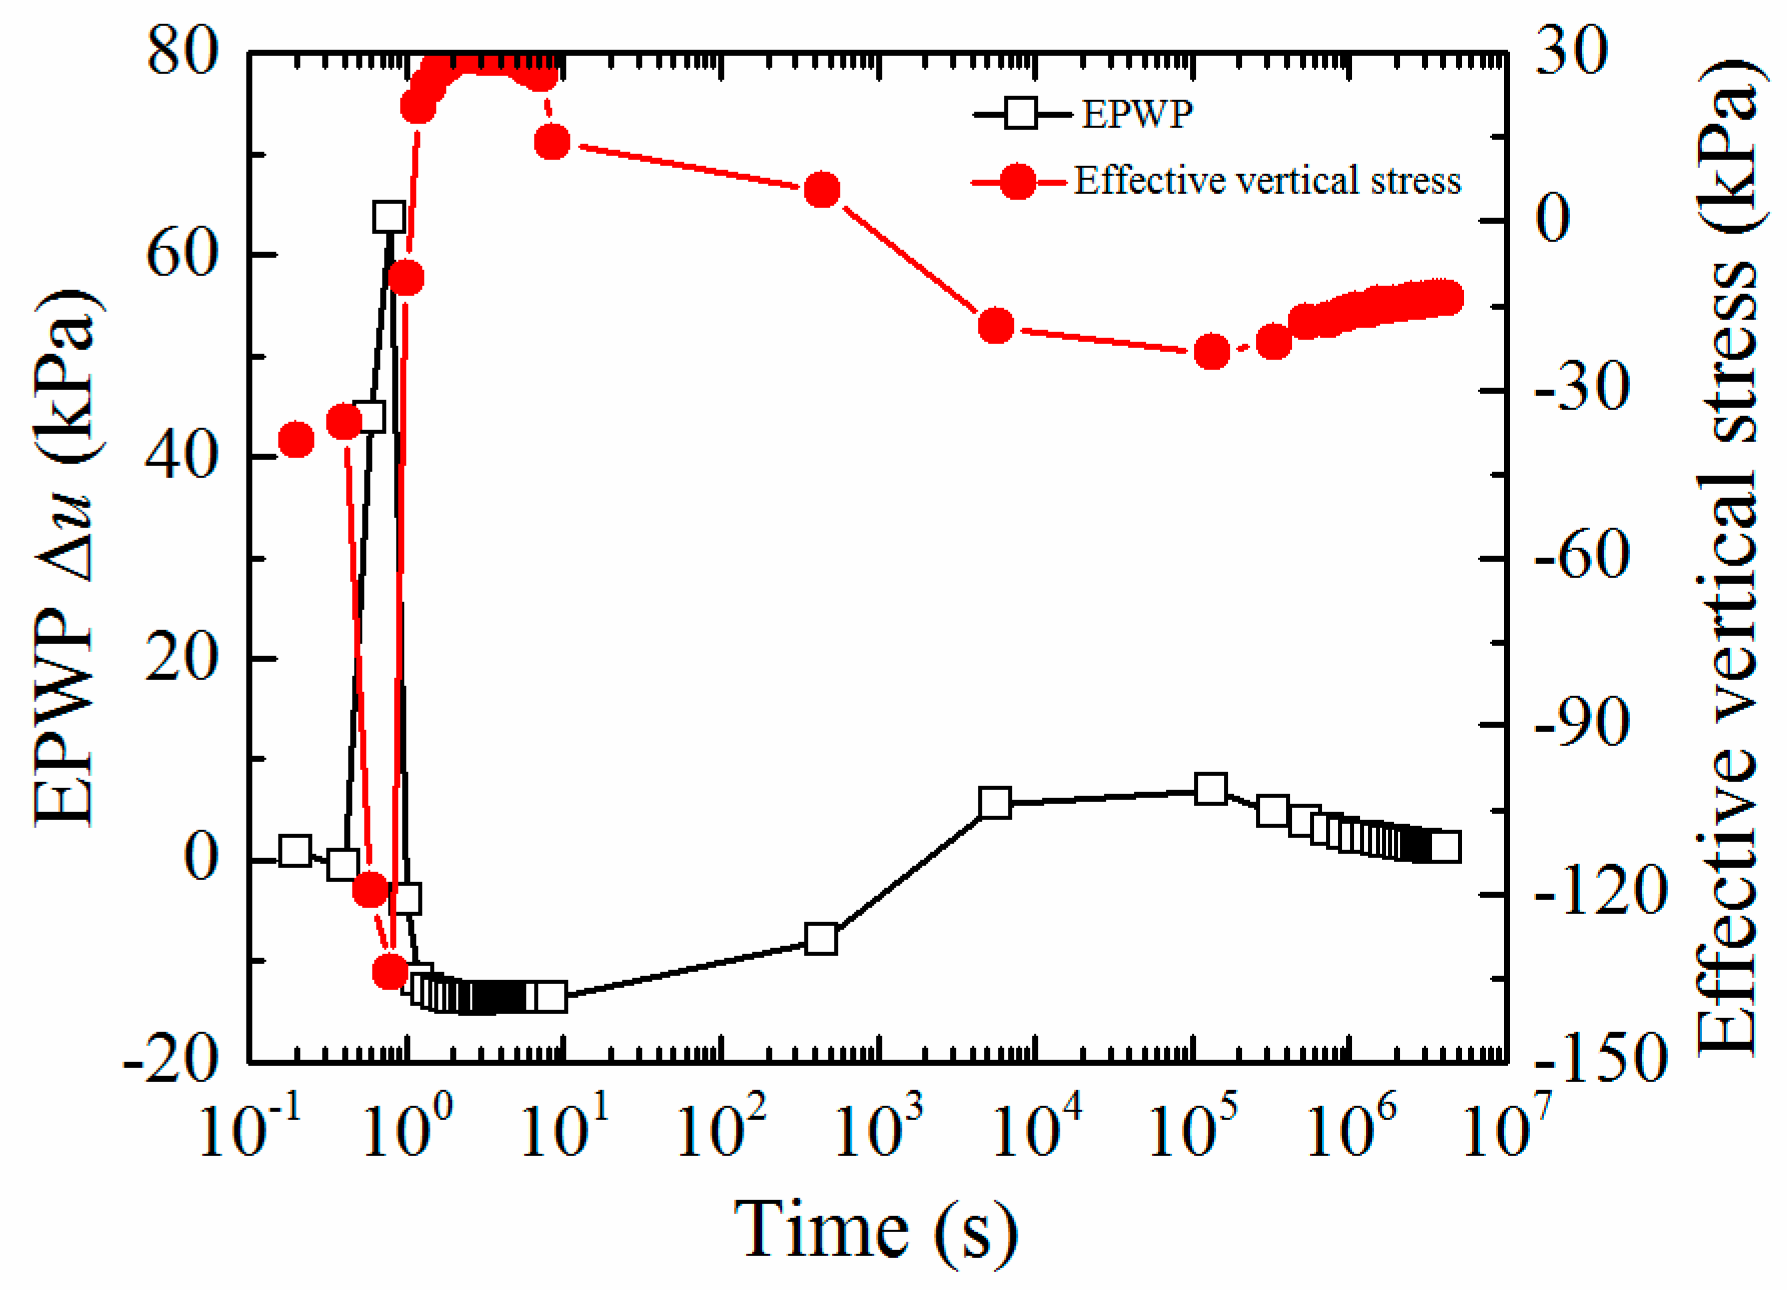
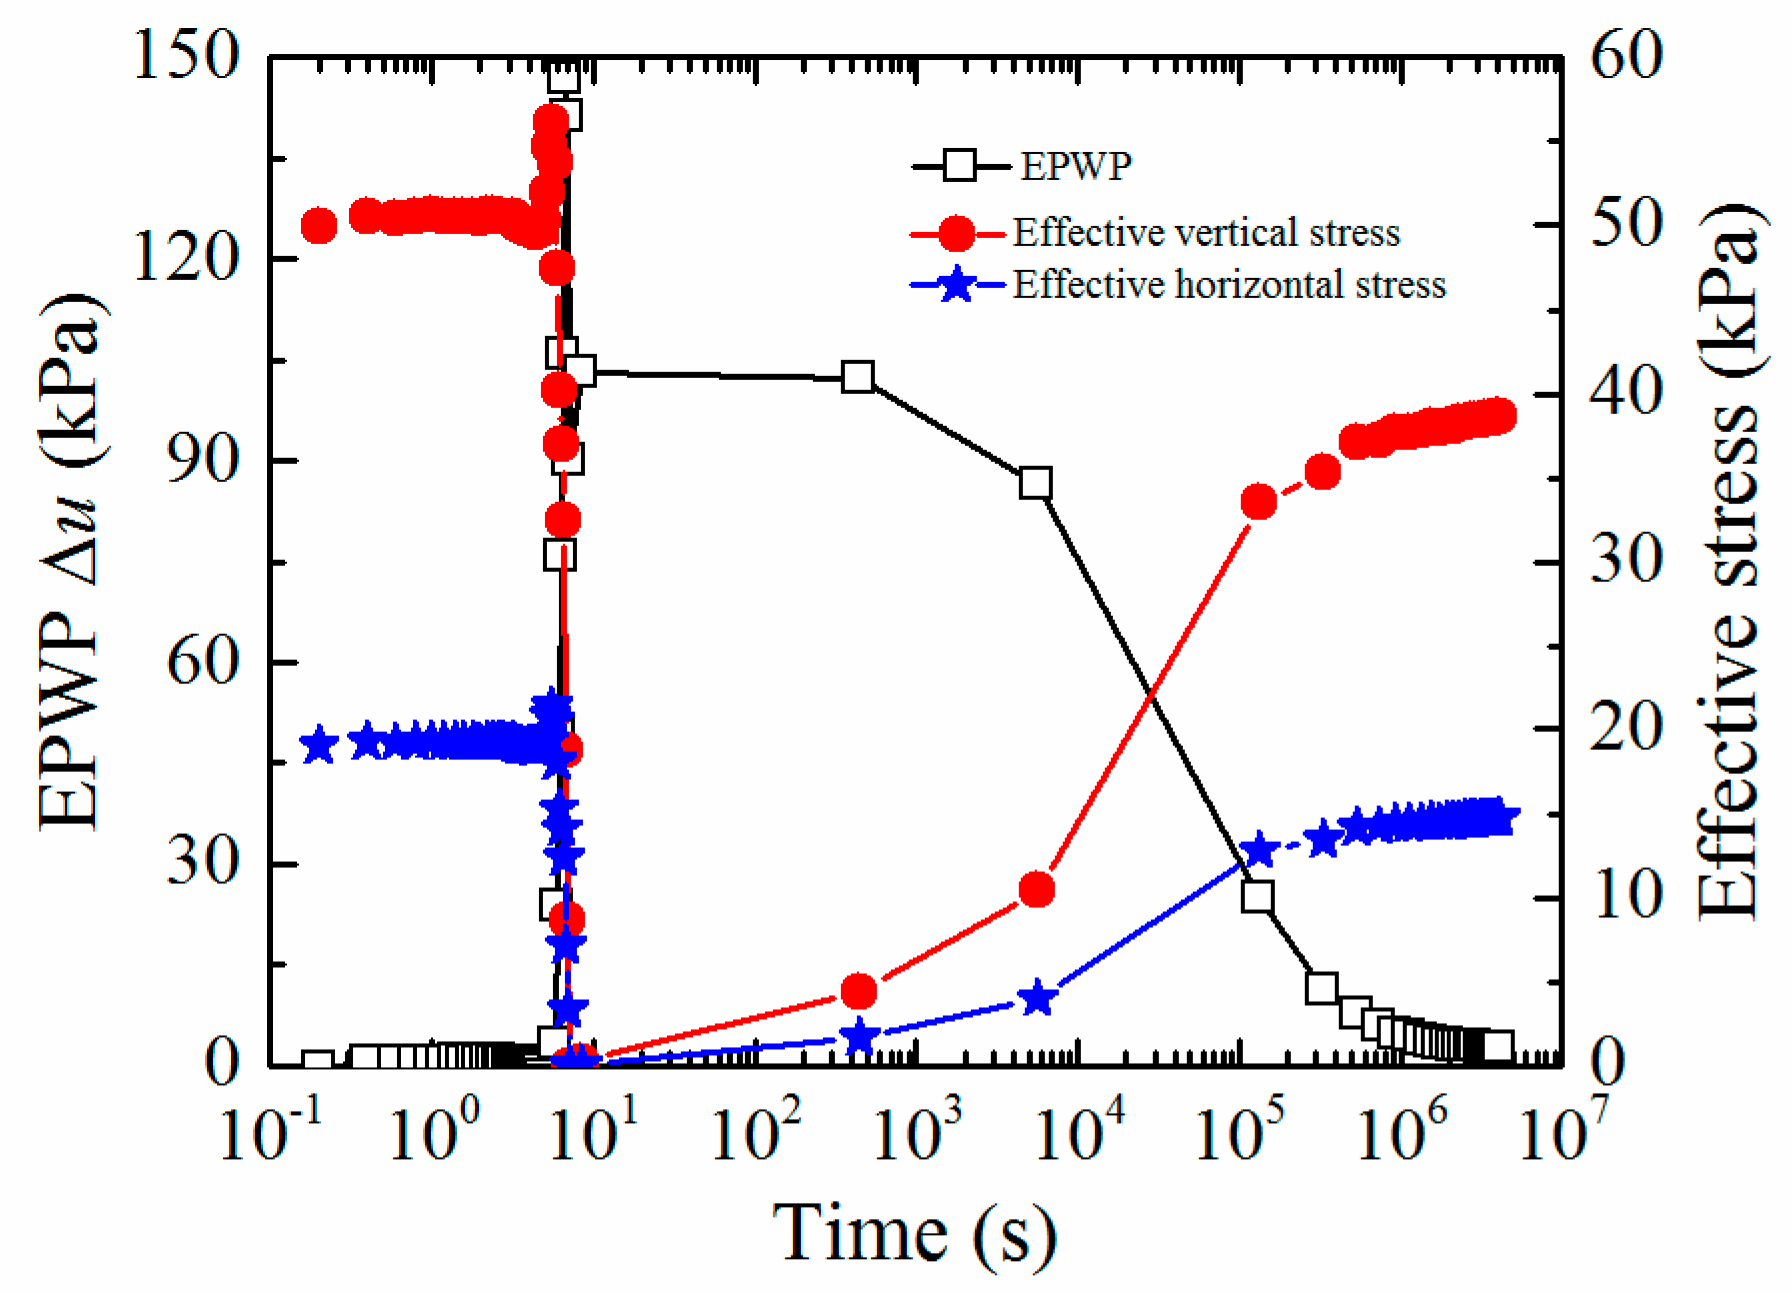
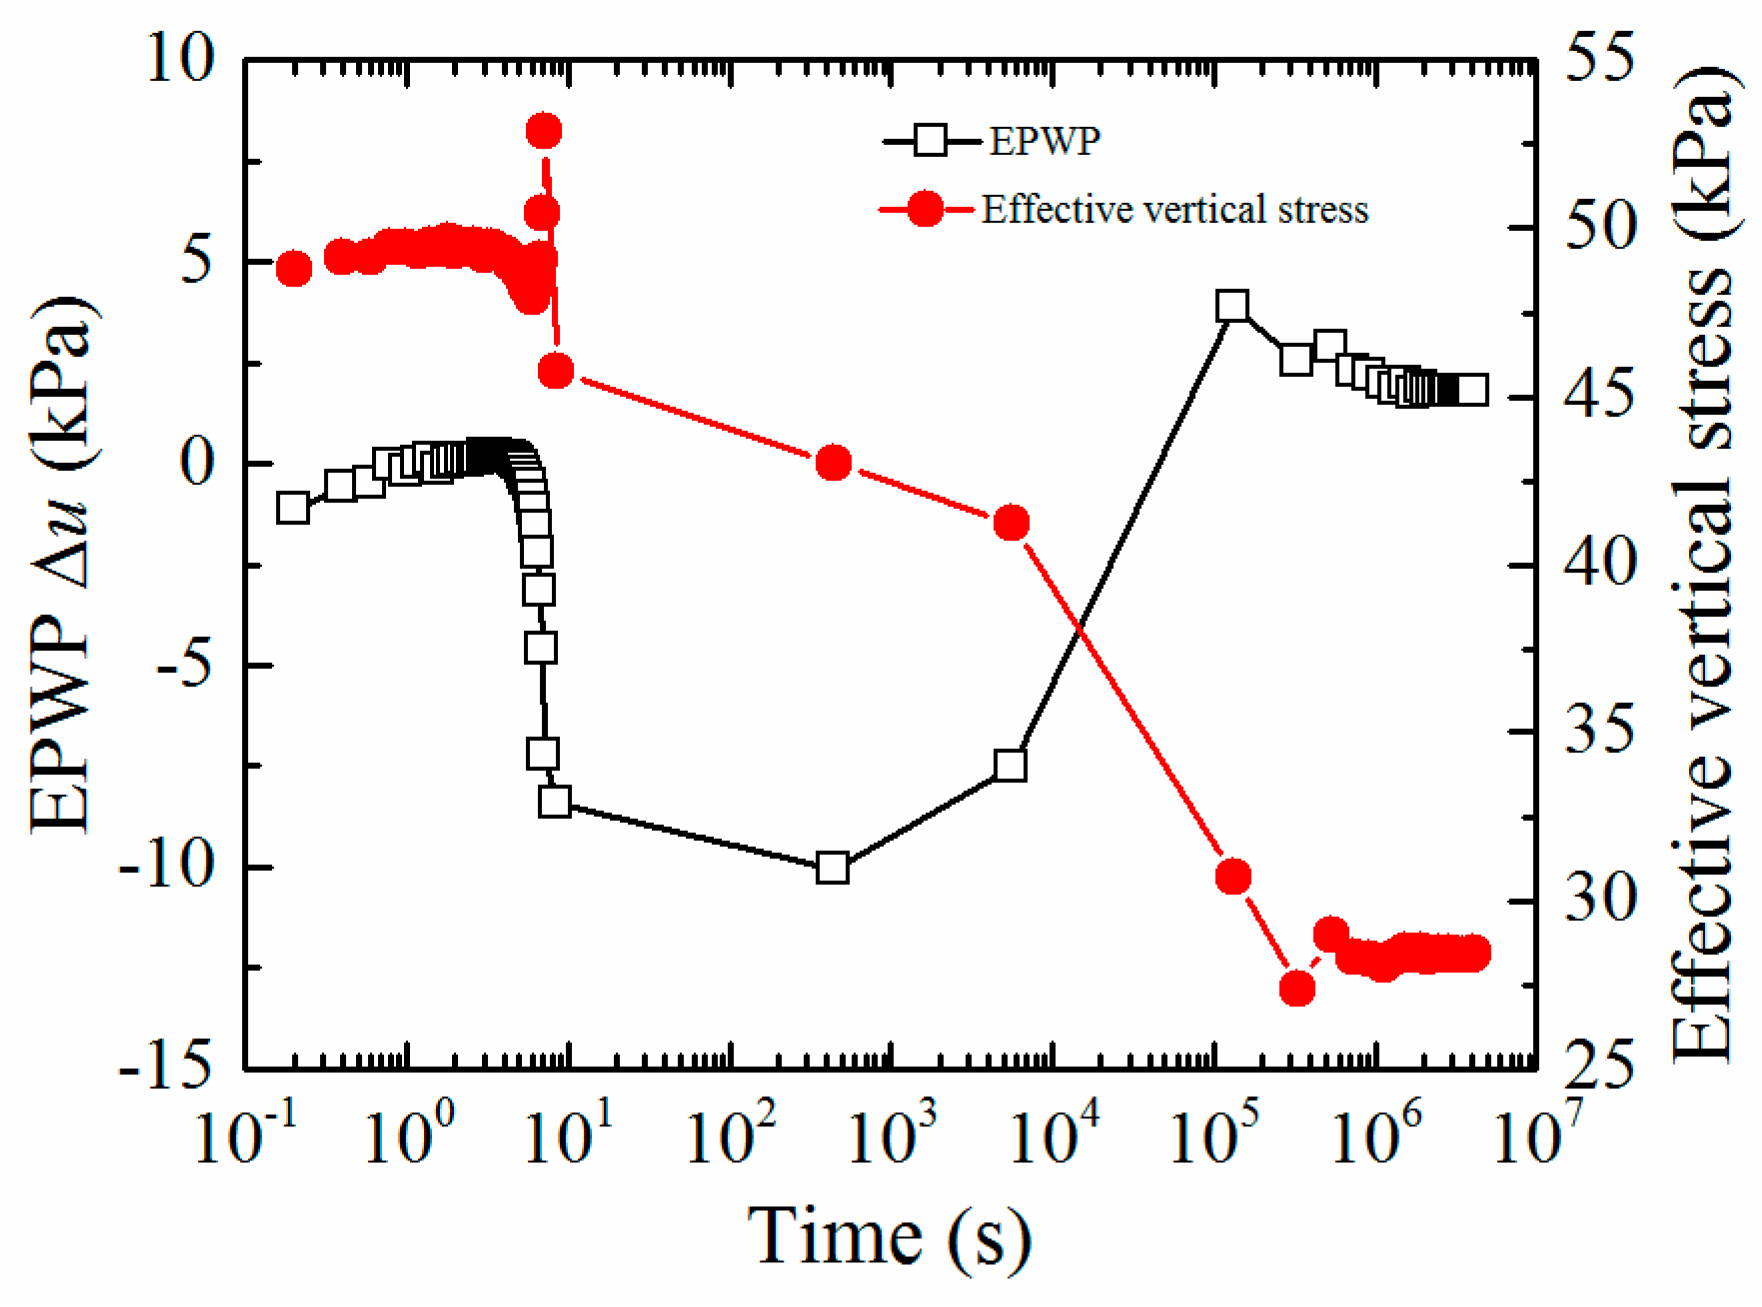
During pile installation, the negative EPWP near ground surface around pile and at a certain depth below the pile tip would increase the effective stress and hence the penetration resistance; at the early stage of consolidation, the negative EPWP increases gradually to positive value, which could cause the decrease of bearing capacity of pile and even lead to the static load test pile sank suddenly; when the consolidation time reaches a certain value, the EPWP reaches a maximum, then the dissipation of the positive EPWP would increase the bearing capacity of pile to a certain extent.
(4)
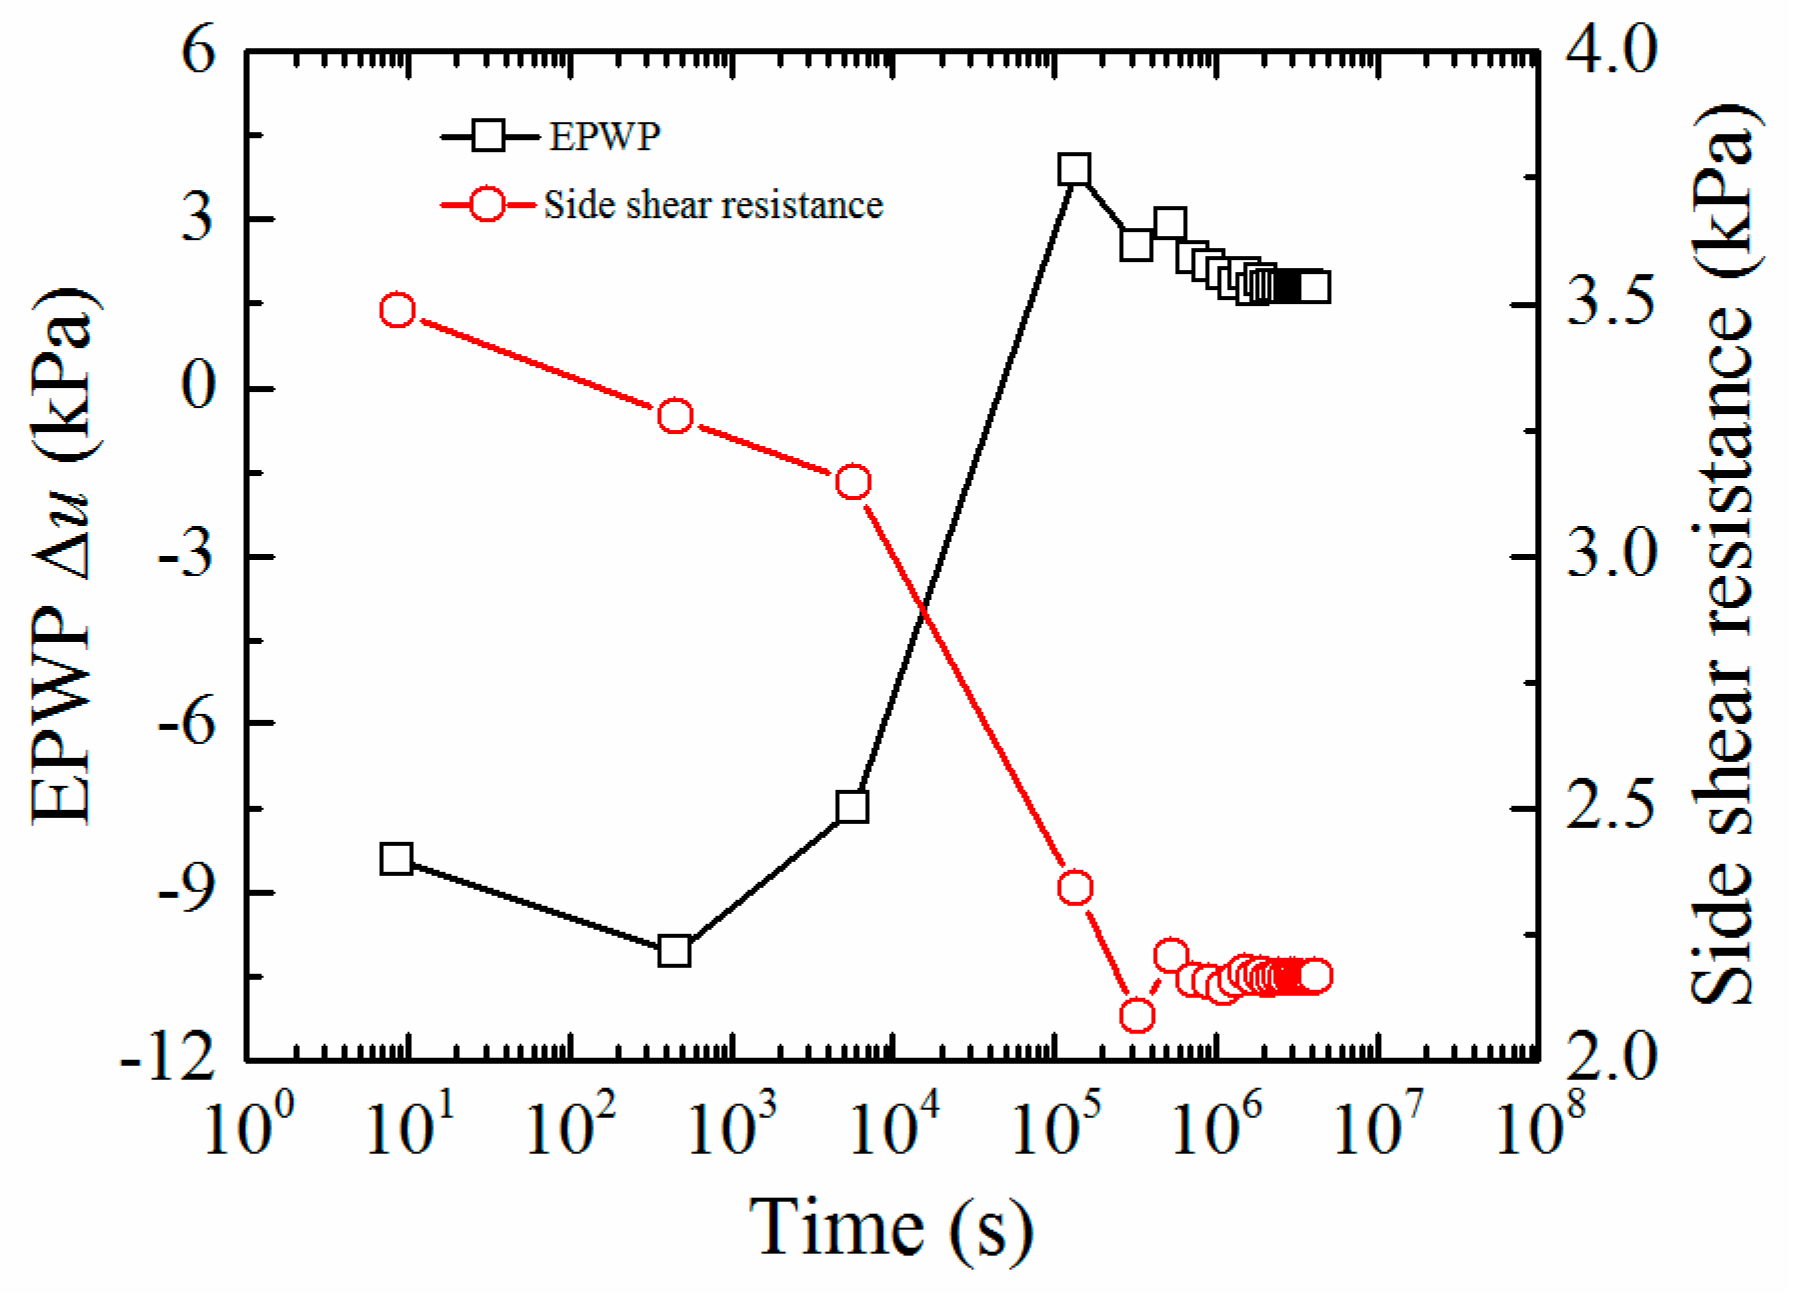
During pile installation, the total stress increment is generally less than EPWP, thus temporarily reducing the effective stress and hence the penetration resistance; after pile installation, the side shear resistance of the pile increases gradually with the dissipation of positive EPWP, and the adhesion due to the aging effect should also be considered.

Author Contributions

Conceptualization, J.D. and J.C.; methodology, J.D. and C.L.; validation, J.D. and C.L.; formal analysis, J.D.; data curation, M.S.; writing—original draft preparation, J.D.; writing—review and editing, J.D., M.S. and L.H.; project administration, M.S.; project administration, J.C., M.S. and L.H. All authors have read and agreed to the published version of the manuscript.

Funding

This research was funded by National Natural Science Foundation of China, grant number 51679134, 51978399; National Key R&D Program of China, grant number 2017YFC0805004; Project of Shanghai Science and Technology Commission, grant number 18DZ1205304; Shanghai Sailing Program, grant number 18YF1425000. The APC was funded by Shanghai Sailing Program, grant number 18YF1425000.

Institutional Review Board Statement

Not applicable.

Informed Consent Statement

Not applicable.

Data Availability Statement

This study did not report any data.

Acknowledgments

The first author is grateful for the research supports from Jianhua Wang from Shanghai Jiao Tong University.

Conflicts of Interest

The authors declare no conflict of interest.

Notations

The following symbols are used in this paper:
I1the first stress invariant
J2the second invariant of the deviatoric stress tensor
α, γ, β, θthe material parameters of the failure surface
c, φthe frictional and cohesive strengths of the material
Rthe curvature of the hardening cap
vthe Poisson’s ratio
X(κ)the intersection of the cap surface with the I1 axis
L(κ)the value of I1 at the location of the start of the cap
κthe I1 coordinate of the intersection of the cap surface and the failure surface
ε v p the plastic volume change
Tthe maximum allowable hydrostatic tension
Wis related to the porosity n and the degree of saturation Sr
Dgoverns the slope of the initial loading curve in hydrostatic compression
X0is thought of as the preconsolidation hydrostatic pressure
σzthe overburden pressure
B, C, Hthe stiffness, damping and permeability coefficient matrices, respectively
Q, Sthe coupling and flow compressibility matrices, respectively
FP, FUthe vectors of fluid supply and external nodal forces, respectively
ksthe permeability coefficient of soil
pwthe pressure head
vfthe fluid velocity vector
zcoz-coordinate
zpthe final jacking depth
Eu, Ethe elastic moduli in undrained and drained conditions, respectively
Gu, Gthe shear moduli in undrained and drained conditions, respectively
v′, vuthe Poisson’s ratios in drained and undrained conditions, respectively
Δdthe penetration displacement of the structure into the Non-Lagrange domain
KN, KTthe normal and tangential contact stiffness, respectively
FTthe tangential force
FNthe normal coupling nodal force
FTcritthe maximum tangential force
μthe friction coefficient of the pile–soil interface
Rppile radius
Irthe rigidity index
Ethe Young’s modulus
cuthe undrained shear strength of soil
OCRsoil overconsolidation ratio
ωthe water content
ρthe natural density of soil
K0the coefficient of earth pressure at rest
Ipthe plastic index
ILthe liquidity index
vcthe average pile installation rate
Knthe normalized permeability
Δuthe value of EPWP
Δuicthe EPWP at the initial consolidation phase
ηcthe normalized EPWP
τfthe local unit shaft resistance
δthe friction angle of the pile–soil interface
σ v i , σ h i the vertical and horizontal effective stress acting on the pile, respectively
βfis expressed by βf = K0tanδ

References

  1. Su, J.B.; Cai, G.J.; Li, J.F.; Zhu, R.H.; Qin, W.G.; Zhai, Q. Safety assessment of buried pipeline during pile driving vibration in offshore engineering. Mar. Georesources Geotechnol. 2016, 34, 689–702. [Google Scholar] [CrossRef]
  2. Chen, Q.M.; Haque, M.N.; Abu-farsakh, M.; Fernandez, B.A. 2014. Field investigation of pile setup in mixed soil. Geotech. Test. J. 2014, 37, 1–14. [Google Scholar] [CrossRef]
  3. Komurka, V.E.; Wagner, A.B.; Edil, T.B. A review of pile set-up. In Proceedings of the 51st Annual Geotechnical Engineering Conference, St. Paul, MI, USA, 1 February 2003; pp. 105–130. [Google Scholar]
  4. Konkol, J.; Bałachowski, L. Large deformation finite element analysis of undrained pile installation. Studia Geotech. Et Mech. 2016, 38, 45–54. [Google Scholar] [CrossRef] [Green Version]
  5. Clark, J.I.; Meyerhof, G.G. The behavior of piles driven in clay. I. an investigation of soil stress and pore water pressure as related to soil properties. Can. Geotech. J. 1972, 9, 351–373. [Google Scholar] [CrossRef]
  6. Roy, M.; Tremblay, M.; Tavenas, F.; Rochelle, P. La. Development of pore pressures in quasi-static penetration tests in sensitive clay. Can. Geotech. J. 1982, 19, 124–138. [Google Scholar] [CrossRef]
  7. Liu, J.W.; Zhang, Z.M.; Yu, F.; Xie, Z.Z. Case history of installing instrumented jacked open-ended piles. J. Geotech. Geoenvironmental Eng. 2012, 138, 810–820. [Google Scholar] [CrossRef]
  8. Hwang, J.H.; Liang, N.; Chen, C.H. Ground response during pile driving. J. Geotech. Geoenvironmental Eng. 2001, 127, 939–949. [Google Scholar] [CrossRef]
  9. Hu, X.Q.; Jiao, Z.B.; Li, Y.H. Distribution and dissipation laws of excess static pore water pressures induced by pile driving in saturated soft clay with driven plastic drainage plate. Rock Soil Mech. 2011, 32, 3733–3737. (In Chinese) [Google Scholar]
  10. Dou, J.Z.; Chen, J.J.; Liao, C.C. Method for estimating initial excess pore water pressure during pile jacking into saturated fine-grained soil. Comput. Geotech. 2019, 116, 103203. [Google Scholar] [CrossRef]
  11. Ni, P.P.; Mangalathu, S.; Mei, G.X.; Zhao, Y.L. Permeable piles: An alternative to improve the performance of driven piles. Comput. Geotech. 2017, 84, 78–87. [Google Scholar] [CrossRef]
  12. Sheng, D.; Eigenbrod, K.D.; Wriggers, P. Finite element analysis of pile installation using large-slip frictional contact. Comput. Geotech. 2005, 32, 17–26. [Google Scholar] [CrossRef]
  13. Mabsout, M.E.; Tassoulas, J.L. A finite element model for the simulation of pile driving. Int. J. Numer. Methods Eng 1994, 37, 257–278. [Google Scholar] [CrossRef]
  14. Mabsout, M.E.; Sadek, S. A study of the effect of driving on pre-bored piles. Int. J. Numer. Anal. Methods Geomech. 2003, 27, 133–146. [Google Scholar] [CrossRef]
  15. Randolph, M.F.; Carter, J.P.; Wroth, C.P. Driven piles in clay-the effects of installation and subsequent consolidation. Géotechnique 1979, 29, 361–393. [Google Scholar] [CrossRef] [Green Version]
  16. Carter, J.P.; Randolph, M.F.; Wroth, C.P. Stress and pore pressure changes in clay during and after the expansion of a cylindrical cavity. Int. J. Numer. Anal. Methods Geomech. 1979, 3, 305–322. [Google Scholar] [CrossRef]
  17. Chandra, S.; Md Hossain, I. Prediction and observation of pore pressure due to pile driving. In Proceedings of the 3th International Conference on Case Histories in Geotechnical Engineering, St. Louis, MI, USA, 2 June 1993; pp. 279–284. [Google Scholar]
  18. Abu-Farsakh, M.; Tumay, M.; Voyiadjis, G. Numerical parametric study of piezocone penetration test in clays. Int. J. Geomech. 2003, 3, 170–181. [Google Scholar] [CrossRef]
  19. Abu-Farsakh, M.; Rosti, F.; Souri, A. Evaluating pile installation and subsequent thixotropic and consolidation effects on setup by numerical simulation for full-scale pile load tests. Can. Geotech. J. 2015, 52, 1734–1746. [Google Scholar] [CrossRef]
  20. Rosti, F.; Abu-Farsakh, M.; Jung, J. Development of analytical models to estimate pile setup in cohesive soils based on FE numerical analyses. Geotech. Geol. Eng. 2016, 34, 1119–1134. [Google Scholar] [CrossRef]
  21. Elias, M.B. Numerical Simulation of Pile Installation and Setup. Ph.D. dissertation, The University of Wisconsin, Milwaukee, WI, USA, 2008. [Google Scholar]
  22. Qiu, G.; Henke, S.; Grabe, J. Application of a Coupled Eulerian-Lagrangian approach on geomechanical problems involving large deformations. Comput. Geotech. 2011, 38, 30–39. [Google Scholar] [CrossRef]
  23. Pucker, T.; Grabe, J. Numerical simulation of the installation process of full displacement piles. Comput. Geotech. 2012, 45, 93–106. [Google Scholar] [CrossRef]
  24. Zhang, C.; Nguyen, G.D.; Einav, I. The end-bearing capacity of piles penetrating into crushable soils. Géotechnique 2013, 63, 341–354. [Google Scholar] [CrossRef] [Green Version]
  25. Xu, B.Z.; Li, S.; Xia, L.X.; Dai, X. Numerical simulation analysis of driving methods affecting soil around pipe pile. Hydro-Sci. Eng. 2015, 2, 38–43. (In Chinese) [Google Scholar]
  26. Sabetamal, H.; Nazem, M.; Carter, J.P.; Sloan, S.W. Large deformation dynamic analysis of saturated porous media with applications to penetration problems. Comput. Geotech. 2014, 55, 117–131. [Google Scholar] [CrossRef]
  27. Sabetamal, H.; Carter, J.P.; Sloan, S.W. Pore pressure response to dynamically installed penetrometers. Int. J. Geomech. 2018, 18, 04018061. [Google Scholar] [CrossRef]
  28. Hamann, T.; Qiu, G.; Grabe, J. Application of a coupled Eulerian-Lagrangian approach on pile installation problems under partially drained conditions. Comput. Geotech. 2015, 63, 279–290. [Google Scholar] [CrossRef]
  29. Qiu, G.; Grabe, J. Explicit modeling of cone and strip footing penetration under drained and undrained conditions using a visco-hypoplastic model. Geotechnik 2011, 34, 205–217. [Google Scholar] [CrossRef]
  30. Wang, D.; Bienen, B.; Nazem, M.; Tian, Y.H.; Zheng, J.B.; Pucker, T.; Randolph, M.F. Large deformation finite element analyses in geotechnical engineering. Comput. Geotech. 2015, 65, 104–114. [Google Scholar] [CrossRef]
  31. Schwer, L.E. Preliminary assessment of non-Lagrangian methods for penetration simulation. In Proceedings of the 8th International LS-DYNA Users Conference, Dearborn, MI, USA, 2–4 May 2004. [Google Scholar]
  32. Dou, J.Z.; Chen, J.J.; Zhang, Z.J. Influence of large-diameter pipe pile driving on surrounding marine soils and adjacent submarine pipelines. Mar. Georesources Geotechnol. 2019, 39, 1–19. [Google Scholar] [CrossRef]
  33. Roy, M.; Blanchet, R.; Tavenas, F.; Rochelle, P. La. Behaviour of a sensitive clay during pile driving. Can. Geotech. J. 1981, 18, 67–85. [Google Scholar] [CrossRef]
  34. Drucker, D.C. On uniqueness in the theory of plasticity. Q. Appl. Math. 1956, 14, 35–42. [Google Scholar] [CrossRef] [Green Version]
  35. Dou, J.Z.; Chen, J.J.; Wang, W. Method for estimating the degree of improvement in soil between adjacent tamping locations under dynamic compaction. Int. J. Geomech. 2019, 19, 04019134. [Google Scholar] [CrossRef]
  36. Tong, X.L.; Tuan, C.Y. Viscoplastic cap model for soils under high strain rate loading. J. Geotech. Geoenvironmental Eng. 2007, 133, 206–214. [Google Scholar] [CrossRef]
  37. Sandler, I.S.; Rubin, D. An algorithm and a modular subroutine for the CAP model. Int. J. Numer. Anal. Methods Geomech. 1979, 3, 173–186. [Google Scholar] [CrossRef]
  38. Chen, W.F.; Baladi, G.Y. Soil Plasticity: Theory and Implementation; Elsevier: New York, NY, USA, 1985. [Google Scholar]
  39. Gu, Q.; Lee, F.H. Ground response to dynamic compaction of dry sand. Geotechnique 2002, 52, 481–493. [Google Scholar] [CrossRef]
  40. Biot, M.A. Theory of propagation of elastic waves in a fluid-saturated porous solid. I. Low Freq. Range. II. High. Freq. Range. J. Acoust. Soc. Am. 1956, 28, 168–191. [Google Scholar]
  41. Zienkiewicz, O.C.; Chang, C.T.; Bettess, P. Drained, undrained, consolidating and dynamic behaviour assumptions in soils. Géotechnique 1980, 30, 385–395. [Google Scholar] [CrossRef]
  42. Zienkiewicz, O.C.; Shiomi, T. Dynamic behaviour of saturated porous media: The generalized Biot formulation and its numerical solution. Int. J. Numer. Anal. Methods Geomech. 1984, 8, 71–96. [Google Scholar] [CrossRef]
  43. Hallquist, J.O. LS-DYNA Theoretical Manual Version 971; Livermore Software Technology Corporation: Livermore, CA, USA, 2006. [Google Scholar]
  44. Massarsch, K.R.; Broms, B.B. Fracturing of soil caused by pile driving in clay. In Proceedings of the 9th International Conference on Soil Mechanics and Foundation Engineering, Tokyo, Japan, 10–15 July 1977; pp. 197–200. [Google Scholar]
  45. Wang, Y.X.; Sun, J. Influence of pile driving on properties of soils around pile and pore water pressure. Chin. J. Rock Mech. Eng. 2004, 23, 153–158. (In Chinese) [Google Scholar]
  46. Gibson, R.E.; Anderson, W.F. In situ measurement of soil properties with the pressuremeter. Civ. Eng. Public Work. Rev. 1961, 56, 615–618. [Google Scholar]
  47. Massarsch, K.R. Soil Movements Caused by Pile Driving in Clay. Ph.D. Thesis, Royal Institute of Technology, Brinellvägen, Stockholm, 1976. [Google Scholar]
  48. Hajduk, E.L. Full Scale Field Testing Examination of Pile Capacity Gain with Time. Ph.D. Thesis, University of Massachusetts, Lowell, MA, USA, 2006. [Google Scholar]
Figure 1. Static yield surface of cap model [10].
Jmse 09 00705 g001
Figure 2. Schematic diagram of finite element model based on the hybrid Lagrangian–ALE approach.
Jmse 09 00705 g002
Figure 3. Mechanism of contact kinematics at the pile–soil interface (KN: normal contact stiffness; KT: tangential contact stiffness).
Jmse 09 00705 g003
Figure 4. (a) Finite element model and boundary conditions; (b) Soil profile of the A-A section.
Jmse 09 00705 g004
Figure 5. Development and dissipation of EPWPs around the jacked pile during and after pile installation.
Jmse 09 00705 g005
Figure 6. EPWP contours induced by steel-pipe pile jacking during and after pile installation. (a) Piling stage; (b) Start consolidation; (c) 4.5 min; (d) 16.6 h; (e) 3.0 day; (f) 7.6 day; (g) 12.3 day; (h) 23.8 day.
Jmse 09 00705 g006
Figure 7. Relationships between EPWP and depth during piling stage and at different times after end of pile jacking.
Jmse 09 00705 g007
Figure 8. (a) Development and dissipation of EPWPs during and after pile installation at different depths; (b) Dissipation of normalized EPWPs after pile installation at different depths.
Jmse 09 00705 g008
Figure 9. (a) Development and dissipation of EPWPs during and after pile installation at different distances from the pile wall; (b) Dissipation of normalized EPWPs after installation at different distances from the pile wall.
Jmse 09 00705 g009
Figure 10. Development and dissipation of EPWPs during and after pile installation under various soil permeability coefficients. (a) At depth of 4.9 m; (b) at depth of 7.5 m.
Jmse 09 00705 g010
Figure 11. Normalized EPWP dissipation curves after installation under various soil permeability coefficients. (a) At depth of 3.0 m; (b) at depth of 4.9 m; (c) at depth of 7.5 m.
Jmse 09 00705 g011
Figure 12. Development and dissipation of EPWPs during and after pile installation under various soil undrained shear strengths. (a) At depth of 4.9 m; (b) at depth of 7.5 m.
Jmse 09 00705 g012
Figure 13. Normalized EPWP dissipation curves after installation under various soil undrained shear strengths. (a) At depth of 4.9 m; (b) at depth of 7.5 m.
Jmse 09 00705 g013
Figure 14. Development and dissipation of EPWPs during and after pile installation under various soil elastic moduli. (a) At depth of 4.9 m; (b) at depth of 7.5 m.
Jmse 09 00705 g014
Figure 15. Normalized EPWP dissipation curves after installation under various soil elastic moduli. (a) At depth of 4.9 m; (b) at depth of 7.5 m.
Jmse 09 00705 g015
Figure 16. Development and dissipation of EPWPs at a distance of 0.2 m from the pile wall during and after pile installation under various OCRs. (a) At depth of 4.9 m; (b) at depth of 7.5 m.
Jmse 09 00705 g016
Figure 17. Normalized EPWP dissipation curves after installation under various OCRs. (a) At depth of 4.9 m; (b) at depth of 7.5 m.
Jmse 09 00705 g017
Figure 18. Time histories of the EPWP and total stress increment of soil around the pile.
Jmse 09 00705 g018
Figure 19. Time histories of the EPWP and effective stress of soil at depth of 1.4 m at zp = 7.8 m.
Jmse 09 00705 g019
Figure 20. Comparison between the dissipation of EPWP and pile set-up at depth of 1.4 m after pile installation.
Jmse 09 00705 g020
Figure 21. Time histories of the EPWP and effective stress of soil at depth of 7.5 m at zp = 7.8 m.
Jmse 09 00705 g021
Figure 22. Comparisons between the dissipation of EPWP and pile set-up at depth of 7.5 m under various soil permeability coefficients after pile installation.
Jmse 09 00705 g022
Figure 23. Time histories of the EPWP and effective stress of soil at depth of 9.0 m at zp = 7.8 m.
Jmse 09 00705 g023
Figure 24. Comparison between the dissipation of EPWP and pile set-up at depth of 9.0 m after pile installation.
Jmse 09 00705 g024
Table 1. Geotechnical properties of the subsoil.
Soil NameThickness (m)ρ (kg/m3)νK0cu (kPa)ω (%)IpIL
Clay crust1.617510.3050.43819.942.724.30.88
Silty clay4.216250.2880.40512.558.617.02.42
Clayey silt4.017200.2760.38224.340.711.72.16
Clayey silt with sand4.019200.2660.36230.027.37.02.48
Sand>13.7
Reproduced or adapted from [10], with permission from publisher Dou et al., 2019.
Table 2. Material parameters for pile jacking analysis.
Soil LayerK (kPa)G (kPa)α (kPa)γβθWRD (kPa−1)T (kPa)
16659298523.8000.2380.54.480.00030
23797187514.6000.2750.54.130.00030
36921364523.8000.2380.54.480.00030
48115450014.6000.2750.54.130.00030
Publisher’s Note: MDPI stays neutral with regard to jurisdictional claims in published maps and institutional affiliations.

