1. Introduction
Maritime and river transport are undergoing major energy changes. The reduction of air pollutant emissions, imposed by new and severe international regulations, is a challenge to be met in order to reduce the environmental and health impacts of local pollution near urban areas and long-distance pollution, leading to the ozone depletion [
1,
2,
3,
4]. New propulsive architectures (electric, hybrid), are enabled by the availability of innovative and efficient components (batteries, fuel cells, supercapacitors, etc.) [
5]. The use of these new architectures is a very promising path to reach these goals [
6,
7]. However, their integration requires significant techno-economic studies, and they are mainly reserved for high tonnage ships and their implementation on small units remains marginal. The integration of these new propulsive architectures on low tonnage ships characterized by short operating cycles is, however, a real technical challenge. Indeed, in such structures, minimization of the volume dedicated to energy storage (fuel tank, batteries) and energy conversion systems is essential in order to maximize the passenger or freight boarding capacities. Such ships operate mainly on transient states, involving strong power demands. On the other hand, the short operating cycles and the limited docking times limit the possibilities of plug-in external charging. Multicriteria design methods based on multidisciplinary approaches are thus needed [
8,
9].
Obviously, substantial work has been done in this subject. A review of recent achievements is presented in [
8], while highlighting the advantages and the difficulties encountered in sizing electric energy storage systems for low tonnage ships. The originality of this work is that it considers the recycling of an existing fleet of small vessels navigating in river waters with very short cycles. They are characterized by high power requirements and small available volumes not initially intended for an electric energy storage system, making the choice and the sizing of the latter a challenging task. The complex water flow with respect to the vessel hull is another issue which is addressed in this work and which requires theoretical and experimental approaches.
In this context, a multidisciplinary modeling approach developed in previous works [
10,
11,
12] is applied to develop and optimize hybrid propulsions, with the associated power management strategies, in order to replace a conventional propulsion chain in an existing river ferry built with a diesel propulsion, with the aim of reducing its environmental impacts and the operating costs over its entire lifetime. The operating cycle of the ferry and the energy consumption of its classical propulsion chain have been determined experimentally and then used as references in the simulations for comparison and validation purposes.
The specific structure of the ferry hull and the uncertainties about its navigation conditions in river waters invalidate the conventional analytical and empirical models for the hydrodynamic resistance to advancement evaluation. The latter is therefore determined by the analysis of measurement data and subsequently validated through comparison of the evaluated and measured fuel consumptions over a cycle for the classical chain.
Batteries, supercapacitors, or flywheels can be used as energy storage systems to be associated with power sources, which can be diesel generators or fuel cells [
13,
14,
15]. Due to specific integration and cost constraints, the possible use of flywheels or fuel cells is not considered in this work. The proposed hybridization configurations for the electrification of the propulsion associate the existing diesel generators (DGs) to energy storage systems (ESS) in order to reduce the electrification costs of the existing ship. As batteries are the most used and available ESS and are suitable for naval use [
16,
17], a first configuration involves Lithium-Ion (Li-Ion) batteries as ESS to be associated to the existing DGs. A second solution is based on the use of supercapacitors as this kind of solution can significantly improve upon the cost and emissions of comparable ships [
1]. These two hybrid configurations are compared to the classical initial one in terms of emissions.
The specifications of the studied ferry and its mission are presented in the next section. It is followed by the analysis and the treatment of the measurement data in order to determine the speed profile and the resistance to advancement. A simulation of the classical propulsion will then be performed in order to determine the power repartition in the different parts of the conversion chain, and its evolution in time, which is necessary for the sizing of the different elements of the hybrid structures and the determination of the relevant power management strategies. The last section concerns the hybridization of the ferry propulsion, aiming to determine the best hybrid structure.
2. Specifications and Mission Profiles of the Studied River Ferry
River ferries are generally flat-bottomed boats that allow vehicles and passengers to move from one river shore to another. They have a shallow draft, in order to be able to dock very close to the shore. The present study concerns a river ferry operating on the Seine River in France, with a carrying capacity of 12 cars and 50 passengers. The initial existing design (using conventional diesel propulsion) has two independent propulsion chains. Each chain consists of a diesel engine connected to a Voith Schneider propeller (VSP) via a drive shaft and a gearbox. The electrical requirements on board are provided by a diesel generator (
Figure 1). The main characteristics of the system are listed in
Table 1 [
18]. We can notice that the rated power of the propellers is about 66.25% of the rated power of the diesel engines. This percentage represents the efficiency of the propellers at their optimal rotating speed (854 rpm).
The ferry makes about 126 river crossings per day, with an average duration of 3 min per crossing and between 3 and 10 min of docking for the boarding of passengers and cars. It marks three stops of 30 min per day, approximately one per 40 crossings. It stops at the dock for 8 h during the night.
The ferry propulsion presents numerous drawbacks: lack of flexibility, a poor efficiency at low speeds, significant vibrations and noise emissions, high fuel consumption and, therefore, high pollutant emissions. These drawbacks motivate the search for solutions to improve the energetic performances of the ferry, envisaging the electrification of its propulsion.
3. Experimental Study
3.1. Data Acquisition and Processing
A Global Positioning System (GPS) has been used to record the trajectories and speeds of the ferry during two days of operation in favorable weather conditions (
Figure 2a). By statistical analysis (filtering and averaging) of the acquired data, a reference speed profile for one river crossing was determined, as shown in
Figure 2b.
The speed cycle has three phases: an acceleration phase, a deceleration phase, and a stopping phase. The acceleration phase lasts about 80 s, where the speed reaches a maximal value of about 3.1 m/s. This phase is characterized by an important power demand. The deceleration phase lasts about 100 s. Approaching the dock an astern thrust is applied to slow down the ferry and to better maneuver near the banks. The docking phase lasts about 10 min.
3.2. Identification of the Hydrodynamic Resistance to Advancement
Due to the specific structure of the ferry hull and the uncertainties about its navigation conditions (orientation and relative speed with respect to the water flow), analytical models giving the hydrodynamic resistance to advancement cannot be directly used unless supported and corrected by numerical fluid dynamics models. In our case, with a rather small draft and a maximal Froude number equal to 0.22 (see
Table 2), a simplified representation of the ship resistance reduced to friction has been chosen. This approximation seems enough for the energy flow analysis and modeling of the ship propulsion behavior. This model is therefore determined by the analysis of the measurement data. Analyzing the profile of the dynamic part, we notice that is can be assimilated to a step response of a first-order system. With this assumption, the differential equation governing the movement of the ship can thus be expressed as follows, where
v is the ferry speed,
M is the ferry mass,
Tp is the propulsion thrust, and
f is the coefficient of viscous friction between the water and the ferry hull (resistance to advancement):
For a constant thrust (step response), the temporal expression of the ferry speed during the acceleration (80 s) and deceleration phases is given as follows, where
u(t) is the Heaviside function:
In Equation (2), v(t) is the ferry speed, vm is its maximal value, and τ is a time constant given as follows: .
By fitting the curve obtained by Equation (2) to the experimental curve of the ferry speed (
Figure 3), and knowing the ferry mass, the different parameters given in
Table 2 were determined.
3.3. Identification of the Estimation of the Energy consumption on a Cycle
The measured speed and the identification of the resistance to advance allow making an estimation of the useful energy consumption on a cycle, which can be expressed as follows:
Taking the identified values, and replacing Equation (2) in Equation (3), we obtain:
Considering a global thruster efficiency of about 66% (according to the data given in
Table 1) and a diesel engine and gearbox efficiency estimated at 30%, a fuel energy of about 12.22 kWh is obtained, which represents a consumption of about 1.34 L by considering a fuel calorific power of 10 kWh/L. By adding the diesel generator consumption, which is estimated at 8.33 kWh for a single trip (working at full power all the time), a global fuel consumption around 2.05 L for one single trip is obtained.
The reported consumption by day is about 300 liters of fuel for 126 trips which corresponds to 2.4 liters of fuel per single trip consumed by the set of engines including the diesel generator.
The difference between the estimated values and the reported ones (14.5%) may be due to several factors:
The energy consumed during the docking and braking maneuvers, which is not considered.
Since the GPS only measures an absolute speed, the considered operating cycle (measured speed) does not consider the speed of the water flow in the Seine River. The relative speed difference, of about 2 km/h [
18], leads to an additional consumption of energy which is not considered in the simplified approach which is used.
The global efficiency of the propulsion may be overestimated. Indeed, this efficiency could be lower that the considered one due to the aging and uncertainties about the component characteristics.
The diesel engines may be oversized and thus do not work on their optimal regime.
4. Simulation of the Classical Propulsion
A dynamic simulation of the classical propulsion was performed in order to determine the time evolution of the power flows in the different parts of the system. These results are needed for the sizing of the different elements of the proposed hybrid structures and the determination of relevant power management strategies.
A multidisciplinary and configurable modeling simulator has been developed on Matlab/Simulink [
10,
11,
12]. The ferry hull is model is given by (1), with the resistance to advance determined experimentally using Equation (2). A four-quadrant (C
t, C
q) model is used to model the propeller in terms of torque and thrust for any operating points as in [
12]. The propeller shaft dynamic model (
I dΩ/
dt = Qred −
Qp) involves the moment of inertia (
I) of all the rotating parts, and the gear box is represented by a reduction ratio (
Kred) and an efficiency (
ηred), giving Ω
eng = Kred Ω and
Qred = ηred Kred Qeng, where
Qeng and
Ωeng are respectively the diesel engine torque and rotating speed, and
Qp and Ω are respectively the propeller torque and rotating speed (
Figure 4). The diesel engine is represented by the dynamic model given in [
19].
For simplicity, and because there are strong uncertainties in the propeller characteristics, the Voight Schneider propeller is replaced by a classical one. It is assumed that this modification will not affect the dynamic behavior of the system. The parameters used for the dynamic simulation of the classical propulsion are given in
Table 3. A schematic representation of the conventional energy chain model is presented in
Figure 4. Only the propulsion is simulated; the diesel generator is not considered.
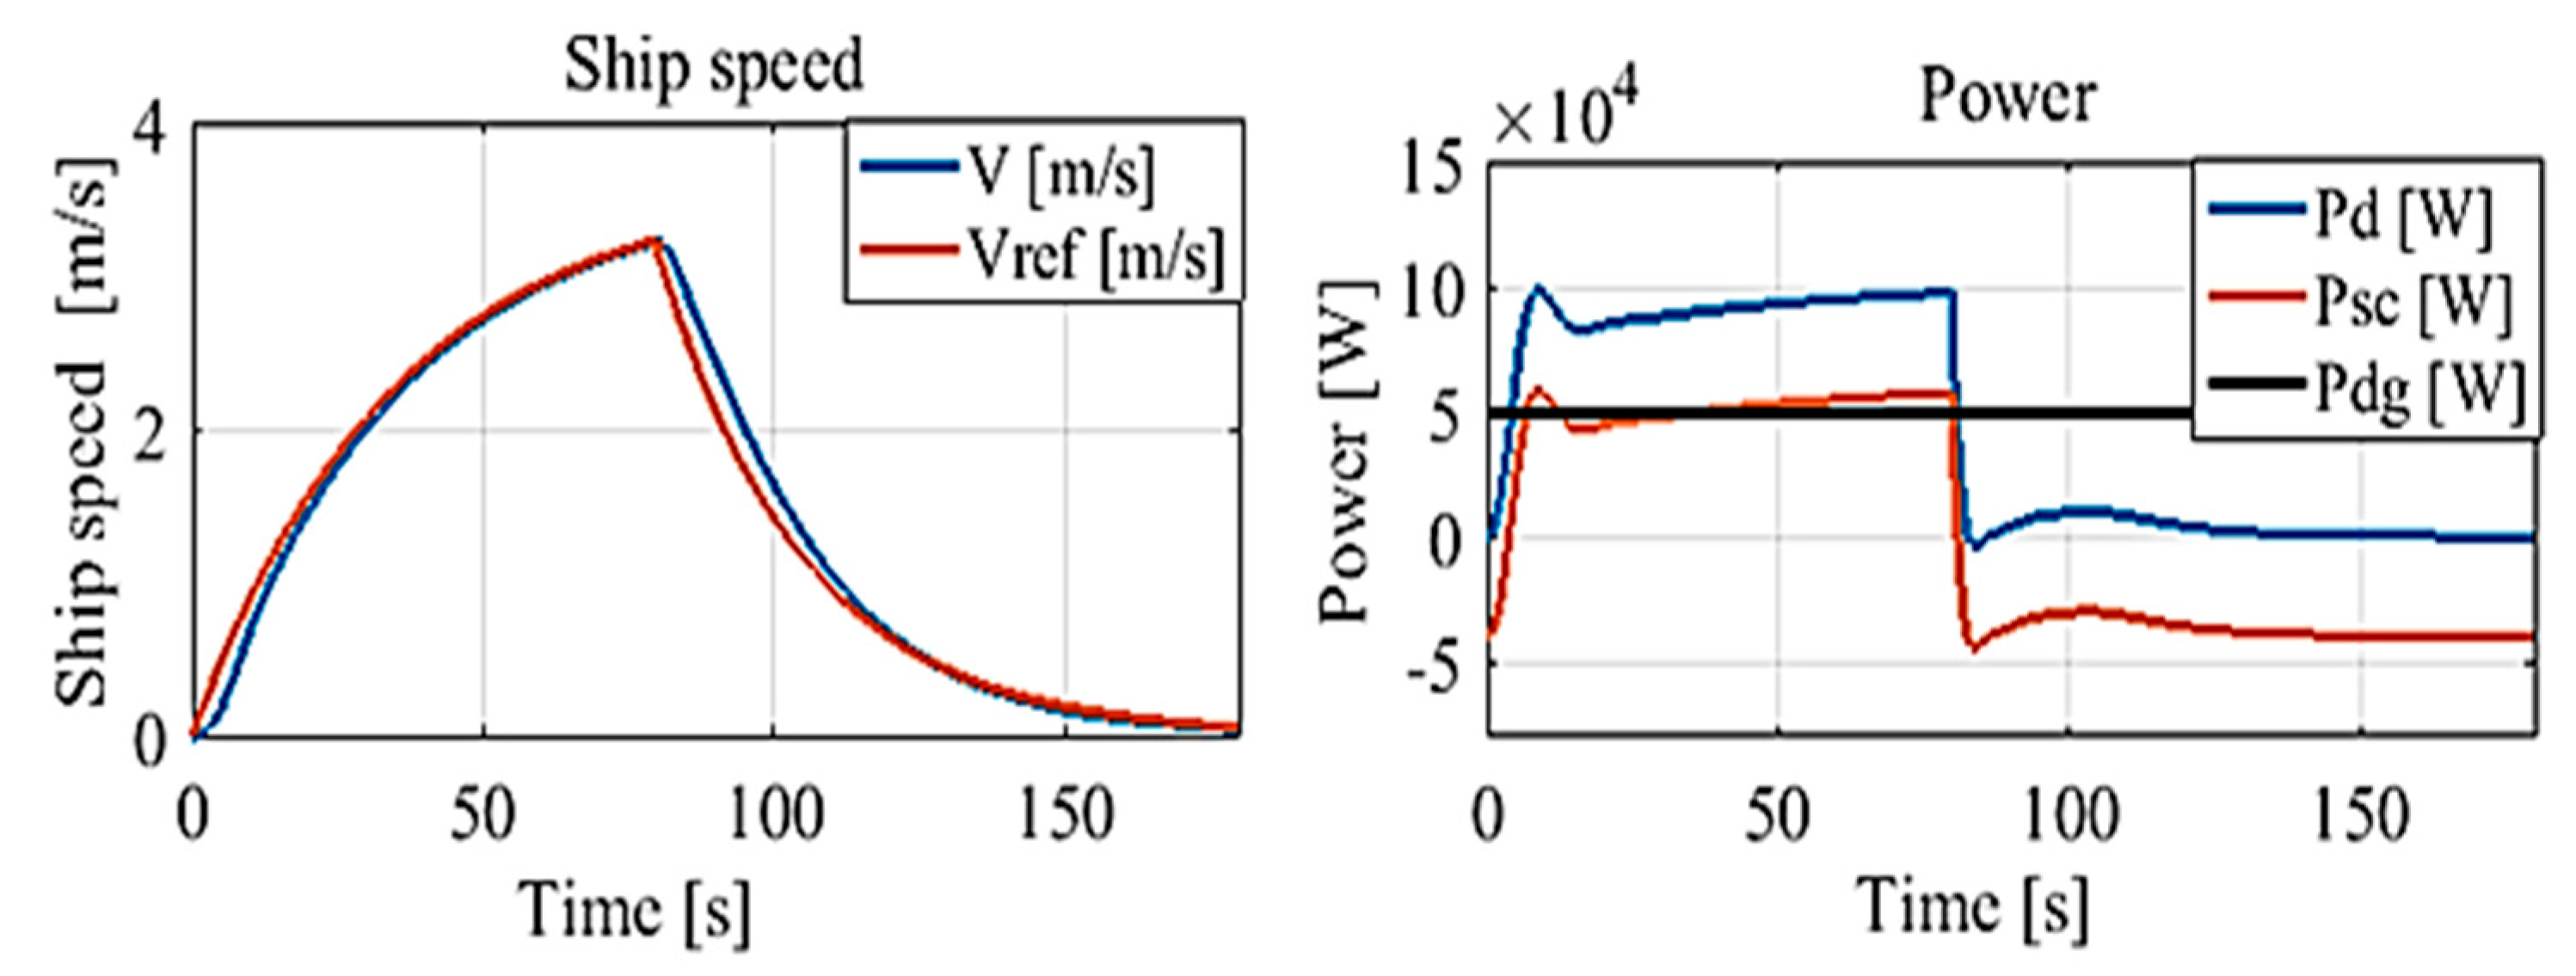
The fitted ship speed (
Figure 3) is used as reference. The simulation results are given in
Figure 5. The power developed by the diesel engine increases rapidly until it stabilizes around 100 kW. Then, during the deceleration phase, the propeller shaft speed decreases and becomes negative (astern thrust). The torque becomes negative, which indicates that we are in the braking mode. The maximum power reached in this phase is around 30 kW.
5. Electrification of the Propulsion
The objective of this part is the study and analysis of the different possibilities of electrification of the propulsion considering the mission profile (operating cycle and daily operation). The strategy adopted is to centralize the production of the energy needed for propulsion and auxiliaries.
Considering the power levels and the constraints on the available space in the ship, only serial hybridization architectures are studied. The proposed solutions consist of keeping the existing diesel generator (DG) used in the initial design for inboard electricity production which is characterized by a maximum power
Pdg_max = 50 kW. Complementary electrical storage elements are introduced and associated with this DG to meet the global needs (propulsion and auxiliary needs). The diesel propulsion engines are replaced by electric motors (
Figure 6). The 50 kW DG can produce on a cycle of 200 s, an amount of energy of 2.77 kWh. Even though the DG produces sufficient energy on a cycle, its rated power is much lower than the instantaneous maximal power demand. This is why an energy storage element (ESS) is added to the system. The ESS specific power must be greater or equal to the difference between the maximum power demanded and the DG power. Its specific energy depends on the used charging strategy.
Regardless of charging time, the specific power of the storage element (
PESS_max) is calculated according to the maximum equivalent electric power needed by the propulsion (
Pm), the power demands on board which are considered constant here (
Pb), and the maximal (rated) power of the diesel generator (
Pdg_max). The power consumed on board in the new structure is considered constant and set to 10 kW (
Pb = 10 kW). Neglecting the losses in the electric motor and converter set, the specific power and energy for a cycle of the storage elements are evaluated as follows considering that a maximal power is needed during the acceleration phase of 80 s (as shown in
Figure 5c):
The storage elements envisaged are batteries and supercapacitors (SCs). These are very complementary: the SCs, thanks to their large specific powers, can serve as short term buffer storage during peak power production, while the batteries, thanks to their high energy densities, are capable of ensuring the autonomy of the system in a longer term. A combination of the two elements is therefore ideal. However, for economic reasons and for the simplicity of power management, only the following configurations are considered in this study:
For each solution, after sizing of the different elements and the development of the power management strategy, considering the ship mission and its constraints, a simulation was performed and an analysis of the different results are presented. A multicriteria comparative study of these solutions was then carried out to select the best solution.
5.1. Power Management Strategy
The power management strategy, described in
Figure 7, is the same for the SH_DG-SC and the SH_DG-Bat solutions. The difference between these solutions is in the strategy of the ESS recharging.
Four possible operating zones are defined depending on the instantaneous power demand, Pd, and the ESS state of charge, SOC.
In the first zone (area 1 in
Figure 6), the power demand is lower than rated power of the DG and the ESS is not fully charged. The DG provides the power demand and allows the ESS charging:
In a second zone (area 2 in
Figure 6) the ESS is fully charged and the power demand is lower than that of the DG. In this case, DG provides only the power demand:
In a third zone (area 3 in
Figure 6), the power demand is greater than that of the DG and the ESS state of charge is lower than the minimum required (
SOCmin). This is a degraded mode which has to be avoided as much as possible. Indeed, in this case all the power demands are not satisfied, and DG operates at its rated power to provide only a part of the power demand. The propulsion system, in this case, will work at a power lower than the reference power. Finally, in the last zone (area 4 in
Figure 6) the power demand is greater than that of the DG, and the
ESS state of charge allows a combination of both sources to provide the required power:
5.2. Case of the Supercapacitor Based on Hybrid Solution
In the case of use of supercapacitors, one recharge per cycle (trip) is possible thanks to their high power density and their large number of possible charge–discharge cycles. The supercapacitors can be charged during dockside stop times or during the navigation when the total power requested is less than the power of the DG. The use of the DG is preferred, and the ESS is kept loaded as much as possible to be able to face strong power calls.
The sizing of the SC ESS consists in determining the numbers of elements that are necessary to store the energy and to satisfy the maximum power demanded. It is assumed that the SCs admit the same maximum power in charge and in discharge modes. For optimal use of SCs, an operating range between 25% and 100% of their SOC is fixed in order to keep a minimal level of voltage and to avoid oversizing the power converters (the use of too low a voltage would lead to high currents).
Among the technologies available, the 48 V Maxwell’s DuraBlue supercapacitors module for hybrid vehicles are selected for this application [
20]. Based on this choice, the SC ESS sizing results are given in
Table 4.
The simulation results are presented in the
Figure 8. It can be seen that during the acceleration phase, power demand is provided by both sources, with the peak power provided by the SC. The negative part of the SC power corresponds to the recharging mode. The cycle duration is sufficient to recover the energy provided by the SC.
5.3. Case of the Batteries Based on Hybrid Solution
The sizing of the batteries must satisfy the power demand (Equation (4)) and various environmental constraints, such as space requirements. Battery life is also strongly affected by the number of charge and discharge cycles and the
SOC [
21]. To extend the battery life, the recharging should only be carried out after several operating cycles, while maintaining a minimum state of charge (
SOCmin). Plug-in recharging during docking (via the power grid) is done during the night, when the boat is not in service (full recharging), and during additional partial recharge phases during the 30 min stops (after 40 trips). If necessary, in order to reduce the amount of batteries required, other recharges can be carried out during the dockside stop times in some trips. Lithium-ion batteries are chosen. The results of the batteries sizing are given in
Table 5, and their recharging strategy is illustrated in
Figure 9.
The simulation results are presented in
Figure 10 for one single trip. During the acceleration, the power demand is provided by both sources, with the peak provided by the batteries. The state of charge of the batteries decreases by 0.76% for one trip, which allows satisfying the recharging strategy shown in
Figure 9.
5.4. Global Performance Results and Discussion
From simulations, the consumption in the proposed mission profiles and then in the lifetime (20 years) of the ship are evaluated. Hybridization lead to a substantial reduction in the fuel consumption compared to the conventional chain. The SH_DG-SC solution leads to a reduction of about 18% of fuel consumption, while it is about 40% for the SH_DG-Bat structure thanks to dockside charging. The CO
2 emissions are reduced by the same proportions. However, one has to consider the CO
2 emissions related to the remote production of the electrical energy supplying the ESS in the dock (remote CO
2 emission). The considered CO
2 emission factors are 2.6 kg/L for the fuel and 0.25 kg/kWh for the remote CO
2 emissions [
22,
23]. With these considerations, a reduction of around 382 tons (18%) is obtained for the SH_DG-SC chain, against 626 tons (29.7%) for the SH_DG-Bat chain, during 20 years of operation.
Leading to a lower mass and volume requirements and, in particular, to lower investments costs (no additional infrastructures at the dock and greater lifetime), the SH_DG-SC seems to be the most relevant choice in our case. However, the evolution of battery technologies may reverse this trend in the future.
6. Conclusions
The total or partial electrification of the ship’s propulsion chains leads to a significant reduction in chemical pollutant emissions. It is envisaged in a large part of future ships and must be considered from the construction phase, considering space and volume constraints as well as the mission profile of each ship. In this context, the electrification of low tonnage ships, with short operating cycles and high-power demands, which leads to real technical challenges, has been studied in this work. In this particular application, integrating high power and energy density components is challenging. This is why the recycling of small vessels designed with conventional propulsions is not obvious due to the lack of available space to set up the supplementary electrical elements related to hybrid configuration. A real test case, concerning a Seine river ferry with an installed propulsive power of 330 KW, has been considered for which theoretical and experimental approaches have been coupled with some simplifying hypotheses due to the uncertainties on some parameters and navigational conditions. Supercapacitor- and battery-based hybrid structures have been compared to the conventional one. They lead respectively to 18% and 29.7% of CO2 reduction compared to the classical propulsion representing, respectively, about 382 and 626 tons of CO2 reduction in 20 years of operation. Despite the fact that a more significant reduction in CO2 emissions is obtained with the use of batteries, the solution using supercapacitors is chosen following a technical-economic study over 20 years of operation. The study is obviously far from being exhaustive because we have considered only the CO2 emissions, and the ecological costs of producing the electrical components are ignored.
Author Contributions
Conceptualization, N.B., H.M., J.-F.C. and J-Y.B.; methodology, N.B., H.M., J.-F.C. and J-Y.B.; software, N.B.; validation, N.B., H.M., J.-F.C., J.-Y.B. and B.N.; formal analysis, N.B., H.M., J.-F.C. and J.-Y.B.; investigation, N.B., H.M., J.-F.C. and J.-Y.B.; writing—original draft preparation, N.B., H.M., J.-F.C. and J.-Y.B.; writing—review and editing, N.B., H.M., J.-F.C. and J.-Y.B.; visualization, N.B., H.M. and J.-F.C. and J.-Y.B.; supervision, H.M., J.-F.C., J.-Y.B. and B.N.; project administration, J.-Y.B. and B.N. All authors have read and agreed to the published version of the manuscript.
Funding
The research was funded by French National Association for Technological Research (ANRT) and SEGULA Technology company, 76600 Le Havre, France under an Industrial Convention for Education through Research (CIFRE).
Institutional Review Board Statement
This study does not involve humans or animals.
Informed Consent Statement
Not applicable.
Data Availability Statement
Not applicable.
Conflicts of Interest
The authors declare no conflict of interest.
Nomenclature
| Cq, Ct | The four quadrant torque and thrust coefficients |
| D | Diameter of the propeller (m) |
| f | Coefficient of viscous friction (kg/s) |
| I | Moment of inertia of the rotating parts (kg.m2) |
| Kred | Gearbox coefficient (-) |
| M | Ship mass (kg) |
| Pb | Power demands on board (kW) |
| Pd | Propulsion power demand (kW) |
| Pm | Maximal propulsion power demand (kW) |
| Pdg | Power of the diesel generator (kW) |
| Pdg_max | Rated power of the diesel generator (kW) |
| Peng | Power of the diesel engine (kW) |
| PESS | Power of the storage element (kW) |
| PESS_max | Specific power of the storage element (kW) |
| P/D | Ratio between the number of blades and the diameter of the propeller (-) |
| Qeng | Torque developed by the diesel engine (N·m) |
| Qp | Torque developed by the propeller (N·m) |
| SOC | Starte of charge of the storage element (%) |
| SOCmax | Higher state of charge of storage element (%) |
| SOCmin | Lower state of charge of storage element (%) |
| Tp | Propeller thrust (N) |
| tsuccion | Suction coefficient (-) |
| v | Ship speed (m/s) |
| vm | Maximal value of the speed [m/s] |
| w | Wake coefficient (-) |
| τ | Ship time constant (s) |
| ηp | Efficiency of the thruster (-) |
| ηred | Gearbox efficiency (%) |
| Ω | Propeller rotating speed (rad/s) |
| Ωeng | Diesel engine rotating speed (rad/s) |
References
- Trieste, S.; Hmam, S.; Olivier, J.-C.; Bourget, S.; Loron, L. Techno-economic optimization of a supercapacitor-based energy storage unit chain: Application on the first quick charge plug-in ferry. Appl. Energy 2015, 153, 3–14. [Google Scholar] [CrossRef]
- International Maritime Organisation Website. Available online: https://www.imo.org (accessed on 6 May 2021).
- Li, D. Real-Time Simulation of Shipboard Power System and Energy Storage Device Management. Ph.D. Thesis, Kansas State University, Manhattan, KS, USA, 2014. [Google Scholar]
- Baldi, F. Modelling, Analysis and Optimisation of Ship Energy Systems. Ph.D. Thesis, Chalmers University of Technology, Gothenburg, Sweden, 2016. [Google Scholar]
- Bennabi, N.; Charpentier, J.F.; Menana, H.; Billard, J.Y.; Genet, P. Hybrid propulsion systems for small ships: Context and challenges. In Proceedings of the XXII International Conference on Electrical Machines (ICEM), Lausanne, Switzerland, 4–7 September 2016. [Google Scholar]
- Barelli, L.; Bidini, G.; Gallorini, F.; Iantorno, F.; Pane, N.; Ottaviano, P.A.; Trombetti, L. Dynamic Modeling of a Hybrid Propulsion System for Tourist Boat. Energies 2018, 11, 2592. [Google Scholar] [CrossRef]
- De Breucker, S.; Peeters, E.; Driesen, J. Possible applications of plug-in hybrid electric ship. In Proceedings of the IEEE Electric Ship Technol. Symposium, Baltimore, MD, USA, 20–22 April 2009. [Google Scholar]
- Lhomme, W.; Trovao, J.P. Zero-emission casting-off and docking maneuvers for series hybrid excursion ships. Energy Convers. Manag. 2019, 184, 427–435. [Google Scholar] [CrossRef]
- Dupriez-Robin, F. Dimensionnement D’une Propulsion Hybride de Voilier, Base Sur la Modélisation Par les Flux de Puissance. Ph.D. Thesis, University of Nantes, St Nazaire, France, 2010. (In French). [Google Scholar]
- Bennabi, N.; Codja, K.; Menana, H.; Charpentier, J.F.; Billard, J.-Y.; Lhomme, W.; Nottellet, B. Energetic macroscopic representation of series hybrid and electric propulsion ships. In Proceedings of the ELECTRIMACS Conference, Toulouse, France, 4–6 July 2017. [Google Scholar]
- Bennabi, N.; Charpentier, J.-F.; Billard, J.-Y.; Menana, H.; Nottelet, B. Modeling and Simulation of a Series Hybrid Propulsion Chain for Small Ships. In Proceedings of the Vehicle Power and Propulsion Conference (IEEE-VPPC), Belfort, France, 11–14 December 2017. [Google Scholar]
- Bennabi, N.; Charpentier, J.-F.; Billard, J.-Y.; Menana, H.; Nottelet, B. Evaluation of Recovery Braking Capacities on Electric Vessel. In Proceedings of the XIII International Conference on Electrical Machines (ICEM), Alexandroupoli, Greece, 3–6 September 2018. [Google Scholar]
- Geertsma, R.D.; Negenborn, R.R.; Visser, K.; Hopman, J.J. Design and control of hybrid power and propulsion systems for smart ships: A review of developments. Appl. Energy 2017, 194, 30–54. [Google Scholar] [CrossRef]
- Letafat, A.; Rafiei, M.; Sheikh, M.; Afshari-Igder, M.; Banaei, M.; Boudjadar, J.; Khooban, M.H. Simultaneous energy management and optimal components sizing of a zero-emission ferry boat. J. Energy Storage 2020, 28. [Google Scholar] [CrossRef]
- Nuchturee, C.; Li, T.; Xia, H. Energy efficiency of integrated electric propulsion for ships—A review. Renew. Sustain. Energy Rev. 2020, 134. [Google Scholar] [CrossRef]
- Georgescu, I.; Godjevac, M.; Visser, K. Efficiency constraints of energy storage for on-board power systems. Ocean Eng. 2018, 162, 239–247. [Google Scholar] [CrossRef]
- Karimi, B.S.; Zadeh, M.; Suul, J.A. Shore Charging for Plug-In Battery- Powered Ships. IEEE Electrif. Mag. 2020, 8, 47–61. [Google Scholar] [CrossRef]
- Seine Maritime Area Website. Available online: www.seinemaritime.fr (accessed on 6 May 2021).
- Rezkallah, M. Amélioration de la Qualité D’énergie Fournie au Réseau Autonome Hybride Eolien-Diesel. Ph.D. Thesis, ETS, Quebec University, Montréal, QC, Canada, 2010. [Google Scholar]
- Durablue Datasheet. Available online: https://www.maxwell.com/images/documents/48V_ds_DuraBlue_3000685_4.pdf (accessed on 6 May 2021).
- Powertech Website. Available online: https://www.powertechsystems.eu (accessed on 6 May 2021).
- EDF Website. Available online: https://www.edf.fr/en/meta-home (accessed on 6 May 2021).
- Ådnanes, A.K. Maritime Electrical Installations and Diesel Electric Propulsion. Tutorial Report. ABB Marine. 2003. Available online: https://www.semanticscholar.org/paper/Maritime-Electrical-Installations-And-Diesel-Adnanes/a6706d7888103b210d2c099a3eceb6f411e21de5 (accessed on 4 June 2021).
| Publisher’s Note: MDPI stays neutral with regard to jurisdictional claims in published maps and institutional affiliations. |
© 2021 by the authors. Licensee MDPI, Basel, Switzerland. This article is an open access article distributed under the terms and conditions of the Creative Commons Attribution (CC BY) license (https://creativecommons.org/licenses/by/4.0/).


 ,
, 


