Article

Analysis of Seismic Damage Zones: A Case Study of the Ordovician Formation in the Shunbei 5 Fault Zone, Tarim Basin, China

1
School of Energy Resources, China University of Geosciences, Beijing 100083, China
2
Key Laboratory for Marine Reservoir Evolution and Hydrocarbon Abundance Mechanism, Ministry of Education, China University of Geosciences, Beijing 100083, China
3
Beijing Key Laboratory of Unconventional Natural Gas Geology Evaluation and Development, China University of Geosciences, Beijing 100083, China
4
Key Laboratory of Strategy Evaluation for Shale Gas, Ministry of Natural Resources of the People’s Republic of China, China University of Geosciences, Beijing 100083, China
5
SINOPEC Northwest Oilfield Company, Urumqi 830002, China
6
Sinopec Petroleum Exploration and Production Research Institute, Beijing 100083, China
*
Author to whom correspondence should be addressed.
J. Mar. Sci. Eng. 2021, 9(6), 630; https://doi.org/10.3390/jmse9060630
Submission received: 27 April 2021 / Revised: 15 May 2021 / Accepted: 3 June 2021 / Published: 6 June 2021
(This article belongs to the Section Geological Oceanography)

Abstract

:
Fault damage zone has an important influence on subsurface fluid flow and petrophysical properties. Therefore, it is of great significance to study the characteristics of fault damage zone for oil and gas development of ultra-deep carbonate formation. This study uses seismic data and the derived variance attribute to identify two types of damage zones and analyze the spatial geometric characteristics of the damage zones. The results show that the type 1 damage zone is wider than the type 2 damage zone. The width of damage zones distributed on both sides of the Shunbei 5 fault core shows obvious asymmetry, and the damage zone width and throw conforms to the typical power-law distribution on the log-log plot. We discuss the factors affecting the width of the damage zone and its formation process. Finally, we discuss the influence of the damage zones on oil and gas exploration. It seems that the seismic variance attribute is a useful technique for characterizing the ultra-deep strike-slip fault damage zones.

1. Introduction

In recent years, a large number of field observations have shown that the fault zone is mainly composed of a narrow fault core and wide damage zone (Figure 1) [1,2]. The fault core is the place where the displacement of the fault is concentrated, and the stratigraphy has experienced strong structural deformation. The fault core is usually composed of fault gouge and breccias. The damage zone is immediately adjacent to the fault core and usually develops multiple groups of fractures and secondary faults [3,4]. The damage zone is the product of the formation rheology and displacement on faults. Due to the complex fracture network within damage zones, the geometry size and architecture of damage zones have a significant effect on the migrations, and accumulation of subsurface fluids [5,6]. Therefore, the characterization of the structure and geometry of the damage zone is of great significance to evaluating the integrity of waste-disposal sites and CO2 sequestration sites, and the exploitation of hydrocarbon in the areas that include the damage zone [1]. In the past, different methods were used to describe the damage zone at different positions. For the damage zone exposed to the surface, the functional relationship between the fracture density and the distance to the fault core was established to characterize the geometric characteristics of the damage zone [7]. Lin et al. made a field survey on active strike-slip fault damage zones with granite and rhyolitic tuff in southwest Japan and determined the width of the fault damage zone of different scales [8]. Nevertheless, the characterization of the underground damage zone mainly depends on geophysical logging, numerical simulation, seismic data, and analog models [9]. Lyu et al. used conventional logs and imaging logs to characterize the tight sandstone fracture zone in the upper Permian in southwest Ordos Basin, China, and analyzed the logging response characteristics of the tight sandstone damage zone [10]. With the development of seismic technology, a large number of researchers try to identify and describe the underground fault damage zone by using related seismic technology [11,12,13,14]. Botter et al. established discrete element models to simulate fracture zones of faults with different displacements and simulated the seismic response of fracture zones using ray-based prestack depth migration forward modeling technology [15]. Liao et al. used a variety of different seismic attributes (such as variance, coherence, curvature, etc.) and a clay model to describe the deep underground damage zone [16,17,18]. All the cases mentioned above prove the effectiveness of using seismic data and related attributes to characterize the subsurface fault damage zone.
Recently, the Northwest Oilfield Company (Sinopec) has found high-yield industrial oil and gas flow in the ultra-deep strike-slip fault damage zone in the Shunbei area [19,20,21,22]. However, the yield of oil wells deployed in different segments of the same strike-slip fault zone is quite different, and the characteristics of the fault damage zone in this area lack systematic study. In this paper, firstly, according to the original seismic profile, two structural styles of the Shunbei 5 fault zone are identified, and the geometric characteristics of the fracture zone corresponding to the two structural styles are analyzed by using the seismic variance attribute. Then, based on the fact that it is easier to identify the vertical throw of strike-slip fault from seismic data, we further analyze the relationship between the damage zone width and fault throw and propose a law that describes the evolution of the Shunbei 5 fracture zone in the study area. Finally, the possible effects of the two types of damage zones on the production of oil and gas wells are discussed.

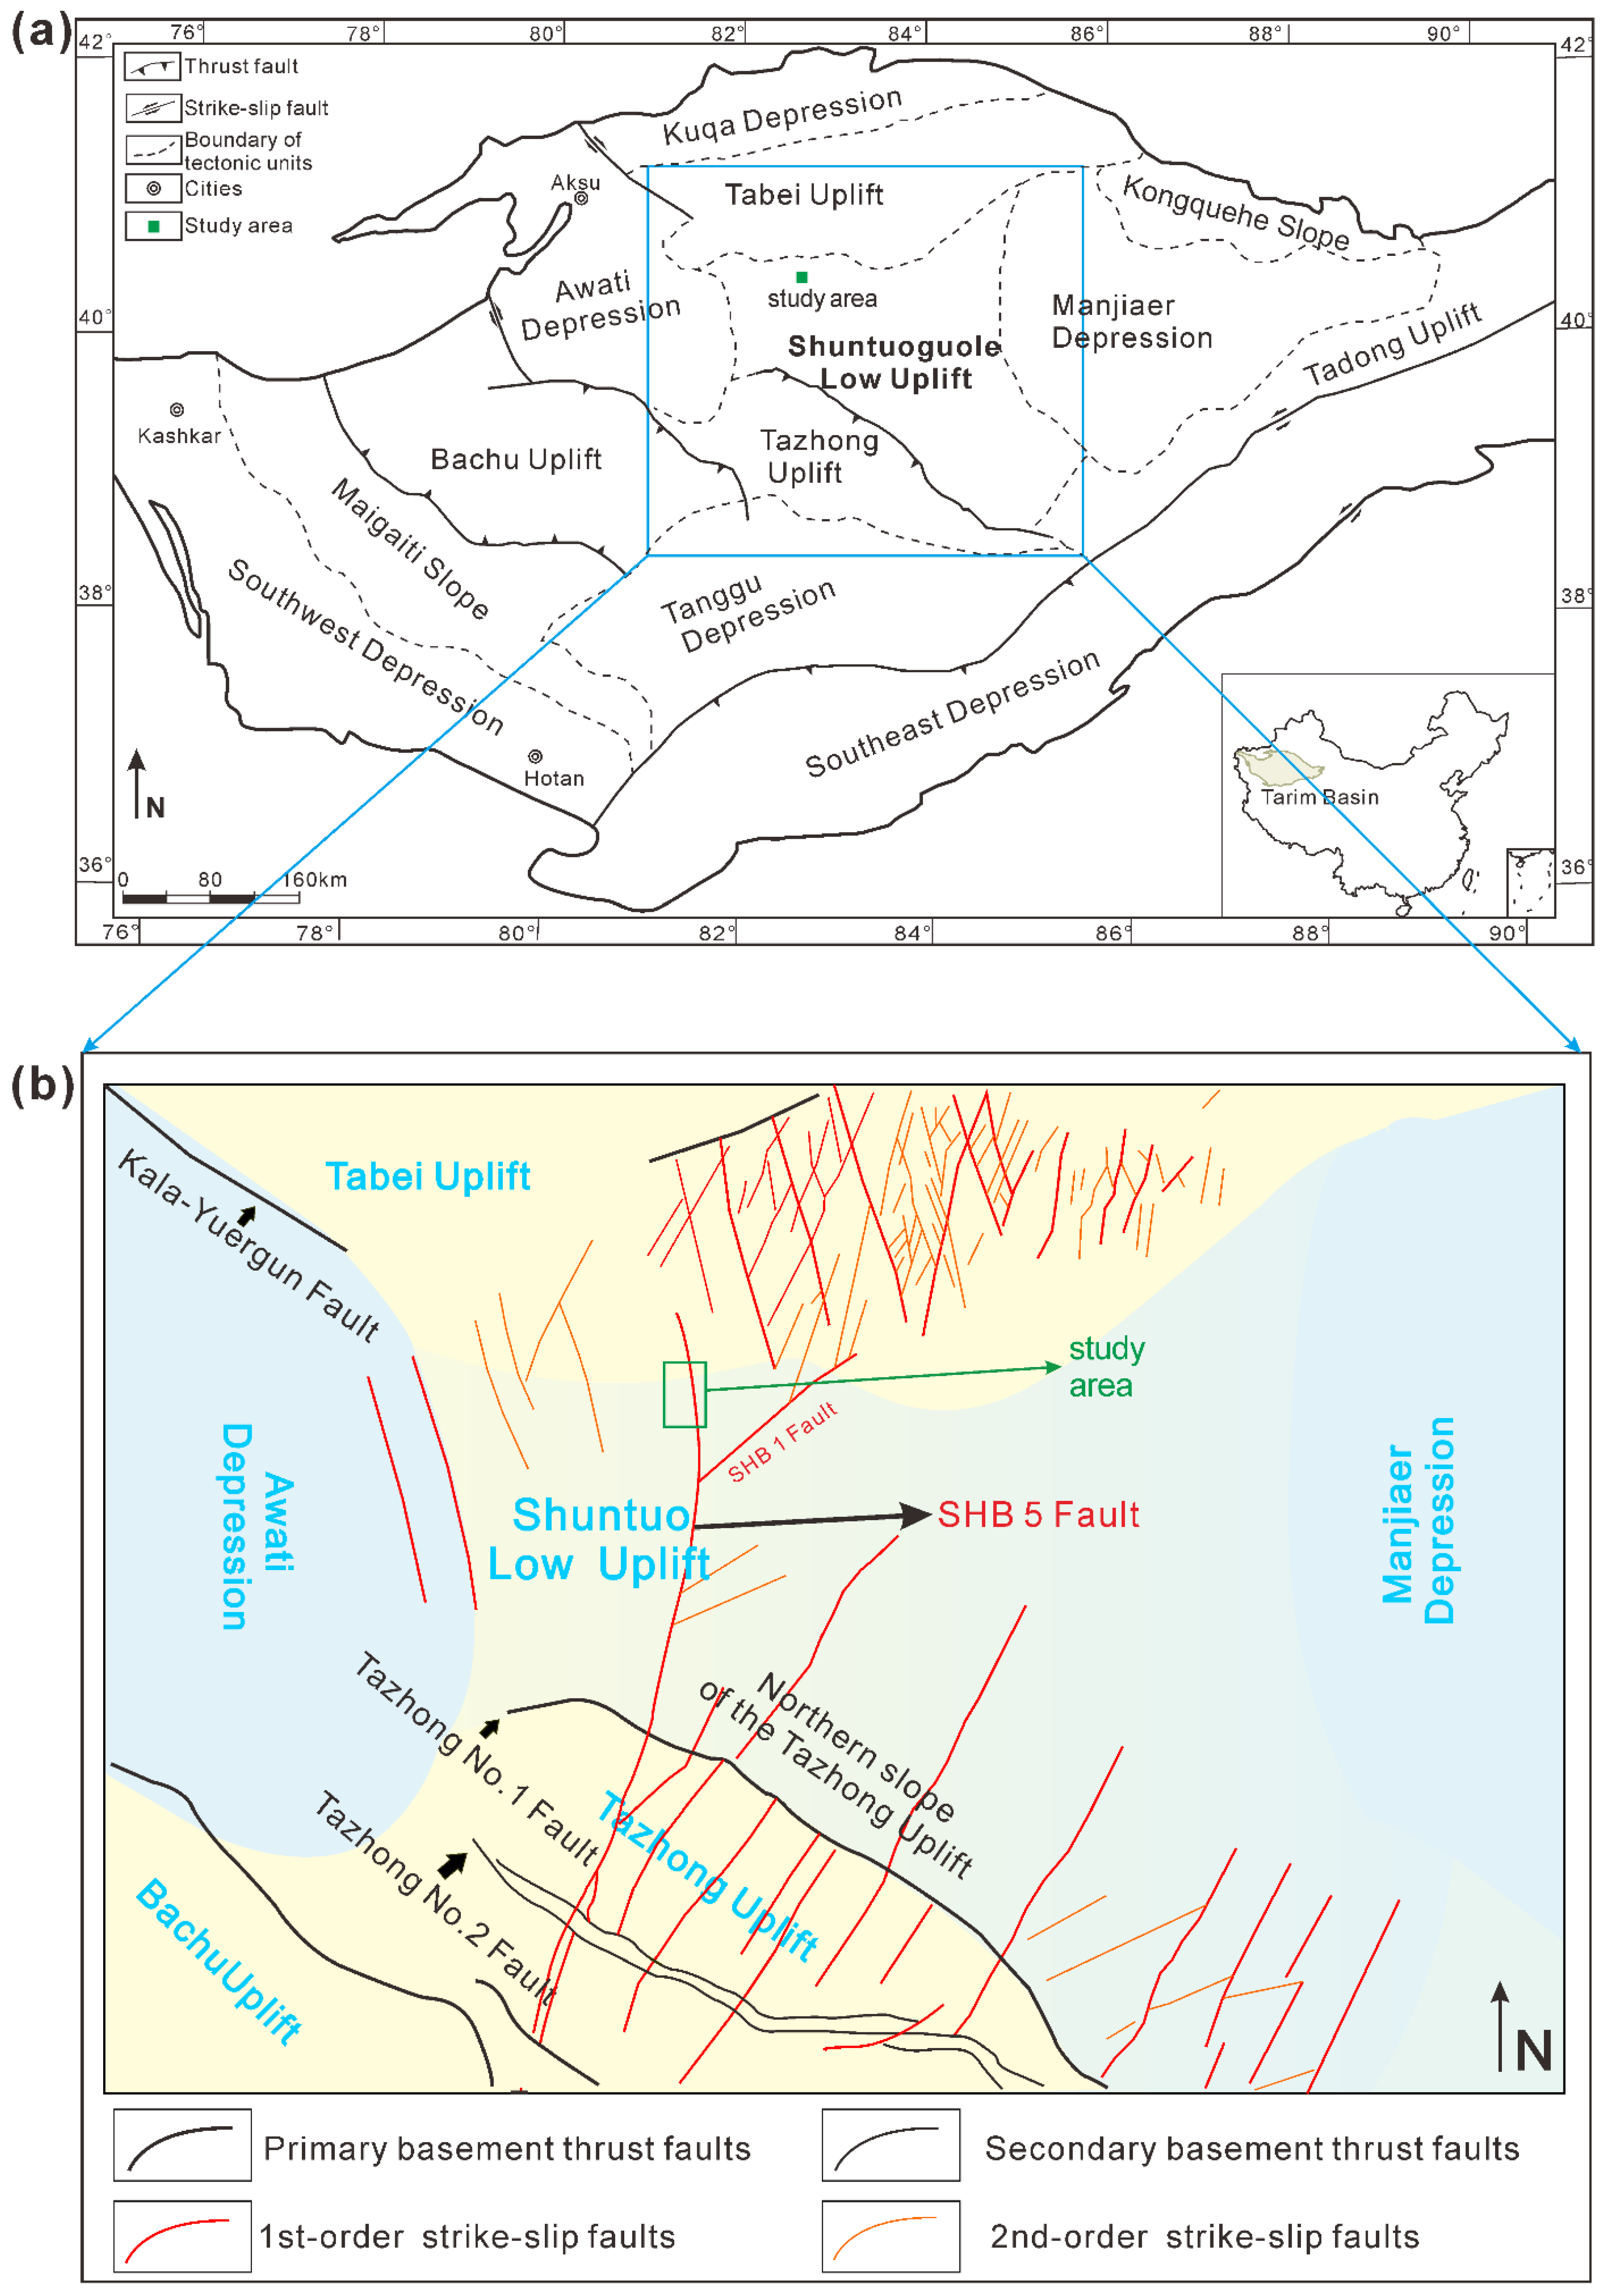
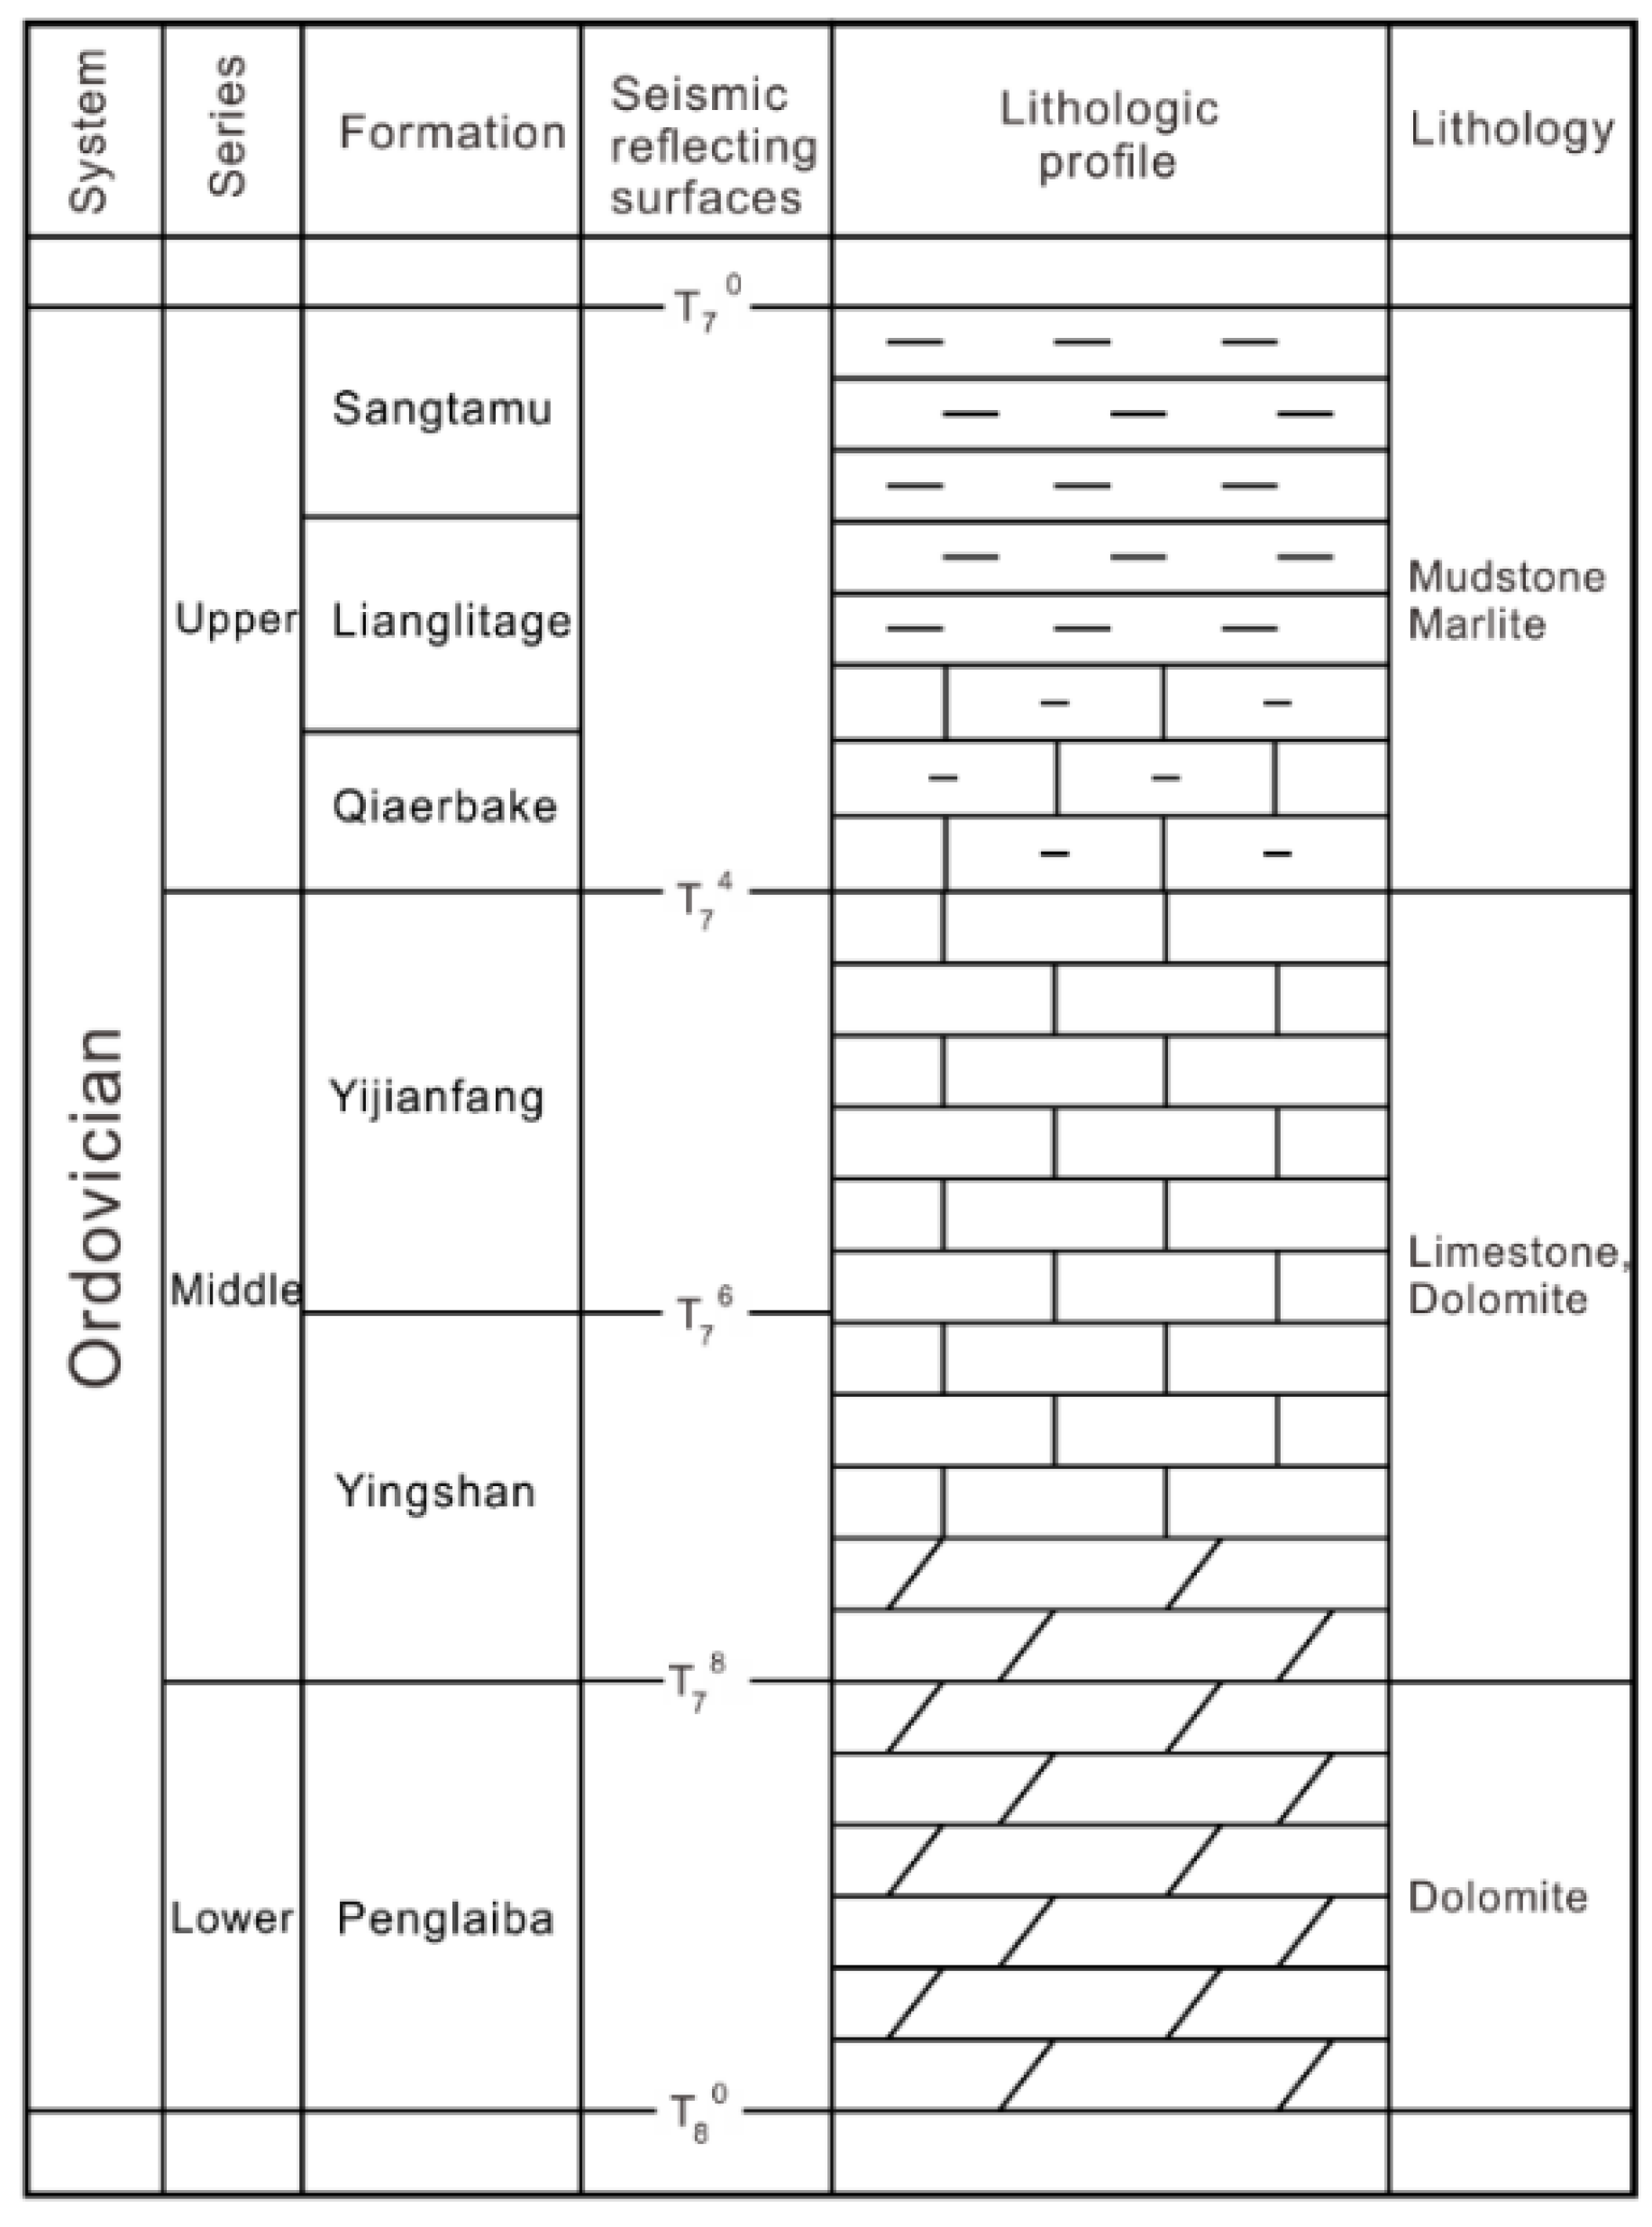
2. Geological Setting

The Shunbei 5 fault zone is located in northern Shuntuo low uplift, which is adjacent to the Tabei Uplift in the north, Tazhong Uplift in the south, Manjiaer Depression in the East, and Awati Depression in the west (Figure 2a,b). The study area has undergone multistage tectonic movements. The main stages of structural evolution are as follows: In the Early Cambrian, due to the rapid tension and rifting around the Tarim plate, the sea level rose rapidly, and the Shuntuo uplift was located in the slope shelf sedimentary facies belt. At this time, the source rocks were widely developed [20]. In the Early Caledonian period, the uplift was high in the northwest and low in the southeast, due to the reverse boundary fault of the uplift. In the middle and late Caledonian, influenced by the closing of the North Kunlun ocean and the subduction of the South Tianshan ocean crust in the south margin of the Tarim Basin, the Tarim Basin is in a tectonic compressive stress environment [23]. In the Hercynian, influenced by the strong orogeny in the south of Tarim Basin, the Shunbei area continued to uplift, and a series of strike-slip faults developed in the uplift. In the Indosinian–Yanshanian period, the Shunbei uplift inherited the structural characteristics of the late Hercynian, and the local faults were further complicated by the influence of the structural movement. The Himalayan tectonic movement is the adjustment and finalization period of low uplift and fault in the study area. Since the Cenozoic, with the rapid uplift of surrounding mountains, the Tarim Basin has continued to subside, but the secondary structural units have remained stable [24].
As shown in Figure 3, the Ordovician strata in the study area are well-developed. According to the drilling data and published literature, the Ordovician strata can be divided into five formations from top to bottom. The upper Ordovician includes Sangtamu Fm., Lianglitage Fm., and Qiarbake Fm., and the lithology is mainly mudstone and marlstone; The middle and lower Ordovician includes Yijianfang Fm., Yingshan Fm., and Penglaiba Fm., and the lithology is mainly carbonate rock. The upper members of Yijianfang Fm. and Yingshan Fm. are limestone developed in open platform facies, and the lower members of Yingshan Fm. and Penglaiba Fm. are dolomite formed in restricted platform facies [25,26]. The middle-lower Ordovician and the upper Ordovician constitute a good reservoir cap assemblage. Oil and gas occur in the carbonate strata of Yijianfang Fm. and Yingshan Formation.

3. Data and Methods

In this study, high-resolution 3-d seismic data covering an area of about 90 Km2 were used to characterize the Shunbei 5 fault zone. The time-migrated seismic data analyzed in this paper was collected by Northwest Oilfield Company (Sinopec) in 2014. The bin size of the observation system used to collect the data is 25 * 25 m, and the frequency range is 10~50 Hz. We used this data to carry out detailed horizon tracking and fault interpretation. According to the structural map of surface T74 (Figure 4a,b), the Shunbei 5 fault zone comprises several NW trending fault segments. On the seismic section, the typical positive flower structure and the near-vertical segment of the Shunbei 5 fault indicate its strike-slip property (Figure 5a,b). Because oil and gas are mainly distributed in the Ordovician strata, we mainly focus on the characteristics of the Ordovician fault damage zone. The Shunbei 5 fault is a strike-slip fault located in the deep underground; the study on the characteristics of its associated damage zones cannot be the same as that of outcrop fault damage zones. At present, the 3D geometry and structural characteristics of the subsurface fault damage zone are mainly revealed by drilling data and seismic data. In order to clarify the geometric and structural characteristics of the damage zone of the Shunbei 5 fault, the geological horizon on the seismic profile is calibrated by using a seismic well tie, and horizon tracking and fault interpretation are carried out on this basis. Three seismic reflection surfaces are traced, which are the top surface (T70), the Middle surface (T74), and the bottom surface (T80) of the Ordovician strata. Due to the limitation of the resolution of seismic data, it is a challenge to accurately describe the 3D structure characteristics of the deep underground fault damage zone. However, recent studies have shown that it is an effective and feasible method to analyze the characteristics of underground fault damage zone by using seismic amplitude data and its derived seismic attributes [17,18].
Then, we choose the seismic variance reflecting the discontinuities in the horizontal continuity of amplitude to characterize the geometric and structural characteristics of the damage zone. The calculation method of seismic variance volume is similar to that used by Liao et al. [18]. In the calculation of variance volume, the length of the filter is 3 ∗ 3 in the inline and crossline, and 15 samples in the vertical direction are used as smooth filtering parameters. Based on the characteristics of the seismic section and map variance property, we have identified two typical structural patterns in the study area, namely, type 1 and type 2 (Figure 6). Previous studies have shown that the width of the damage zone is different, due to the different formation processes or overlapping mode of fault [1,27]. To analyze the characteristics of the damage zone corresponding to the two typical structural styles in this area, the variance extracted along the surface (T74) is selected. In the direction perpendicular to the strike of the Shunbei 5 fault, a total of 17 sampling lines are arranged with an interval of 500 m (Figure 4a). Then, the geometric characteristics of the two typical fault zones are analyzed by using the variance values extracted from these sampling lines (Figure 7). Besides, to analyze the various characteristics of the damage zone width in the depth direction, L4 and L8 profiles are selected as the representatives of the two types of damage zones, and a set of variance values are obtained every 100 ms from 4300 ms to 5300 ms. Then, we interpreted these fracture zones at different depths according to the variance value and plotted the damage zone width versus depth (Figure 8). Finally, because it is difficult to determine the horizontal displacement of deep strike-slip fault, to further explore the formation mechanism and evolution process of the Shunbei 5 fault, we made a statistical analysis on the throw and fracture zone width of the Shunbei 5 fault (Figure 9). The throw of Shunbei 5 main fault is measured on seismic profiles, and the scaling relationship between the vertical throw and the width of damage zones is analyzed (Figure 10).

4. Results

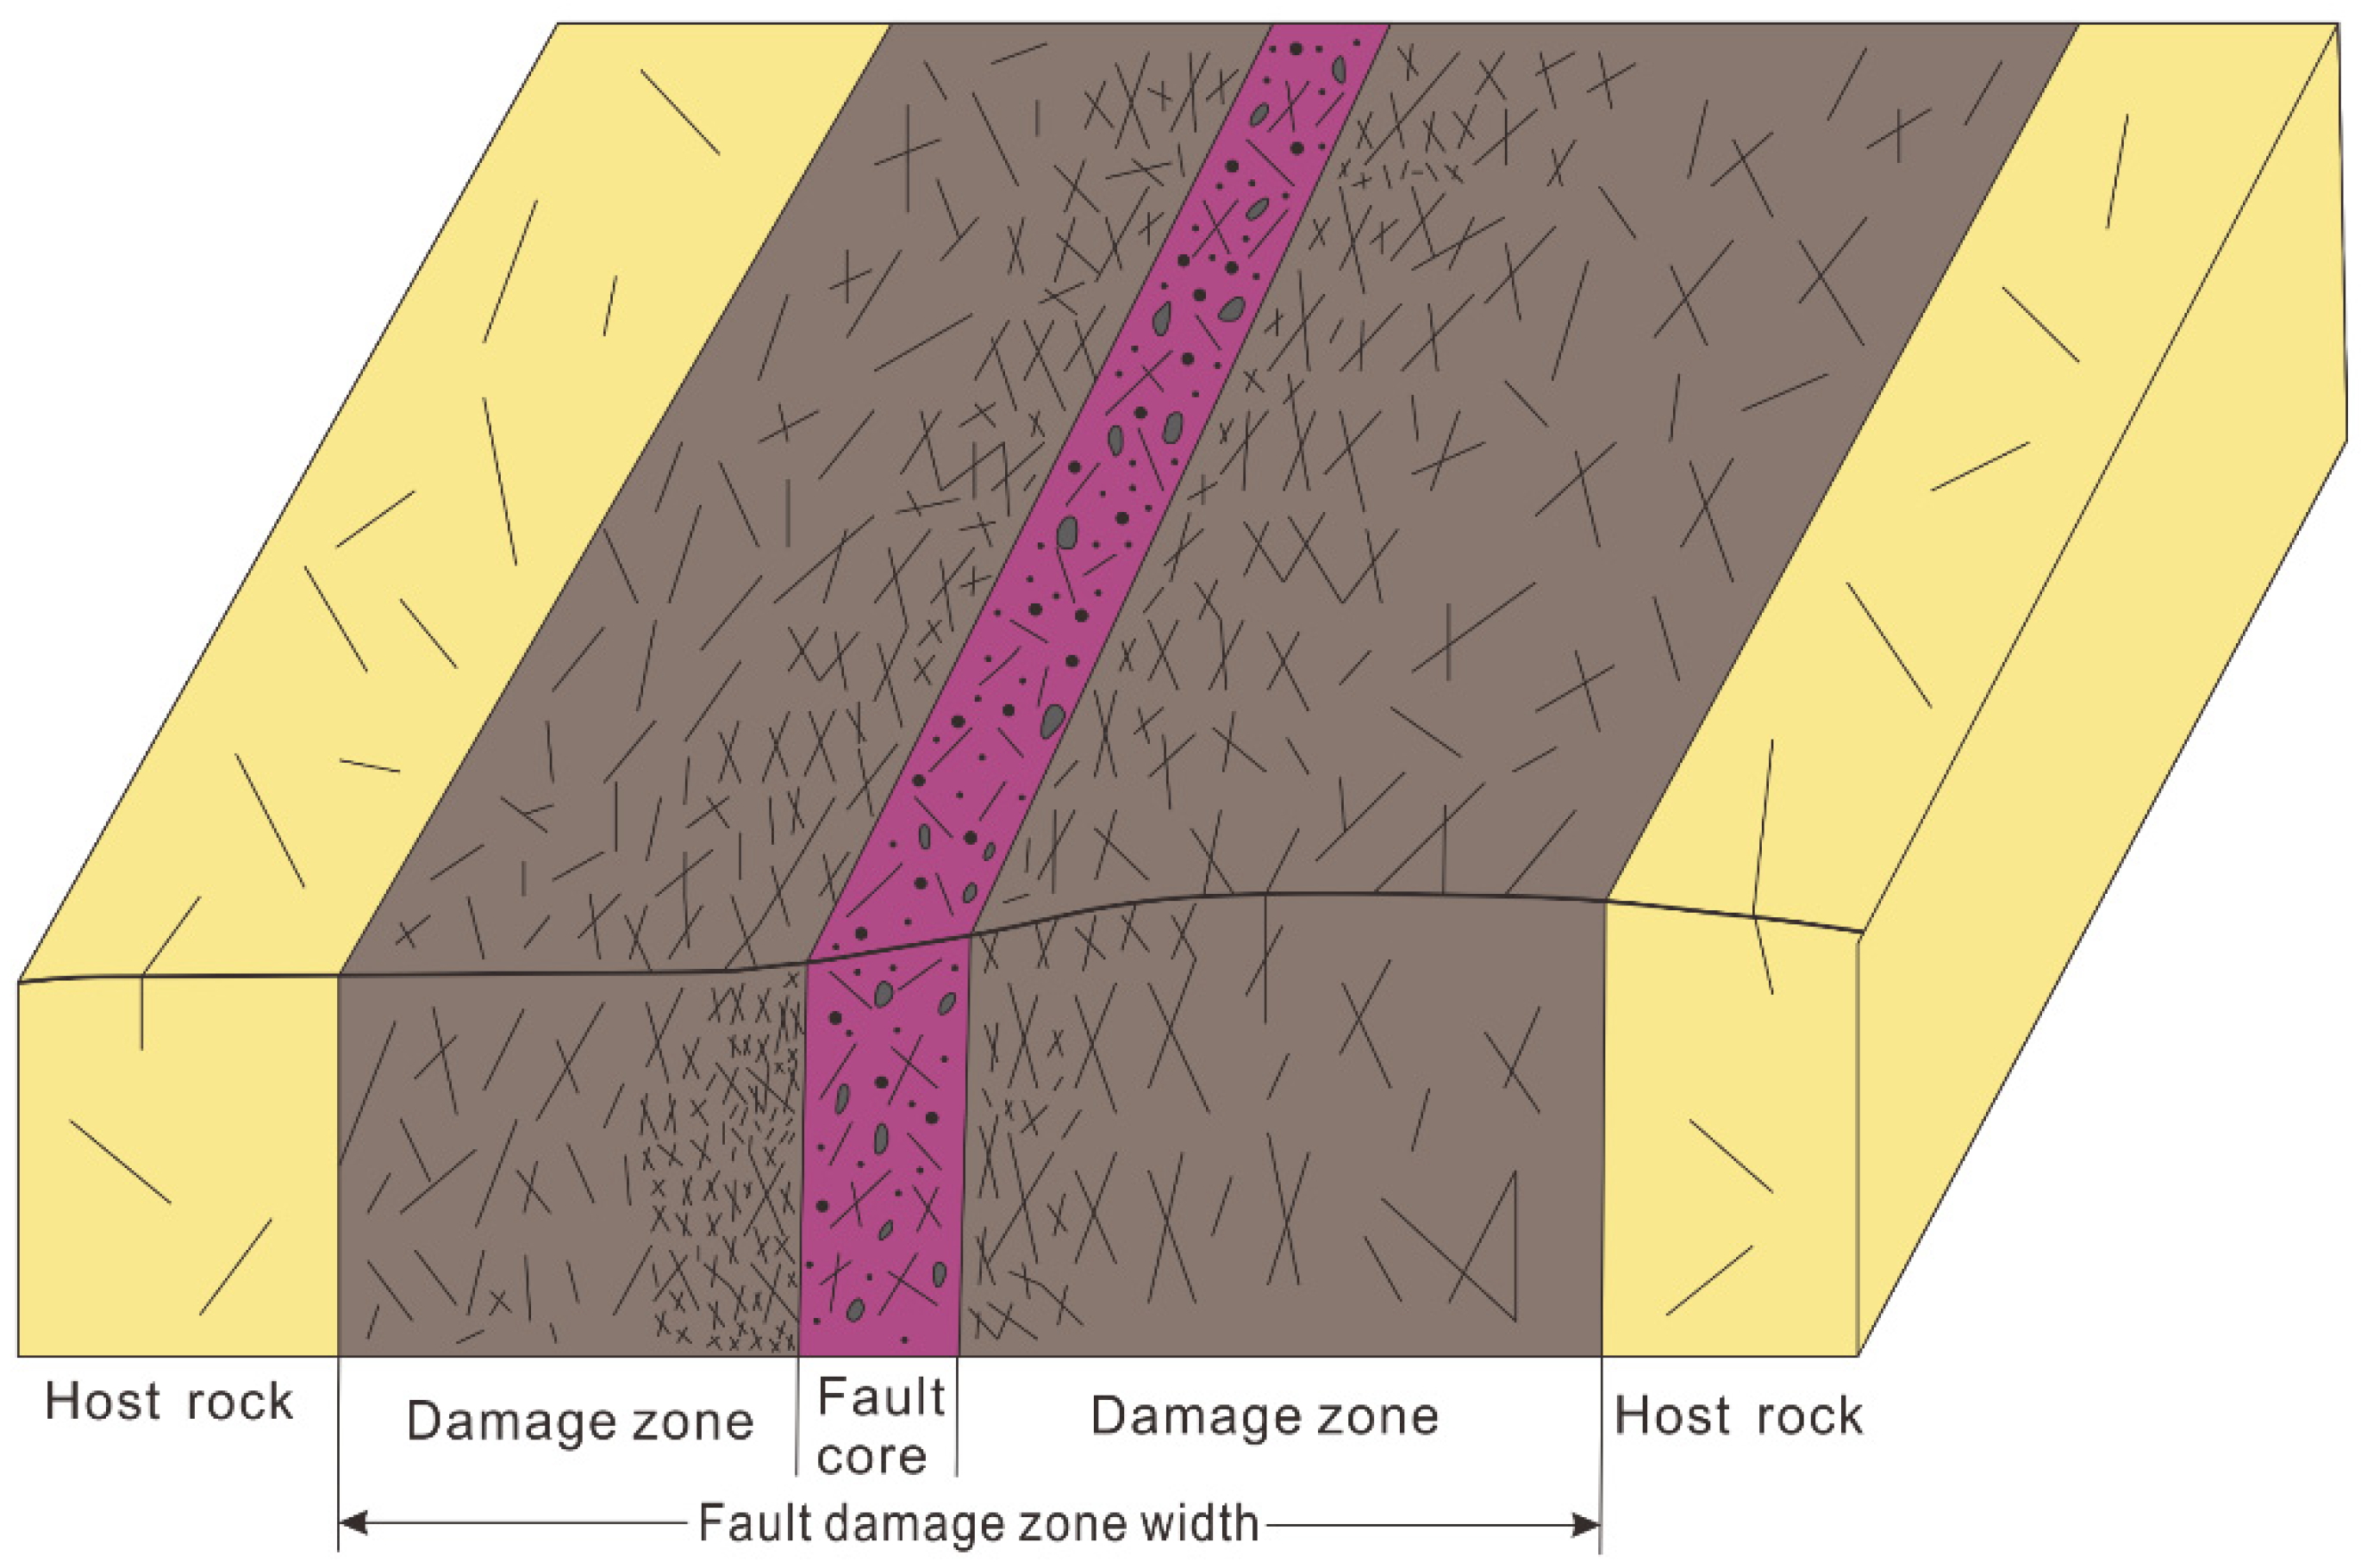
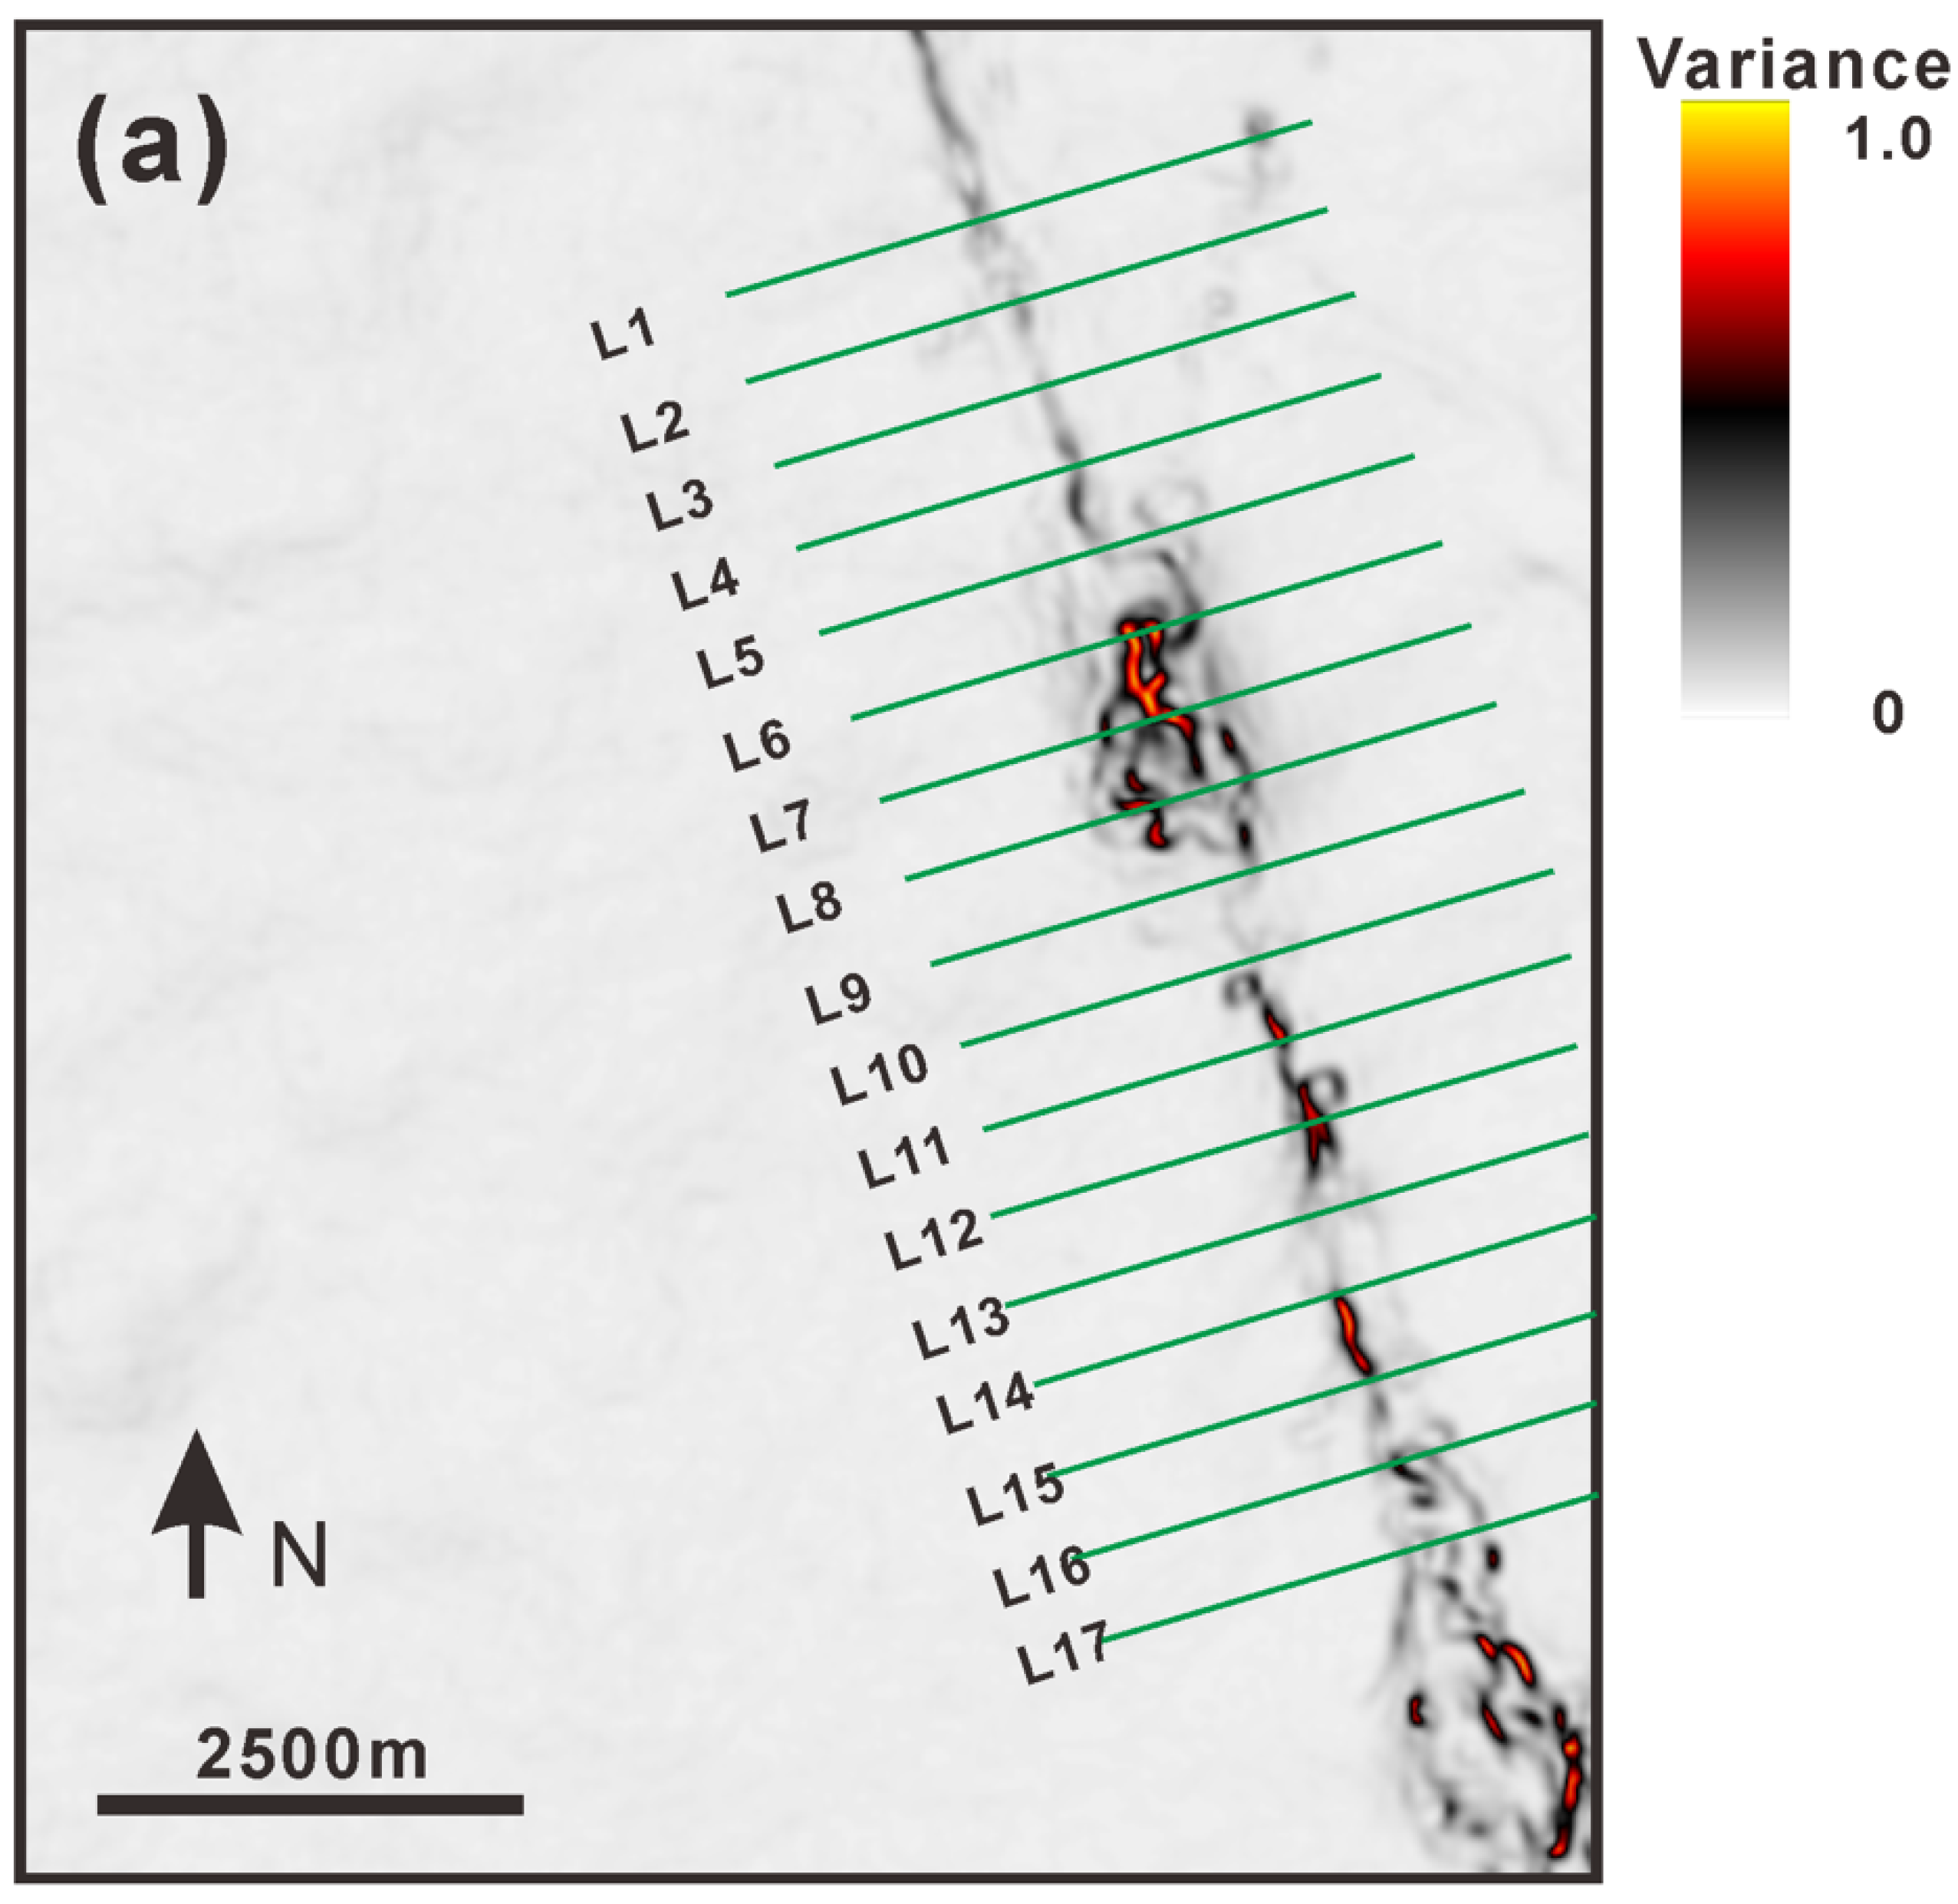
4.1. Characteristics of Shunbei 5 Fault Damage Zone

We interpret the yellow dotted rectangle as the Shunbei 5 fault zone (Figure 6a,b), and Figure 6c,d show the seismic variance profiles corresponding to two typical damage zones, respectively. In the seismic amplitude profile (profile L8, Figure 6a), the type 1 damage zone is characterized by a disordered and discontinuous in-phase axis, while the variance section is characterized by a wide discontinuity area with a high variance value. Compared with type 1, the seismic amplitudes of type 2 (profile L4, Figure 6b) damage zone are more continuous, and the amplitudes only break at the fault core, showing a narrow area with a high variance value on the variance section. To analyze the characteristics of the two damage zones, we extract the variance values of the two fault segments on different sections. Because high variance coefficients indicate the discontinuities of subsurface geological objects [18]. Zones with higher variance values than a background value are interpreted as damage zones. In Figure 7, we interpret the grey area with the seismic variance greater than 0.1 as the damage zone, the yellow area with the variance greater than 0.6 as the fault core, and the blank area with variance lower than 0.1 as protolith. Based on the structural style of seismic sections and formation rheology, we separate the seismic damage zone into two types. The total width of type 1 (Figure 7a) is about 938 m, of which the width of the fault core is about 137 m, the width of the damage zone distributed in the west of the fault core is 298 m, and the width of the damage zone distributed in the east of the fault core is 503 m. The total width of type 2 (Figure 7b) is about 474 m, of which the width of the fault core is approximately 83 m, the width of the damage zone distributed in the west of the fault core is approximately 95 m, and the width of the damage zone distributed in the east of the fault core is approximately 295 m. Both types of damage zones show a strong asymmetry, which may indicate the direction of fault propagation [28]. To further investigate the relationship of the damage zones with depth, a series of variance profiles were drawn at intervals of 100 ms (Figure 8a,b). Type 1 has a broader damage zone width between 4500 ms and 4800 ms (Figure 8c), and the maximum width is 1400 m, while it is narrow above 4500 ms and below 4800 ms. Compared with type 1, type 2 was only slightly broader, around 4800 ms (Figure 8d). The maximum width is 970 m, the minimum width is 125 m, and the average width is 342 m.

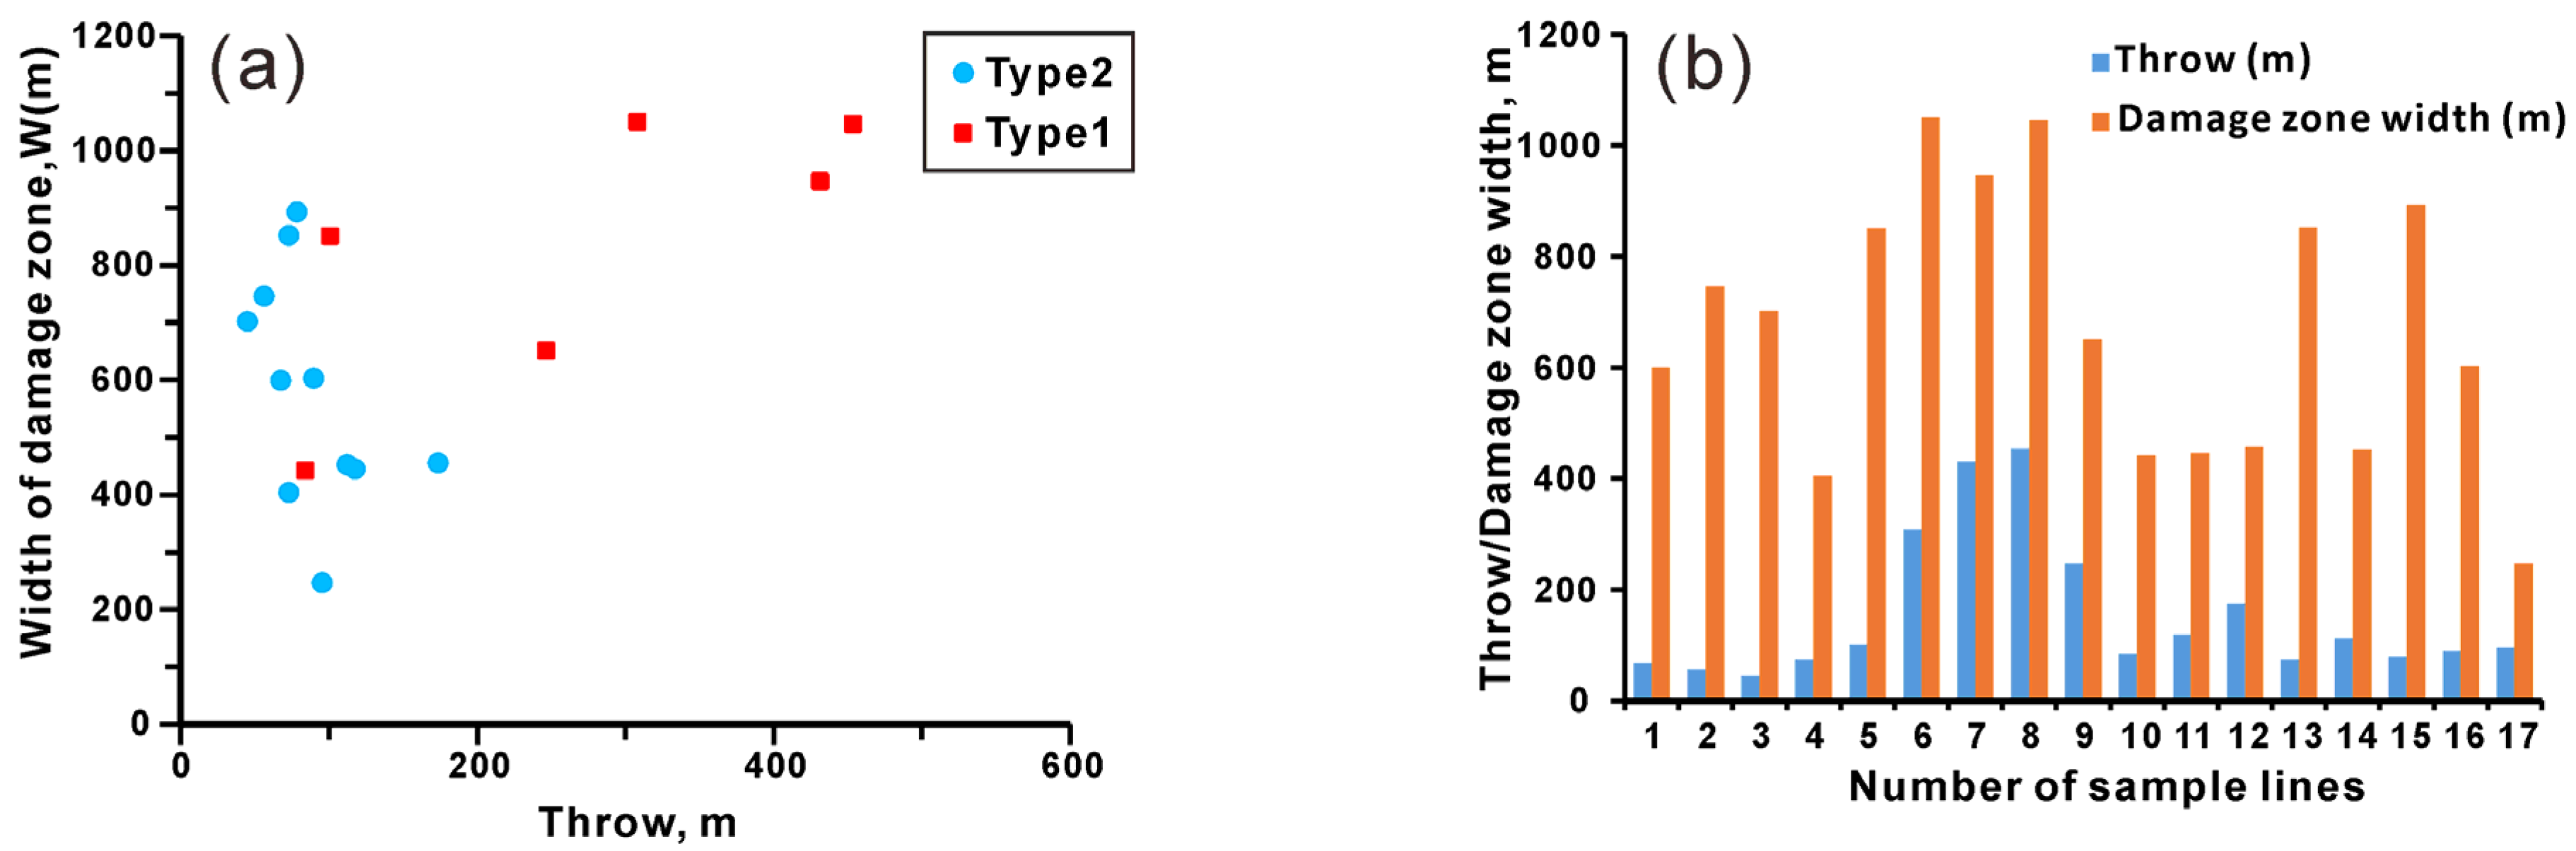
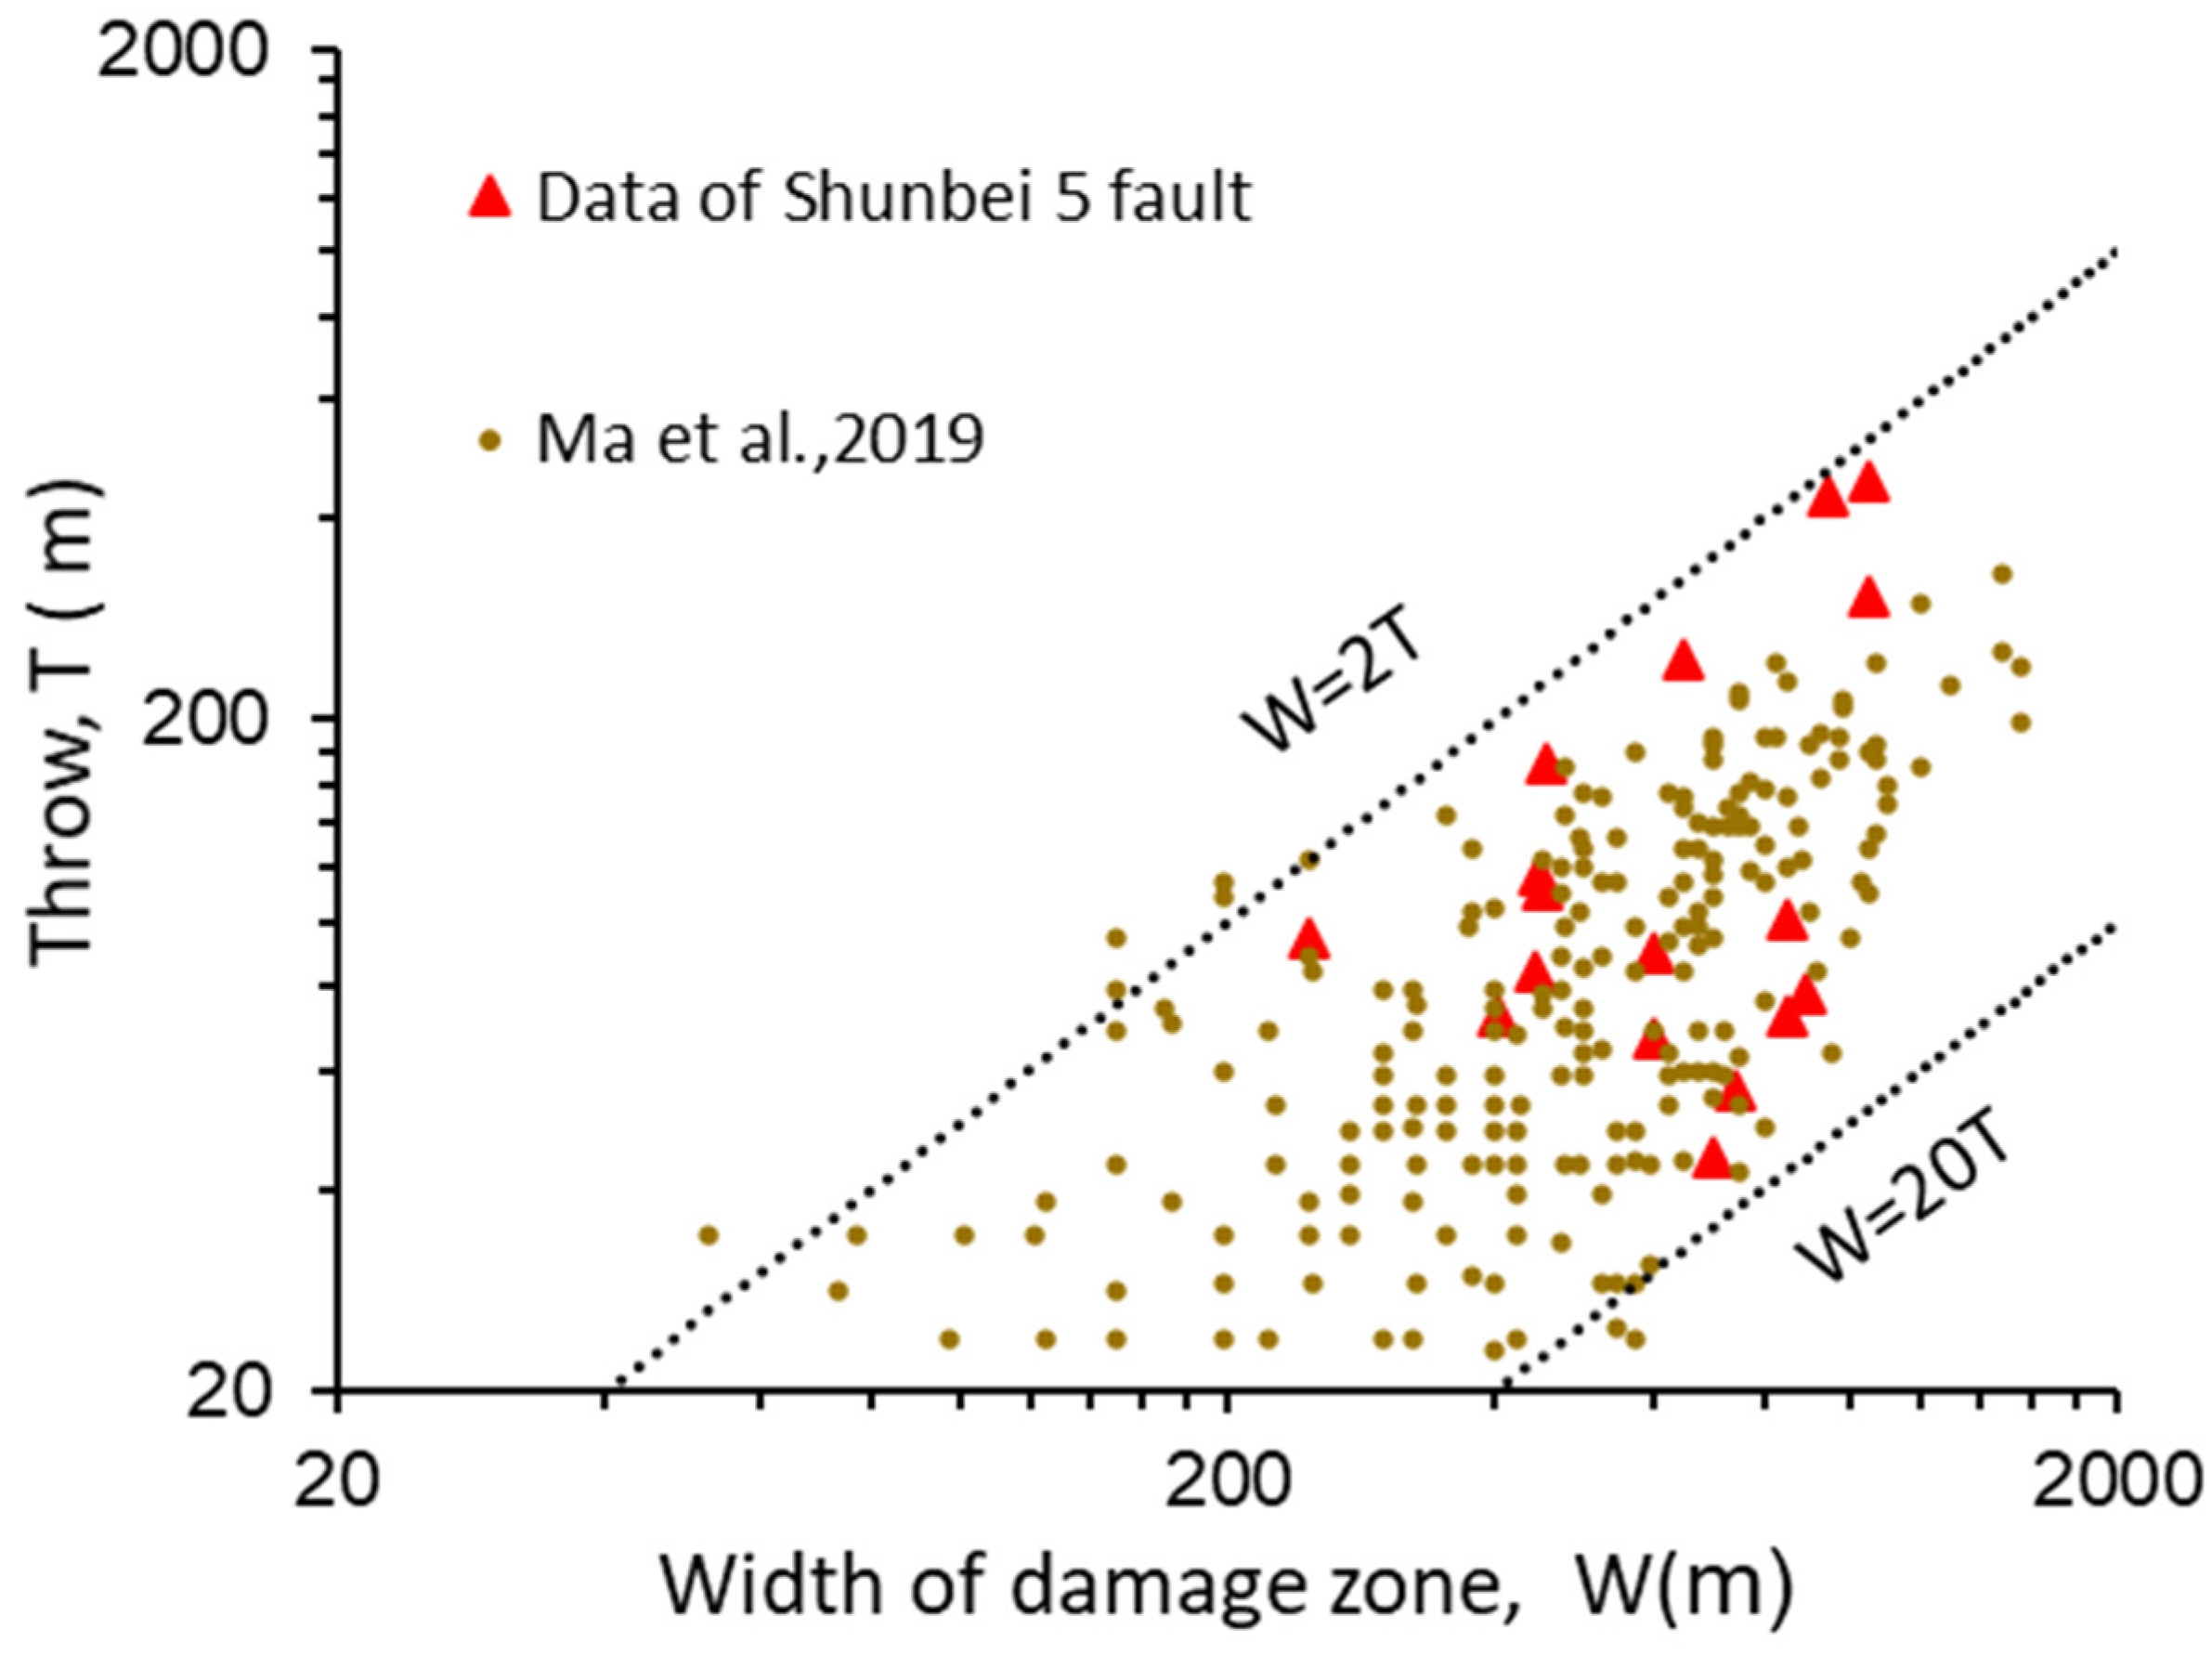
4.2. Relationship of Damage Zone Width with Throw

It is well known that there are various functional relationships among the various fault attributes, such as log-normal, exponential laws, power-law distribution, and so on [29,30,31]. The relationship between the fault displacement and the width of the damage zone is following the power-law distribution on the log-log diagram, which has been recognized by most researchers and justified in the frame of complexity theory for earth other planets, too [32,33,34,35]. However, the power-law distribution is still uncertain, due to the influence of sampling error or the complex fault evolution process. In this paper, because it is difficult to determine the horizontal displacement of deep strike-slip fault, we choose the vertical throw as the proxy of the displacement to analyze the relationship between the fault throw and the width of the damage zone. Based on 17 seismic profiles perpendicular to the strike of the Shunbei 5 fault and their seismic variance attributes, we measured the width of the damage zone and the throw at the surface (T74). To reduce the sampling error, only the damage zones and throw of the main fault are measured and analyzed, while the secondary fault was excluded. At the same time, based on the average velocity of limestone strata in the study area, the time domain throw is converted into depth domain throw. It is found that the damage zone width and vertical throw of the Shunbei 5 fault vary along the strike of the fault. From Figure 9a, the width of the type 1 damage zone is positively correlated with throw, while that of the type 2 damage zone is not. The average width of the type 1 damage zone is about 831 m, and the average throw is about 270 m, while the average width of the type 2 damage zone is about 582 m, and the average throw is about 89 m (Figure 9b). In general, the type 1 damage zone is wider, and the throw is larger. Then, we compile the data of [36] in the Tazhong Uplift with our data (Figure 10). Although the Study area and the Tazhong Uplift are located in different structural units of Tarim Basin. It is found that the damage zone width and displacement (throw) in this area also obey the power-law distribution on the log-log plot, and the ratio of width to displacement is between 2–20.

5. Discussion

5.1. Factors Affecting the Damage Zone Width of the Shunbei 5 Fault Zone

Previous studies have shown that the width of the fault damage zone is closely related to the buried depth of the fault, the stress field during the formation of the fault, the type of protolith, the interaction between fault segments, and the later diagenesis [37,38]. The Ordovician carbonate rocks in this study area are mainly composed of micritic limestone developed in open platform facies, and their buried depth ranges from 7300 to 7800 m. On the top of the Yijianfang Formation (surface T74), the width of the damage zone along the strike of the Shunbei 5 fault shows segmentation. The width of the damage zone in the compressive uplifting segments (type 1) is larger than that in the strike-slip segments (type 2). The Shunbei 5 fault is a dextral strike-slip fault, which is subjected to strong compression and torsion stress in the compressive uplifting segments [39]. In the strike-slip segments, the mechanical interaction is mainly distributed at the end of the segment, and the overall compressive and torsional stress is relatively weak. On the profile, the width of the damage zone varies with the depth. According to the results of seismic variance analysis, the width of the Shunbei 5 fault damage zone is narrow at the root and upper part of the fault, and wide in the middle. This feature shows that the maximum displacement is mainly in the middle region of the Shunbei 5 fault [40]. Besides, the geometric characteristics of seismic profiles corresponding to the two damage zones show that the stress fields of different segments of the Shunbei 5 fault are different. Furthermore, the lithology between T70 and T74 is mainly mudstone, argillaceous limestone, and marl, while the lithology between T74 and T80 is mainly micritic limestone (Figure 3). The competency of micritic limestone is higher than that of mudstone and marl. During the formation and development of strike-slip fault, rocks with higher competency are more prone to stress concentration, which leads to rock deformation and forms a wider damage zone [41].

5.2. Implications for Growth of the Shunbei 5 Fault Damage Zone

A large number of studies have shown that there are various types of damage zones associated with strike-slip faults and their formation mechanisms. For the evolution and formation of damage zones, many researchers have proposed different models, such as the process zone model [42], fault wear model [43], and coseismic damage model. According to the relationship between the damage zones and their location along with the profile of a strike-slip fault, Kim et al. separated the damage zone into three types: Tip-damage zone, linking-damage zone, and wall-damage zone. Type 1 and type 2 in this paper correspond to the linking - and wall damage zones. Before forming a large strike-slip fault, it comprises a series of nearly parallel small faults. After multiple tectonic movements, these small faults gradually connected and overlapped, forming a large fault. The deformation characteristics of the seismic amplitude profile show that type 1 is a typical contraction zone. During forming strike-slip fault, the tips of two overstepping segments are pinned in the contractional zone, and strong mechanical interaction occurs, which results in the strong uplift of the strata in the contractional zone and wider damage zone. The type 2 damage zone mainly comes from the merger and coalescence between different fault segments. In addition, the heterogeneous stress field produced during the activity of strike-slip fault is geometrically shown as the ribbon effect of strike-slip fault, which may be the fundamental reason for the heterogeneous deformation of rocks around the fault and forming damage zones with different width and high seismic variance values along the strike of the Shunbei 5 fault [44]. Also, the study area has experienced multiple tectonic movements, and the multiple reactivations of the Shunbei 5 fault are the direct cause of forming the complex damage zones. Moreover, the roughness of the fault plane, the shear strength of the fault, and the spatial configuration of multiple segments also have a great influence on the dimension of the fault fracture zone. However, limited by the data, we will not discuss these issues.

5.3. Influence of Fault Damage Zone Characteristics to Hydrocarbon Exploration

Previous studies have shown that the damage zones associated with a strike-slip fault may be the main factor of reservoir quality and hydrocarbon distribution [22]. Therefore, the drilling targets in the Shunbei area are mainly fractured zones associated with large strike-slip faults. However, the drilled productivity of different types of damage zones associated with strike-slip faults shows a great difference, in general, the average unit pressure drop production of a single well deployed in the type 1 damage zone is 1189.7 t·MPa−1, and that deployed in the type 2 damage zone is 524.5 t·MPa−1 [39,45]. It also directly indicates the difference in hydrocarbon distribution in different segments along a strike-slip fault. According to [45], pressure interference tests were carried out on wells deployed in the study area. In the process of testing, Shunbei 5 well is used as a stimulation well, Shunbei 5-B well, and Shunbei 5-C well are used as monitoring wells. The test results show that the unit propagation velocity of the type 1 damage zone is 9.8 m/h, and the type 2 damage zone is an independent reservoir unit controlled by a single well. Based on the above published dynamic data and the characteristic data of the damage zones, we can infer that the larger width of the type 1 damage zone leads to more reservoir space and better connectivity of fracture network, so it has greater production potential than the type 2 damage zone.

6. Conclusions

In this study, our results verify that it is an effective method to use seismic variance to characterize the deep fault damage zone. Based on seismic data and seismic variance attributes, the Ordovician strike-slip fault damage zones in the Shunbei area are analyzed, and the following conclusions are obtained. The results show that there is a positive correlation between the width of the type 1 damage zone and the vertical throw, while the correlation between the width of the type 2 damage zone and the vertical throw is not strong. Moreover, the ratio of the damage zone width to the vertical throw is mainly distributed in the range of 2–20, and the power-law distribution is shown in the log-log diagram. The damage zones developed in the middle and upper Ordovician strata are wider than those in the upper Ordovician strata, especially in the vicinity of the lithologic transition surface. Based on the published production data and the research results of the Shunbei 5 damage zone in this paper, we infer that the type 1 damage zone has greater oil and gas exploration potential than the type 2 damage zone.

Author Contributions

Z.Z. conceived and wrote the paper draft. J.L. provided data. R.Y. drew the map. W.D. discussed the results. G.Z. reviewed the draft. All authors have read and agreed to the published version of the manuscript.

Funding

This research was supported by the National Natural Science Foundation of China (Grant No. 42072173) and the National Science and Technology Major Project of China (2016ZX05046-003-001, 2016ZX05033-002-004, 2016ZX05033-002-005, 2016ZX05034-004-003)..

Institutional Review Board Statement

Not applicable.

Informed Consent Statement

Not applicable.

Data Availability Statement

Not applicable.

Acknowledgments

The authors would like to thank the staff of all of the laboratories that cooperated in performing the tests and analyses. We thank the Engineering Technology Institute of Northwest Oilfield Company for its strong support in the study. We are also grateful to the anonymous reviewers, whose comments improved the quality of this manuscript.

Conflicts of Interest

The authors declare no conflict of interest.

References

  1. Caine, J.S.; Evans, J.P.; Forster, C.B. Fault zone architecture and permeability structure. Geology 1996, 24, 1025–1028. [Google Scholar] [CrossRef]
  2. Kim, Y.S.; Peacock, D.C.; Sanderson, D.J. Fault damage zones. J. Struct. Geol. 2004, 26, 503–517. [Google Scholar] [CrossRef]
  3. Shipton, Z.K.; Cowie, P.A. A conceptual model for the origin of fault damage zone structures in high-porosity sandstone. J. Struct. Geol. 2003, 25, 333–344. [Google Scholar] [CrossRef]
  4. Kim, Y.S.; Peacock, D.C.P.; Sanderson, D.J. Mesoscale strike-slip faults and damage zones at Marsalforn, Gozo Island, Malta. J. Struct. Geol. 2003, 25, 793–812. [Google Scholar] [CrossRef]
  5. Choi, J.H.; Edwards, P.; Ko, K.; Kim, Y.S. Definition and classification of fault damage zones: A review and a new methodological approach. Earth Sci. Rev. 2016, 152, 70–87. [Google Scholar] [CrossRef]
  6. Faulkner, D.R.; Jackson, C.A.L.; Lunn, R.J.; Schlische, R.W.; Shipton, Z.K.; Wibberley, C.A.J.; Withjack, M.O. A review of recent developments concerning the structure, mechanics and fluid flow properties of fault zones. J. Struct. Geol. 2010, 32, 1557–1575. [Google Scholar] [CrossRef]
  7. Matonti, C.; Lamarche, J.; Guglielmi, Y.; Marié, L. Structural and petrophysical characterization of mixed conduit/seal fault zones in carbonates: Example from the Castellas fault (SE France). J. Struct. Geol. 2012, 39, 103–121. [Google Scholar] [CrossRef]
  8. Lin, A.; Yamashita, K. Spatial variations in damage zone width along strike-slip faults: An example from active faults in southwest Japan. J. Struct. Geol. 2013, 57, 1–15. [Google Scholar] [CrossRef] [Green Version]
  9. Johri, M.; Zoback, M.D.; Hennings, P. A scaling law to characterize fault-damage zones at reservoir depths. AAPG Bull. 2014, 98, 2057–2079. [Google Scholar] [CrossRef] [Green Version]
  10. Lyu, W.; Zeng, L.; Liao, Z.; Ji, Y.; Lyu, P.; Dong, S. Fault damage zone characterization in tight-oil sandstones of the Upper Triassic Yanchang Formation in the southwest Ordos Basin, China: Integrating cores, image logs, and conventional logs. Interpretation 2017, 5, SP27–SP39. [Google Scholar] [CrossRef]
  11. Chopra, S.; Marfurt, K.J. Seismic Attributes for Prospect Identification and Reservoir Characterization, 1st ed.; Society of Exploration Geophysicists and European Association of Geoscientists and Engineers: Tulsa, OK, USA, 2007; pp. 50–53. [Google Scholar]
  12. Chopra, S.; Marfurt, K.J. Interpreting fractures through 3D seismic discontinuity attributes and their visualization. CSEG Rec. 2009, 34, 5–14. [Google Scholar]
  13. Iacopini, D.; Butler, R.W.H.; Purves, S.; McArdle, N.; De Freslon, N. Exploring the seismic expression of fault zones in 3D seismic volumes. J. Struct. Geol. 2016, 89, 54–73. [Google Scholar] [CrossRef] [Green Version]
  14. Torabi, A.; Alaei, B.; Kolyukhin, D. Analysis of fault scaling relations using fault seismic attributes. Geophys. Prospect. 2017, 65, 581–595. [Google Scholar] [CrossRef]
  15. Botter, C.; Cardozo, N.; Hardy, S.; Lecomte, I.; Paton, G.; Escalona, A. Seismic characterization of fault damage in 3D using mechanical and seismic modeling. Mar. Pet. Geol. 2016, 77, 973–990. [Google Scholar] [CrossRef]
  16. Liao, Z.H.; Liu, H.; Jiang, Z.; Marfurt, K.J.; Reches, Z.E. Fault damage zone at subsurface: A case study using 3D seismic attributes and a clay model analog for the Anadarko Basin, Oklahoma. Interpretation 2017, 5, T143–T150. [Google Scholar] [CrossRef]
  17. Liao, Z.H.; Carpenter, B.M.; Marfurt, K.J.; Reches, Z.E. Analysis of fault damage zones using three-dimensional seismic coherence in the Anadarko Basin, Oklahoma. AAPG Bull. 2019, 103, 1771–1785. [Google Scholar] [CrossRef]
  18. Liao, Z.H.; Hu, L.; Huang, X.; Carpenter, B.M.; Marfurt, K.J.; Vasileva, S.; Zhou, Y. Characterizing damage-zones of normal faults using seismic variance in the Wangxuzhuang Oilfield, China. Interpretation 2020, 8, 1–24. [Google Scholar] [CrossRef]
  19. Ma, Q.Y.; Sha, X.G.; Li, Y.L.; Zhu, X.X.; Yang, S.J.; Li, H.L. Characteristics of strike-slip fault and its controlling on oil in Shuntuoguole region, middle Tarim Basin. Pet. Geol. Exp. 2012, 34, 120–124. [Google Scholar]
  20. Qi, L.X. Oil and gas breakthrough in ultra-deep Ordovician carbonate formations in Shuntuoguole uplift, Tarim Basin. China Pet. Explor. 2016, 21, 38–51. [Google Scholar]
  21. Jiao, F.Z. Significance of oil and gas exploration in NE strike-slip fault belts in Shuntuoguole area of Tarim Basin. Oil Gas Geol. 2017, 38, 831–839. [Google Scholar]
  22. Jiao, F.Z. Significance and prospect of ultra-deep carbonate fault-karst reservoirs in Shunbei area, Tarim Basin. Oil Gas Geol. 2018, 39, 207–216. [Google Scholar]
  23. Jia, C.Z. Tectonic Characteristics and Petroleum; Petroleum Industry Press: Beijing, China, 1997; pp. 179–181. [Google Scholar]
  24. Deng, S.; Li, H.L.; Zhang, Z.P.; Wu, X.; Zhang, J.B. Characteristics of differential activities in major strike-slip fault zones and their control on hydrocarbon enrichment in Shunbei area and its surroundings, Tarim Basin. Oil Gas Geol. 2018, 39, 878–888. [Google Scholar]
  25. Jiao, C.L.; He, B.Z.H.E.; Wang, T.Y.; You, D.H.; Han, J.; Gao, X.P.; Peng, S.; Zhao, X. Types and quantitative characterization of reservoir spaces of the ultra-deep limestone reservoirs in the Yijianfang Formation during the Middle Ordovician, Shuntuoguole area,Tarim basin. Acta Petrol. Sin. 2018, 34, 1835–1846. [Google Scholar]
  26. Jia, L.Q.; Cai, C.F.; Jiang, L.; Zhang, K.; Li, H.X.; Zhang, W. Petrological and geochemical constraints on diagenesis and deep burial dissolution of the Ordovician carbonate reservoirs in the Tazhong area, Tarim Basin, NW China. Mar. Pet. Geol. 2016, 78, 271–290. [Google Scholar] [CrossRef]
  27. Wu, G.; Kim, Y.S.; Su, Z.; Yang, P.; Ma, D.; Zheng, D. Segment interaction and linkage evolution in a conjugate strike-slip fault system from the Tarim Basin, NW China. Mar. Pet. Geol. 2020, 112, 104054. [Google Scholar] [CrossRef]
  28. Scholz, C.H.; Dawers, N.H.; Yu, J.Z.; Anders, M.H. Fault growth and fault scaling laws: Preliminary results. J. Geophys. Res. Solid Earth 1993, 98, 21951–21961. [Google Scholar] [CrossRef]
  29. Faulkner, D.R.; Mitchell, T.M.; Jensen, E.; Cembrano, J. Scaling of fault damage zones with displacement and the implications for fault growth processes. J. Geophys. Res. 2011, 116, B05403. [Google Scholar] [CrossRef]
  30. Savage, H.M.; Brodsky, E.E. Collateral damage: Evolution with displacement of fracture distribution and secondary fault strands in fault damage zones. J. Geophys. Res. 2011, 116, B03405. [Google Scholar] [CrossRef]
  31. Michas, G.; Vallianatos, F.; Sammonds, P. Statistical mechanics and scaling of fault populations with increasing strain in the corinth rift. Earth Planet Sci. Lett. 2015, 431, 150–163. [Google Scholar] [CrossRef]
  32. Vallianatos, F.; Kokinou, E.; Sammonds, P. Non-extensive statistical physics approach to fault population distribution. a case study from the southern hellenic arc (central crete). Acta Geophys. 2011, 59, 770–784. [Google Scholar] [CrossRef]
  33. Vallianatos, F.; Sammonds, P. A non-extensive statistics of the fault-population at the Valles Marineris extensional province, Mars. Tectonophysics 2011, 509, 50–54. [Google Scholar] [CrossRef]
  34. Vallianatos, F. On the non-extensivity in Mars geological faults. Eur. Phys. Let. (EPL) 2013, 102, 28006. [Google Scholar]
  35. Vallianatos, F.; Papadakis, G.; Michas, G. Generalized statistical mechanics approaches to earthquakes and tectonics. Proc. R. Soc. A 2016, 472, i2196. [Google Scholar] [CrossRef]
  36. Ma, D.B.; Wu, G.H.; Scarselli, N.; Luo, X.S.; Han, J.F.; Chen, Z.Y. Seismic damage zone and width–throw scaling along the strike-slip faults in the Ordovician carbonates in the Tarim Basin. Pet. Sci. 2019, 16, 752–762. [Google Scholar] [CrossRef] [Green Version]
  37. Torabi, A.; Berg, S.S. Scaling of fault attributes: A Review. Mar. Pet. Geol. 2011, 28, 1444–1460. [Google Scholar] [CrossRef]
  38. Gudmundsson, A.; Guidi, G.D.; Scudero, S. Length–displacement scaling and fault growth. Tectonophysics 2013, 608, 1298–1309. [Google Scholar] [CrossRef]
  39. Deng, S.; Li, H.; Zhang, Z.; Zhang, J.; Yang, X. Structural characterization of intracratonic strike-slip faults in the central Tarim Basin. AAPG Bull. 2019, 103, 109–137. [Google Scholar] [CrossRef]
  40. Walsh, J.J.; Watterson, J. Distributions of cumulative displacement and seismic slip on a single normal fault surface. J. Struct. Geol. 1987, 9, 1039–1046. [Google Scholar] [CrossRef]
  41. Zhang, J.B.; Zhang, Z.P.; Wang, B.F.; Deng, S. Development pattern and prediction of induced fractures from strike-slip faults in Shunnan area, Tarim Basin. Oil Gas Geol. 2018, 39, 955–1055. [Google Scholar]
  42. Cowie, P.A.; Scholz, C.H. Physical explanation for displacement-length relationship of faults using a post-yield fracture mechanics model. J. Struct. Geol. 1992, 14, 1133–1148. [Google Scholar] [CrossRef]
  43. Chester, F.M.; Chester, J.S. Stress and deformation along wavy frictional faults. J. Geophys. Res. Solid Earth 2000, 105, 23421–23430. [Google Scholar] [CrossRef]
  44. Yin, S.; Xie, R.; Wu, Z.; Liu, J.; Ding, W.L. In situ stress heterogeneity in a highly developed strike-slip fault zone and its effect on the distribution of tight gases: A 3D finite element simulation study. Mar. Pet. Geol. 2019, 99, 75–91. [Google Scholar] [CrossRef]
  45. Liu, B.Z. Analysis of main controlling factors of oil and gas differential accumulation in Shunbei area, Tarim Basin-taking Shunbei No. 1 and No. 5 strike slip fault zones as examples. China Pet. Explor. 2020, 25, 83–95. [Google Scholar]
Figure 1. Schematic diagram of Typical strike-slip fault zone structures in carbonate reservoir (modified from Ma et al., 2019).
Jmse 09 00630 g001
Figure 2. (a) Distribution map of the major tectonic units in the central Tarim Basin (modified from Deng et al., 2019); (b) Map of main fault system in the Shunbei area.
Jmse 09 00630 g002
Figure 3. Stratigraphy and lithology in the study area.
Jmse 09 00630 g003
Figure 4. (a) The Variance cube on the top of the Yijianfang formation (T74) in the Shunbei 5 area. L1–L17 is the mark of sample lines. (b) Tectonic map of the study area.
Jmse 09 00630 g004aJmse 09 00630 g004b
Figure 5. Typical seismic profile across the Shunbei 5 fault zone. (a,b) are two structural styles, respectively.
Jmse 09 00630 g005
Figure 6. (a,b) are original seismic profiles of L8, L4, respectively, (c,d) are seismic variance profiles of L8, L4, respectively. (Type 1: compressive uplifting segments, type 2: strike-slip segments).
Jmse 09 00630 g006
Figure 7. Profiles of the seismic variance values across the Shunbei 5 fault zone; (a) The type 1 damage zone; (b) The type 2 damage zone. Profiles location shown in Figure 4a.
Jmse 09 00630 g007
Figure 8. Variance damage zone variations with depth intervals from 4300 ms to 5300 ms. The data in (c,d) are derived from the damage zones (light grey areas) interpreted in (a) (section L8) and (b) (section L4), respectively.
Jmse 09 00630 g008
Figure 9. (a) The damage zone width versus Throw, (b) Width of damage zones and its corresponding throw of the top of the Yijianfang formation (surface T74) along the strike of the Shunbei 5 fault zone.
Jmse 09 00630 g009
Figure 10. The plot of the damage zone width (W) versus the throw (T).
Jmse 09 00630 g010
Publisher’s Note: MDPI stays neutral with regard to jurisdictional claims in published maps and institutional affiliations.

