Article

Controls on Nutrient Cycling in Estuarine Mangrove Lake Sediments

by
Michael S. Owens
1,*,
Stephen P. Kelly
2,
Thomas A. Frankovich
3,
David T. Rudnick
4,
James W. Fourqurean
3 and
Jeffrey C. Cornwell
1
1
Horn Point Laboratory, University of Maryland Center for Environmental Science, Cambridge, MD 21613, USA
2
South Florida Water Management District, West Palm Beach, FL 33406, USA
3
Institute of Environment, Florida International University, Miami, FL 33131, USA
4
South Florida Natural Resources Center, Everglades National Park, Homestead, FL 33030, USA
*
Author to whom correspondence should be addressed.
J. Mar. Sci. Eng. 2021, 9(6), 626; https://doi.org/10.3390/jmse9060626
Submission received: 28 April 2021 / Revised: 31 May 2021 / Accepted: 1 June 2021 / Published: 4 June 2021

Abstract

:
We estimated the net exchange of nitrogen and phosphorus species using core incubations under light and dark conditions in estuarine lakes that are the aquatic interface between the freshwater Everglades and marine Florida Bay. These lakes and adjacent shallow water Florida Bay environments are sites where the restoration of hydrological flows will likely have the largest impact on salinity. Sediment respiration, measured by oxygen uptake, averaged (±S.D.) −2400 ± 1300, −300 ± 1000, and 1900 ± 1400 μmol m−2 h−1 for dark incubations, light incubations, and gross photosynthesis estimates, respectively, with dark incubations consistent with oxygen uptake measured by microelectrode profiles. Although most fluxes of soluble reactive phosphorus, nitrate, and N2–N were low under both light and dark incubation conditions, we observed a number of very high efflux events of NH4+ during dark incubations. A significant decrease in NH4+flux was observed in the light. The largest differences between light and dark effluxes of NH4+ occurred in lakes during periods of low coverage of the aquatic macrophyte Chara hornemannii Wallman, with NH4+ effluxes > 200 μmol m−2 h−1. Increasing freshwater flow from the Everglades is expected to expand lower salinity environments suitable for Chara, and therefore, diminish the sediment NH4+ effluxes that may fuel algal blooms.

1. Introduction

The land–sea interface in coastal ecosystems faces numerous challenges including eutrophication, shoreline alteration due to development, sea-level rise-driven erosion of shorelines and wetlands, and changes in the hydrological connection between land and watersheds. Changes to the hydrology of coastal ecosystems alters water residence times, the timing and amount of nutrient input, rates of nutrient biogeochemical cycling, and the balance between benthic and water column primary production. Benthic biogeochemical processes respond to changes in salinity, temperature, pH, and organic matter loading [1,2,3,4], altering the rate, direction, and nature of nitrogen (N) and phosphorus (P) flux to the water column.
The intention of water management operational and restoration plans over the past decade in south Florida has been the restoration and improvement of the quantity, timing, and distribution of freshwater flow through the Everglades to Florida Bay, without compromising the regional water quality. The enhancement of water flows into the southern Everglades is a major part of the Comprehensive Everglades Restoration Plan (CERP). The net balance of N and P within these aquatic ecosystems is a function of freshwater inputs from the Everglades, saline inputs from Florida Bay, and internal cycling. The restoration of freshwater flows into the coastal ecosystem can have myriad beneficial effects such as improved habitat for submerged aquatic vegetation [5], though the deleterious effects of increased nutrient inputs are a concern to both freshwater and downstream estuarine environments [6,7,8].
The mangrove-lined, saline lakes adjacent to Florida Bay serve as the marine terminus of the Everglades ecosystem and have experienced large changes in freshwater flow from the Everglades [9]. Increased flow has impacted nutrient loading, salinity, the biomass, and species composition of submerged aquatic vegetation, as well as algal blooms in some lakes [5]. Increased freshwater flows through these lakes may increase nutrient transport to the Bay and potentially stimulate microalgal blooms in the Bay. The internal sources and feedbacks of these elevated nutrients have not been assessed, but could be in part, due to benthic nutrient exchange with the water column. An understanding of internal nutrient cycling processes is necessary to identify the environmental controls of algal and submerged aquatic vegetation (SAV) communities.
Understanding the sediment biogeochemical response to hydrological shifts is necessary to determine the internal sources of N and P which may be important regulators of microalgal [10] and macrophyte [11] production. In Florida Bay, the regeneration of sediment N through remineralization is ~10 fold higher than N that is regenerated in the water column [12]. In addition, N cycling in sulfidic sub-tropical sediments often results in the dominance of NH4+ effluxes [13], the most favorable form of N for algal nutrition. The strong adsorption of P to the carbonate sediments in the Bay makes this an important P sink [14], however, high inputs of reactive P from the Gulf of Mexico [15], the watershed [7] and sediments [16] are important sources of P to the system. Sediment fluxes of N and P may stimulate water column algal blooms and assemblages [17] as well as stimulate the growth of toxic benthic algae [18].
The goal of this research was to determine whether changes in salinity and/or submerged aquatic vegetation (SAV) coverage changed the net exchange of N and P across the sediment–water interface. We measured the sediment–water exchange of nutrients and dissolved gases, as well as pore water chemistry and solid phase chemical composition to quantify the range of nutrient recycling in six mangrove lakes and two adjacent estuarine embayments.

2. Materials and Methods

The study area (Figure 1) consisted of many of the same lakes and estuarine environments described by Frankovich et al. in 2011 [5]. In this shallow water system, water depths vary with hydrologic conditions but are generally < 2 m depth with little change in bathymetry across each lake or embayment. The study sites generally have well oxygenated water columns except for some seasonal (fall/winter) short-term anoxia/hypoxia (<4 h) at night, especially in West Lake. The study sites all had a similar sediment type consisting of fine-grained carbonate sediments. Sample parameters and dates are listed in Table 1. Sediments were collected in June 2010, May 2011, June 2012, and December 2013, with water temperatures varying from 24–34 °C and salinities from 3–58 psu (Table 2). The mangrove lakes were connected to Florida Bay via Alligator Creek to the west and McCormick Creek to the east. The Alligator Creek sub-estuary includes West Lake, Cuthbert Lake, Long Lake, and Garfield Bight, while the McCormick Creek sub-estuary includes Seven Palm Lake, Middle Lake, Monroe Lake, and Terrapin Bay (Figure 1). These two drainages are referred to as the West Lake Chain and Seven Palm Lake Chain. Within each lake, three coring sites were selected to represent the lake; in Cuthbert and Seven Palm Lakes, coring sites were limited to the fringe regions of the lake due to thin (<10 cm) sediment layers overlying carbonate rock in the rest of the lake. The benthos has generally been dominated by Chara hornemannii, or was unvegetated [5]. The two estuarine sites, Garfield Bight and Terrapin Bay, had either bare sediments or both the seagrass Halodule wrightii and the alga Batophora oerstedii.

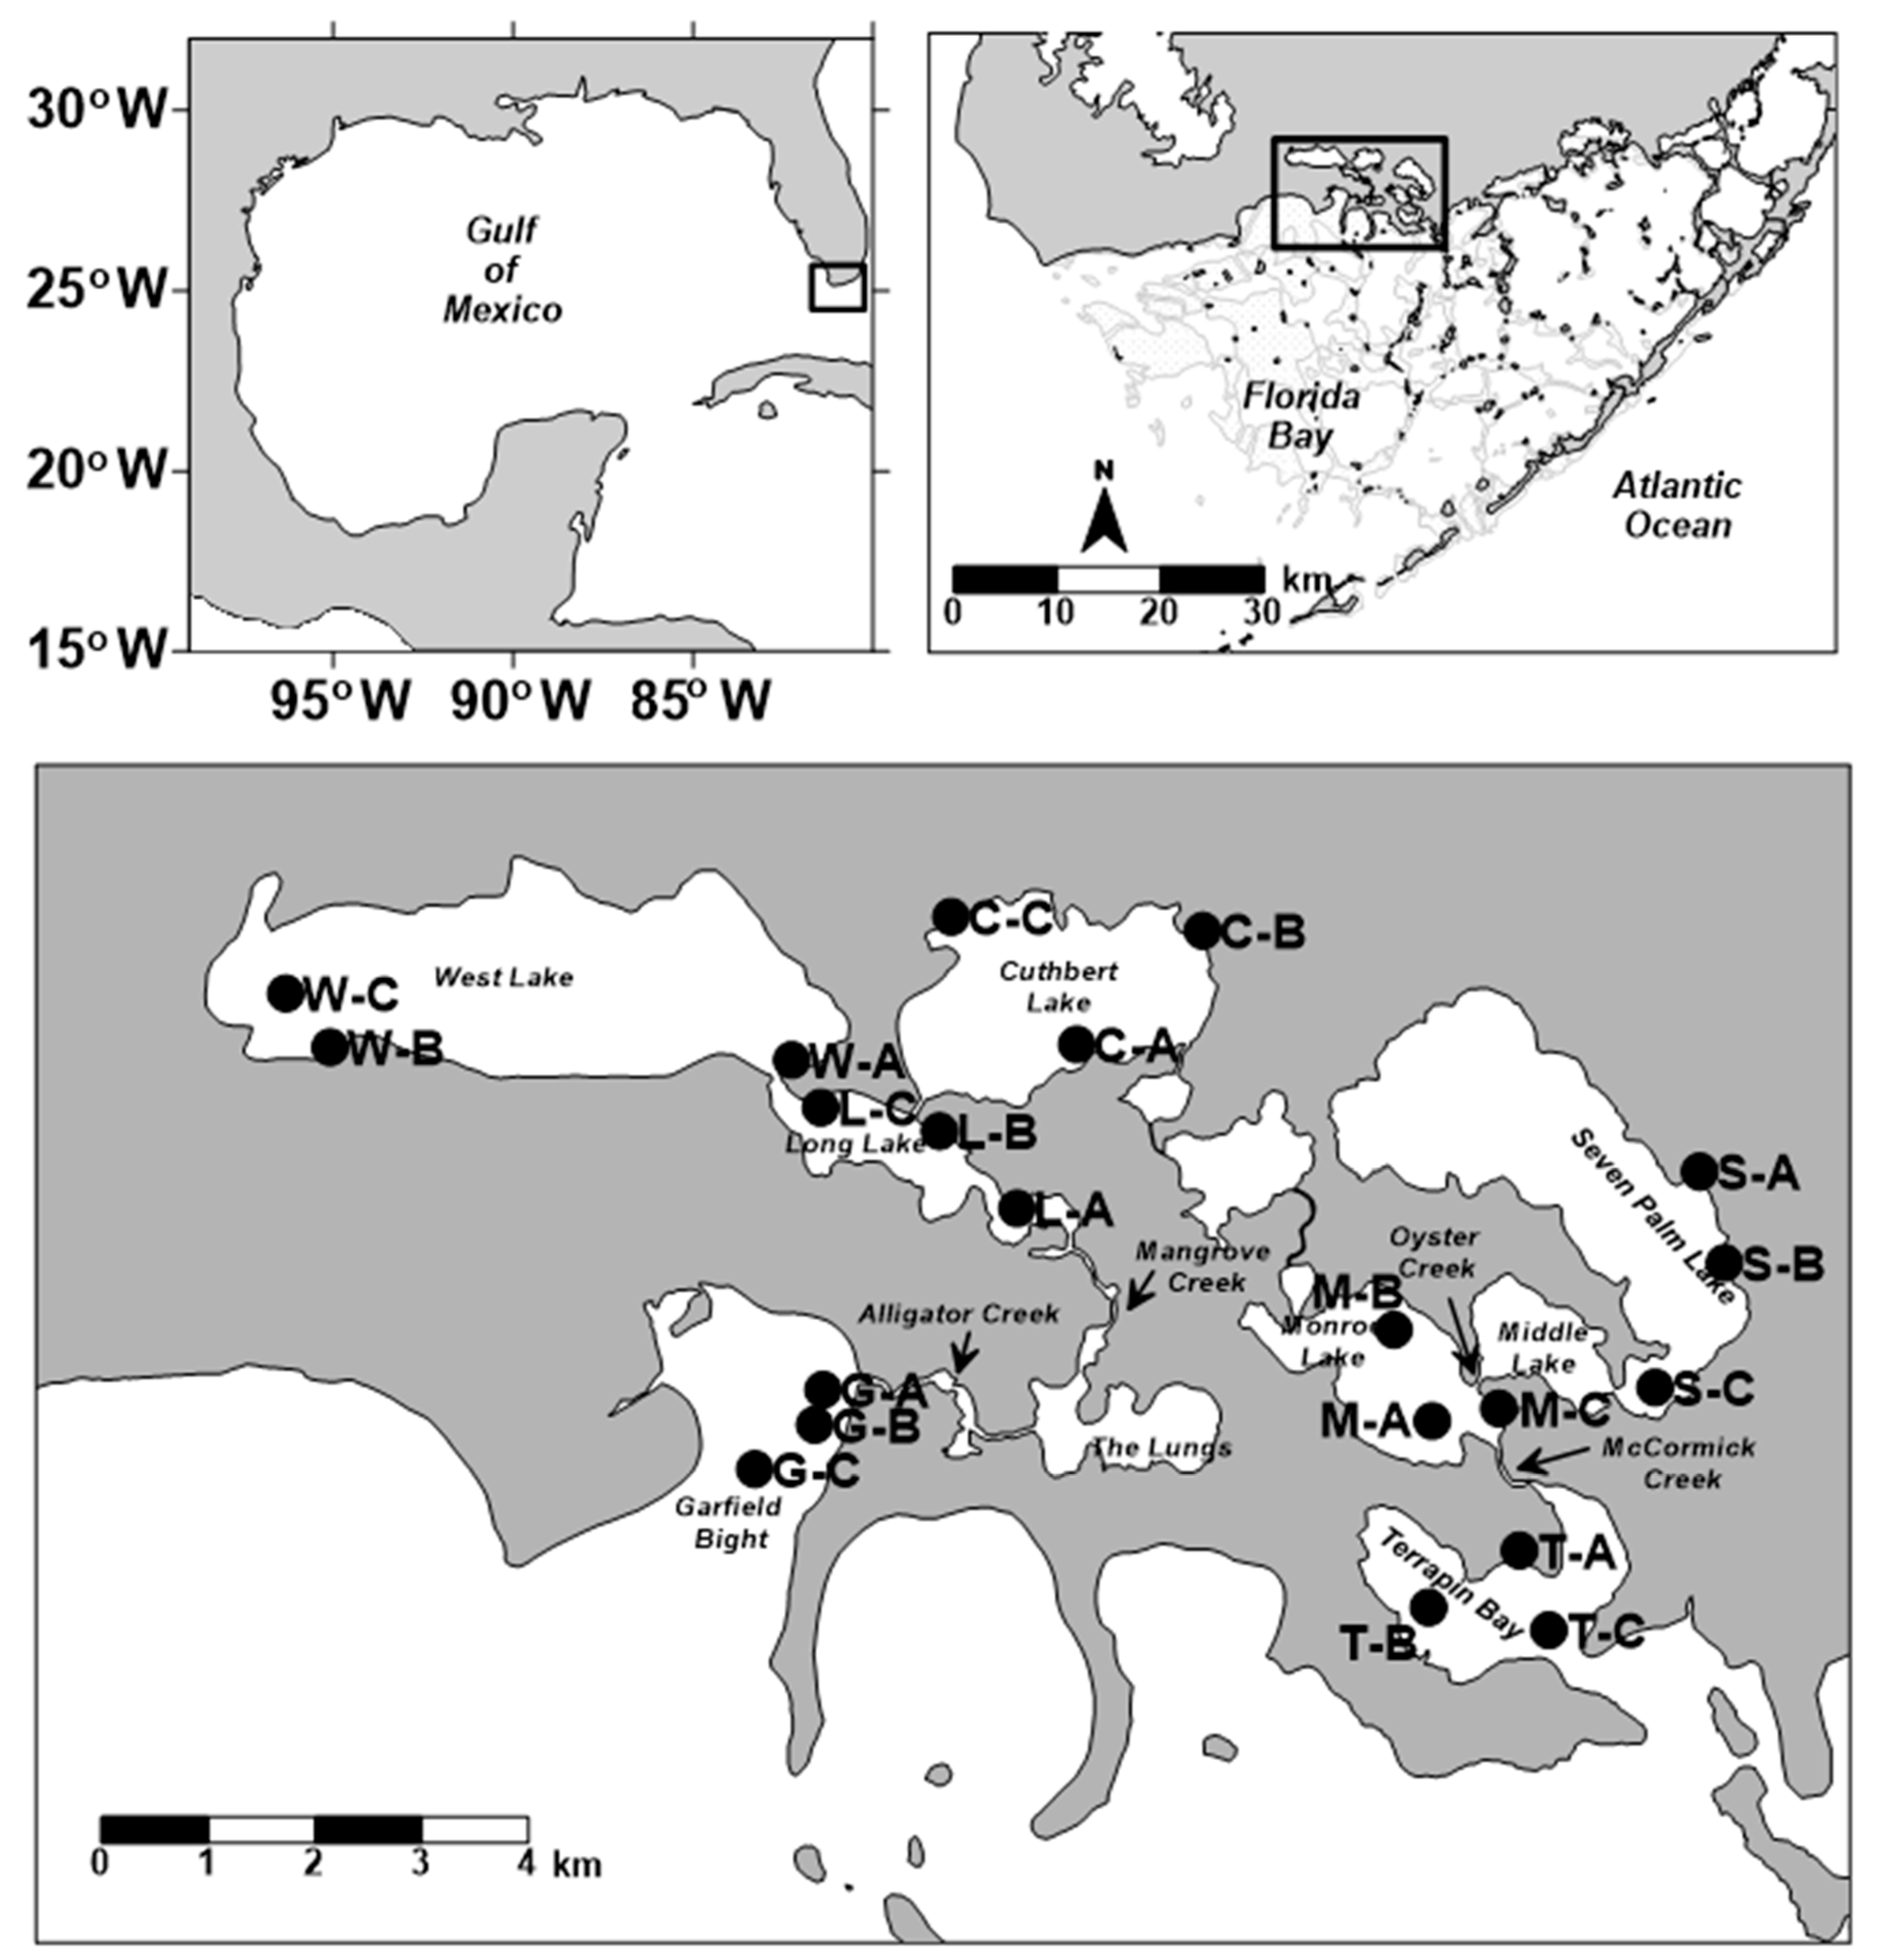
2.1. Sediment Field Collections

Translucent PVC cores, 30 cm long with a 10 cm inner diameter were pushed into the sediment by either direct insertion by hand or by use of a pole corer [19]; cores with any disturbance of the sediment–water interface were discarded. After collection, cores were shaded and returned to the incubation facility where they were placed in an incubator and set to the same temperatures observed in the field. Water for the incubation experiments was collected in 20 L carboys at the sites of the core collection. Additional site data included light levels at both the water and sediment surfaces using a Li Cor 2π PAR sensor, and both temperature and salinity measured with YSI sondes. Salinity data for West Lake was obtained from a continuous data set of recorded measurements using a YSI 6600 sonde.

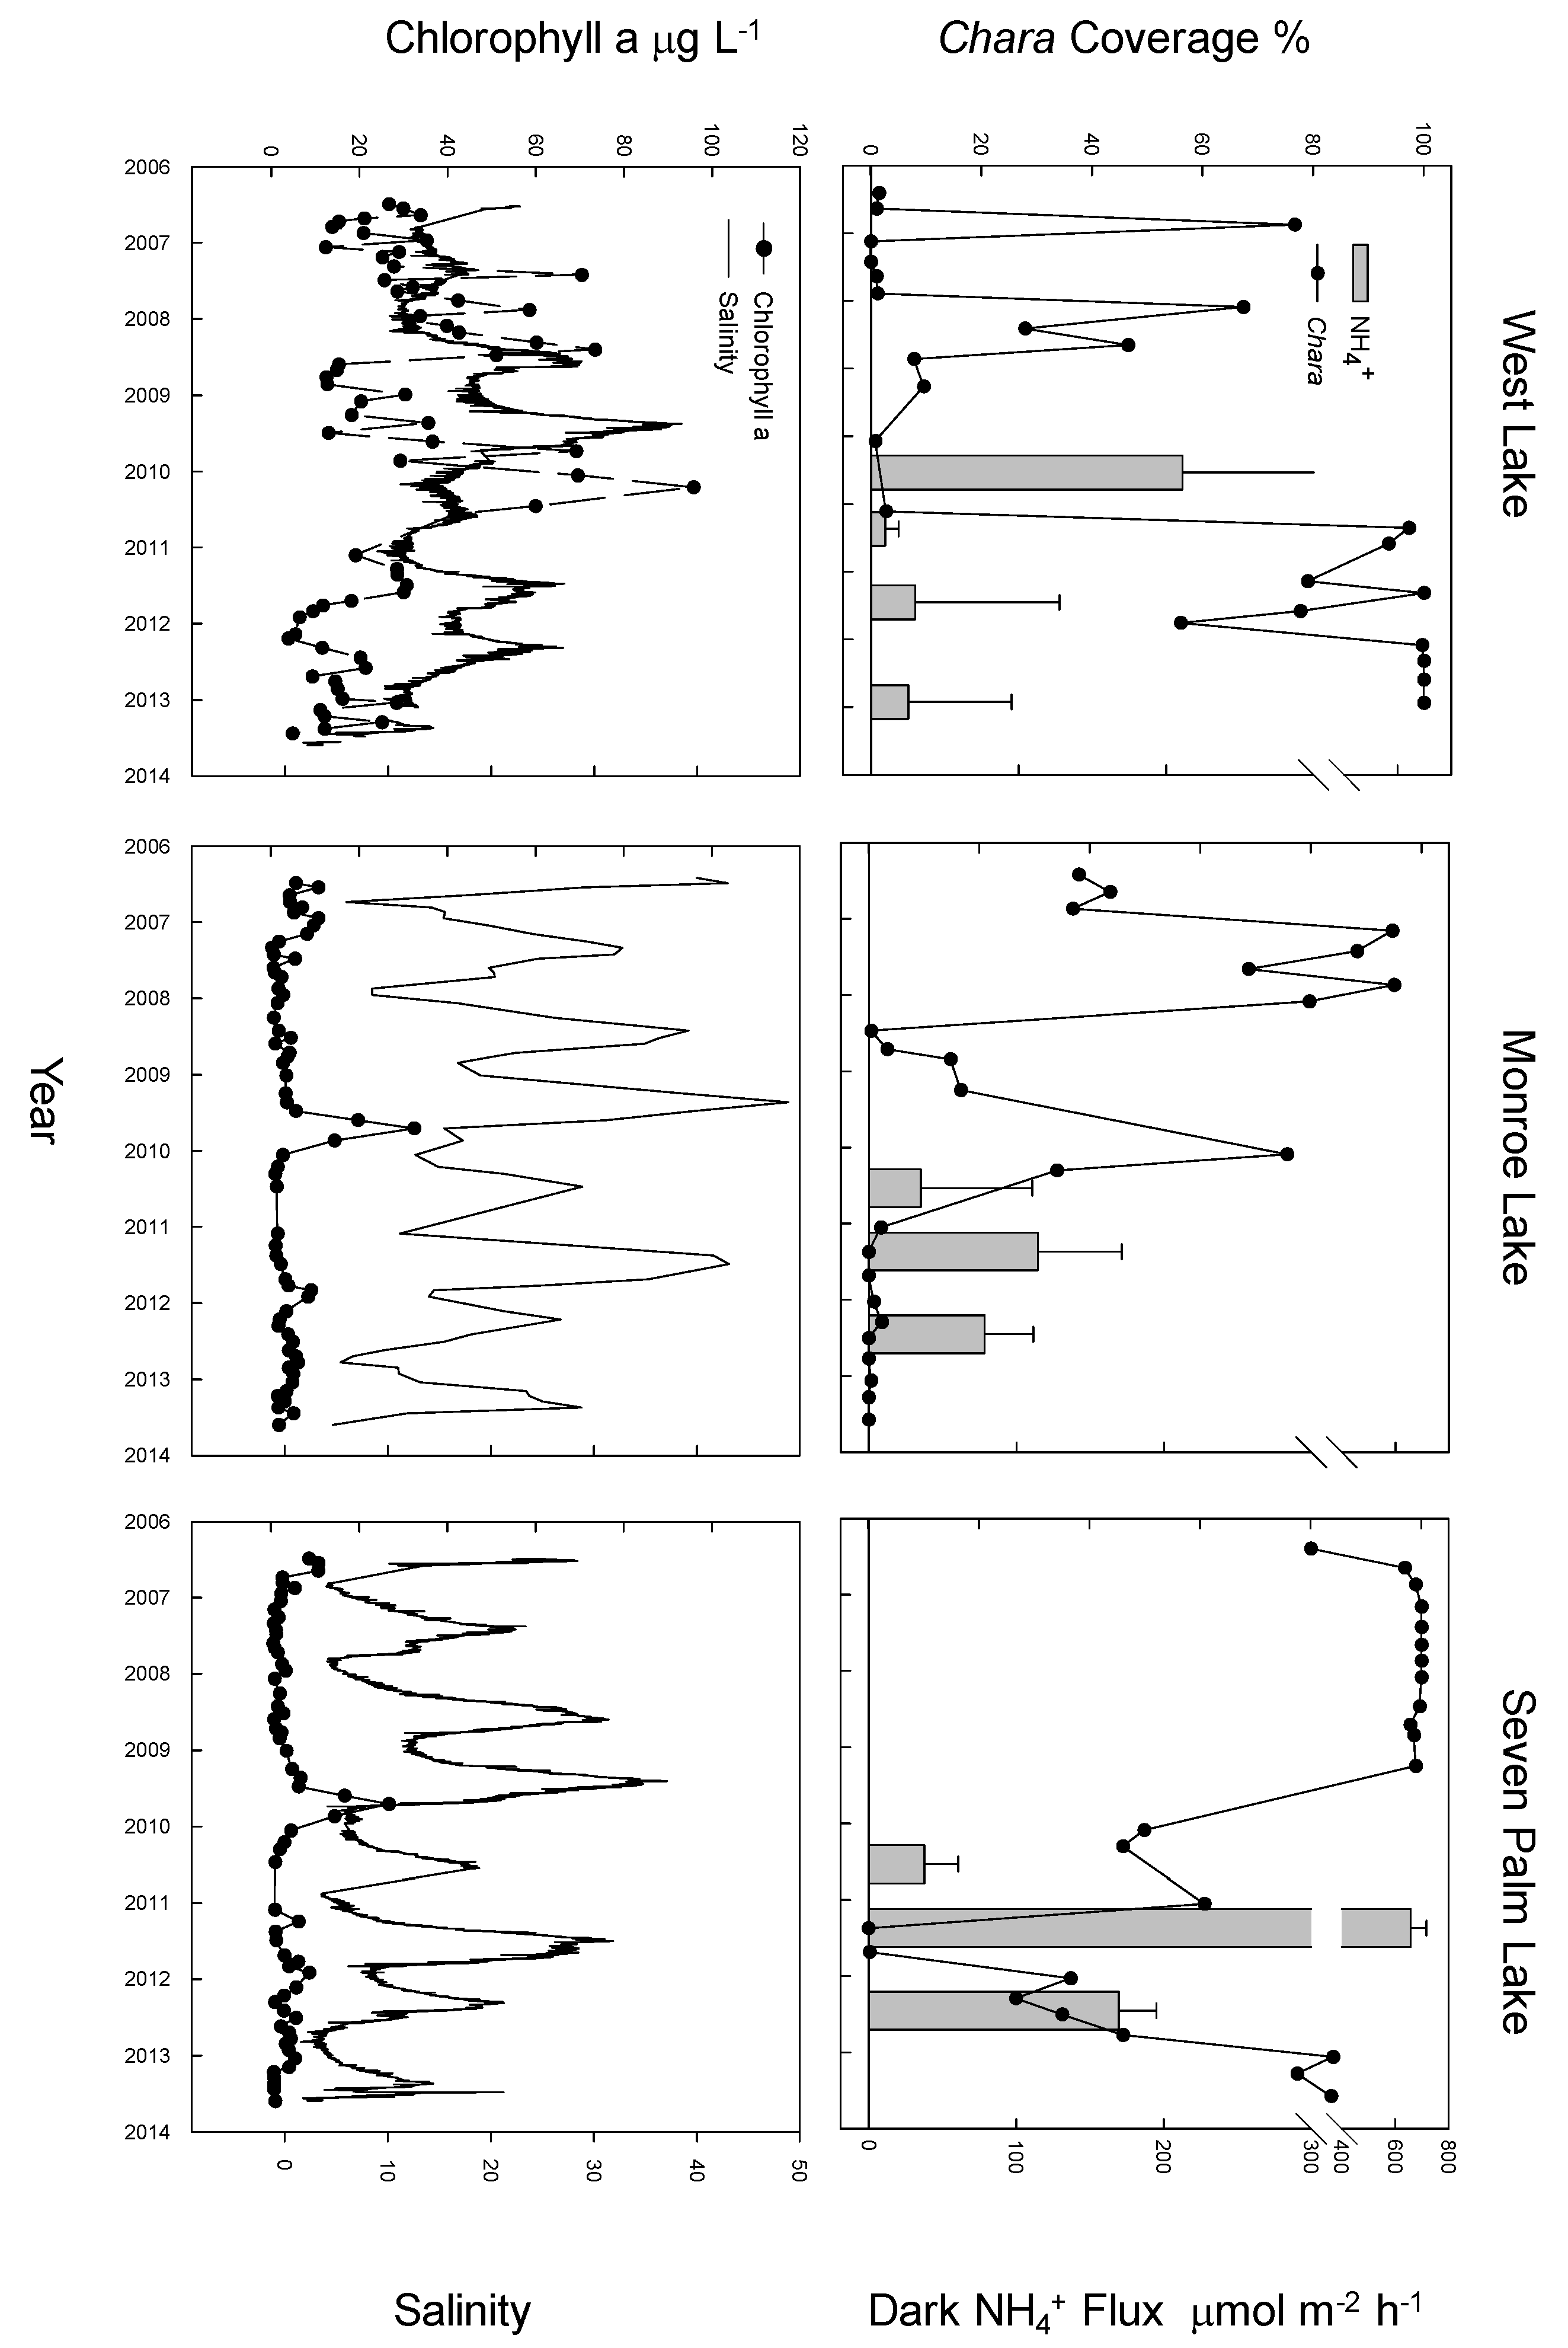
2.2. Macrophyte Coverage, Chlorophyll a and Salinity

The abundance of benthic macrophytes and sediment flux was determined at multiple sites in each lake or estuary. Unfortunately, the timing of the macrophyte surveys coincided with our sediment flux measurements only at West, Monroe, and Seven Palm Lakes. The macrophyte surveys for Cuthbert Lake, Long Lake, Garfield Bight, and Terrapin Bay were conducted a few years previous to this study. Mean percent bottom coverage was estimated from 15 observations taken within a 30 m radius of the site locations using a 0.25 m2 quadrat [5]. No Chara biomass data were collected which could introduce some uncertainty in the total amount of Chara present during sampling. Continuous measurements of water column salinity and chlorophyll a were measured with YSI 6600 sondes.

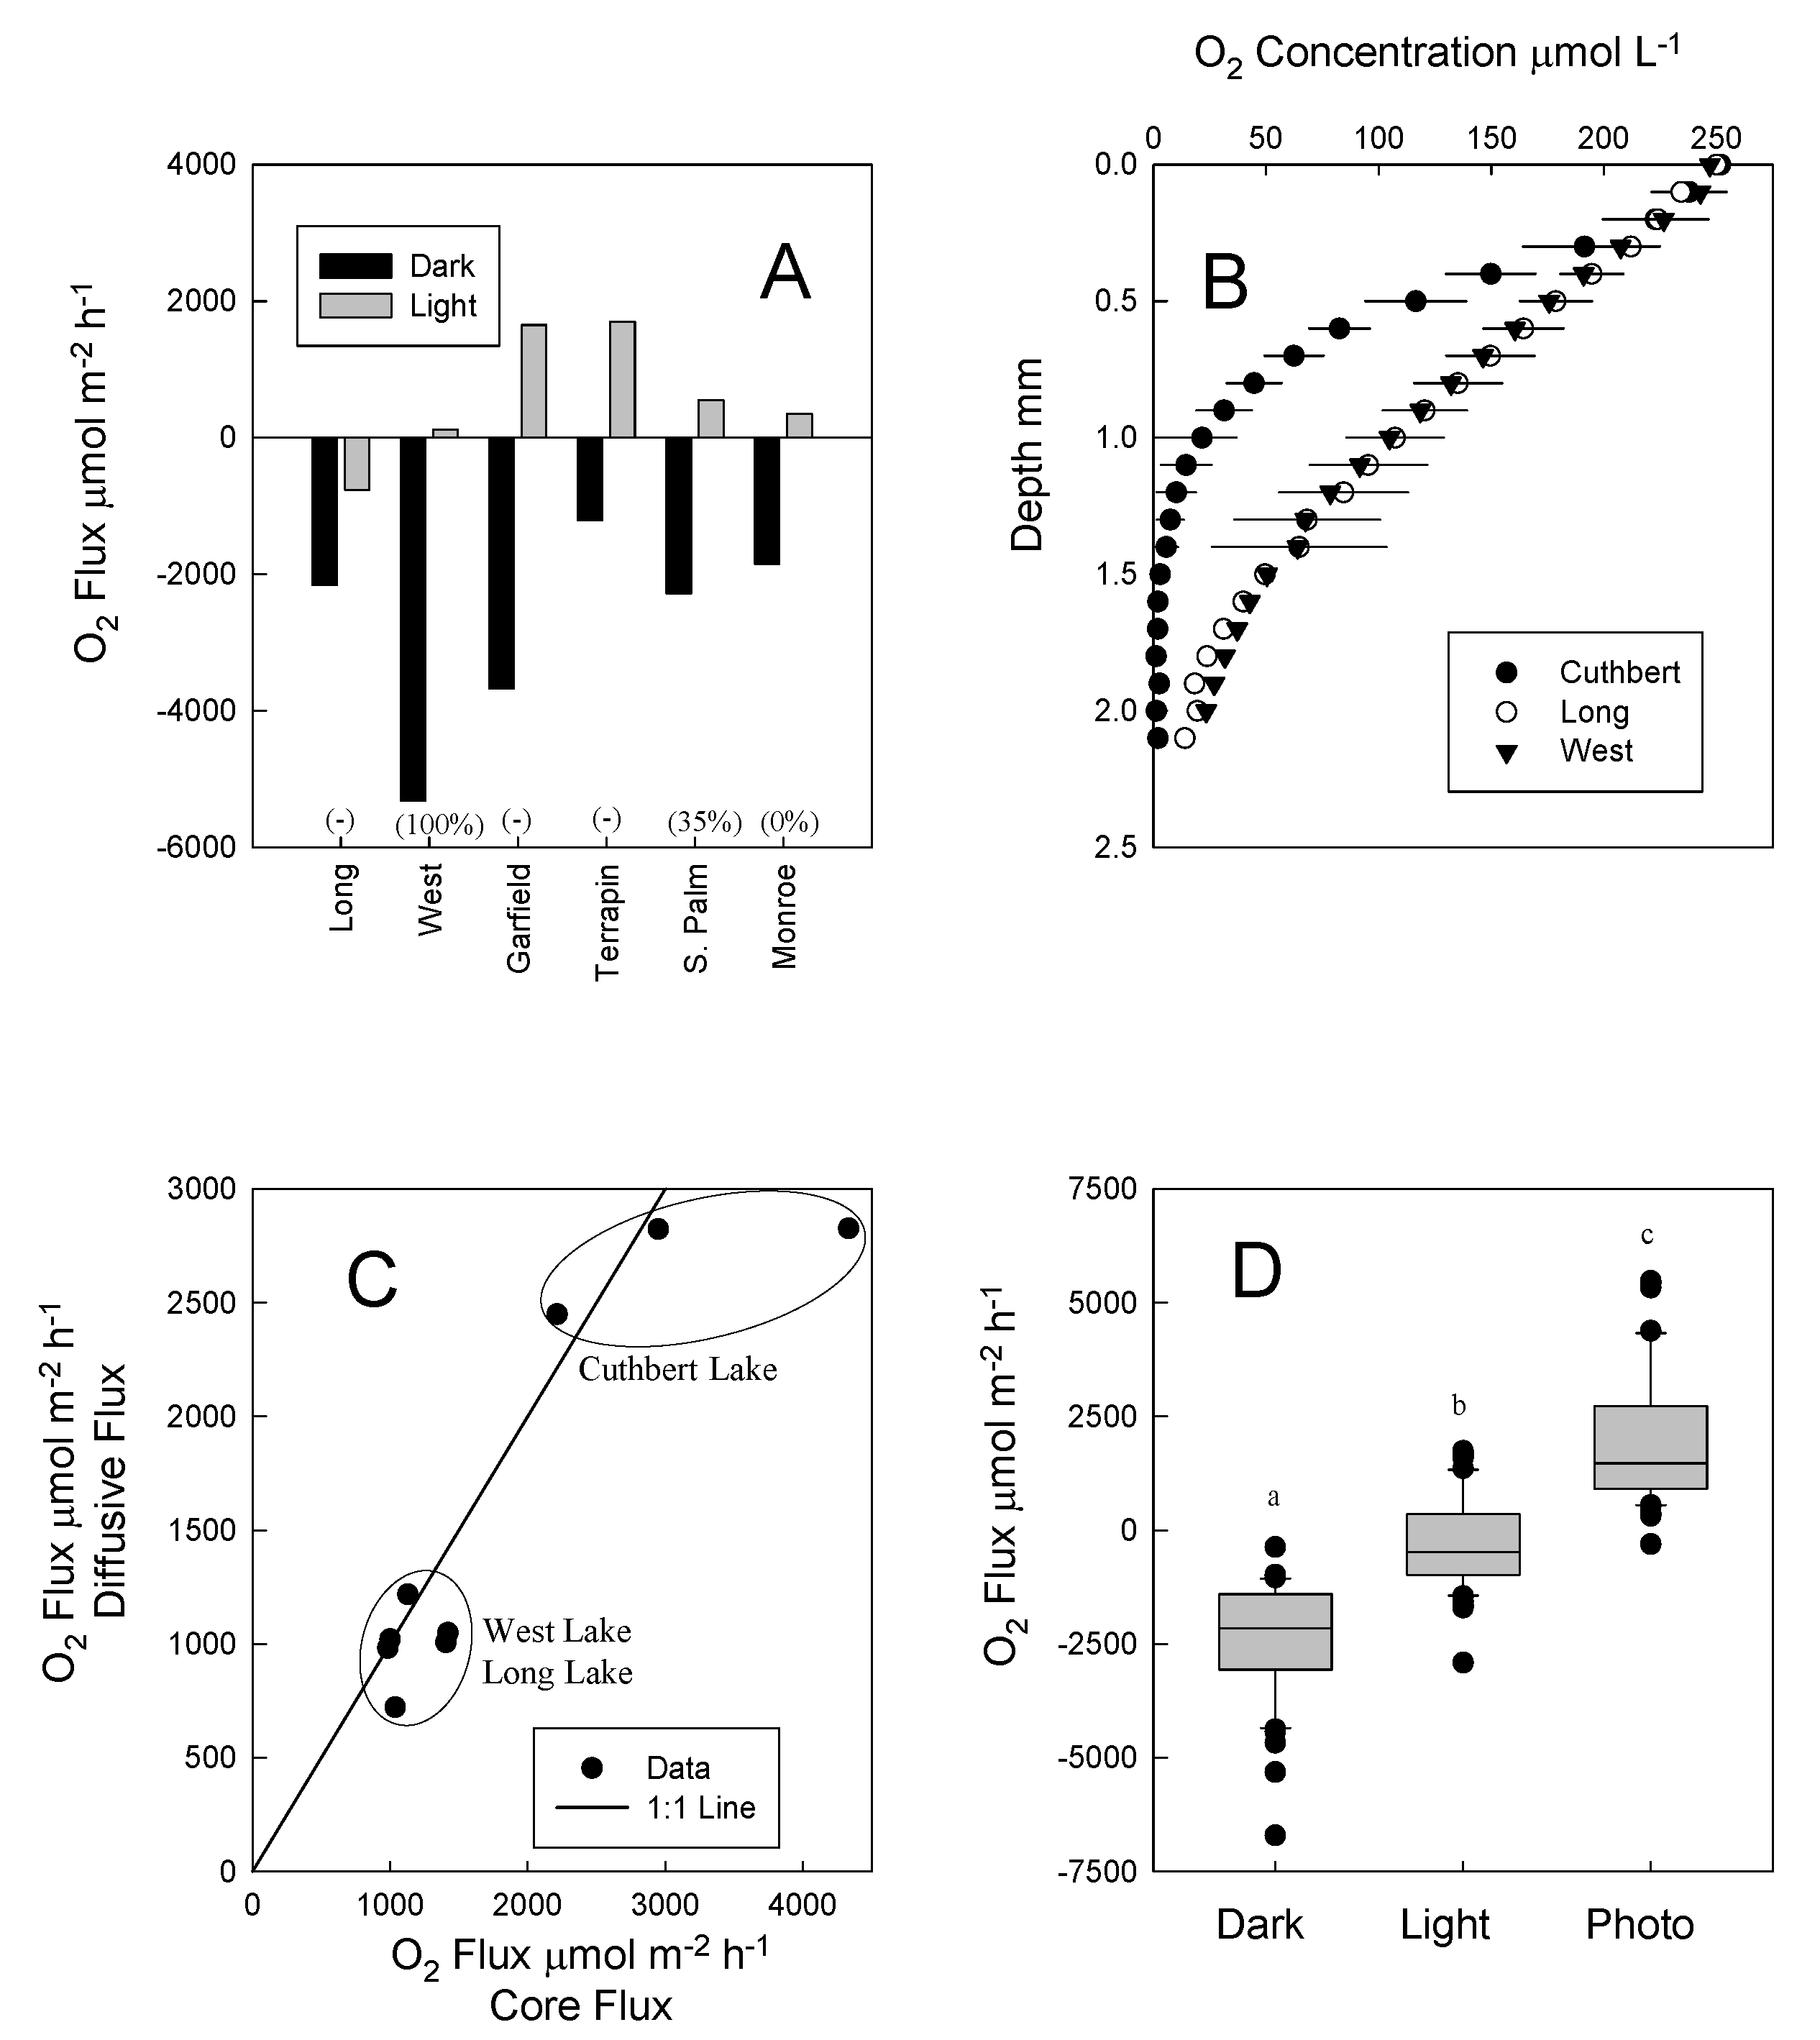
2.3. Sediment–Water Exchange Measurements

The open sediment cores were bathed overnight in overlying water and a bubble-lift system circulated the overlying water in the cores to maintain oxygen saturation [19]. The following day, stirring lids were added to the top of each of the cores. The sediment cores were incubated initially under dark conditions for ~4 h sampled at 1 h time points, followed by a 2–3 h incubation under light conditions in most cases. Seven sampling time points were used, with 3 in the dark, 1 at the light/dark transition, and 3 in the light. Oxygen levels did not drop below 50% saturation. A broad-spectrum light was provided by a Tek Light system (2010–2012 incubations), which provided an irradiance of 225 μmol photons m−2 s−1 in the tank at the level of the sediment. Previous work in Florida Bay [20] suggested that this light level saturates benthic microalgal photosynthesis. In 2013, light was provided by a Feliz 250W 6500K full spectrum compact fluorescent light which provided an additional 75 μmol photons m−2 s−1 to the sediment surface. Cores were incubated with water collected at each lake to maintain ambient salinity and nutrient concentrations. The overlying water was sampled for dissolved gases, soluble reactive phosphorus (SRP), ammonium (NH4+) and nitrate + nitrite (NO2+3). Using gravity-fed replacement water, samples for the analysis of N2, O2, and Ar were collected in 7 mL glass stoppered tubes, preserved with mercuric chloride [19] and stored under water at temperatures lower than the incubation temperature. Samples for dissolved nutrients were syringe filtered (0.45 μm) and frozen until analysis. Upon completion of the incubations, samples for benthic chlorophyll a analysis were collected using a modified syringe corer and stored frozen until analysis. Gross photosynthesis was estimated by calculating the absolute value of the difference between dark and light O2 fluxes. This calculation assumes that sediment dark respiration rate does not change in the light.

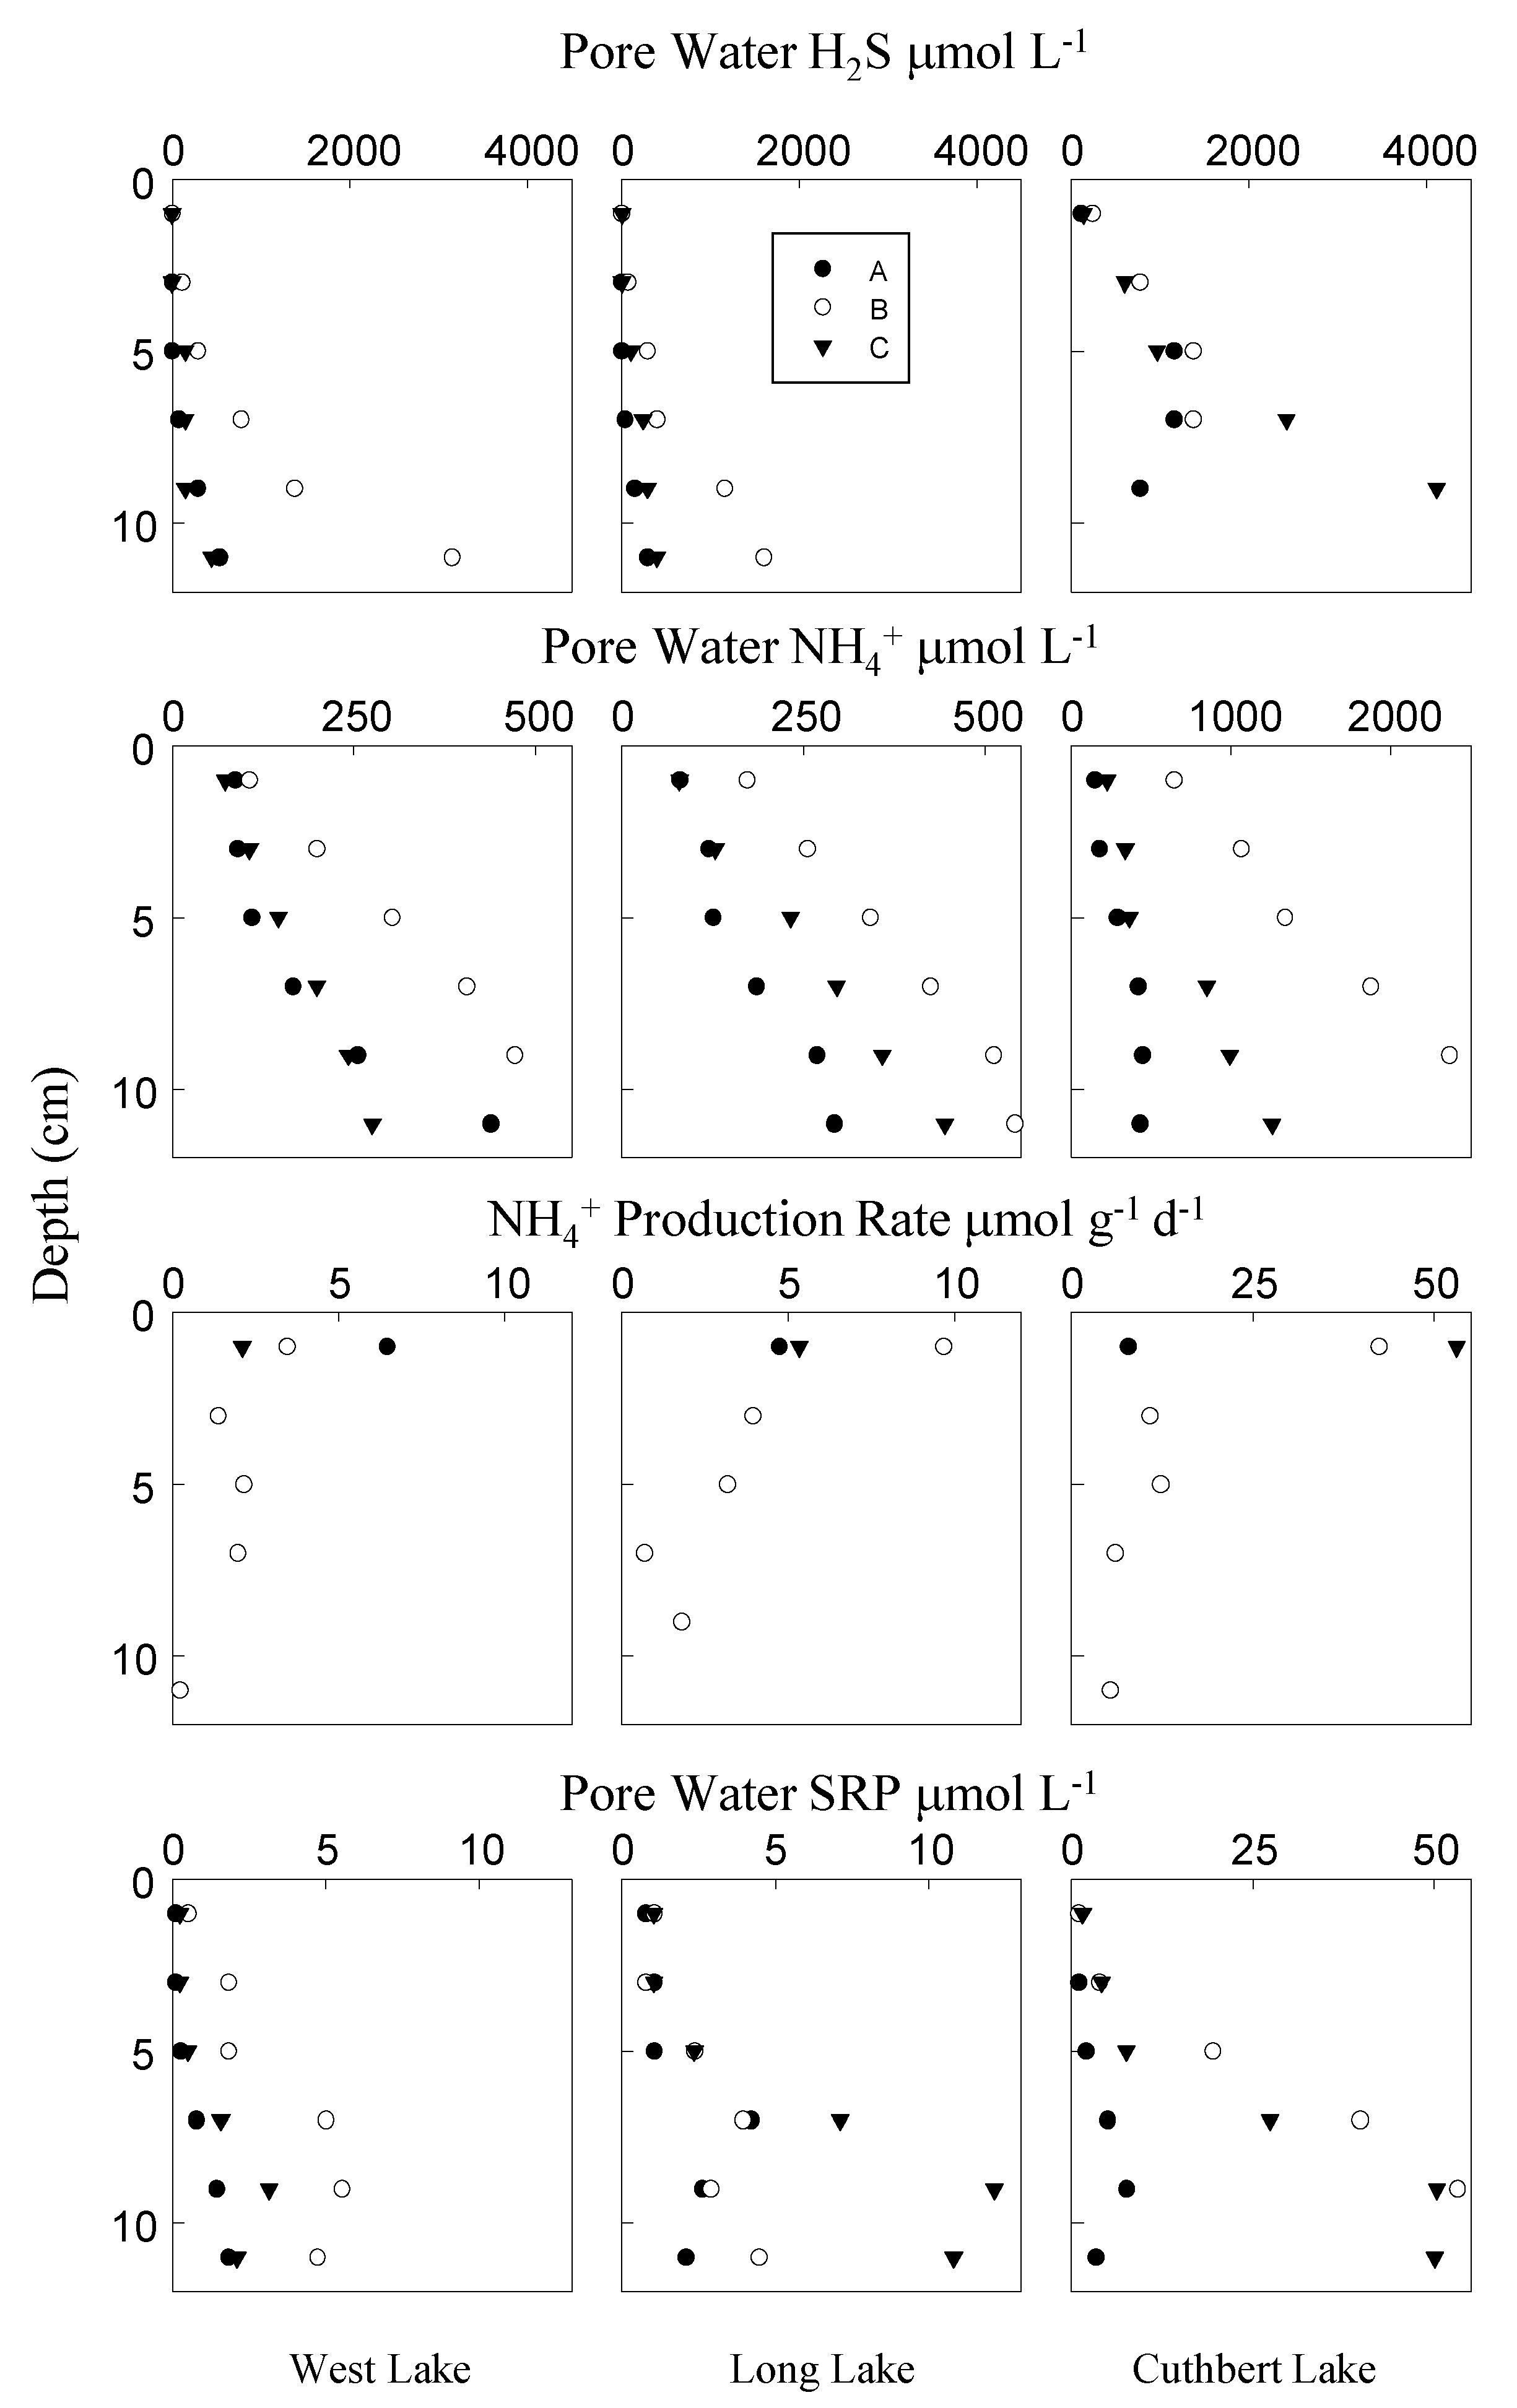
2.4. Pore Water Chemistry

Pore water chemistry was determined on the December 2013 sediment flux cores only. After the removal of the overlying water, cores were extruded within a N2-filled glove bag to minimize oxidation artifacts [21], and sectioned into 2 cm depth intervals that were then placed into 50 mL centrifuge tubes. Core sampling intervals were 0–2, 2–4, 4–6, 6–8, 8–10, and 10–12 cm. After centrifugation at 2000 G, the pore water was filtered with 0.45 μm polycarbonate filters and subsampled into individual vials. Samples for hydrogen sulfide, soluble reactive phosphorus (SRP), and ammonium (NH4+) were collected and analyzed spectrophotometrically [22,23].

2.5. Solid Phase Chemistry

Sediment chlorophyll a was determined fluorometrically after acetone extraction [23]. After water content was determined by drying at 65°C, the sediment was ground to a fine powder with a mortar and pestle. Total carbon © and N concentrations were determined using a CHN analyzer (EPA method 440.0), with sediment inorganic (carbonate) carbon determined via acidification/gas chromatography [24]. Organic carbon was calculated as the difference between the total and inorganic C. Sediment total P was determined with/without sediment ashing followed by an acid (HCl) extraction [14,25]; inorganic P was determined on acid extractions of unashed sediment. The difference between total and inorganic P was organic P [26]. The HCl extraction on unashed sediment includes P associated with carbonate/apatite, metal oxides and adsorbed components of the sediment.

2.6. Vertical Diagenetic Rate Profiles

In December 2013, volumetric rates of NH4+ production were determined using anaerobic sediment jar experiments [27,28]. In an N2-filled glove bag, 25 mL of sediment was added to a jar with a septa top, 100 mL of N2-bubbled surface water was added to fill the jar, and sealed. Jars were sampled at 0, 2, 8, and 26 days. For each sample time point, we gently swirled the sediment–water mixture prior to sampling. Samples were removed using a syringe, replacement anaerobic water was added, and the sample syringe-filtered (0.45 μm). At the end of the experiment, a well-mixed aliquot of sediment and overlying water was subsampled and extracted with KCl to estimate the concentration of adsorbed NH4+ [29]. All time course data were corrected to total NH4+ from the ratio of adsorbed to dissolved NH4+. Concentrations of NH4+ were determined spectrophotometrically [23] and production rates were determined by the linear regression of change in concentration with time.

2.7. Oxygen Microelectrode Profiles

We measured the sediment microprofiles of O2 to determine whether pore water advection by bioirrigating infauna was an important process in these saline lake sediments. Profiles of oxygen were determined in the dark using an oxygen microelectrode (Unisense LLC, 0.05 mm tip) with 0.1 mm vertical resolution intervals [30]. Diffusive fluxes of O2 across the sediment–water interface were estimated using the vertical oxygen gradient with diffusion coefficients corrected for temperature and tortuosity [31]. Microelectrode profiles of O2 were measured only in 2013 at Cuthbert Lake, Long Lake, and West Lake.

2.8. Gas and Solute Analysis

The analysis of N2:Ar and O2:Ar gas ratios was carried out by membrane inlet mass spectrometry [32] with a precision of ≤0.02%. The mass spectrometer was calibrated using water standards saturated at controlled temperatures (±0.02 °C) and gas ratios were converted to concentrations using literature coefficients [33].

3. Results

In West, Monroe and Seven Palm Lakes, high temporal variability in the coverage of the macroalga Chara hornemanii Wallman was observed during the period of this study (Figure 2). In West Lake, similar high variability in Chara coverage was noted from 2006 to 2009 [5], followed by low coverage during the period 2009–2011 and high coverage after 2011. The highest water column chlorophyll a concentrations (95.8 μg L−1) in West Lake corresponded to periods of low Chara coverage. In Monroe Lake, the highest water column chlorophyll a concentration occurred during a period of increasing Chara cover, while an increase in water column chlorophyll a in Seven Palm Lake occurred during a period of decreasing Chara cover.
The lake average sediment inorganic C concentration ranged from 4–9% CO3-C (Table 2). The total proportion of CaCO3 by mass was > 50% of the sediment mass except at Cuthbert Lake (33% CaCO3). Although grain size was not determined, these sediments were fine-grained and generally flocculent in nature. Sediment organic C concentrations were 4–13% of dry sediment weight, with Cuthbert having concentrations of 13%. Concentrations of inorganic N were 0.3–0.8% of dry sediment weight, except for Cuthbert at 1.3%. Sediment inorganic P concentrations were 0.1–0.3 mg g−1, similar to concentrations in Florida Bay and Everglades environments [34]; at Cuthbert, concentrations were higher (0.9 mg g−1). Organic P concentrations were of a similar magnitude to the inorganic P. Sediment chlorophyll a concentrations ranged from 10–60 mg m−2.
No pore water data were collected from sites in the Monroe, Terrapin, Garfield or Seven Palm. Pore water profiles of H2S, NH4+, and SRP showed moderate variability within each lake, with higher concentrations found at Cuthbert Lake (Figure 3). Hydrogen sulfide concentrations were low near the sediment–water interface at all sites, with the H2S concentrations increasing rapidly with the depth at Cuthbert Lake where the highest concentrations exceeded 2000 μmol L−1. Pore water NH4+ concentrations were high in all cores, with the profile at the Cuthbert Lake site B exceeding 1000 μmol L−1 at all depths below 2 cm. Pore water SRP concentrations were low near the sediment–water interface (<1 μmol L−1) increasing to 5–10 μmol L−1 in the West and Long Lakes. High concentrations of SRP were observed at depth in the B and C sites in Cuthbert Lake (>45 μmol L−1). Rates of NH4+ production were generally higher near the sediment–water interface and rates decreased slowly with depth in West and Long Lakes. High production rates of NH4+ were consistent with observations of higher porewater NH4+ concentrations in Cuthbert Lake. The Cuthbert Lake B profile had a very sharp decrease in NH4+ production below the top 2 cm.
Light–dark incubations of sediments showed large shifts in the rates of O2 flux, with a decrease in uptake or O2 production in the light (Figure 4A). Microelectrode profiles of O2 measured in the dark (Figure 4B) showed O2 penetration of 2 mm in Long and West Lakes, and about 1.5 mm in Cuthbert Lake. Within each lake, profiles were similar. The 2013 microelectrode O2 data provided flux estimates that were similar to core incubation fluxes, except at the highest rate of O2 uptake (Figure 4C). Combining all measurements resulted in mean O2 fluxes (±S.D.) of −2368 ± 1271, −303 ± 979, and 1914 ± 1423 μmol m−2 h−1 for dark incubations, light incubations, and gross photosynthesis, respectively (Figure 4D). A Kruskal–Wallis one-way ANOVA on ranks yielded significant (p < 0.01) differences between dark fluxes, light fluxes, and gross photosynthesis (Figure 4D).
Sediment N fluxes are plotted with boxes representing the 25th, 50th (median), and 75th percentiles with whiskers showing the lower 10th and upper 90th percentiles and dots representing data outliers (Figure 5). The median rates show a small net uptake of NOx in the light (median = −6 μmol m−2 h−1) and dark (median = −8 μmol m−2 h−1), N2–N fluxes having similar dark and light rates (median = 22 (dark), 20 (light) μmol m−2 h−1, respectively) and median dark rates of NH4+ efflux significantly higher than light rates (83 versus 25 μmol m−2 h−1; p < 0.05). The highest effluxes of NH4+ (>500 μmol m−2 h−1) were observed in May 2011 at Seven Palm Lake and at one site in Cuthbert in 2013 that had an efflux of 1283 μmol m−2 h−1. The highest rates of NH4+ efflux corresponded to periods of low Chara coverage (Figure 2). The flux of NH4+ exhibited a strong negative correlation with Chara coverage for Seven Palm, Monroe, and West Lakes; with Pearson correlation coefficients of (PCCs) −0.91, −0.71, and −0.52, respectively (Table 3).
Measurable fluxes of SRP were found on an infrequent basis, with the highest average efflux of <5 μmol m−2 h−1 (Figure 6). In the few instances where both dark and light SRP fluxes were observed, the dark rates were always higher, with the highest rates of uptake in the light from Garfield in 2011. Seven Palm and Monroe Lakes had a strong negative correlation with Chara coverage and SRP flux; with PCCs of −0.85 and −0.28, respectively (Table 3).

4. Discussion

Rates of benthic N and P exchange along this estuarine gradient were not correlated to salinity (P data not shown) (Figure 7), but highly elevated NH4+ effluxes appeared to coincide with large decreases in Chara cover (Figure 2). The observed increases in the NH4+ efflux in the absence of Chara can arise because of decomposition of the previous Chara biomass, or increased recycling from sedimented phytoplankton blooms that are more prevalent without Chara. The presence of macroalgae can regulate water column NH4+ availability through the direct sequestration of NH4+ efflux from the sediment [35,36]. Salinity may have an indirect influence on nutrient exchange into the water column by influencing Chara cover. In Monroe, Middle, and Seven Palm Lakes of the Seven Palm Lake Chain, Chara cover was inversely related to salinity [37], but this relationship was not observed in other lakes where poor water transparency coinciding with high phytoplankton concentrations limited light availability and exerted greater effects on Chara cover.
The net effect of these sediment N flux observations on the balance of algal and benthic macrophyte productivity is complicated by the lack of correspondingly high effluxes of SRP. Seven Palm and Monroe Lakes did exhibit a negative correlation between Chara coverage and SRP flux but the same trend was not observed for West Lake. The efflux of SRP under low Chara coverage, albeit small, does suggests that Chara may also help regulate the supply of SRP to the water column. Chara in Lake Okeechobee was found to sequester large amounts of SRP via direct water column uptake and possibly through stabilization of the sediment preventing resuspension [38]. Increased water column chlorophyll a concentration generally occurred during or after Chara losses, and these data suggest that effluxes of NH4+ may be an important supply of N for algal nutrition. The SRP sources for the high chlorophyll a spikes may result from either increased P release from the sediment, upstream or downstream P loading, or other sources [5,7,15]. Recent work in this system suggests that N nutrients in the form of NH4+ may be important in the development of dense picoplankton blooms [39].
Nutrient efflux/influx is a function of water column O2 concentration [40], labile organic matter sedimentation, rates of remineralization [41] and both macrophyte [11] and microalgal [10] production. These processes are influenced by temperature and salinity. Sudden increases in salinity can release NH4+ adsorbed to sediments [3]. Salinity and temperature also affect the significance of the dissimilatory nitrate reduction to the ammonium (DNRA) pathway [4] and the efficiency of P efflux [42,43]. The observed range in salinities of 3–58 psu did not account for the observed large changes in nutrient effluxes, particularly NH4+ (Figure 7). Brief diel water column anoxia/hypoxia episodes that occur seasonally in the study area may have had an impact on sediment biogeochemistry leading to short periods of higher sediment flux of both N and SRP.
Denitrification rates (net N2 effluxes) were generally much lower than observed in Florida Bay [13], and illumination appeared to have no major effect on rates in these sedimentary environments. In contrast, modeling Florida Bay sediment nutrient dynamics [20,44] suggested that benthic microalgae out-compete nitrifiers for remineralized NH4+, resulting in diminished rates of denitrification [45]. Small NO3 uptake rates suggest that denitrification may be NO3 limited, possibly because of the prevalence of DNRA in sulfidic sediments [46]. Low rates of nitrification have been observed in other sulfidic environments [47], limiting the concentration of NO3 for denitrification. The pore water profiles (Figure 3) in West and Long Lakes do not show high levels of H2S in near surface sediments, suggesting that at these locations, H2S was less important in limiting the supply of NO3 for denitrification. The supply of O2 for nitrification could also be limited in these sediments by the upward diffusion of pore water H2S.
The sedimentary environments along this estuarine gradient were generally similar to observations in other southern Everglades and Florida Bay studies. The high carbonate concentrations are consistent with sediment observations in this area and total P and N concentrations were similar to those observed in the freshwater to estuary transects in the southern Everglades [34,48,49]. Cuthbert Lake had the highest organic matter and total phosphorus concentrations observed in this study. Previous measurements of sediment P content near a Cuthbert Lake bird rookery [50] were very high (2–35 mg g−1), suggesting that these high concentrations in Cuthbert Lake are not anomalous. The lake and estuary sediment chlorophyll a concentrations were generally very similar to Florida Bay observations [51]. Low near-surface concentrations of pore water SRP are consistent with Florida Bay concentrations [52], however, concentrations > 10 μmol L−1 at depth were observed in this study. The low sediment Fe content of these carbonate sediments generally limits the Fe binding of P as a control on P release [34]. Pore water observations in seagrass beds in Florida Bay [53], showed pore water SRP concentrations ranging from below detection to 34 μmol L−1 with a median of 0.34 μmol L−1, and NH4+ concentrations between 6 and 2400 μmol L−1 with a median of 79. The occurrence of elevated SRP concentrations is coincident with the elevated concentrations of NH4+ and solid phase inorganic P shown in this study.
The average sediment dark oxygen uptake rate was within the range observed in Florida Bay [54] and pond environments in nearby Taylor Slough [55]. The Yarbro and Carlson [54] light O2 flux measurements resulted in a flux of oxygen into the overlying water, and on a 24 h basis, resulted in net oxygen fluxes that varied between net autotrophic to net heterotrophic. Presumably because of terrestrial/watershed organic carbon subsidies, the lakes in this study appeared net heterotrophic. The strong correlation between electrode and incubation methods for measuring oxygen fluxes strongly suggests that molecular diffusion rather than bioirrigation is the dominant gas transport process in the top few mm of sediment. This suggests little role for benthic animals in nutrient biogeochemistry and exchange in this system with large salinity changes. The lack of bioirrigation can also result in the lower efficiency of denitrification and promote the recycling of N nutrients from the sediments [40].
The biogeochemical implications of increased freshwater flow have been studied in a variety of ecotones [56,57,58]. The net balance of N and P within these aquatic ecosystems is a function of external inputs from the Everglades and Florida Bay, and internal cycling. Within these study lakes, Chara abundance varies seasonally where water transparency is low and over longer time periods in areas where light is less limiting [37]. Temporal cycles of macroalgal production and decomposition appear to play an important role in controlling nutrient balances in the brackish study lakes and other shallow coastal lagoons [59,60]. High salinity appears to exert an important control on Chara populations, and in turn, Chara disappearance coincides with high NH4+ effluxes from sediments and higher phytoplankton abundances. With the low temporal resolution of this study, we cannot distinguish whether the enhanced N fluxes occur from the decomposition of Chara or from the decomposition of microalgal organic matter from enhanced biomass during periods without Chara. Sediment processes are responsive to changes in the ecosystem, with variable NH4+ effluxes reflecting the trajectory of organic matter inputs. The retention of N within lake biomass and sediments during longer term periods of higher benthic macrophyte cover may buffer downstream effects of increased flow as Everglades water mixes with P-rich water of western Florida Bay [58].

5. Conclusions

These results show that changes in salinity that affect the survival of submerged aquatic vegetation affected the net exchange of N and P across the sediment–water interface. The balance of nutrient flux from the Everglades to Florida Bay is thus strongly affected by the retention of N and P during periods of macrophyte abundance. Conversely, when the Chara community is depleted, both the lack of retention by Chara and the depuration of sediment organic matter, N and P derived from both Chara and algae, diminish the role of these coastal lakes as a nutrient filter.

Author Contributions

Conceptualization, M.S.O., J.C.C., D.T.R. and S.P.K. field sampling, M.S.O., J.C.C., D.T.R., S.P.K., T.A.F. and J.W.F.; sediment analysis and flux measurements, M.S.O. and J.C.C. writing—original draft preparation, M.S.O. and J.C.C.; writing—review and editing, M.S.O., J.C.C., D.T.R., S.P.K., T.A.F. and J.W.F.; project administration, D.T.R. and S.P.K.; funding acquisition, M.S.O. and J.C.C. All authors have read and agreed to the published version of the manuscript.

Funding

This research was funded by the South Florida Water Management District.

Informed Consent Statement

Not applicable.

Data Availability Statement

The datasets generated during and/or analyzed during the current study are available from the corresponding author on reasonable request.

Acknowledgments

This work was funded by the South Florida Water Management District, and logistical support was provided by cooperative agreement between the National Park Service and Florida International University (P10AC0056/J5298100008). This is contribution #x of the Southeast Environmental Research Center at Florida International University. Laboratory space was provided by the Florida Bay Interagency Science Center.

Conflicts of Interest

The authors declare no conflict of interest. Authors S.P.K. and D.T.R. were employed by the South Florida Water Management District and provided project oversight, field assistance and participated in the review and editing of the final manuscript.

References

  1. Bernhard, A.E.; Landry, Z.C.; Blevins, A.; de la Torre, J.R.; Giblin, A.E.; Stahl, D.A. Abundance of ammonia-oxidizing archaea and bacteria along an estuarine salinity gradient in relation to potential nitrification rates. Appl. Environ. Microbiol. 2010, 76, 1285–1289. [Google Scholar] [CrossRef] [Green Version]
  2. Kelly, J.R.; Berounsky, V.M.; Nixon, S.W. Benthic-pelagic coupling and nutrient cycling across an experimental eutrophication gradient. Mar. Ecol. Prog. Ser. 1985, 26, 207–219. [Google Scholar] [CrossRef]
  3. Seitzinger, S.P.; Gardner, W.S.; Spratt, A.K. The effect of salinity on ammonium sorption in aquatic sediments: Implications for benthic nutrient recycling. Estuaries 1991, 14, 167–174. [Google Scholar] [CrossRef]
  4. Weston, N.B.; Giblin, A.E.; Banta, G.T.; Hopkinson, C.S.; Tucker, J. The effects of varying salinity on ammonium exchange in estuarine sediments of the Parker River, Massachusetts. Estuaries Coasts 2010, 33, 985–1003. [Google Scholar] [CrossRef]
  5. Frankovich, T.A.; Morrison, D.; Fourqurean, J.W. Benthic macrophyte distribution and abundance in estuarine mangrove lakes and estuaries: Relationships to environmental variables. Estuaries Coasts 2011, 34, 20–31. [Google Scholar] [CrossRef]
  6. Inglett, P.W.; Rivera-Monroy, V.H.; Wozniak, J.R. Biogeochemistry of nitrogen across the everglades landscape. Crit. Rev. Environ. Sci. Technol. 2011, 41, 187–216. [Google Scholar] [CrossRef]
  7. Koch, G.R.; Childers, D.L.; Staehr, P.A.; Price, R.M.; Davis, S.E.; Gaiser, E.E. Hydrological conditions control P loading and aquatic metabolism in an oligotrophic, subtropical estuary. Estuaries Coasts 2012, 35, 292–307. [Google Scholar] [CrossRef] [Green Version]
  8. Sutula, M.A.; Perez, B.C.; Reyes, E.; Childers, D.L.; Davis, S.; Day, J.W.; Rudnick, D.; Sklar, F. Factors affecting spatial and temporal variability in material exchange between the Southern Everglades wetlands and Florida Bay (USA). Estuar. Coast. Shelf Sci. 2003, 57, 757–781. [Google Scholar] [CrossRef]
  9. Kotun, K.; Renshaw, A. Taylor slough hydrology. Wetlands 2014, 34, 9–22. [Google Scholar] [CrossRef]
  10. Armitage, A.R.; Frankovich, T.A.; Fourqurean, J.W. Variable responses within epiphytic and benthic microalgal communities to nutrient enrichment. Hydrobiologia 2006, 569, 423–435. [Google Scholar] [CrossRef] [Green Version]
  11. Ferdie, M.; Fourqurean, J.W. Responses of seagrass communities to fertilization along a gradient of relative availability of nitrogen and phosphorus in a carbonate environment. Limnol. Oceanogr. 2004, 49, 2082–2094. [Google Scholar] [CrossRef] [Green Version]
  12. McCarthy, M.J.; Gardner, W.S.; Lavrentyev, P.J. Water column nitrogen cycling and microbial plankton in Florida Bay. Contrib. Mar. Sci. 2009, 38, 49–62. [Google Scholar]
  13. Gardner, W.S.; McCarthy, M.J. Nitrogen dynamics at the sediment-water interface in shallow, sub-tropical Florida Bay: Why denitrification efficiency may decrease with increased eutrophication. Biogeochemistry 2009, 95, 185–198. [Google Scholar] [CrossRef]
  14. Chambers, R.M.; Fourqurean, J.W.; Macko, S.A.; Hoppenot, R. Biogeochemical effects of iron availability on primary producers in a shallow marine carbonate environment. Limnol. Oceanogr. 2001, 46, 1278–1286. [Google Scholar] [CrossRef] [Green Version]
  15. Fourqurean, J.W.; Jones, R.D.; Zieman, J.C. Process influencing water column nutrient characteristics and phosphorus limitation of phytoplankton biomass in Florida Bay, FL, USA: Inferences from spatial distributions. Estuar. Coast. Shelf Sci. 1993, 36, 295–314. [Google Scholar] [CrossRef]
  16. Miller, C.J.; Davis, S.E.; Roelke, D.L.; Li, H.-P.; Driffill, M.J. Factors influencing algal biomass in intermittently connected, subtropical coastal ponds. Wetlands 2009, 29, 759–771. [Google Scholar] [CrossRef]
  17. Shangguan, Y.; Glibert, P.M.; Alexander, J. Phytoplankton assemblage response to changing nutrients in Florida Bay: Results of mesocosm studies. J. Exp. Mar. Biol. Ecol. 2017, 494, 38–53. [Google Scholar] [CrossRef]
  18. Accoroni, S.; Totti, C.; Romagnoli, T.; Giulietti, S.; Glibert, P.M. Distribution and potential toxicity of benthic harmful dinoflagellates in waters of Florida Bay and the Florida Keys. Mar. Environ. Res. 2020, 155, 104891. [Google Scholar] [CrossRef]
  19. Owens, M.S.; Cornwell, J.C. The benthic exchange of O2, N2 and dissolved nutrients using small core incubations. J. Vis. Exp. 2016. [Google Scholar] [CrossRef] [Green Version]
  20. Evans, J.L.B. The Effect of Benthic Microalgal Photosynthetic Oxygen Production on Nitrogen Fluxes Across the Sediment-Water Interface in a Shallow, Sub-Tropical Estuary. Master’s Thesis, University of Maryland, College Park, MD, USA, 2005. [Google Scholar]
  21. Bray, J.T.; Bricker, O.P.; Troup, B.N. Phosphate in interstitial waters of anoxic sediments: Oxidation effects during sampling procedure. Science 1973, 180, 1362–1364. [Google Scholar] [CrossRef]
  22. Cline, J.D. Spectrophotometric determination of hydrogen sulfide in natural waters. Limnol. Oceanogr. 1969, 14, 454–458. [Google Scholar] [CrossRef]
  23. Parsons, T.R.; Maita, Y.; Lalli, C.M. A Manual of Chemical and Biological Methods for Seawater Analysis; Pergamon Press: Oxford, UK, 1984. [Google Scholar]
  24. Stainton, M.P. A syringe gas-stripping procedure for gas-chromatographic determination of dissolved inorganic and organic carbon in fresh water and carbonates in sediments. J. Fish. Res. Board Can. 1973, 30, 1441–1445. [Google Scholar] [CrossRef]
  25. Aspila, K.I.; Agemian, H.; Chau, A.S. A semi-automated method for the determination of inorganic, organic and total phosphate in sediments. Analyst 1976, 101, 187–197. [Google Scholar] [CrossRef] [PubMed]
  26. Krom, M.D.; Berner, R.A. The diagenesis of phosphorus in a nearshore marine sediment. Geochim. Cosmochim. Acta 1981, 45, 207–216. [Google Scholar] [CrossRef]
  27. Burdige, D.J. The effects of sediment slurrying on microbial processes, and the role of amino acids as substrates for sulfate reduction in anoxic marine sediments. Biogeochemistry 1989, 8, 1–23. [Google Scholar] [CrossRef]
  28. Rosenfeld, J.K. Nitrogen diagenesis in Long Island sound sediments. Am. J. Sci. 1981, 281, 436–462. [Google Scholar] [CrossRef]
  29. Cornwell, J.C.; Owens, M.S. Quantifying sediment nitrogen releases associated with estuarine dredging. Aquat. Geochem. 2011, 17, 499. [Google Scholar] [CrossRef]
  30. Revsbech, N.P. An oxygen microsensor with a guard cathode. Limnol. Oceanogr. 1989, 34, 474–478. [Google Scholar] [CrossRef]
  31. Glud, R.N.; Gundersen, J.K.; Jørgensen, B.B.; Revsbech, N.P.; Schulz, H.D. Diffusive and total oxygen uptake of deep-sea sediments in the eastern South Atlantic Ocean: In situ and laboratory measurements. Deep Sea Res. Part I 1994, 41, 1767–1788. [Google Scholar] [CrossRef]
  32. Kana, T.M.; Darkangelo, C.; Hunt, M.D.; Oldham, J.B.; Bennett, G.E.; Cornwell, J.C. Membrane inlet mass spectrometer for rapid high-precision determination of N2, O2, and Ar in environmental water samples. Anal. Chem. 1994, 66, 4166–4170. [Google Scholar] [CrossRef]
  33. Colt, J. Computation of Dissolved Gas Concentrations In Water As Functions Of Temperature, Salinity and Pressure; Special Publication 14; American Fisheries Society: Bethesda, MD, USA, 1984. [Google Scholar]
  34. Chambers, R.M.; Pederson, K.A. Variation in soil phosphorus, sulfur, and iron pools among south Florida wetlands. Hydrobiologia 2006, 569, 63–70. [Google Scholar] [CrossRef] [Green Version]
  35. Vermeer, C.P.; Escher, M.; Portielje, R.; de Klein, J.J.M. Nitrogen uptake and translocation by Chara. Aquat. Bot. 2003, 76, 245–258. [Google Scholar] [CrossRef]
  36. Kufel, L.; Kufel, I. Chara beds acting as nutrient sinks in shallow lakes—A review. Aquat. Bot. 2002, 72, 249–260. [Google Scholar] [CrossRef]
  37. Frankovich, T.A.; Barr, J.G.; Morrison, D.; Fourqurean, J.W. Differing temporal patterns of Chara hornemannii cover correlate to alternate regimes of phytoplankton and submerged aquatic-vegetation dominance. Mar. Freshw. Res. 2012, 63, 1005–1014. [Google Scholar] [CrossRef] [Green Version]
  38. Steinman, A.D.; Meeker, R.H.; Rodusky, A.J.; Davis, W.P.; Hwang, S.-J. Ecological properties of charophytes in a large subtropical lake. J. N. Am. Benthol. Soc. 1997, 16, 781–793. [Google Scholar] [CrossRef]
  39. Shangguan, Y.; Glibert, P.M.; Alexander, J.A.; Madden, C.J.; Murasko, S. Nutrients and phytoplankton in semienclosed lagoon systems in Florida Bay and their responses to changes in flow from Everglades restoration: Responses in Florida Bay to everglades restoration. Limnol. Oceanogr. 2017, 62, S327–S347. [Google Scholar] [CrossRef] [Green Version]
  40. Owens, M.S.; Cornwell, J.C. Temporal enhancement of denitrification in bioirrigated estuarine sediments. Aquat. Sci. 2020, 82, 1–12. [Google Scholar] [CrossRef]
  41. Grenz, C.; Cloern, J.E.; Hager, S.W.; Cole, B.E. Dynamics of nutrient cycling and related benthic nutrient and oxygen fluxes during a spring phytoplankton bloom in South San Francisco Bay (USA). Mar. Ecol. Prog. Ser. 2000, 197, 67–80. [Google Scholar] [CrossRef] [Green Version]
  42. Caraco, N.; Cole, J.; Likens, G.E. A comparison of phosphorus immobilization in sediments of freshwater and coastal marine systems. Biogeochemistry 1990, 9, 277–290. [Google Scholar] [CrossRef]
  43. Froelich, P.N. Kinetic control of dissolved phosphate in natural rivers and estuaries: A primer on the phosphate buffer mechanism. Limnol. Oceanogr. 1988, 33, 649–668. [Google Scholar] [CrossRef]
  44. Hochard, S.; Pinazo, C.; Grenz, C.; Evans, J.L.B.; Pringault, O. Impact of microphytobenthos on the sediment biogeochemical cycles: A modeling approach. Ecol. Modell. 2010, 221, 1687–1701. [Google Scholar] [CrossRef]
  45. Nils, R.-P. Coupled nitrification-denitrification in autotrophic and heterotrophic estuarine sediments: On the influence of benthic microalgae. Limnol. Oceanogr. 2003, 48, 93–105. [Google Scholar] [CrossRef] [Green Version]
  46. Giblin, A.E.; Tobias, C.R.; Song, B.; Weston, N.; Banta, G.T.; Rivera-Monroy, V.H. The importance of dissimilatory nitrate reduction to ammonium (DNRA) in the nitrogen cycle of coastal ecosystems. Oceanography 2013, 26, 124–131. [Google Scholar] [CrossRef] [Green Version]
  47. Joye, S.B.; Hollibaugh, J.T. Influence of sulfide inhibition of nitrification on nitrogen regeneration in sediments. Science 1995, 270, 623–625. [Google Scholar] [CrossRef]
  48. Castañeda-Moya, E.; Twilley, R.R.; Rivera-Monroy, V.H.; Zhang, K.; Davis, S.E.; Ross, M. Sediment and nutrient deposition associated with Hurricane Wilma in mangroves of the Florida Coastal Everglades. Estuaries Coasts 2010, 33, 45–58. [Google Scholar] [CrossRef]
  49. Koch, M.S.; Benz, R.E.; Rudnick, D.T. Solid-phase phosphorus pools in highly organic carbonate sediments of northeastern Florida Bay. Estuar. Coast. Shelf Sci. 2001, 52, 279–291. [Google Scholar] [CrossRef] [Green Version]
  50. Lund, E.H. Phosphate contents of sediments near bird rookeries in South Florida. Econ. Geol. 1957, 52, 582–583. [Google Scholar] [CrossRef]
  51. Neely, M.B. Benthic Microalgae and Nutrient Flux in Florida Bay, USA. Ph.D. Thesis, University of South Florida, Tampa, FL, USA, 2008. [Google Scholar]
  52. Jensen, H.S.; Nielsen, O.I.; Koch, M.S.; de Vicentea, I. Phosphorus release with carbonate dissolution coupled to sulfide oxidation in Florida Bay seagrass sediments. Limnol. Oceanogr. 2009, 54, 1753–1764. [Google Scholar] [CrossRef] [Green Version]
  53. Fourqurean, J.W.; Zieman, J.C.; Powell, G.V.N. Relationships between porewater nutrients and seagrasses in a subtropical carbonate environment. Mar. Biol. 1992, 114, 57–65. [Google Scholar]
  54. Yarbro, L.A.; Carlson, P.R. Community oxygen and nutrient fluxes in seagrass beds of Florida Bay, USA. Estuaries Coasts 2008, 31, 877–897. [Google Scholar] [CrossRef]
  55. Liu, K.J.; Li, H.P.; Davis, S.E. Benthic exchange of C, N, and P along the estuarine ecotone of lower Taylor Slough, Florida (USA): Effect of seasonal flows and phosphorus availability. Wetlands 2014, 34, 113–122. [Google Scholar] [CrossRef]
  56. Boyer, J.N.; Dailey, S.K.; Gibson, P.J.; Rogers, M.T. The role of dissolved organic matter bioavailability in promoting phytoplankton blooms in Florida Bay. Hydrobiologia 2006, 569, 71–85. [Google Scholar] [CrossRef]
  57. Childers, D.L.; Boyer, J.N.; Davis, S.E.; Madden, C.J.; Rudnick, D.T.; Sklar, F.H. Relating precipitation and water management to nutrient concentrations in the oligotrophic “upside-down” estuaries of the Florida Everglades. Limnol. Oceanogr. 2006, 51, 602–616. [Google Scholar] [CrossRef] [Green Version]
  58. Rudnick, D.T.; Chen, Z.; Childers, D.L.; Fontaine, T.D. Phosphorus and nitrogen inputs to Florida Bay: The importance of the Everglades watershed. Estuaries 1999, 22, 398–416. [Google Scholar] [CrossRef]
  59. Sfriso, A.; Pavoni, B.; Marcomini, A.; Raccanelli, S.; Orio, A.A. Particulate matter deposition and nutrient fluxes onto the sediments of the venice lagoon. Environ. Technol. 1992, 13, 473–483. [Google Scholar] [CrossRef]
  60. Castel, J.; Caumette, P.; Herbert, R. Eutrophication gradients in coastal lagoons as exemplified by the Bassin d’Arcachon and the Etang du Prévost. Hydrobiologia 1996, 329, 9–28. [Google Scholar] [CrossRef]
Figure 1. Location of Everglades Study Lakes and sampling sites.
Jmse 09 00626 g001
Figure 2. Time courses of coverage of Chara, water column chlorophyll a concentrations, salinity and sediment–water ammonium exchange for West, Monroe, and Seven Palm Lakes. The sediment flux data are average (+S.D.) fluxes are from three sites within each lake.
Jmse 09 00626 g002
Figure 3. Pore water biogeochemical profiles from December 2013 for West, Long, and Cuthbert Lakes. The NH4+ production rates were determined by anaerobic incubation.
Jmse 09 00626 g003
Figure 4. Oxygen flux data from southern Everglades estuarine environments. Light–dark data (A) from single cores illustrate the effects of benthic microalgae. Numbers in parentheses indicate Chara coverage and negative signs indicate no Chara present at sampling (no coverage data available). Oxygen microelectrode profiles (B) are the average (+/− S.D.) of three cores from the three lake systems sampled in 2013. A comparison of O2 fluxes calculated from microelectrode profiles to core fluxes is plotted relative to the 1:1 line (C). All lake and estuarine oxygen flux data are presented as box plots (D), with dark, light, and photosynthesis rates all significantly different (p < 0.001, Kruskal–Wallis one-way ANOVA on ranks). The 10th and 90th percentiles (whiskers) along with the 25th, 50th (median), and 75th percentiles (boxes). Dots represent outliers in the data. Letters above bars denote significance.
Jmse 09 00626 g004
Figure 5. Box plots of all N2–N and NH4+ flux data. The 10th and 90th percentiles (whiskers) along with the 25th, 50th (median), and 75th percentiles (boxes). Dots represent outliers in the data. Significant differences were observed between dark and light NH4+ flux data and between both N2–N fluxes and dark NH4+ fluxes (p < 0.05), Kruskal–Wallis one-way ANOVA on ranks.
Jmse 09 00626 g005
Figure 6. Sediment–water exchange of SRP. Only data with significant SRP fluxes are shown. Bars represent the average of 3 cores with errors bars indicating +/− 1 standard deviation.
Jmse 09 00626 g006
Figure 7. Sediment–water exchange of dark NH4+ versus salinity for all individual core measurements.
Jmse 09 00626 g007
Table 1. Florida coastal lake site locations, dates, and measured parameters.
SiteDateSediment FluxPorewaterDiagenetic NH4+O2 ProfilesChara
WestJuly 2010
May 2011
June 2012
December 2013
LongJuly 2010
May 2011
December 2013
CuthbertJune 2012
December 2013
Seven PalmJuly 2010
May 2011
June 2012
MonroeJuly 2010
May 2011
June 2012
TerrapinJuly 2010
May 2011
GarfieldJuly 2010
May 2011
Table 2. Site locations, temperature, and salinity for each sample time. The sediment data are the averages of all measurements over time. All are saline lake environments except Terrapin and Garfield Bights which are shallow embayments within Florida Bay. Error bars represent one standard deviation. Sediment Chl a is reported as an average of three cores. The column labeled n lists the number of observations for Org C, N, IP, OP, and CaCO3-C.
SiteDateSTChl anOrg CNIPOPCaCO3-C
Psu°Cmg m−2 %%mg g−1mg g−1%
WestJuly 2010193010 ± 10
May 2011173121 ± 8
June 2012213122 ± 12
December 201382522 ± 12124 ± 20.6 ± 0.10.2 ± 0.10.2 ± 0.19 ± 1
LongJuly 2010303226 ± 12
May 2011543160 ± 24
December 201362524 ± 396 ± 10.7 ± 0.20.3 ± 0.10.2 ± 0.16 ± 1
CuthbertJune 2012183035 ± 7
December 201332440 ± 15613 ± 41.3 ± 0.80.9 ± 0.40.5 ± 0.24 ± 2
Seven PalmJuly 2010203427 ± 5
May 2011223055 ± 13
June 2012123125 ± 796 ± 10.8 ± 0.80.2 ± 0.00.2 ± 0.17 ± 1
MonroeJuly 2010303423 ± 15
May 2011423019 ± 4
June 2012143121 ± 494 ± 10.3 ± 0.10.1 ± 0.00.2 ± 0.18 ± 2
TerrapinJuly 2010363331 ± 9
May 2011453132 ± 564 ± 10.3 ± 0.10.1 ± 0.00.1 ± 0.08 ± 1
GarfieldJuly 2010473245 ± 17
May 2011583316 ± 165 ± 10.6 ± 0.20.3 ± 0.10.2 ± 0.17 ± 1
Table 3. Pearson correlation coefficients (PCCs) for Chara coverage and sediment nutrient flux. Blank cells represent no significant relationship.
SiteDate NH4+SRP
WestJuly 2010Chara−0.71
May 2011
June 2012
December 2013
Seven PalmJuly 2010Chara−0.91−0.85
May 2011
December 2012
MonroeJuly 2010Chara−0.52−0.28
May 2011
December 2012
Publisher’s Note: MDPI stays neutral with regard to jurisdictional claims in published maps and institutional affiliations.

