Article

Service Life Prediction and Lateral Bearing Capacity Analysis of Piles Considering Coupled Corrosion-Temperature Deterioration Processes

1
Department of Civil Engineering, University of Shanghai for Science and Technology, Shanghai 200093, China
2
College of Ocean Science and Engineering, Shanghai Maritime University, Shanghai 201306, China
3
Department of Geotechnical Engineering, Tongji University, Shanghai 200092, China
4
Department of Engineering Geology, Technische Universität Berlin, 10587 Berlin, Germany
*
Author to whom correspondence should be addressed.
J. Mar. Sci. Eng. 2021, 9(6), 614; https://doi.org/10.3390/jmse9060614
Submission received: 26 April 2021 / Revised: 29 May 2021 / Accepted: 31 May 2021 / Published: 3 June 2021
(This article belongs to the Special Issue Instability and Failure of Subsea Structures)

Abstract

:
High temperatures can enhance the chloride diffusion coefficient and this poses a threat to reinforced concrete (RC) piles. This study intends to propose predictive models that can evaluate the service life and lateral bearing behaviour of reinforced concrete piles subjected to marine environments and varying temperatures. The models show that temperature can accelerate the diffusion rate of chloride and increase the concentration of free chloride in concrete. The distribution law of chloride concentration is obtained by considering the ageing effect as well. Deterministic and probabilistic models are proposed to assess the time to corrosion initiation and propagation. The stiffness degradation coefficient is introduced in the analysis of the lateral bearing capacity of RC piles. The results show that high temperature can decrease the service life of piles and the life spans obtained from deterministic and probabilistic methods are similar; however, the predictions of the latter are more conservative. Temperature can enhance the current density and boost corrosion products, which leads to pile cracking. The rust appearing on the steel surface would make the stiffness degradation coefficient drop sharply. The lateral bearing capacity analysis is conducted from the perspectives of shear force, displacement and bearing moment of the piles.

1. Introduction

Laterally loaded piles play a vital role in structures exposed in marine environments, such as bridges, docks, harbours and offshore platforms. Their serviceability and durability suffer from great deterioration that is induced by chloride ingress [1,2]. The application of deicing salts causes substantial long-term deterioration and a reduction in structural safety, especially for poor durability design specifications [3]. Chloride ions cannot directly participate in corrosion reactions but instead act as “catalytic porters” that destroy the passivation layer of reinforcements and increase the volume of corrosion products [4,5]. With the development of the corrosion process, rust can cause concrete tensile stress that may be sufficiently large to induce internal microcracking. The associated spalling of concrete cover is a common problem in concrete structures. An increase in temperature will speed up the rate of chemical reactions, especially for structural members exposed to high-temperature conditions. High temperatures can decrease the physical binding of chloride ions and free them due to higher thermal vibration [6]. Therefore, the changes in exposure temperature have a substantial effect on chloride diffusion into the pile for a certain relative humidity. Corrosion damage of reinforcements in RC structures caused by chloride-ingress attacks are the main problem for the durability of concrete elements [7].
Previous studies have been conducted to seek the mechanisms of chloride-induced corrosion in RC structures and the performance of pile foundations influenced by the deterioration of structures. Isteita and Xi [8] conducted a systematic experimental study using a new testing method and concrete specimens were subjected to different temperature gradients and chloride concentrations on the boundary. The test data showed that the temperature variation can significantly increase the chloride penetration process when the temperature and chloride concentration gradients are in the same direction. Hussain et al. [9] indicated that an increase in temperature from 20 °C to 70 °C caused a 5-fold reduction in the chloride threshold and reduced the pore solution pH. High temperatures are expected to reduce corrosion resistance by increasing the rates of chloride ingress and corrosion reactions. Liu and Weyers [10] cast a total of 44 simulated bridge deck slabs and corrosion parameters were measured over a 5-year period. They developed a nonlinear regression model which demonstrated that corrosion of steel is a function of the concrete chloride content, temperature, ohmic resistance and active corrosion time. Daniel et al. [11] performed a condition assessment of the wharf built for shipbuilding circa 1960 at the Fore River Shipyard. They found that the vertical piles supporting the wharf were severely deteriorated and that the wharf could even collapse in a severe storm, such as a hurricane. Cui et al. [12] argued that the deterioration of soil–cement and pile defects aggravated the deterioration effects on the bearing capacity of mixed piles and the settlement of composite foundations with an increase in age. Numerous studies have been conducted to investigate concrete corrosion from the perspectives of chloride and temperature. However, few studies have sought the relation between the lateral bearing capacity of piles and the coupled effect of corrosion-temperature.
In this paper, predictive models are given to estimate the service life of piles in marine environments by taking into consideration chloride ingress and temperature variations. Long-term predictions of service life are inherently uncertain since it is very difficult to ensure that no deterioration processes occurred in the whole phase. Thus, the assessment models include deterministic and probabilistic assessments for comparison. The distributions of the chloride concentration and service life of piles are obtained with predictive models. Moreover, the diffusion rate, current density and corrosive depth of the reinforcements can be calculated via models. The stiffness degradation coefficient is introduced here to act as a liaison between chloride corrosion and bearing capacity of piles. High temperature can increase the current density which leads to a dramatic decrease in the degradation coefficient. The analysis of the lateral bearing capacity is developed from the shear force, displacement and bending moment of piles.

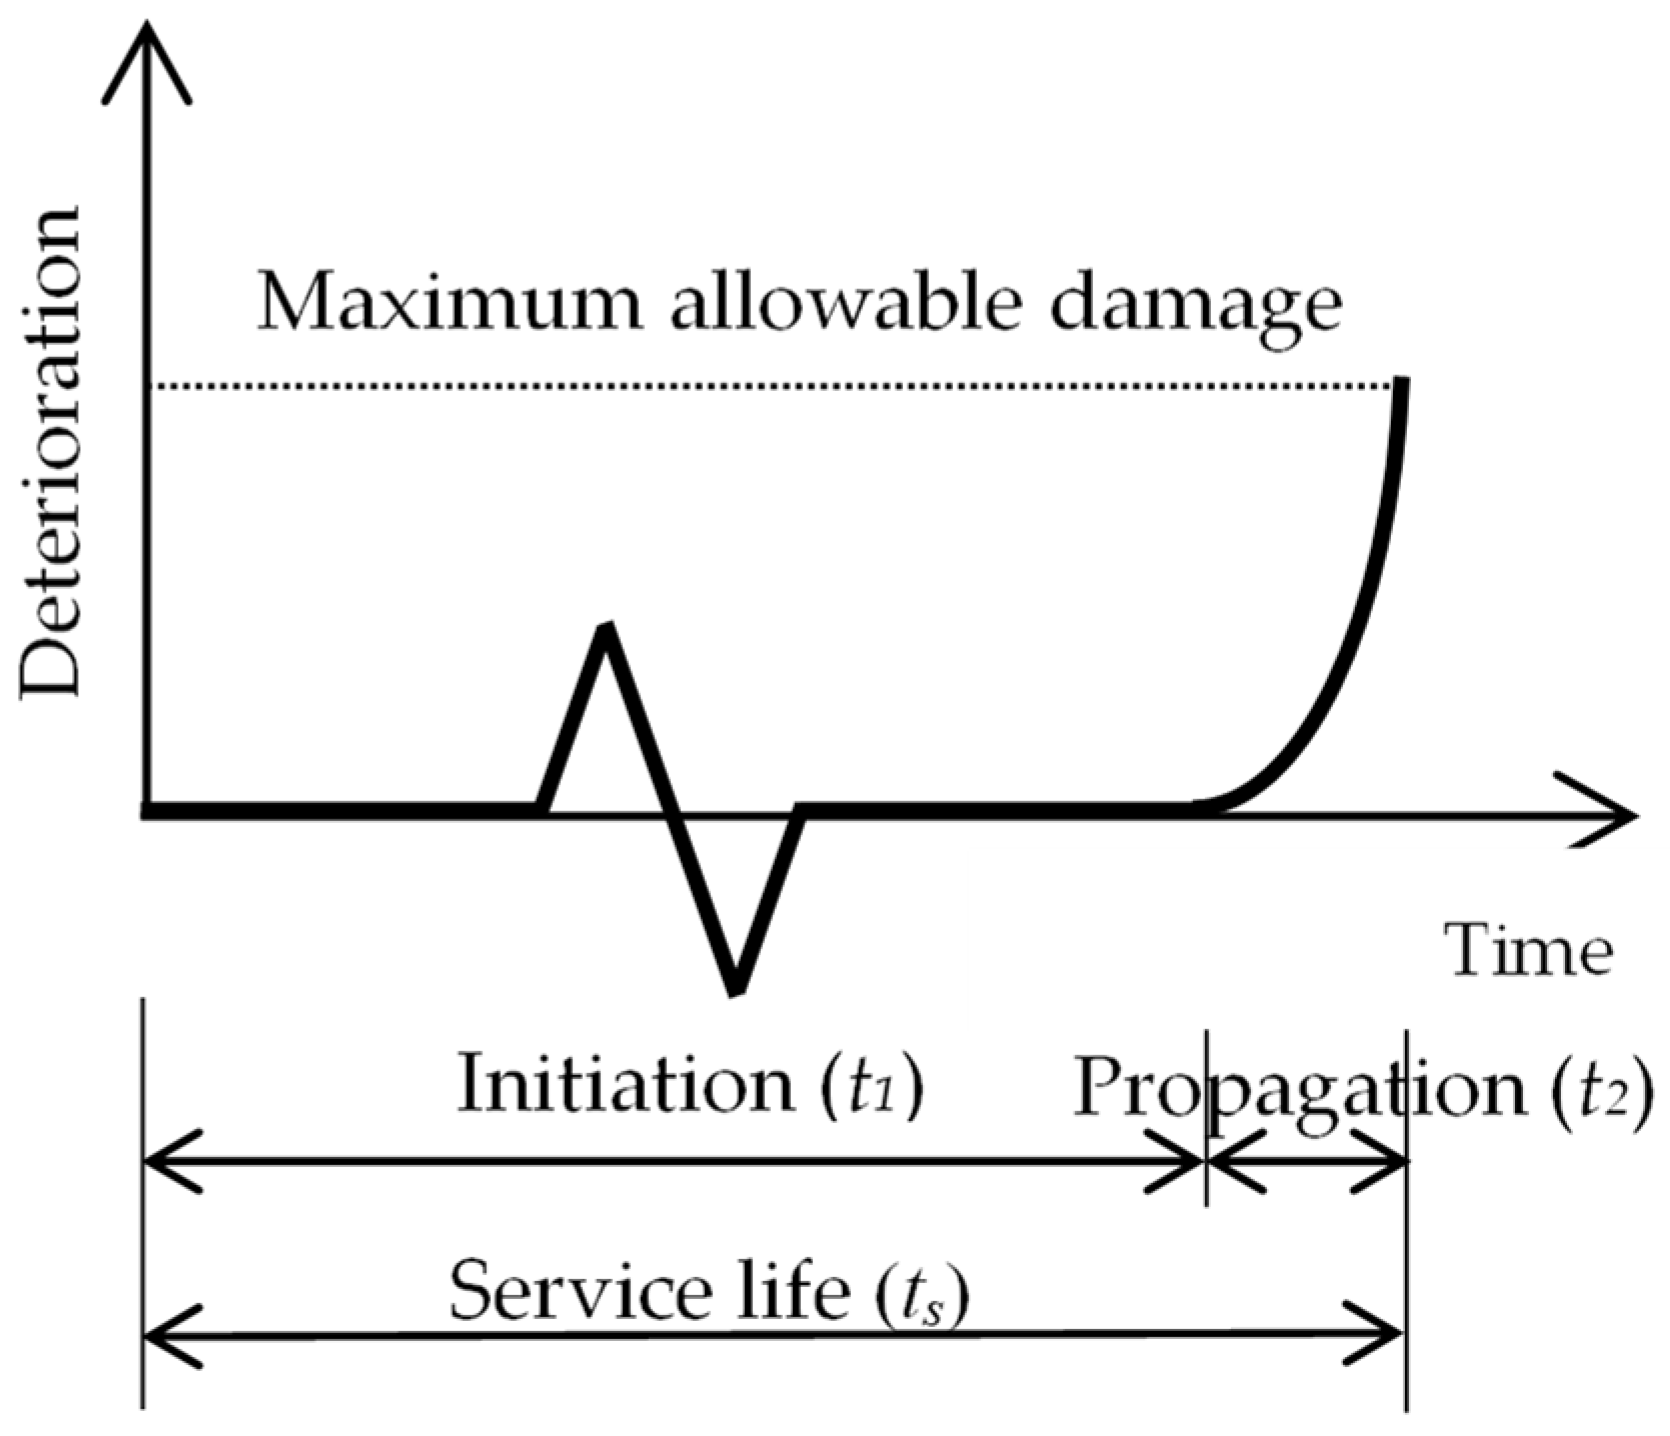
2. Basic Model for Service Life Prediction

The corrosion time can be divided into two phases: corrosion initiation and corrosion propagation [13,14,15,16]. As shown schematically in Figure 1, the service life (ts) can be defined as the sum of the time to initiation (t1) and the time to propagation (t2). In the first phase, chloride ions from the external environment migrate into the concrete cementitious matrix until the chloride content (C) reaches a threshold value (Cth). The passive film at the steel surface is then damaged and rust starts to form. The volume of the corrosion products can be approximately 2–8 times that of the original volume of the steel, which can generate sufficiently large tensile stress, leading to concrete cracking and the failure of RC piles.
Based on previous studies, Fick’s second law is a classical and widely used approach for evaluating the chloride ion concentration in structures [2,3,15,17,18,19,20,21,22], as given in Equation (1). Considering the initial and boundary conditions (Equation (2)) introduced by Collepardi [23,24], Equation (1) can be transformed into Equation (3), which provides an analytical solution to describe the diffusion process. The equation considers the mechanical and physical aspects [25]:
C t = D ( 2 C x 2 + 2 C y 2 ) ;
C ( x , 0 ) = C 0 ;   C ( 0 , t ) = C s ; C ( , t ) = C 0 ;
C ( x , t ) = C 0 + ( C s C 0 ) [ 1 e r f ( x 2 D t ) ( y 2 D t ) ] ;
e r f ( x ) = 2 π 0 x e t 2 d t ,
where C is the chloride concentration (kg/m3), t is the exposure period in the chloride environment (s), x is the distance from the surface (mm), D is the chloride diffusion coefficient (m2/s), C0 is the initial chloride concentration existing in concrete (kg/m3), Cs is the chloride concentration on the surface of the structure (kg/m3) and erf(*) is the Gaussian error function that is presented by Equation (4) which describes the evolution of the chloride diffusion front in the direction x at a time t [18,25].

3. Service Life Prediction Models

3.1. Effects of Temperature

Under different ambient temperatures, the kinematic performance of corrosive ions is variable. The relation between temperature and chloride penetration rate can be evaluated using a formula based on the Arrhenius’ law, as shown in Equation (5), which is widely accepted by most references [6,26,27,28]:
f T ( T ) = e x p [ U R ( 1 T 0 1 T ) ] ,
where fT(T) is the temperature factor, U is the activation energy of the chloride diffusion process (kJ/mol), R is the ideal gas constant (8.31 × 10⁻³ kJ/mol/K), T0 is the reference temperature (K) and T is the ambient temperature (K).
In addition to its effect on the activation energy, temperature simultaneously influences the concentration of free chloride ions which can be converted from bound ions. Free chloride ions are mainly considered to be involved in corrosion instead of bound chloride [10,17,25,28]. The relationship among the total (Ct), bound (Cb) and free (Cf) chloride concentrations in the concrete medium can be expressed as follows [29,30]:
C t = C b + w e C f ;
C b C f = α ,
where we is the evaporable water content (m3 pore solution/m3 concrete) and α is defined as the slope of the corresponding chloride binding isotherm which represents equilibrium relations between free chlorides and bound chlorides specific to a given concrete medium. In this study, the relationship between bound and free chlorides is assumed to be linear and the chloride binding capacity is treated as constant at a given temperature. The two parameters have coupled effects on the chloride diffusion coefficient (D) and can be shown as follows [6,28]:
f w , α ( w , α ) = 1 1 + 1 w e C b C f = 1 1 + α w e ,
where fw,α(w,α) is the coupled effect factor and the evaporable water content (we) can be estimated as follows: [31,32]
w e = C k V m h ( 1 k h ) [ 1 + ( C 1 ) k h ] ;
C = e x p ( 855 T ) ;
k = ( 1 1 / n w ) C 1 C 1 ;
n w = ( 2.5 + 15 t e ) ( 0.33 + 2.2 w / c ) N c t ;
V m = ( 0.068 0.22 t e ) ( 0 . 85 + 0 . 45 w / c ) V c t ,
where C, k and Vm are parameters depending on the temperature, water/cement ratio (w/c) and the degree of hydration of concrete; h is the humidity; te is the hydration period (d); and Nct and Vct depend on the type of cement, e.g., for Portland cement II, Nct = Vct = 1.

3.2. Deterministic Model for Corrosion Initiation

The material properties of concrete in an aggressive environment are not constant. The chloride diffusion coefficient decreases with time according to the following power law [33,34]:
f t ( t ) = ( t 0 t ) m ,
where ft(t) is the ageing factor and m is the decay rate.
In summary, the computational model of the chloride diffusion coefficient can be written as shown in Equation (15) by considering temperature and ageing effects:
D = D 0 f T f w , α f t ,
where D0 is diffusion coefficient at time t0.
Equation (15) can be used to effectively predict the chloride diffusion coefficient at different ambient temperatures and times. Following this, the deterministic model can be obtained by substituting Equation (15) into Equation (3) and the chloride concentration at any point and time in concrete can be accurately obtained.

3.3. Probabilistic Model for Corrosion Initiation

Large research efforts have been made to predict the corrosion life with deterministic methods, however, the uncertainty of input variables, including the uncertainty of material properties and environmental conditions, can affect the corrosion process of RC piles [3,16,27,35,36,37]. Various parameters, such as the surface chloride content (Cs) and diffusion coefficient (D) and threshold value (Cth), were considered random variables in this paper. One of the aims of this paper is to propose a probabilistic model based on previous works. The analysis includes the randomness of parameters and the application of the Monte Carlo simulation. A total of 106 sets of data are calculated. It is assumed that F(t) is the difference between Cth and Cfs (chloride content at the steel surface at time t).
F ( t ) = C t h C f s .
The failure probability of corrosion initiation Pf(t) and the corrosion initiation life Ti can be estimated as follows.
P f ( t ) = P [ F ( t ) 0 ] = P [ C t h C f s ] ;
T i = [ P f ( t ) P f , m a x ] .
CEB [38] proposed an intended Pf,durability of 10% for RC structures exposed to chloride attacks. In this study, 10% Pf,durability is applied as the limit state for the prediction.

3.4. Prediction Model for Corrosion Propagation

The time to corrosion propagation is viewed as the period from the chloride concentration reaching a critical value to the emergence of microcracks around rebars. The corrosion risk of rebar in RC structures can be determined in terms of current density if the passivation film is damaged. According to Faraday’s law [39], the corrosion velocity can be expressed as the following:
x i = M i c o r r t n ρ s F = 2.949 × 10 10 0 t i c o r r ( t ) d t ,
where xi is the reinforcement corrosive depth (μm), M is the molar mass of Fe, icorr is the corrosive current density (μA/cm2), n is the charge of the reactive ion (n = 2.5 in this paper), ρs is the density of Fe (7.9 g/cm3), F is the Faraday constant (96,500 C/mol) and t (years) is the time after corrosion initiation. Liu [10] proposed Equation (20) to demonstrate how icorr is influenced by temperature:
i c o r r = 0.926 e x p [ 7 . 98 + 0 . 7771 l n ( 1.69 C ) 3006 T 1.664 R + 2.24 t 0.215 ] ,
where C is the chloride concentration on the reinforcement surface (kg/m3), T is the ambient temperature (K) and R is the ohmic resistance (Ω) of the concrete cover. For the ohmic resistance, R can be calculated using the following empirical relationship suggested by Liu [40]:
R = e x p [ 8.03 0.54 l n ( 1 + 1.69 C ) ] .
According to Equation (20), when the time t is near zero, the current density is infinite and cannot be integrated. Thus, t is calibrated based on the literature [3] and is shown as the following:
i c o r r , 0 = 37.8 ( 1 w / c ) 1.64 c ,
where icorr,0 is the corrosion rate at the start of corrosion propagation, w/c is the water-to-cement ratio and c is the concrete cover (cm). Therefore, Equation (20) can be expressed as follows:
i c o r r = 0.926 e x p [ 7 . 98 + 0 . 7771 l n ( 1.69 C ) 3006 T 1.664 R + 2.24 ( t + 0 . 1 ) 0.215 ] .
As time elapses, corrosion products continue to accumulate, which leads to an increase in expansion stress. Once the corrosion depth (xi) of the reinforcement reaches the critical depth (xcr), the cracking of the pile concrete occurs. The critical corrosion depth xcr can be calculated as follows [35]:
x c r = r 0 α v 1 [ 2 c ( γ + 1 + v c ) d 0 f c t E e f + δ 0 r 0 ] ,
where δ0 is the tiny spacing between the concrete and steel bar (μm), r0 = δ0 + d0/2, d0 is the initial diameter of the reinforcement (mm), αv is the relative volume expansion ratio of rust, c is the thickness of the cover (mm), γ = 2r02/[c(2r0 + c)], vc is Poisson’s ratio of the concrete, fct is the tensile strength of the concrete (MPa); and Eef = Ec/(1 + φc), in which Ec is the modulus of elasticity of the concrete (MPa) and φc is the creep coefficient of the concrete. The time to corrosion propagation can be obtained by equating the reinforcement corrosive depth (xi) to the critical depth (xcr).

4. Illustrative Example

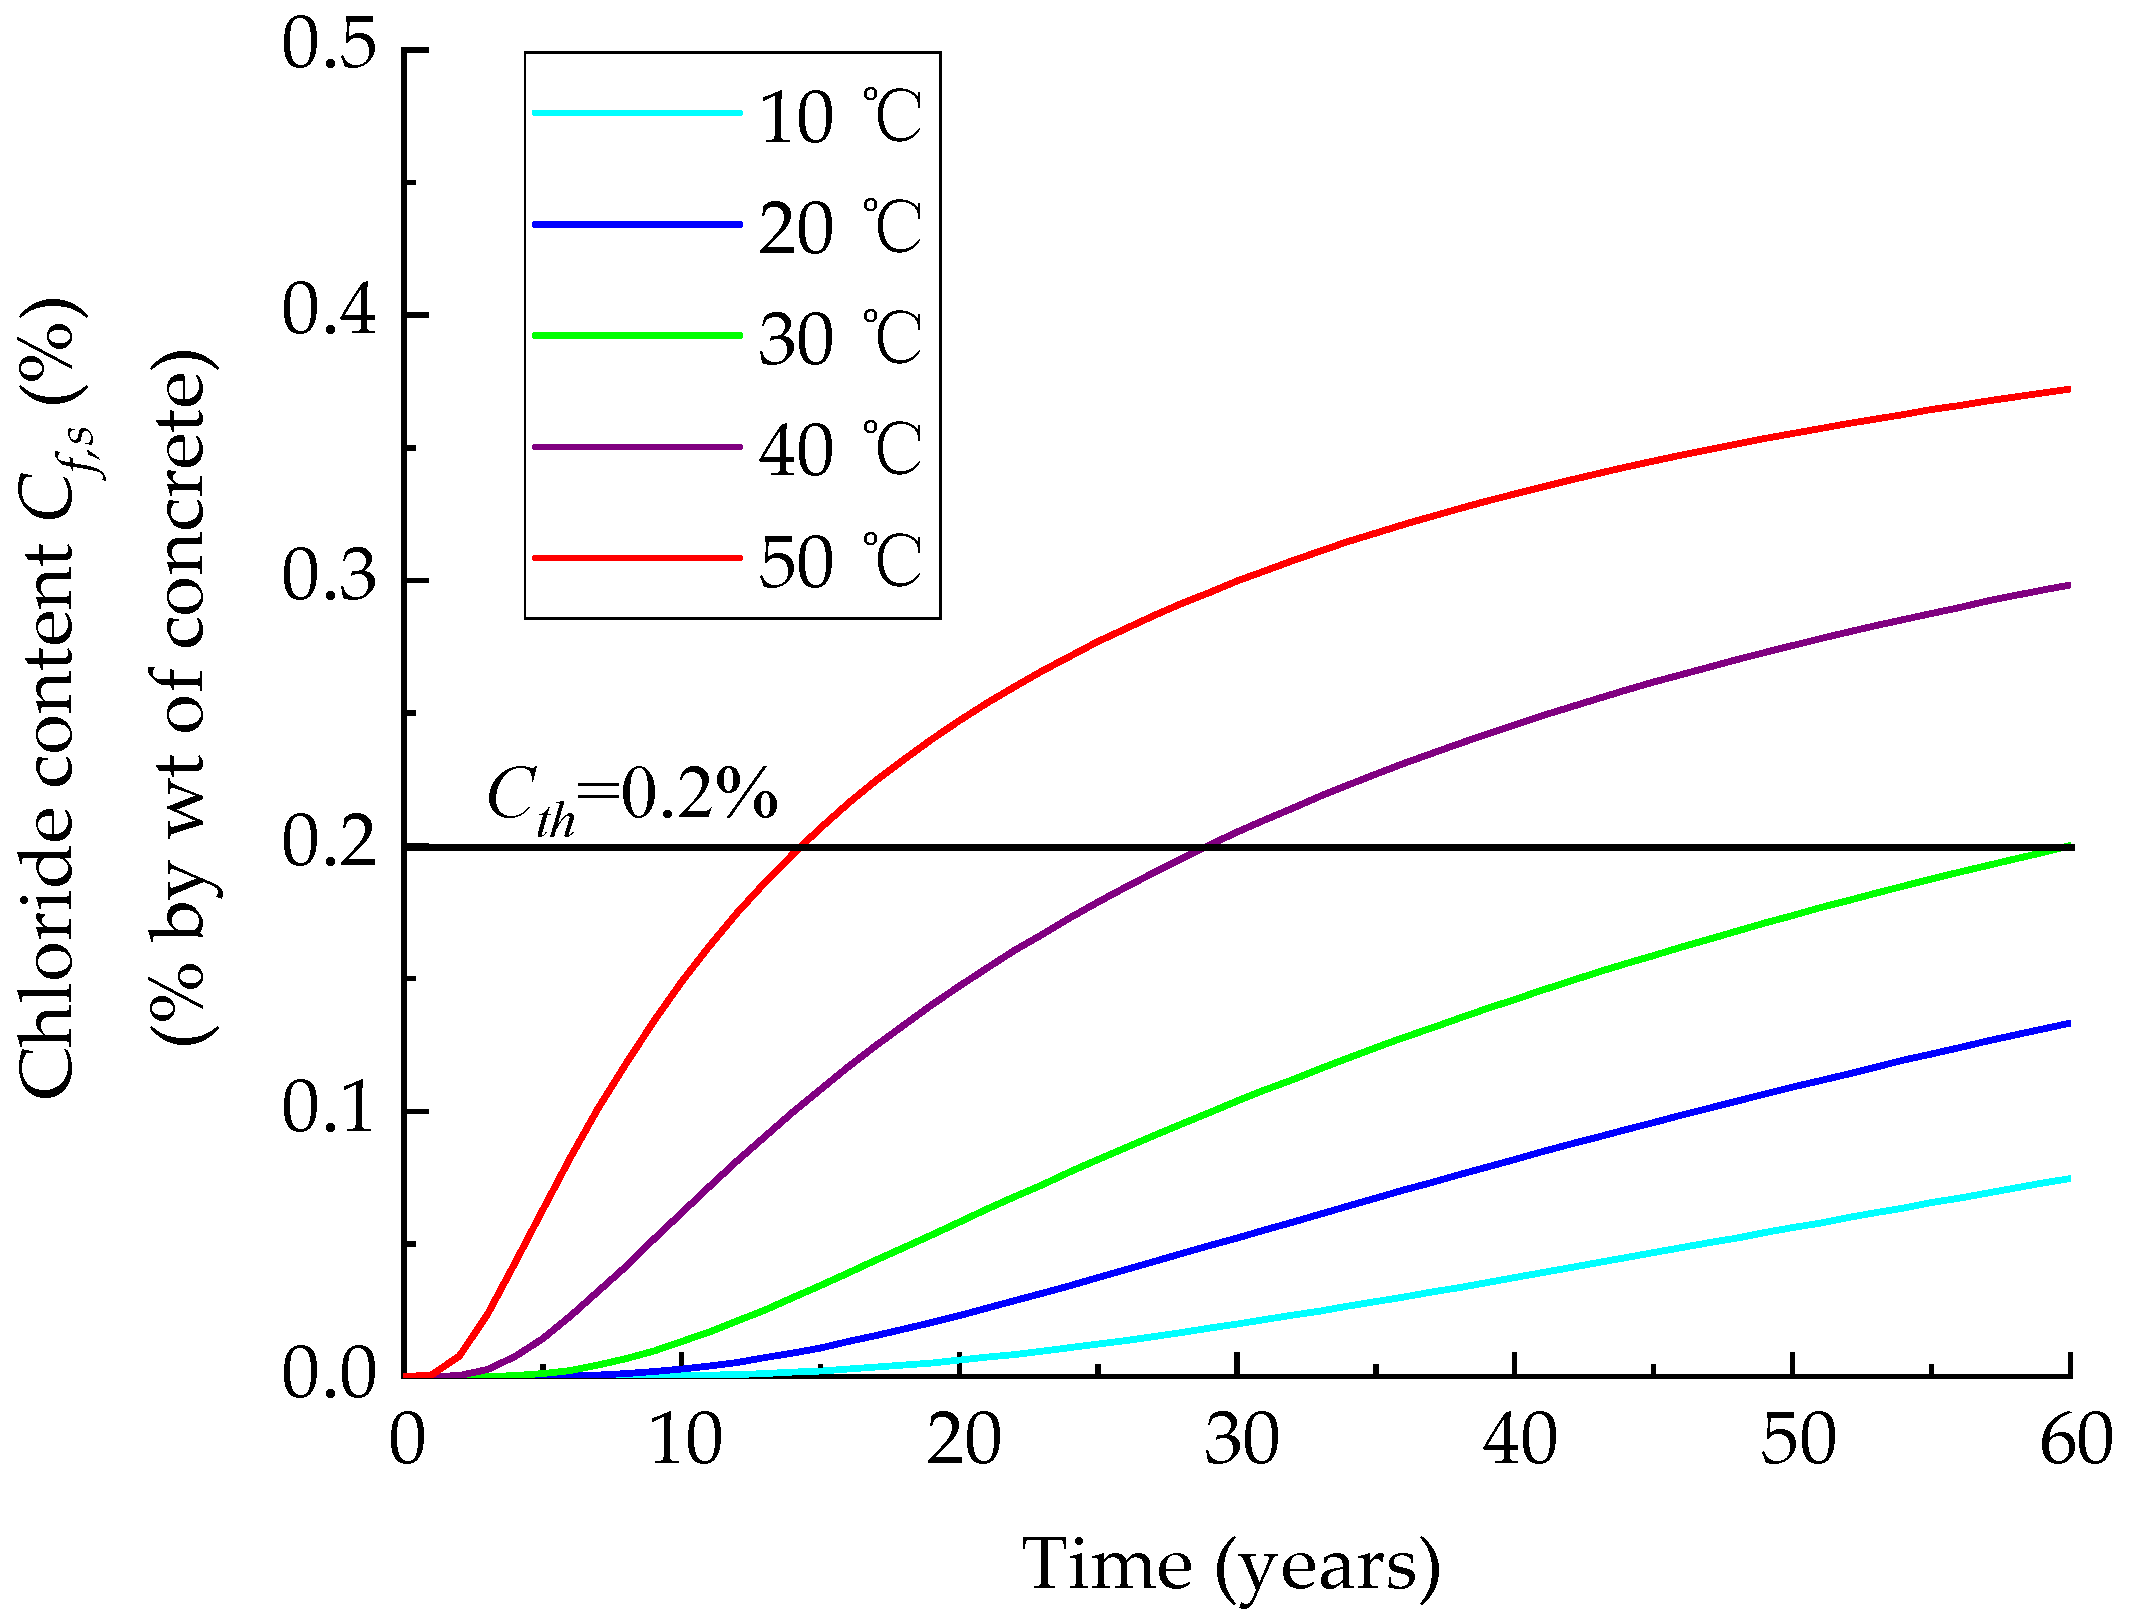
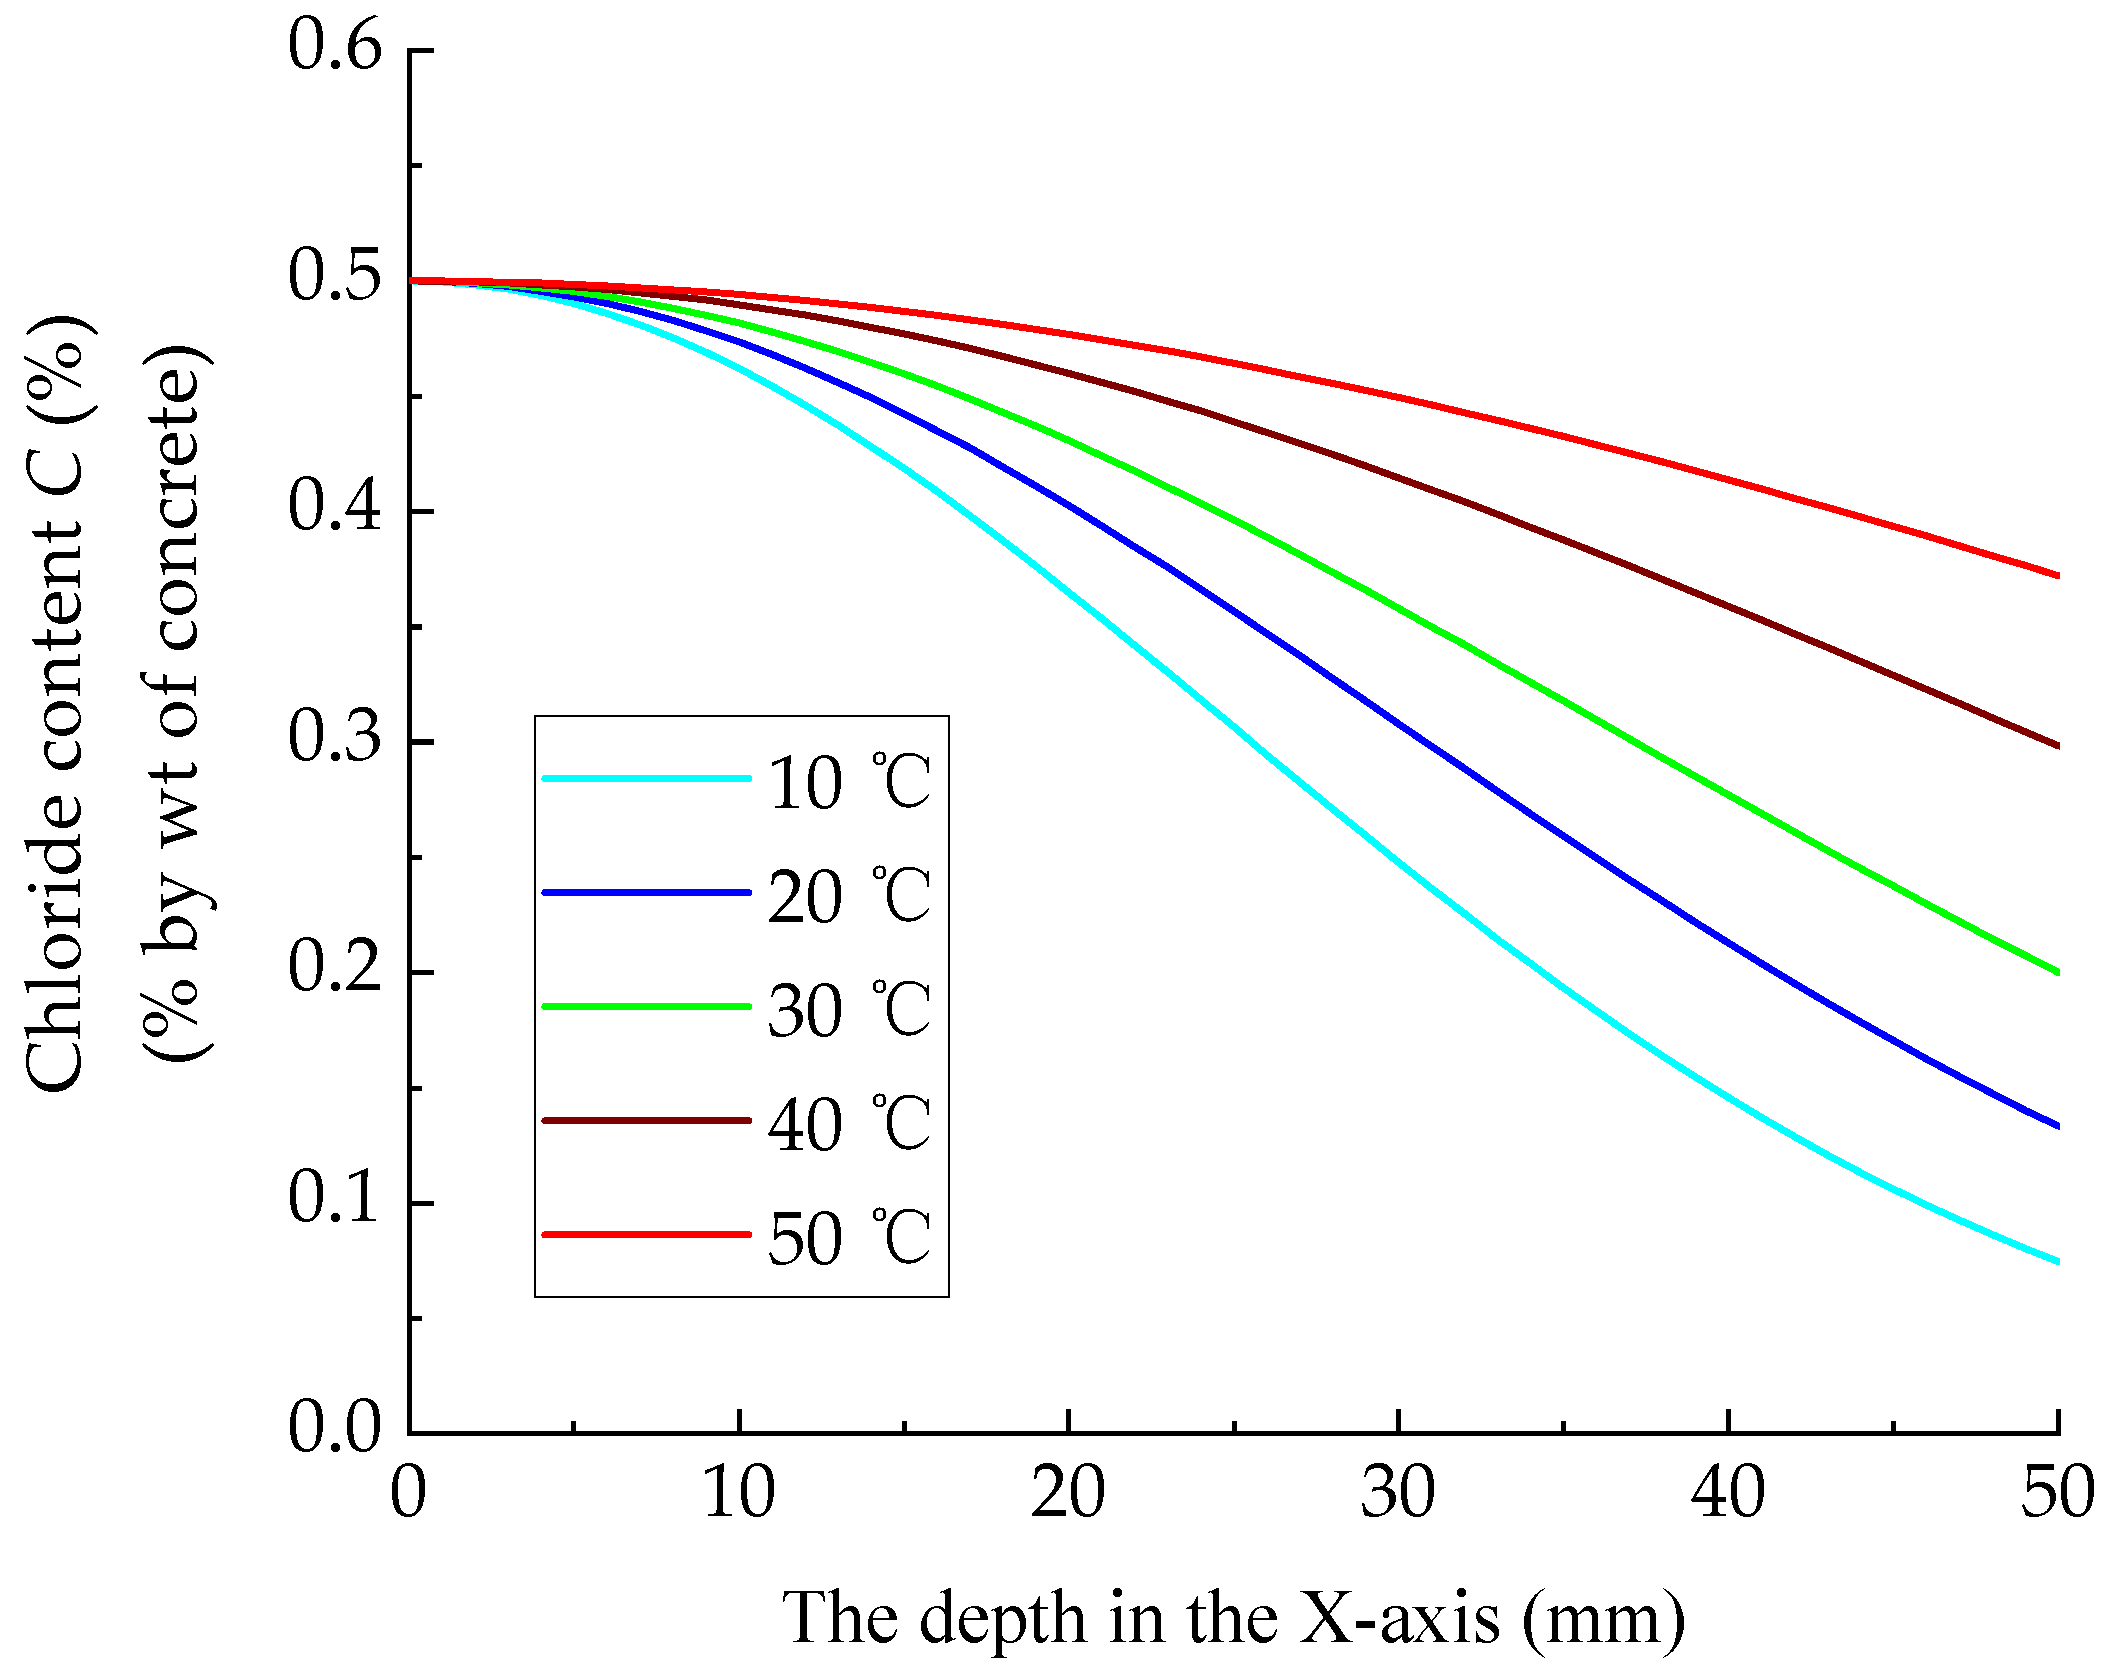
4.1. Time to Corrosion Initiation Using the Deterministic Method

Some assumptions should be cleared in using the predictive model to evaluate the service life of piles. The RC pile has been immersed in marine environments at a constant temperature for 60 years and five levels of temperature are considered (10 °C, 20 °C, 30 °C, 40 °C and 50 °C). The surface chloride content (Cs) is 0.5% (% by weight of concrete). The section size of the square pile is 500 × 500 mm2, the diameter of the steel bars (d) is 14 mm and the thickness of the concrete cover (c) is 50 mm (see Figure 2). The water-to-cement ratio (w/c) is 0.4. On the basis of temperature variations the values of α are different, as shown in Table 1. Assuming that all chloride ions come from the outside, the initial chloride concentration (C0) in concrete is zero. When the chloride concentration on the surface of the steel bar reaches the chloride ion threshold (Cth), the time of the first phase (t1) can be computed. Table 1 shows variables for calculations of chloride content (C) and initiation time (t1). The steel bar (marked in blue) in the upper left corner of Figure 2 is about to be taken for prediction.
Figure 3 illustrates the influence of temperature on the chloride concentration at the steel surface, i.e., the higher the temperature is, the higher the concentration. The corrosion rate is slower at the beginning and then it becomes faster and eventually tends to become stable, especially for higher temperature conditions. When the chloride content increases to Cth (0.2%), it can be argued that the lifetime (t1) of the pile alongside the passive layer of steel is destroyed. Under the conditions of 30 °C, 40 °C and 50 °C, the service life of the pile is 60 years, 28.8 years and 14.5 years, respectively. However, in colder environments, the steel passivation film has not been damaged for 60 years. Without any protection measures applied to reinforcements, higher temperatures lead to shorter life spans. Therefore, for RC piles served at high temperatures, such as those of tropical marine regions; anti-corrosion measures, such as cathode protection; and corrosion inhibitors should be applied to prolong lifetimes.
Figure 4 presents the chloride concentration distribution along the 45 °C line. The content decreases increasing depth, especially at low temperatures. After an exposure time of 60 years, the distribution characteristics verify that high temperature can strengthen chloride attacks. When x = 50 mm, the chloride content at 50 °C is five times of that at 10 °C.

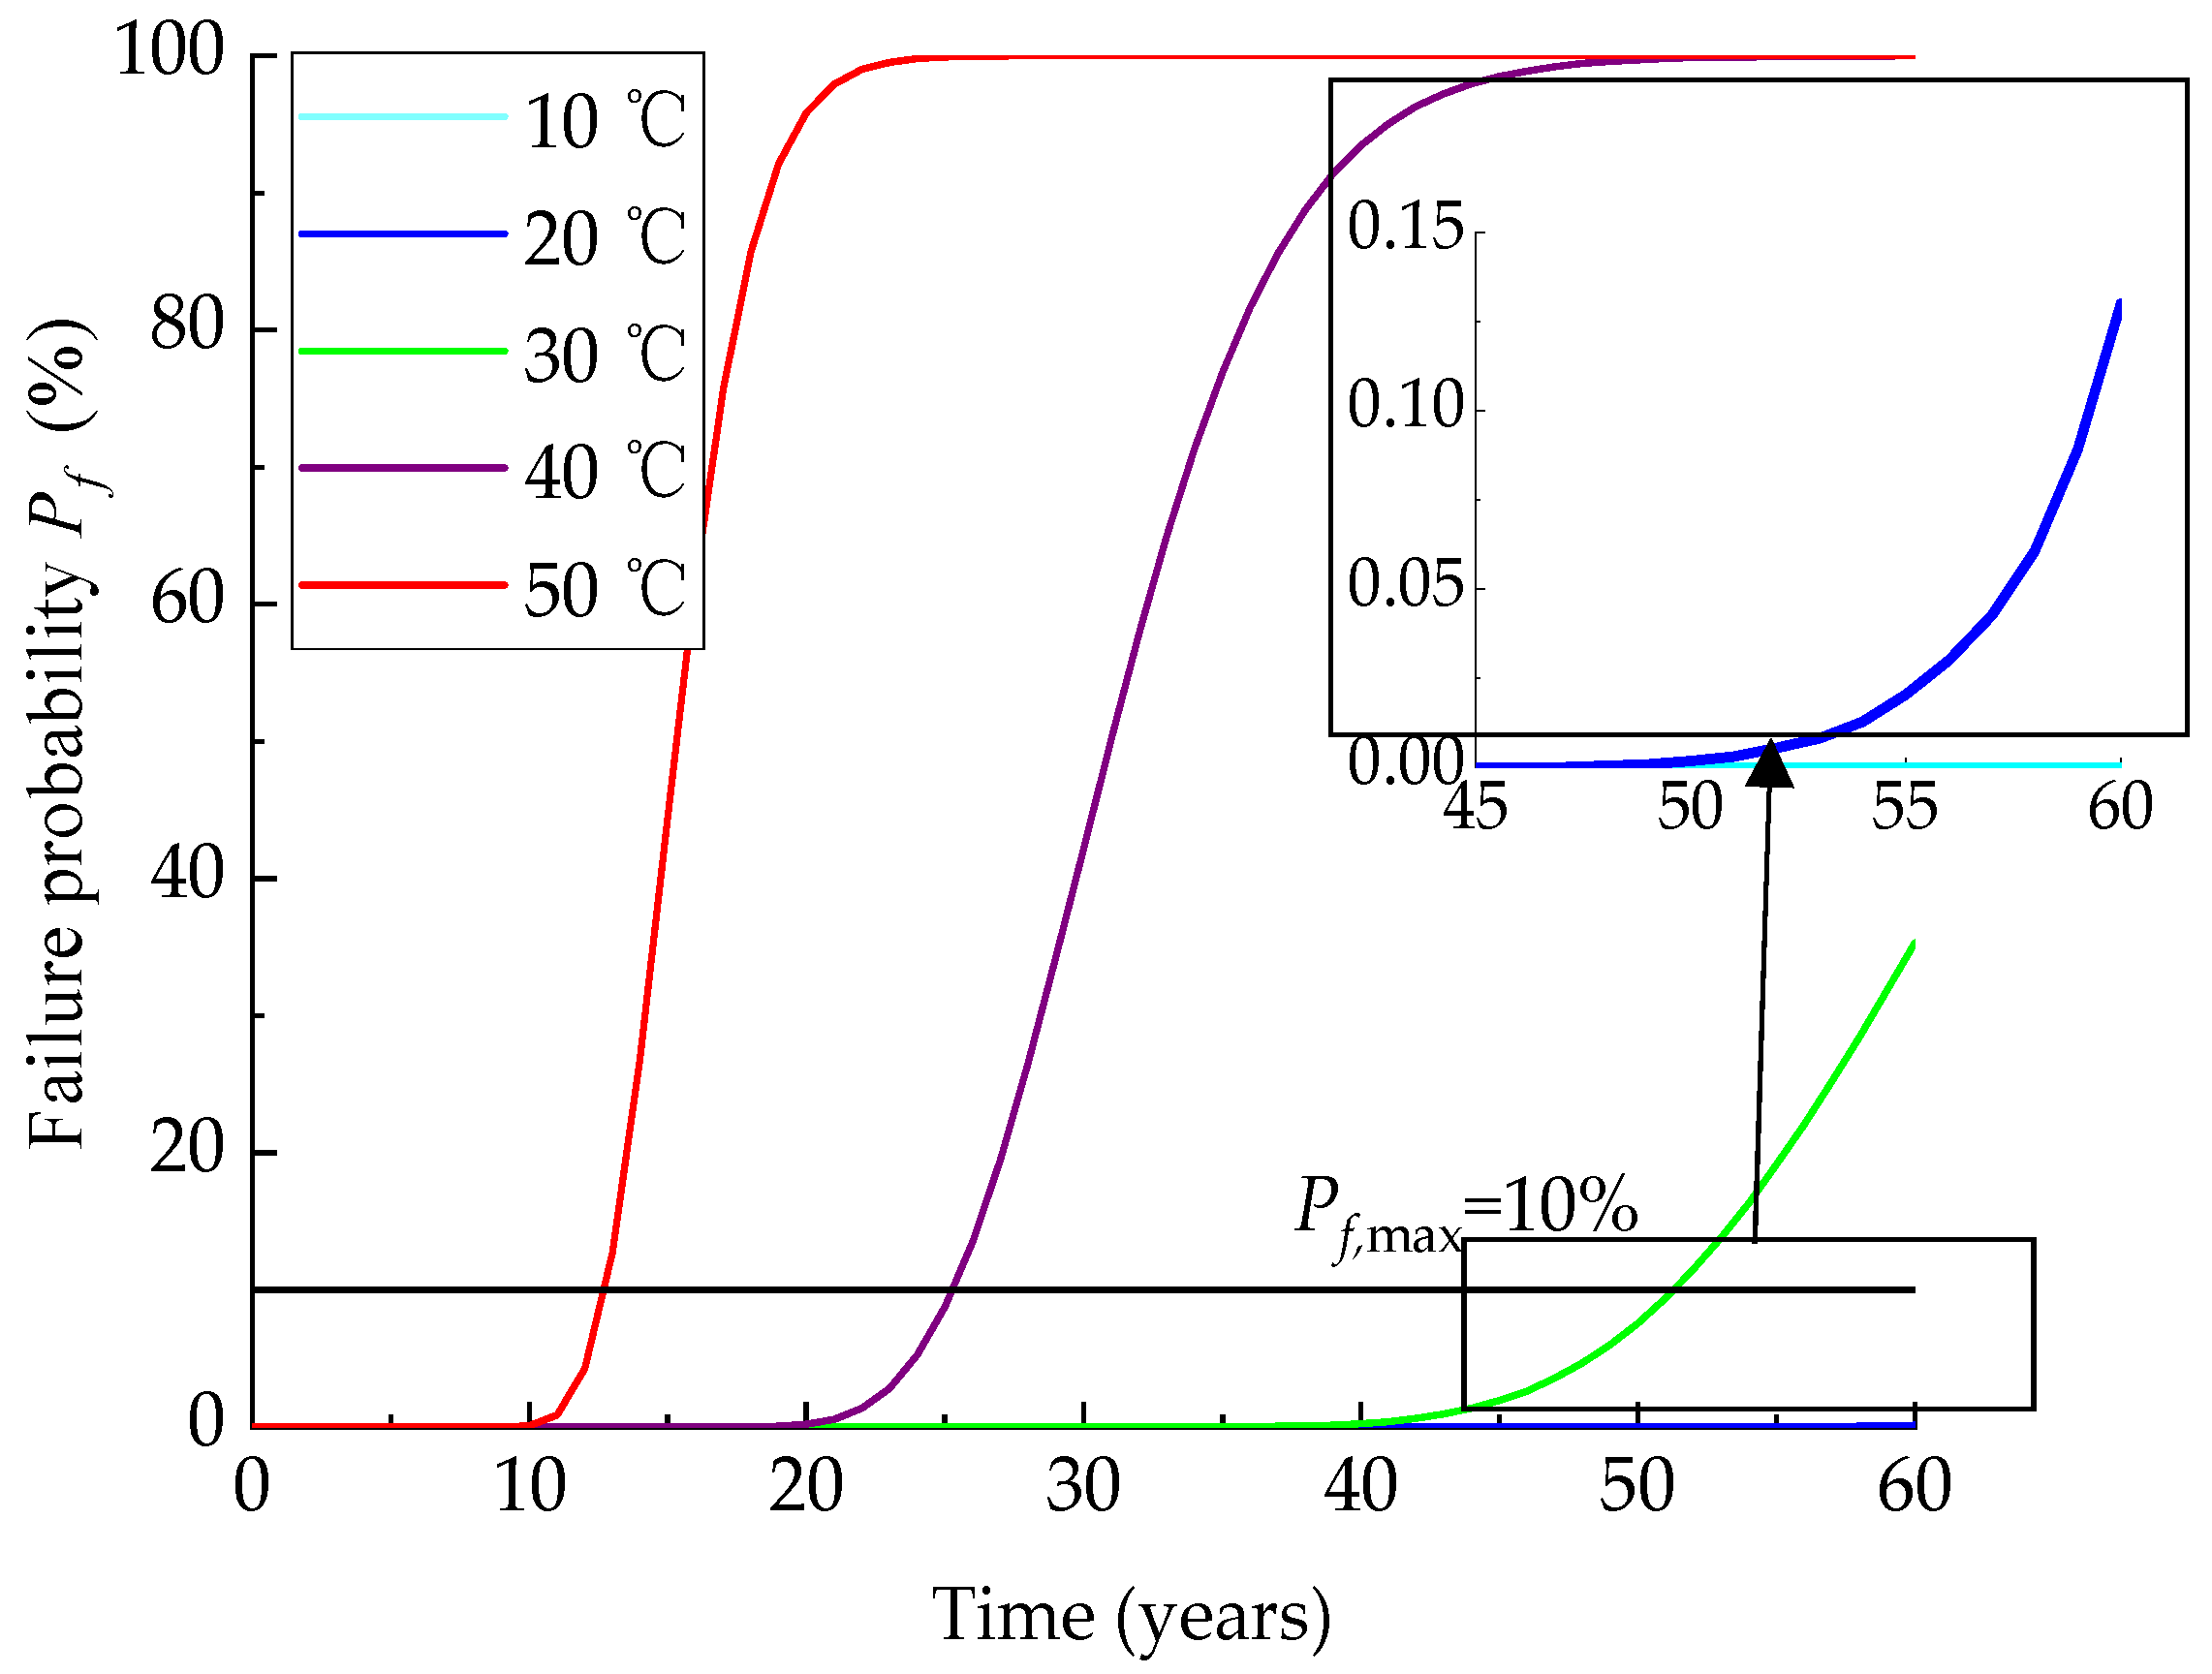
4.2. Time to Corrosion Initiation Using the Probabilistic Method

The distribution, mean and coefficient of variation (COV) of random variables are presented in Table 2. Figure 5 indicates the variation in the failure probability of corrosion initiation with exposure time, confirming that high temperatures can pose a threat to the service life of piles. According to the criterion [38] (Pf,max = 10%), when the temperature level is 30 °C, 40 °C and 50 °C, the corrosion initiation times (t1) of the pile are 51.3, 25.3 and 12.7 years, respectively. The figure shows that for piles constructed in high-temperature areas, the failure probability will soar sharply to a high level in the next few years. Compared with the deterministic model, the results derived from the probabilistic method are conservative. Under the boundary condition of 20 °C, the RC pile has not corroded for 60 years and Pf is less than 0.15%. In addition, the failure probability at 10 °C has always been in a very low state, which is close to zero.

4.3. Time to Corrosion Propagation

Variables involved in t2 computation are displayed in Table 3. Figure 6 illustrates the variation in the reinforcement corrosive depth (xi) during corrosion propagation. All curves were highly similar: the slopes of the curves decreased and gradually remained constant because the corrosive current density (icorr) tended to be stable with time. The corrosion propagation time (t2) of the pile is 0.18 years, 0.11 years, 0.07 years, 0.05 years and 0.03 years with temperature levels of 10 °C, 20 °C, 30 °C, 40 °C and 50 °C, respectively. The results hint that the corrosive depth would reach the critical value quickly even at lower temperatures. Therefore, compared with the initiation time, the propagation phase is much shorter and may be ignored in lifetime predictions [18].

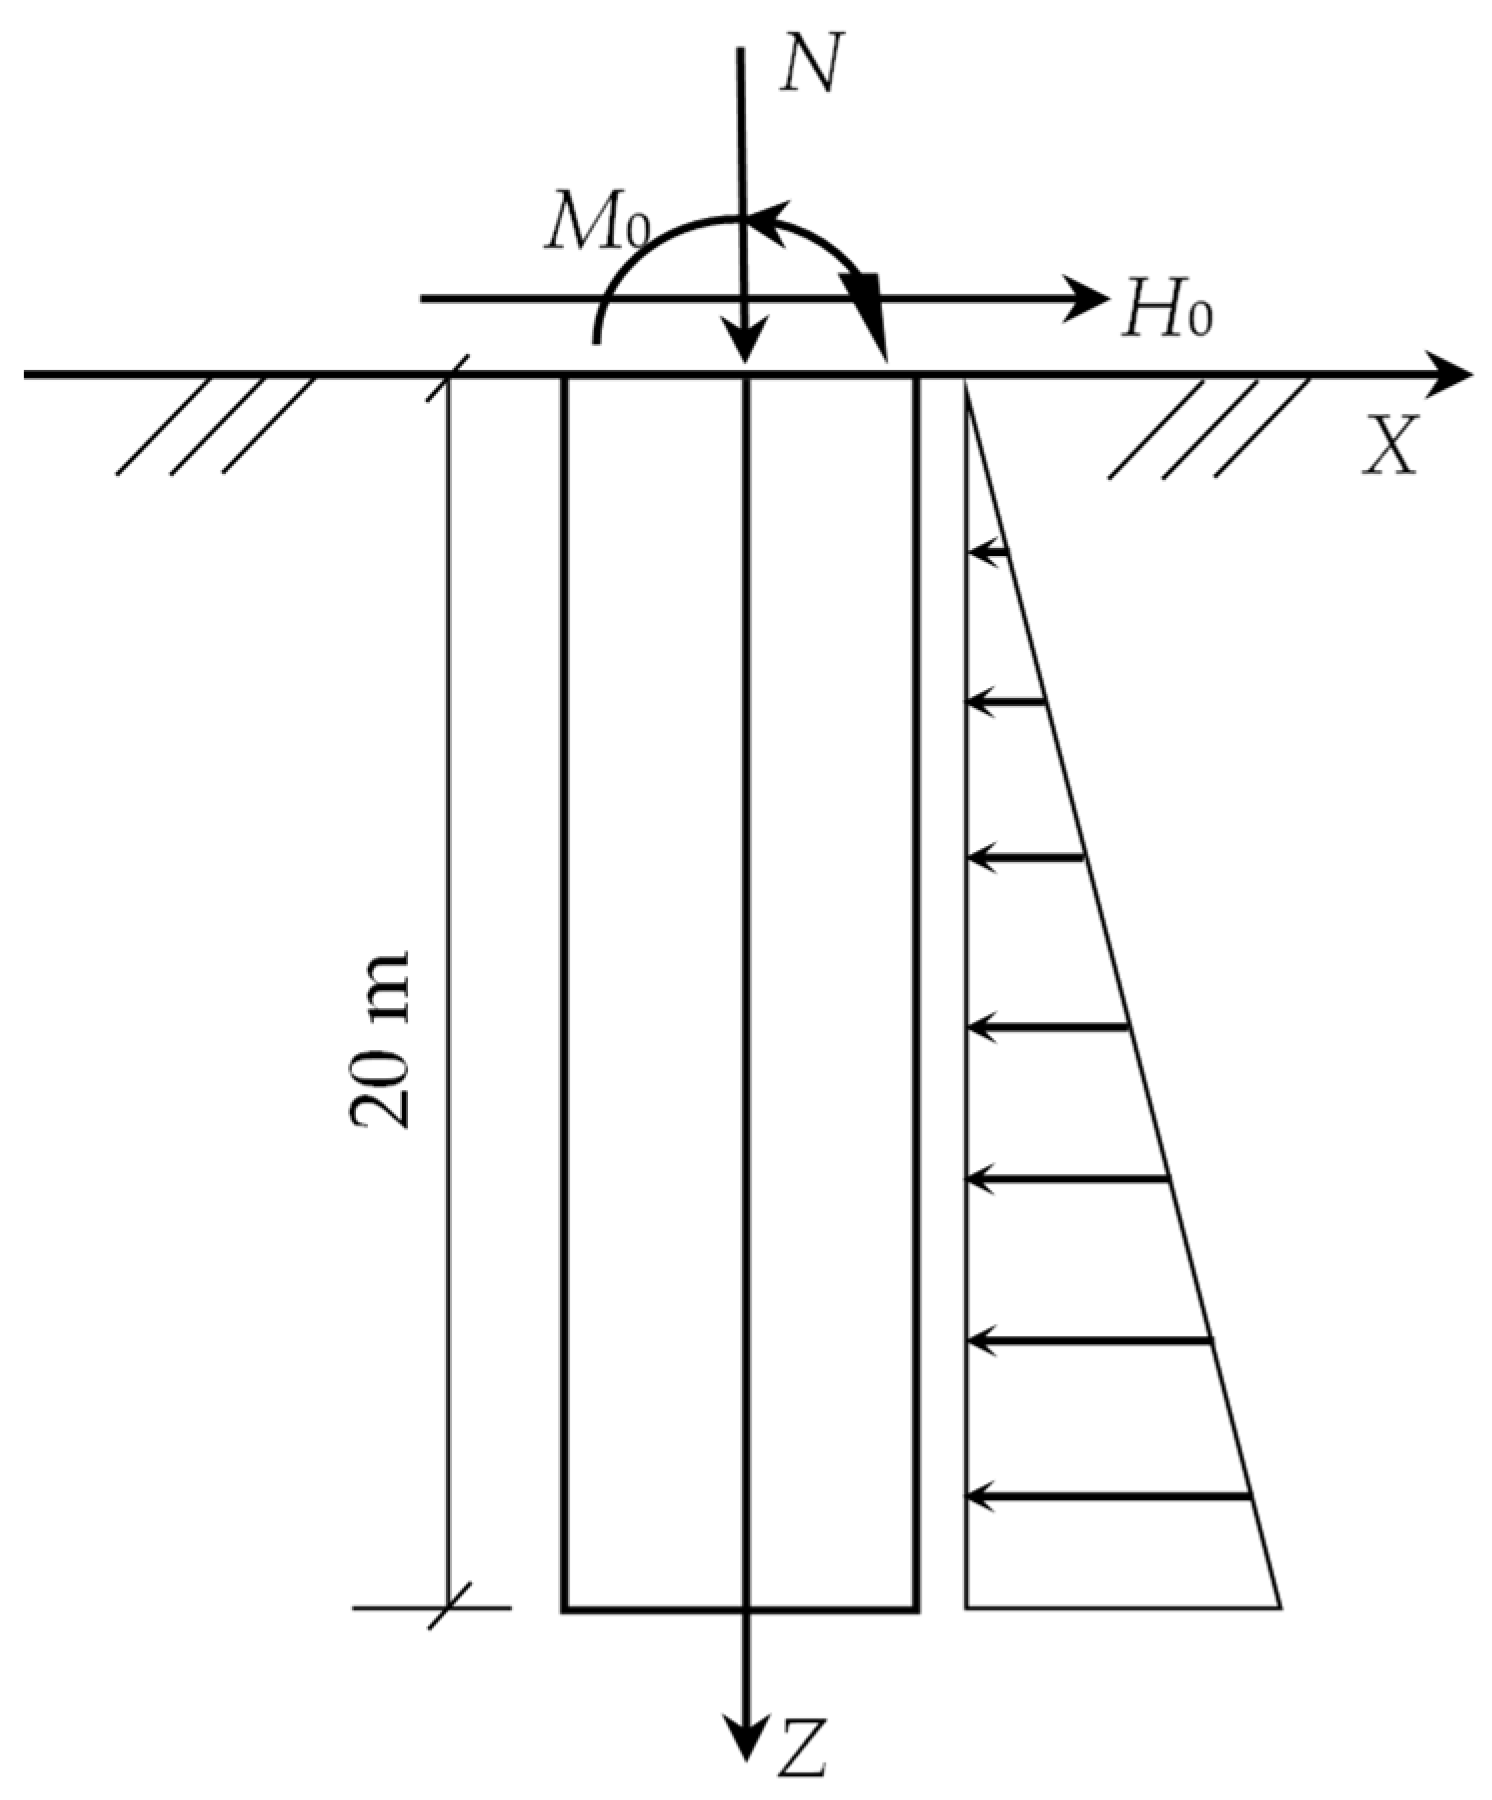
5. Lateral Bearing Capacity Analysis of Piles

5.1. Performance Fuctions

In addition to the abovementioned assumptions, other practical field data must be considered in analytical solutions. It is assumed that the pile is fully embedded in a normally consolidated marine clay and subjected to horizontal loading (H0), vertical loading (N0) and moment loading (M0) at the pile head (shown in Figure 7). The length of the pile under the soil is 20 m and the proportional factor (kh) of the coefficient of the subgrade reaction is 3.0 MN/m4 [42]. Using the subgrade reaction theory proposed by Poulos [42], the governing equation for the deflection of a laterally loaded pile is
E p I p d 4 x d z 4 + k h a x = 0 ,
where Ep is the modulus of elasticity of the pile (MPa), Ip is the moment of inertia of the pile section (m4) and a is the side length of the section (m). The solutions to Equation (25) are most conveniently obtained using a numerical finite-difference method.
Chloride ions can permeate into concrete, triggering steel corrosion and leading to the reduction in structural capacity and loss of durability. Thus, the degradation coefficient (η) should be introduced to modify the time-dependent pile stiffness, as shown in the following:
E p I p = η E c I p ,
where η is determined by each RC pile. DEC [42] suggests that the degradation coefficient be expressed as follow:
η = 1 A η i A i ,
where A is the sum of the sectional area of the tensile steel bar before corrosion (m2), Ai is the sectional area of the ith steel bar after corrosion (m2) and ηi is the stiffness degradation coefficient of the ith steel bar that can be computed by the following:
η i = { 1.0 0 x i < 0.1 ( 3.7 7 x i ) 0.1 x i < 0.25 0.65 0.25 x i .
The exposure time of 40 years is taken for analysis in this section. Based on the results calculated above, we know that the RC square pile constructed at 40 °C has experienced corrosion initiation for 28.8 years and the reinforcement corrosive depth (xi) has developed for 11.2 years. Thus, the η value of the pile is available and is shown in Table 4. Other data regarding piles served in different temperature conditions can also be obtained. Table 5 shows variables involved in the analysis of the behaviour of laterally loaded piles.

5.2. Bearing Capacity Analysis

In this section, the main focus is on working on variations in the performance of piles after the service time reaches 25 years. Figure 8 shows the variation in the degradation coefficient of the pile stiffness with exposure time at different temperatures. Since the degradation coefficients (η) of structures are identical at 10 °C, 20 °C and 30 °C, only the performance at 30 °C is exhibited for comparison. At 30 °C, η remains constant at all times because the time to corrosion initiation is more than 40 years and the steel does not rust. At 40 °C and 50 °C, two distinct descending segments emerge after corrosion initiation. The first dropping phase is sharper because ηi and Ai are degressive (based on Equation (27)). Then, the reduction speed of the degradation coefficient slows down only because of a decrease in Ai.
Figure 9 shows the shear force, displacement and bending moment distribution along the pile as the temperature increases from 30 °C to 50 °C. The shear force distributions of the piles at various temperatures are indicated in Figure 9a. Affected by the lateral resistance from the soil, the shear forces of the piles decrease from 200 kN to 0 kN at approximately −2 m and the maximum negative shear forces are −82.4, −88.9 and −93.7 kN.
The horizontal displacement distributions of the piles are shown in Figure 9b. The maximum displacements appear at the top of the piles and are 50 mm, 62 mm and 67 mm. The maximum rate of increase is 34%. The “zero point” of displacement shifts from −5 m to −4 m as the temperature increases and this implies a reduction in the stability of the pile.
Figure 9c shows the bending moment distribution of the piles. The bending moment reaches its maximum when the depth is approximately 2 m. At this point, the moments of 40 °C and 50 °C decrease by 5% and 7%, respectively, compared with those of the pile without rust damage. As the embedded depth increases, the moments begin to decrease and a negative moment region appears at 10 m of depth. Finally, the bending moments disappear. The drawing shows that the higher the temperature is, the smaller the bending moment value.

6. Conclusions

This paper focuses on predicting the service life of piles affected by chloride ingress and varying temperatures. The lifespan is usually defined as the sum of the times to corrosion initiation and propagation. A deterministic method is proposed on the basis of Fick’s second law combined with temperature and ageing factors. Due to the randomness of the material and environment in the actual situation, a probabilistic model is applied to study the reliability of RC piles. Chloride concentration distribution curves and the service life of piles can be obtained by predictive models. The stiffness degradation coefficient is introduced to assess variations in the lateral bearing capacity characteristics of piles. The coefficient is severely affected by temperature, which can enhance the current density and boost corrosion products, leading to the cracking of the pile. Diagrams of the shear force, bending displacement and moment of piles are drawn in this paper.
The main conclusions of the present study are as follows:
  • Temperature has substantial influences on the activation energy, evaporable water content and ratio of binding capacity. These parameters can change the chloride diffusion rate which imposes a threat on the service life of RC piles. The steel surface chloride content at 50 °C is 5-fold of that at 10 °C;
  • The probabilistic method is conservative compared to the deterministic method. Compared with the time to corrosion initiation, the time to propagation is much shorter;
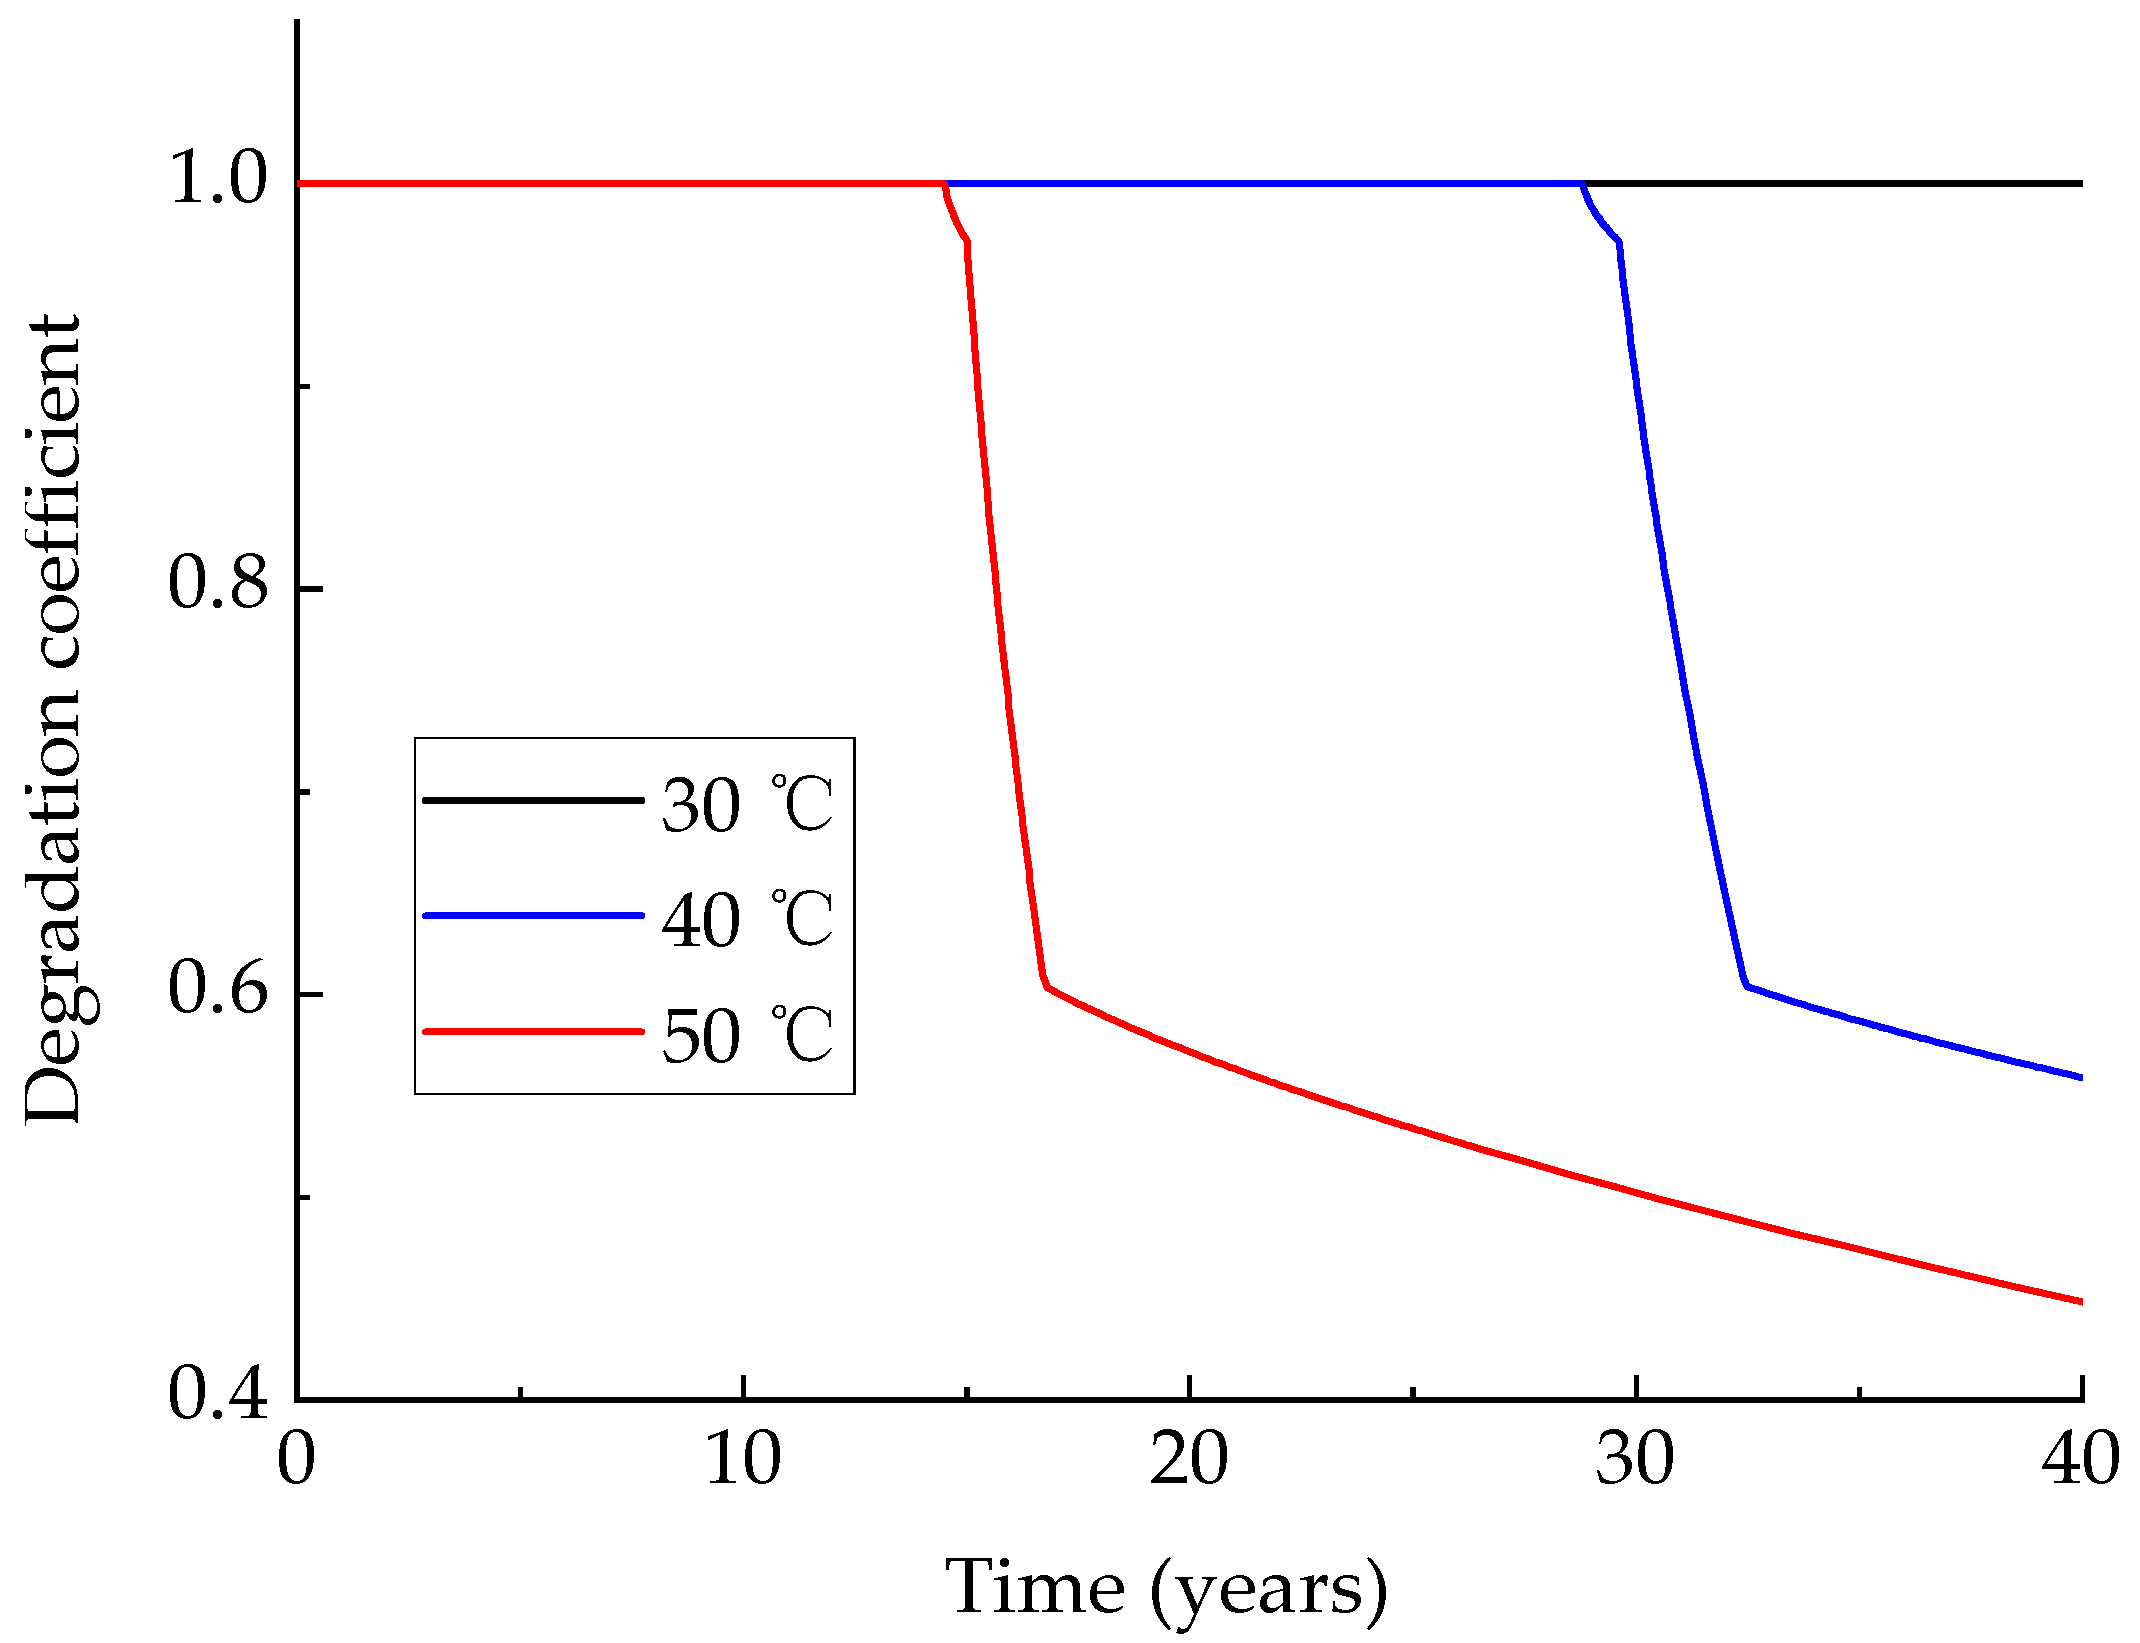
  • High temperatures can intensify the current density, which determines the corrosion rate of the reinforcement. The stiffness degradation coefficient of the pile is highly influenced by the reinforcement corrosive depth. The coefficient decreases rapidly when the protective layer of the reinforcing steel is destroyed.
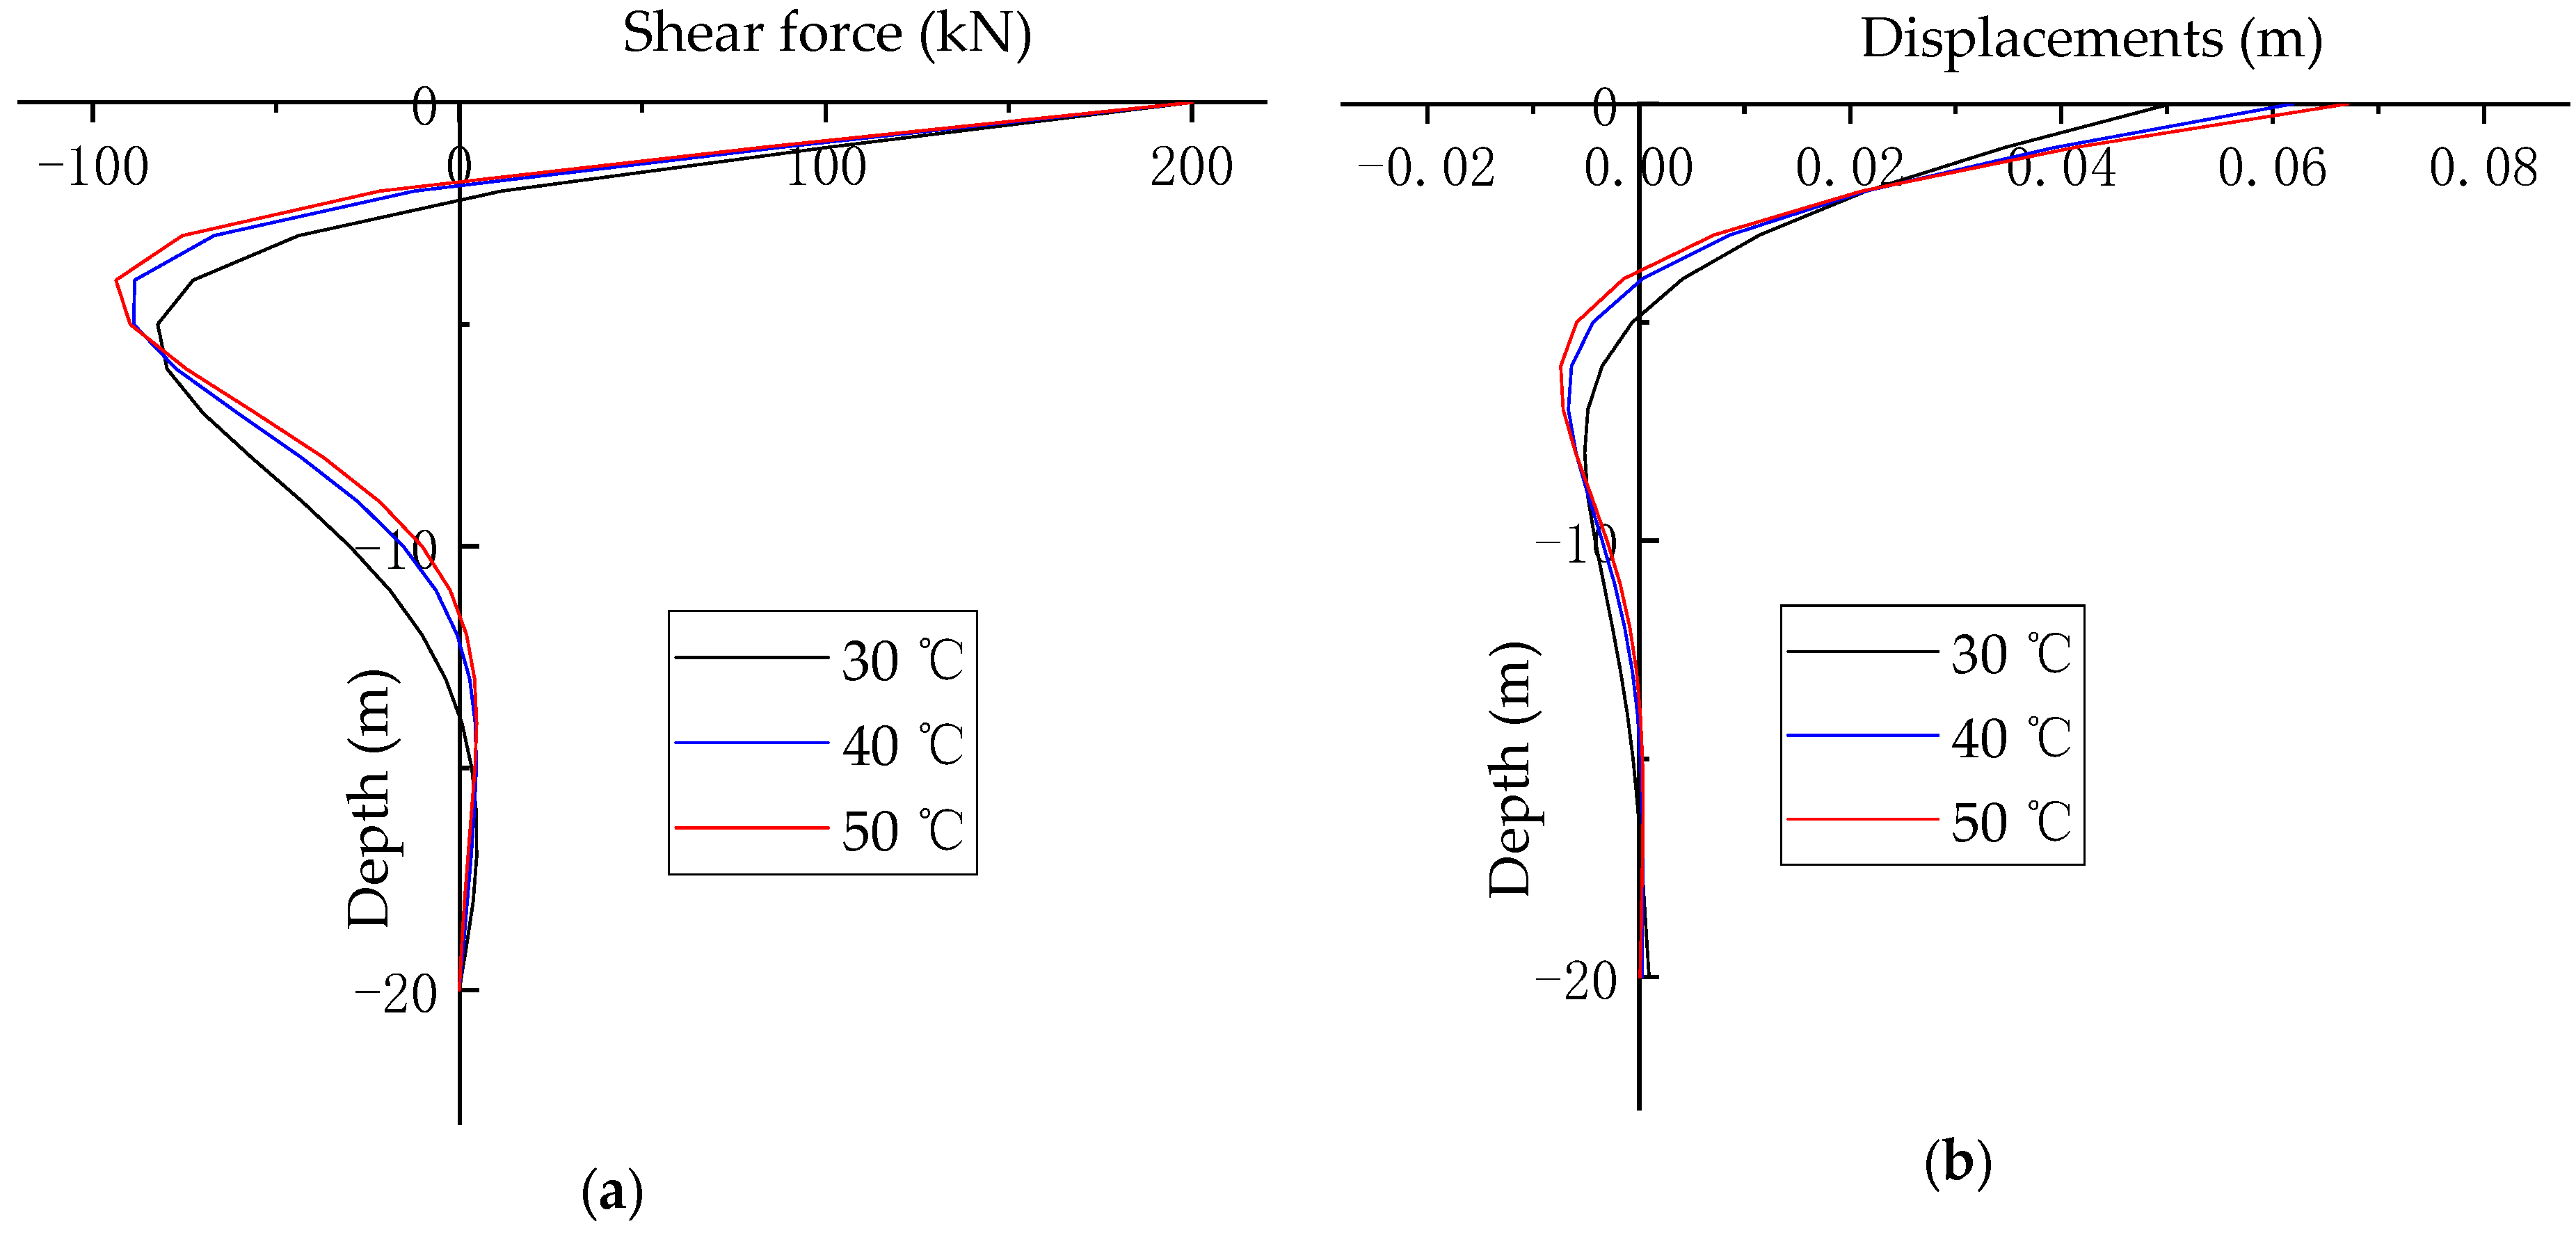
  • The behaviour of laterally loaded piles in chloride environments is analysed based on the stiffness degradation coefficient from the perspectives of the shear force, displacement and bending moment of piles.

Author Contributions

Conceptualization, Y.L. and Y.C.; data curation, Y.L.; formal analysis, Y.L.; investigation, Y.L.; funding acquisition, W.S. and J.Z.; methodology, Y.L. and W.S.; resources, Y.C. and W.S.; software, Y.L.; supervision, Y.C., W.S., J.Z., S.L. and T.M.F.-S.; validation, Y.C. and W.S.; visualization, Y.L.; writing–original draft, Y.L.; review and editing, S.L. and T.M.F.-S. All authors have read and agreed to the published version of the manuscript.

Funding

This research was financially supported by the National Natural Science Foundation of China (Grant Nos. 52078289 and 41372319) and the Innovation Program of Shanghai Municipal Education Commission, China (Grant No. 15ZZ081).

Institutional Review Board Statement

Not applicable.

Informed Consent Statement

Not applicable.

Data Availability Statement

Not applicable.

Conflicts of Interest

The authors declare no conflict of interest.

References

  1. Tang, L.; Utgenannt, P.; Boubitsas, D. Durability and Service Life Prediction of Reinforced Concrete Structures. In Proceedings of the 14th International Congress on the Chemistry of Cement, Beijing, China, 13 October 2015. [Google Scholar]
  2. Weerdt, K.D.; Lothenbach, B.; Geiker, M.R. Comparing Chloride Ingress from Seawater and NaCl Solution in Portland Cement Mortar. Cem. Concr. Res. 2019, 115, 80–89. [Google Scholar] [CrossRef]
  3. Kim, A.T.V.; Mark, G.S. Structural Reliability of Concrete Bridges Including Improved Chloride Induced Corrosion Models. Struct. Saf. 2000, 22, 313–333. [Google Scholar] [CrossRef]
  4. Yu, C.W.; Bull, J.W. Durability of Materials and Structures in Building and Civil Engineering, 1st ed.; CRC Press: Boca Raton, FL, USA, 2006. [Google Scholar]
  5. Jiang, L.H.; Li, C.Z.; Zhu, C.L.; Song, Z.J.; Chu, H.Q. The Effect of Tensile Fatigue on Chloride Ion Diffusion in Concrete. Constr. Build. Mater. 2017, 151, 119–126. [Google Scholar] [CrossRef]
  6. Shao, W.; Li, J.P.; Liu, Y. Influence of Exposure Temperature on Chloride Diffusion into RC Pipe Piles Exposed to Atmospheric Corrosion. J. Mater. Civ. Eng. 2016, 28, 1–8. [Google Scholar] [CrossRef]
  7. Apostolopoulos, C.A.; Papadakis, V.G. Consequences of Steel Corrosion on the Ductility Properties of Reinforcement Bar. Constr. Build. Mater. 2008, 22, 2316–2324. [Google Scholar] [CrossRef]
  8. Isteita, M.; Xi, Y. The Effect of Temperature Variation on Chloride Penetration in Concrete. Constr. Build. Mater. 2017, 156, 73–82. [Google Scholar] [CrossRef]
  9. Hussain, S.E.; Rasheeduzzafar; Al-Musallam, A.; Al-Gahtani, A.S. Factors Affecting Threshold Chloride for Reinforcement Corrosion in Concrete. Cem. Concr. Res. 1995, 25, 1543–1555. [Google Scholar] [CrossRef]
  10. Liu, T.; Weyers, R.W. Modeling the Dynamic Corrosion Process in Chloride Contaminated Concrete Structures. Cem. Concr. Res. 2019, 28, 365–379. [Google Scholar] [CrossRef]
  11. Daniel, P.; Daniel, B.; Paul, M.; Kelly, J. Investigation and Initial Stability Analysis of a Wharf on Severely Deteriorated Steel H-Piles. In Proceedings of the American Society of Civil Engineers 15th Triennial International Conference, Pittsburgh, PA, USA, 15 September 2019; pp. 273–283. [Google Scholar] [CrossRef]
  12. Cui, X.Z.; Zhang, N.; Li, S.C.; Zhang, J.; Tang, W.Z. Deterioration of Soil-Cement Piles in a Saltwater Region and Its Influence on the Settlement of Composite Foundations. J. Perform. Constr. Fac. 2014, 04014195. [Google Scholar] [CrossRef]
  13. Tuutti, K. Swedish Foundation for Concrete Research Stockholm. In Corrosion of Steel in Concrete; CBI: Stockholm, Sweden, 1982; pp. 105–119. [Google Scholar]
  14. Amey, S.L.; Johnson, D.A.; Miltenberger, M.A.; Farzam, H. Predicting the Service Life of Concrete Marine Structures: An Environmental Methodology. ACI Struct. J. 1998, 95, 205–214. [Google Scholar]
  15. Bhaskar, S.; Radhakrishna, G.P.; Ravindra, G.; Bharatkumar, B.H.; Iyer, N.R. Use of Portland Pozzolana Cement to Enhance the Service Life of Reinforced Concrete Exposed to Chloride Attack. J. Mater. Civ. Eng. 2015, 27, 04015031. [Google Scholar] [CrossRef]
  16. Kwon, S.J.; Na, U.J.; Sang, S.P.; Sang, H.J. Service Life Prediction of Concrete Wharves with Early–aged Crack: Probabilistic Approach for Chloride Diffusion. Struct. Saf. 2009, 31, 75–83. [Google Scholar] [CrossRef]
  17. Jee, A.A.; Pradhan, B. Study on Development of Empirical Relationships Between Durability Parameters of Concrete Made with Different Types of Binder and Exposed to Chloride Environment. Constr. Build. Mater. 2019, 212, 799–817. [Google Scholar] [CrossRef]
  18. Khaghanpour, R.; Dousti, A.; Shekarchi, M. Prediction of Cover Thickness Based on Long-term Chloride Penetration in a Marine Environment. J. Perform. Constr. Fac. 2016, 31, 04016070. [Google Scholar] [CrossRef]
  19. Zhou, A.; Qin, R.; Chow, C.L.; Lau, D. Structural Performance of FRP Confined Seawater Concrete Columns under Chloride Environment. Compos. Struct. 2019, 216, 12–19. [Google Scholar] [CrossRef]
  20. Wang, Y.Z.; Liu, C.X.; Li, Q.M.; Wu, L.J. Chloride Ion Concentration Distribution Characteristics within Concrete Covering-layer Considering the Reinforcement Bar Presence. Ocean Eng. 2019, 173, 608–616. [Google Scholar] [CrossRef]
  21. Shao, W.; Li, J.P. Service Life Prediction of Cracked RC Pipe Piles Exposed to Marine Environments. Constr. Build. Mater. 2014, 64, 301–307. [Google Scholar] [CrossRef]
  22. Shao, W.; Shi, D.D.; Jiang, J.P.; Chen, Y.L. Time-dependent Lateral Bearing Behaviour of Corrosion-damaged RC Pipe Piles in Marine Environments. Constr. Build. Mater. 2017, 157, 676–684. [Google Scholar] [CrossRef]
  23. Collepardi, M.; Marcialis, A.; Turrizzani, R. The Kinetics of Penetration of Chloride Ions into the Concrete. Ind. Ital. Cem. 1970, 4, 157–164. [Google Scholar]
  24. Collepardi, M.; Marcialis, A.; Turrizzani, R. Penetration of Chloride Ions into Cement Pastes and Concretes. J. Am. Ceram. Soc. 1972, 55, 534–535. [Google Scholar] [CrossRef]
  25. Enrico, Z.; Caio, G.N. Chloride Diffusion Assessment in RC Structures Considering the Stress-strain State Effects and Crack Width Influences. Constr. Build. Mater. 2019, 201, 100–109. [Google Scholar] [CrossRef]
  26. Philip, V.H.; Michel, D.K.; Alice, E.; Annemie, A.; Nele, D.B. Service Life and Global Warming Potential of Chloride Exposed Concrete with High Volumes of Fly Ash. Cement Concrete Comp. 2017, 80, 210–223. [Google Scholar] [CrossRef]
  27. Emilio, B.A.; Philippe, B.; Alaa, C. Probabilistic Lifetime Assessment of RC Structures under Coupled Corrosion-fatigue Deterioration Processes. Struct. Saf. 2009, 31, 84–96. [Google Scholar] [CrossRef] [Green Version]
  28. Panesar, D.K.; Chidiac, S.E. Effect of Cold Temperature on the Chloride-Binding Capacity of Cement. J. Cold Reg. Eng. 2011, 25, 133–144. [Google Scholar] [CrossRef]
  29. Martin, P.B.; Zibara, H.; Hooton, R.D.; Thomas, M.D.A. A Study of the Effect of Chloride Binding on Service Life Predictions. Cem. Concr. Res. 2000, 30, 1215–1223. [Google Scholar] [CrossRef]
  30. Shazali, M.A.; Rahman, M.K.; Al-Gadhib, A.H.; Baluch, M.H. Transport Modeling of Chlorides with Binding in Concrete. Arab. J. Sci. Eng. 2012, 37, 469–479. [Google Scholar] [CrossRef]
  31. Brunauer, S.; Skalny, J.; Bodor, E. Adsorption on Non–porous Solids. J. Colloid Interface Sci. 1969, 30, 546–552. [Google Scholar] [CrossRef]
  32. Xi, Y.; Bazant, Z.; Jennings, H. Moisture Diffusion in Cementitious Materials-adsorption Isotherms. Adv. Cem. Based Mater. 1994, 1, 248–257. [Google Scholar] [CrossRef]
  33. Karolina, H.; Šmilauer, V.; Libor, J. Prediction of Reinforcement Corrosion Due to Chloride Ingress and its Effects on Serviceability. Eng. Struct. 2018, 174, 768–777. [Google Scholar] [CrossRef]
  34. Petcherdchoo, A.; Chindaprasirt, P. Exponentially Aging Functions Coupled with Time-dependent Chloride Transport Model for Predicting Service Life of Surface-treated Concrete in Tidal Zone. Cem. Concr. Res. 2019, 120, 1–12. [Google Scholar] [CrossRef]
  35. Shao, W.; Nie, Y.H.; Liang, F.Y.; Shi, D.D. A Novel Comprehensive Evaluation Method for the Corrosion Initiation Life of RC Hollow Piles in Chloride Environments. Constr. Build. Mater. 2020, 249, 118801. [Google Scholar] [CrossRef]
  36. Zheng, J.J.; Zhang, J.; Zhou, X.Z.; Wu, Y.F.; Ye, Y.M.; Wang, Y.H. A Three-step Analytical Scheme for Estimating the Steady-state Chloride Diffusion Coefficient of Mature Cement Paste. Constr. Build. Mater. 2018, 191, 1004–1010. [Google Scholar] [CrossRef]
  37. Xu, Q.H.; Shi, D.D.; Shao, W. Service Life Prediction of RC Square Piles Based on Time-varying Probability Analysis. Constr. Build. Mater. 2019, 227, 116824. [Google Scholar] [CrossRef]
  38. Comité Euro-International Du Béton (CEB). CEB-FIP Model Code for Service Life Design; The International Federation for Structural Concrete (FIB): Lausanne, Switzerland, 2006. [Google Scholar]
  39. Du, F.Y.; Jin, Z.Q.; She, W.; Xiong, C.S.; Feng, G.G.; Fan, J.F. Chloride Ions Migration and Induced Reinforcement Corrosion in Concrete with Cracks: A Comparative Study of Current Acceleration and Natural Marine Exposure. Constr. Build. Mater. 2020, 263, 120099. [Google Scholar] [CrossRef]
  40. Liu, Y.P. Modeling the Time-to-corrosion Cracking of the Cover Concrete in Chloride Contaminated Reinforced Concrete Structures. ACI Mater. J. 1996, 95, 675–681. [Google Scholar] [CrossRef]
  41. Poulos, H.G.; Davis, E.H. Pile Foundation Analysis and Design, 1st ed.; John Wiley & Sons: New York, NY, USA, 1980. [Google Scholar]
  42. Ministry of housing and Urban-Rural Development of the People’s Republic of China. Durability Evaluation Criteria for Concrete Structures; China Architecture & Building Press: Beijing, China, 2007.
Figure 1. Phases in the service life of a RC structure.
Jmse 09 00614 g001
Figure 2. Configuration of RC square pile.
Jmse 09 00614 g002
Figure 3. Relation between chloride content (C) at the steel surface and exposure time (t).
Jmse 09 00614 g003
Figure 4. Chloride content distribution in concrete for an exposure time of 60 years.
Jmse 09 00614 g004
Figure 5. Variation in the failure probability of the corrosion initiation with exposure time.
Jmse 09 00614 g005
Figure 6. Corrosive depth xi in different temperatures.
Jmse 09 00614 g006
Figure 7. Schematic diagram of a single pile and loadings.
Jmse 09 00614 g007
Figure 8. Variations in the degradation coefficient with time.
Jmse 09 00614 g008
Figure 9. Internal force distribution diagrams of piles: (a) shear force; (b) displacement; (c) bending moment.
Jmse 09 00614 g009aJmse 09 00614 g009b
Table 1. Variables in t1 computation.
VariableDescriptionValue
C0Initial chloride concentration in concrete0
CsConcrete surface chloride concentration0.5% [35]
CthThe threshold concentration0.2% [35]
UActivation energy41.8 kJ/mol [25]
RIdeal gas constant8.31 × 10−3 kJ/mol/K [25]
D0Diffusion coefficient at time t0 (28d)5.98 × 10⁻¹² m2/s [36]
t0Time for standard curing of concrete28 d
α∂Cb/∂Cf0.6, 0.8, 1.0, 0.93, 0.85 [6]
hHumidity of pore in concrete1
teHydration period60 × 365 d
mThe decay rate0.2 [16,34]
x,y = c 0.05 m
Table 2. Probabilistic models of main random variables.
VariableDistributionMeanCOV
CsNormal [35]0.5%0.1
CthUniform [3,27]0.2%0.19
D0Normal [35]5.98 × 10⁻¹² m2/s0.1
TNormal [37]10, 20, 30, 40, 50 °C0.1
mNormal [37]0.20.2
Table 3. Variables in t2 Computation.
VariableDescriptionValue
MMolar mass of Fe5.6 g/mol
nCharge of reactive ion2.5 [39]
ρsDensity of Fe7.9 × 10 kg/m3
CChloride ion threshold4.8 kg/m3 (Cth = 0.5%)
d0Diameter of steel14 mm
cThickness of cover50 mm
αvRelative volume expansion ratio3 [41]
vcPoisson’s ratio of the concrete0.2 [27]
fctTensile strength of the concrete2.39 MPa
EcModulus of elasticity of the concrete3.25 × 104 MPa
φcCreep coefficient of concrete2
Table 4. Degradation coefficient of piles in service for 40 years.
Temperature
(°C)
Time to Initiation
(yrs)
Time to xi (yrs)xi (mm)Ai
(mm2)
ηiη
10, 20, 30 °C4000 11
40 °C28.811.20.5142.12 × pi0.650.56
50 °C14.525.51.1833.87 × pi0.650.45
Table 5. Initial stress state and basic characteristics of piles.
VariableDescriptionValue
H0Horizontal load200 kN
N0Vertical load2000 kN
M0Moment300 kNm
khProportional factor of the coefficient of the subgrade reaction3.0 MN/m4
EcModulus of elasticity of the concrete3.25 × 104 MPa
IpMoment of inertia of pile section0.54/12 m4
Publisher’s Note: MDPI stays neutral with regard to jurisdictional claims in published maps and institutional affiliations.

