Abstract
In this paper, the characteristics of the impact pressure and force of a trimaran section was studied by Computational Fluid Dynamics (CFD). The time domain features of the slamming pressure or force showed a strong correlation with the penetration depth regardless of the specific ways of water entry. The effects of velocity and acceleration on the impact pressure and force were analyzed. It was found that the initial impact of the main hull and the wet-deck slamming were predominantly affected by the entry velocities, whilst the acceleration had almost no effect for initial impact. The impact velocity presented a quadratic relation with slamming pressure/forces, and the relation between acceleration and wet-deck slamming pressure/force was linear. These were consistent with the patterns implied by analytical models such as the Wagner or MLM (Modified Logvinovich model) theories.
1. Introduction
One of the immediate consequences of a ship sailing in waves is the slamming of the hull, especially the bow area. The slamming problem has been a very important problem in the field of Marine hydrodynamics for a long time [1]. The special wet-deck structure of multihull ships can provide more deck area for storage or other purposes, but also causes the severe slamming problem under the wet-deck area [2].
The uniqueness of the multihull slamming is essentially the mutual influence of the adjacent hull water entry. The existing analytical models, such as Wagner-based models [3], are capable of handling the slamming for either the side hull or the main hull water entry, but the slamming event under the wet-deck area is beyond the scenarios considered in the abovementioned models. More specifically, the water rising caused by the entry of both the main hull and side hull under the wet-deck area would gradually close up the gap and finally generate an impulsive force (i.e., slamming) on the structure. This is quite different from the flow pattern in single body water entry process. Both model and full-scale experiments have been conducted for multihull slamming studies. For example, Lavroff et al. [4] studied the wave impact phenomenon of catamarans by means of a full-scale test of a 112 m INCAT wave-punch-catamaran and a model scale test of a 2.5 m sectional hydroelastic model. Jacobi et al. [5] studied the impact behavior of large high-speed catamarans through the analysis of full-size test data. Yu et al. [6] conducted a model test of the hull slamming load of the trimaran in the seakeeping tank. Davis et al. [7] have studied a wave-piercing catamaran with an elastic segmented model under random wave conditions by experiments and numerical simulations, based on which empirical models were developed for the slam occurrence rates and slam loading.
In terms of slamming pressure and force predictions, the rapid-developing CFD techniques provide a powerful tool for such problems with violent free surface deformation and complex structural geometry. Some representative three-dimensional simulations include the one by Panciroli et al. [8], who carried out experimental and numerical studies based on the SPH method about the hydroelastic response of wedge structure in the process of slamming. Iranmanesh et al. [9] investigated the hydrodynamics of a horizontal circular cylinder during water entry under low Froude numbers. Vinod et al. [10] used mesh-based CFD and the VOF (Volume Of Fluid) scheme to track the free surface to simulate the water impact and the subsequent water inflow of three rigid axisymmetric objects (a sphere and two cones), and compared the results with the latest experimental results in the literature. For multihull ships, McVicar et al. [11] have studied the slamming and bending of a large catamaran sailing at high speed in waves by fluid-solid coupling simulation. Chen et al. [12] proposed a three-dimensional nonlinear time-domain hydroelastic method for the response of ship hull in oblique irregular waves.
The two-dimensional simulation has also been widely used to study the mechanisms of single hull slamming problems, due to the simplicity of computation and convenience of isolating the main flow pattern of slamming. For example, Bilandi et al. [13] used the finite volume method to simulate the uniform water entry of a two-dimensional symmetric wedge and an asymmetric wedge in calm water. Krastev et al. [14] studied the hydrodynamic problem of two-dimensional wedge asymmetric water collision by numerical method. Using the SPH method, Hu et al. [15] numerically studied the water entry of two-dimensional wedges with different tilt angles. However, the pure two-dimensional analysis of multihull slamming would face a difficulty, namely that the air trapped under the wet-deck after the side hull entry is not an authentic reproduction of the wet-deck slamming process since normally the air would have relatively easily escaped during the gap closing process of wet-deck slamming.
In this study, the quasi-two-dimensional analysis was conducted by carefully choosing the length in the X direction (as shown in Figure 1) of a three-dimensional trimaran model, i.e., maintaining the two-dimensionality as much as possible while also making sure the air would be evacuated as freely as possible. The commercial software StarCCM+ was used for the simulation, which is based on a common combination of mesh-type FVM (Finite Volume Method) for domain discretization and the VOF method for free surface capturing. Through a series of numerical simulations with uniform velocity and acceleration, the influence from trimaran hull motion on the slamming pressure and force characteristics were discussed. More specifically, inspired by analytical models derived for single symmetric blunt body, the slamming force acting on trimaran body can also be divided into two parts, which are dependent on the body entry velocity and acceleration, respectively. This indicates that the basic assumption of the analytical model is also applicable for complex slamming process such as trimaran. Although the direct computation of the velocity and acceleration dependent coefficients for trimaran by analytical models is not straightforward (since it cannot directly handle the complex free surface deformation under the wet-deck area of trimaran), these coefficients can be readily extracted by the CFD solver. This means that the slamming force under various entry scenarios can always be obtained by the superposition of these two pre-calculated coefficients, which significantly reduces the computational burden for slamming force prediction and consequently shape optimization.
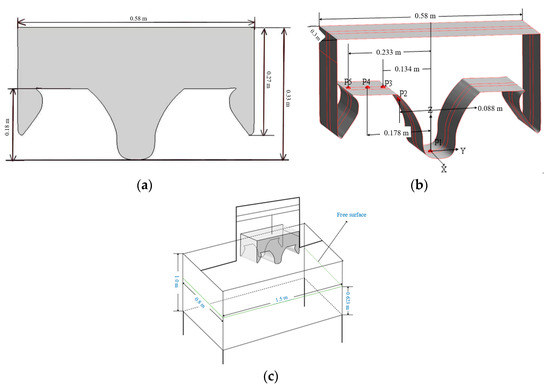
Figure 1.
Dimensions of trimaran model and schematic diagram of experimental setup ((a) Sketch of trimaran model; (b) Hull dimensions and pressure sensors layout; (c) Schematic diagram of experimental layout).
2. Numerical Models and Two-Dimensionality Verification
2.1. Numerical Model
The numerical simulation in this paper was conducted by the commercial software Star-CCM+ (v.12, Munich, Germany) and the numerical models used include the standard k-ε turbulence model, the Euler two phase flow model, and the VOF wave model. The fluid depth is 0.623 m, which is filled with water (the density ≈ 997 kg/m3). The ship model is set 0.377 m above the water at the beginning of simulation. For the whole simulation area, the types of the boundary conditions for the four sides and bottom are set to be non-slip wall, while the top is set as the pressure outlet. The trimaran geometry used in the simulation is the same as the one in the authors’ previous experimental work [2]. The layout of pressure monitors (i.e., p1~p5) and the dimensions of experimental devices are shown in Figure 1.
As shown in Figure 2, the main type of mesh used in the simulation was selected as structural mesh, namely hexahedral mesh. The basic size of the background mesh for the whole computational domain was selected as 0.08 times of the characteristic length, which was the minimum size of the water tank, i.e., 0.8 m. The area around the free surface and the area through which the trimaran would pass (which is labelled as the “Refine background mesh area” in Figure 2a) were further refined, and the size was 0.125 times that of the basic background mesh. For the overset area that moves with the trimaran, the mesh size was selected as the same as the mesh size of the “Refine background mesh area.” The close area around the trimaran was further refined with 0.25 times of the “Refined background mesh area.” Moreover, the boundary layer of the trimaran was discretized in a body fitted manner instead of structural mesh.
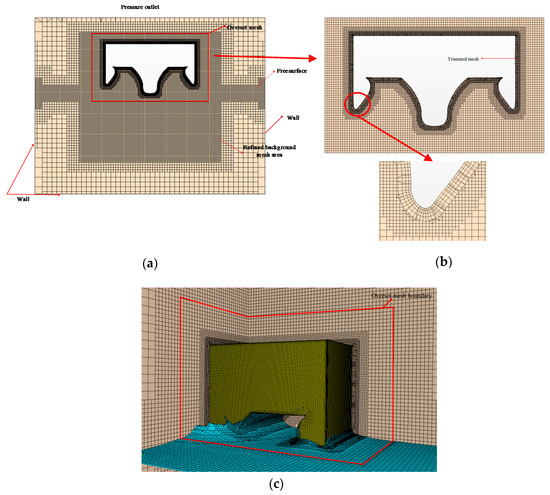
Figure 2.
Mesh distribution and the boundary condition setting used in simulation ((a) Meshes of middle section; (b) Overset mesh area and enlarged trimmed mesh around the side hull corner; (c) Body surface and free surface mesh).
In terms of specific mesh size and amount, the basic size of the background mesh was 0.064 m; the mesh size of the refined area near the free surface, overset mesh area, and the area through which the trimaran moves were 0.008 m; and the size of most refined area around the trimaran was 0.002 m. The total number of mesh was 4.2 million, and the mesh number within the overset mesh area was 3 million. The CFL value used was 0.085, which means the time step was 0.0001 s.
The mesh discretization over the computational domain and the boundary condition settings are also shown in Figure 2. The numerical models for the simulation were validated against the free dropping test conducted by us in the authors’ another work [16], in which the same numerical models were also further validated against another multihull dropping experiment in the literature [17]. For the simplicity reasons, these validation cases are not repeated here, and more details can be found in ref. [16].
2.2. Two-Dimensionality Verification
The special configuration of multihull ships such as trimaran means the air cushion effect under the cross-sections can potentially affect the pressure and overall force significantly during slamming. More specifically, a thick section, which has a longer “tunnel” between the cross-section and water surface, means the air can hardly escape during the impact, and this means the slamming force could be eased out to some extent by the air cushion. The question that this study aims to answer is how the slamming pressure and force would be affected by the vertical motions if the air is free to escape. Therefore, the proper length in the X direction of the section has to be determined. More specifically, the length in the X direction should be small enough to facilitate the effective ventilation under the cross-section, but large enough to make sure the edge of the section would not significantly affect the middle plane. In other words, the section length in the X direction that guarantees the two-dimensionality of flow in the section’s middle plane with the minimum effect of air should be determined. It is worth mentioning that the two-dimensional simulation cannot fit into the abovementioned requirement since the air will be trapped under the cross-section after the side hull enters the water.
For this purpose, three cases of trimaran sections free dropping with the length in the X direction of 0.2 m, 0.3 m, and 0.4 m were selected. The dropping height was the same for these three cases, i.e., 0.1473 m (or initial water entry velocity 1.7 m/s). The mass for these three models were 3.013 kg, 4.52 kg, and 6.027 kg, respectively (which is proportional to the corresponding length in the X direction). Five virtual pressure monitors were placed in the middle plane section of the structure in the same way that is shown in Figure 1b. A virtual acceleration sensor was also placed on the body. The calculated results are shown in Figure 3, in which “Exp average line” means the average of results from different experimental trials, “Exp envelop line” means the envelop lines of results from different experimental trials, and the other three lines correspond to the numerical simulation results by 0.2 m, 0.3 m, and 0.4 m in the X direction, respectively. It can be observed from Figure 3 that the pressure at all measuring points and the acceleration were close to the corresponding experimental ones. The difference between the three cases was around 10%. More specifically, the case of 0.2 m deviated slightly more than the other two cases, and the cases of 0.3 m and 0.4 m were almost identical. This indicates that 0.3 m should be thick enough to eliminate the effect from the edge, and yet thin enough to let the air escape freely.
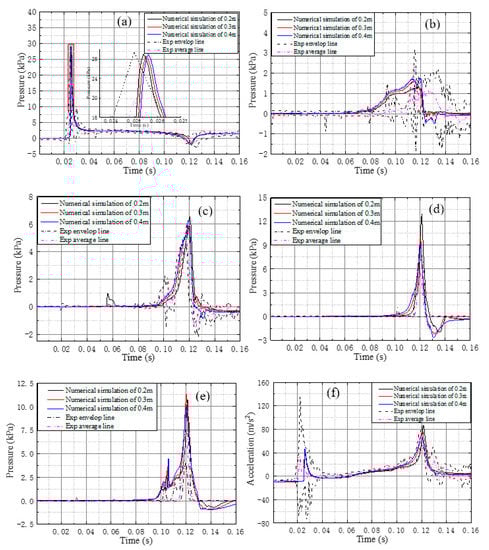
Figure 3.
Comparison of pressure and acceleration time-histories simulations with different lengths in the X direction against experimental results ((a–e) the pressure time histories at p1~p5; (f) the acceleration time-history).
It is also worth to mentioning that the same experimental results shown in our previous work [2] were presented in filtered form, whilst in this paper, the unfiltered raw data are shown. The characteristics of the pressure and acceleration data were very similar in both forms, though the filtered ones are smoother as expected. The main difference is that the peak at p1 after filtering is half of the raw value. The computational results used in this paper match well with the raw data as shown in Figure 3a.
In order to further check the pressure distribution along the X direction, the case of a 0.3 m trimaran hull entering the water with constant velocity of 1.7 m/s was simulated. A series of monitoring points were arranged at the tip of the main hull and under the wet-deck along the X direction. The pressure distribution is shown in Figure 4. As expected, the peak pressure decreases gradually from the middle to both sides along the X direction. Under the main hull, the edge tended to have very limited influence on the flow in the middle plane region, whilst under the wet-deck, the pressure close to the edge could drop up to half of the value in the middle plane. However, in the part near the middle longitudinal section, the pressure maintained a roughly constant distribution. More specifically, the pressure fluctuation within the range of 0.025 m forward and backward of the middle along the X direction was less than 12%. Therefore, the pressure within this scope was integrated for vertical force analysis later.
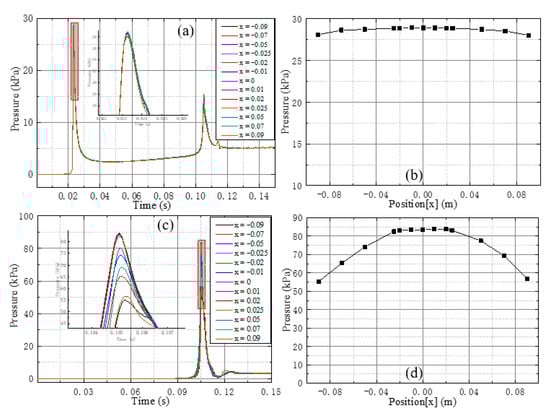
Figure 4.
The pressure time histories at different monitoring pointes along the X direction and the corresponding peak pressures ((a,c): pressure time histories of monitoring points under main hull p1 and wet-deck p4, respectively, along the X direction in Figure 1b; (b,d): the peak pressures at p1 and p4 vs. X-coordinates, respectively).
3. Results and Discussion
3.1. Simulation Parameters
In this section, the relationships between motions of the trimaran and hydrodynamic forces were investigated. The influence from entry velocity and acceleration were studied by the method of variable separation.
For the constant velocity water entering cases, the specific velocities used in the simulation are shown in Table 1 (in which V is −1.7 m/s).

Table 1.
Velocities used in entry with constant velocity cases.
For the constant acceleration water entering cases, five different accelerations were selected to investigate the effect from acceleration. The positive direction was set to be upward. The velocity at the time instant of contacting the water was kept the same, which was 2 V, i.e., −3.4 m/s. The specific parameters were set as shown in Table 2 (in which g is −9.81 m/s2).
Table 2.
Acceleration used in entry with constant acceleration cases.
All the simulations in this paper are run on the computer with Intel(R) Core(TM) i7-8700 (duo 3.2 GHz) CPU, RAM 32 GB. In terms of computational cost, for a typical case, the computational time was about 10 CPU hours.
3.2. Pressure Analysis
In this section, the pressure under the main hull and wet-deck were analyzed. The pressure time history under the abovementioned different velocity and acceleration conditions were plotted against the corresponding penetration depth, as in Figure 5 and Figure 6. It is worth mentioning that the two peaks in Figure 5a and Figure 6a correspond to the initial slamming of the main hull and the subsequent wet-deck slamming, respectively. It can be seen from the time history of pressures that the characteristics of the pressure were strongly correlated to the penetration depth, regardless of the time history of different types of penetration. More specifically, the increasing/decreasing patterns and the positions corresponding to the peak value were all the same under different entry velocities and accelerations, respectively. This is consistent with the commonly used slamming prediction theory, such as Wagner’s model [3] or the MLM model [18], as follows:
in which is the penetration depth, and and have different definitions in Wagner or MLM models:
where .
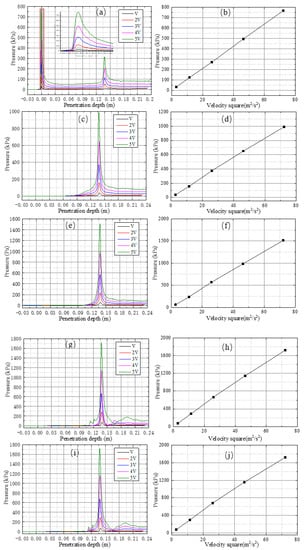
Figure 5.
Pressure varying with penetration depth with different constant entry velocities, and the relation between pressure peak values and square of corresponding entry velocities ((a,c,e,g,i): pressure vs. penetration depth at five monitoring points with different entry velocities; (b,d,f,h,j): peak pressures values vs. square of the entry velocity at five monitoring points).
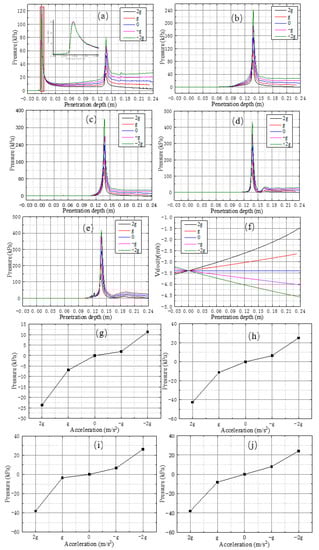
Figure 6.
Pressure varying with penetration depth with different constant entry accelerations and pressure peak (after extracting the velocity dependent part) changing with accelerations ((a–e): pressure against penetration depth at five monitoring points for different entry accelerations; (f) velocity against penetration depth; (g–j): peak pressures of monitoring points p2~p5 varying with corresponding accelerations).
As can be seen from Equation (1), the pressure with any particular Y coordinate can be divided into velocity and acceleration dependents parts, in which the two parts do not affect each other and the corresponding coefficient for each part is only dependent on penetration depth.
For the velocity dependent part, the prediction by Equation (1) implies that with the increase of the speed, the pressure peak at each monitoring point increases quadratically, since the acceleration related parts were expected to be zero under the constant entry velocity condition. This is exactly what occurred for all the pressure monitoring points, as can be seen from Figure 5b,d,f,h,j. This should be expected for the main hull area since its peaks occurred before the side hull entry, which means the main hull slamming would be the same as the slamming of a single hull, and this is exactly the scenario that these analytical models are based on. However, the flow pattern corresponding to the wet-deck area is quite different from the single hull water entry, i.e., the air gaps gradually close until the instant of the wet-deck slamming peak. The interesting point is that the pressure peak on the side of main hull (i.e., pressure monitor p2) and under the wet-deck (i.e., pressure monitor p3~p5) also followed the patterns predicted by the analytical models. This indicates that if the air is assumed to be evacuated freely (which is guaranteed in this study by carefully selecting the length in the X direction of the trimaran hull in Section 2.2), the hydrodynamic mechanism behind these two types of slamming events is to some extent quite similar, which would need more in-depth analysis in a future study.
For the case of water entry with constant acceleration, as shown in Figure 6a, the acceleration had almost no effect on the pressure peak (or indeed the time history before and after this instant) under the main hull (i.e., pressure monitor p1), which means the coefficient for the acceleration dependent part in Equation (1) is negligible (as will also be shown in Section 3.3). In the area under the wet-deck, in order to further isolate the influence from acceleration on pressure, the velocity dependent parts, which was interpolated from the results in Figure 5 at corresponding velocity for a particular pressure monitor, were extracted from the total pressure value. This manipulation was based on the analytical models as in Equation (1), in which the velocity and acceleration dependent pressure can be separated. As shown in Figure 6g–j, the acceleration and pressure peak showed an almost linear dependency, and the upward acceleration (i.e., g and 2 g) would generate negative pressure distribution. These again are consistent with the model predictions in Equation (1). It should be noted that, in Figure 5 and Figure 6, the value of the pressure is very large, especially for the peak pressure, which is even more than 1000 kPa. This is partially due to the relatively high impact velocity of the hull, but more importantly, it is due to the process of the air gap collapsing under the wet-deck, which makes the slamming effect much stronger for trimaran structure compared to single blunt body.
Figure 7 and Figure 8 show the pressure contours and free surface positions of the middle plane of the trimaran (i.e., Y–Z plane) at some typical penetration depths (i.e., 0.089 m, 0.155 m, and 0.178 m) under different entry velocities and accelerations, respectively. At the same depth of penetration, the position and shape of the free surface were almost identical regardless of the velocity or acceleration. Moreover, the patterns of the pressure spatial distribution at the same penetration depth show a high level of similarity as well, although the specific pressure values under higher velocities or accelerations were indeed higher as expected. It worth noticing that the pressure around the tip of the main hull at 0.089 m penetration for entry velocity of V (i.e., 1st row 1st column of Figure 7) shows a slightly different distribution from the cases at the same penetration depth under different entry velocities, i.e., the pressure hotspot was not as significant as other corresponding cases due to the lower entry velocity.
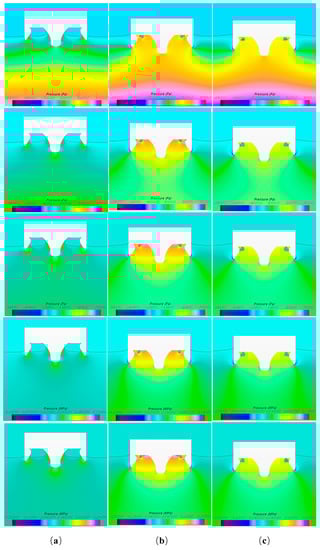
Figure 7.
The pressure contours at the same penetration depth under different entry velocities; the red line is the free surface level (each row of pictures correspond to V, 2 V, 3 V, 4 V, and 5 V, respectively; columns (a–c) correspond to the penetration of 0.089 m, 0.155 m, and 0.178 m, respectively).
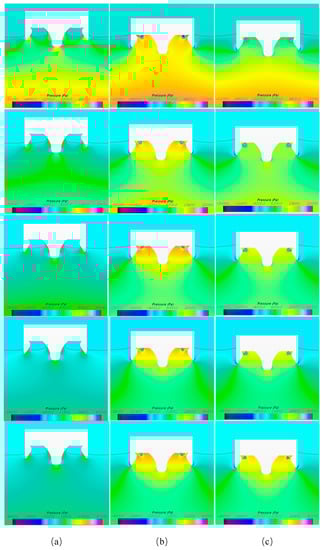
Figure 8.
The pressure contours at the same penetration depth under different entry acceleration, Table 2. g, −g, 0, g, and 2 g in order; columns (a–c) correspond to the penetration of 0.089 m, 0.155 m, and 0.178 m, respectively).
Overall, this pressure and free surface characteristics are consistent with the above analysis, i.e., the pressure distribution is strongly correlated with the penetration depth regardless of the specific way of entry.
3.3. Force Analysis
The discussion for pressure distribution indicates that the initial slamming of the main hull is dominantly affected by the velocity and the influence from acceleration is negligible, whilst the wet-deck slamming would increase quadratically and linearly with velocity and acceleration, respectively. This pressure pattern fits well with the prediction by analytical models such as Wagner or MLM. In this section, the force characteristic on a thin section centered by the middle plane is further investigated based on those theories. More specifically, according to Figure 4b,d, it can be seen that the pressure of the monitors 0.025 m before and after the middle plane (i.e., Y–Z plane) was approximately equal, indicating that the flow within this thin layer of the section is appropriate to be considered as two-dimensional. Therefore, the pressure under this area of the section was integrated for the force analysis [3,18,19,20]. As stated by Korobkin [18], within the framework of many models that originated from Wagner’s model, by integrating the pressure (as in Equation (1)) along the body surface, the slamming force can be formulated as the following formula:
where and are two functions that only depend on the penetration depth and the shape of the body, and are not affected by the particular penetration time history.
More specifically, the functions and take different forms due to the characters of the body shape and higher orders of pressure term in the Bernoulli equation within different analytical models.
As showed in the work of Seng [20], CFD can be used to determine the specific forms of functions and for different single hull shapes (i.e., wedge and ship section). This would be more effective for cases involving complex body shapes, where analytical models tend to require complicated mathematic operations or are even unable to give direct solutions (such as for the case of trimaran). In order to extract the velocity and acceleration related functions and separately, the following procedures [20] were used:
First, the entry velocity was set to be constant, which means the acceleration related part in Equation (4) is zero. Hence, the velocity related part can be extracted as.
Second, the body was forced to penetrate the water with constant acceleration, and then, by using the velocity related function obtained in previous step, the acceleration related function can be calculated by.
The vertical force and the extracted curve are shown in Figure 9a,b, respectively. As mentioned in Section 2.2, the CFD calculated forces were obtained by integrating within the 0.05 m thick layer around middle plane. This force was then converted to the scale of the 0.3 m thick trimaran (i.e., by multiplying with a factor of 6). The same manipulation was used for the analysis with constant acceleration penetration later.
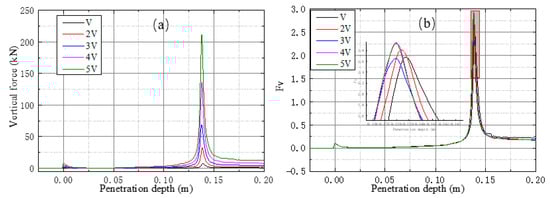
Figure 9.
The vertical force varying the penetration depth for different constant entry velocity and estimated from these CFD results ((a) Vertical forces against penetration depth under five velocities; (b) The separated drag coefficient ).
As shown in Figure 9, the curve extracted from the cases with different entry velocities was almost the same, which shows the suitability of this slamming force decomposition model to a complex shape such as a trimaran for both initial main hull slamming and wet-deck slamming.
The vertical forces and resulting function are shown in Figure 10a,b, respectively.
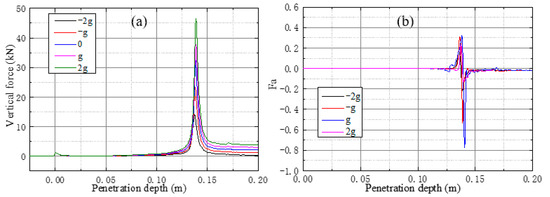
Figure 10.
The vertical force varying the penetration depth for different constant entry acceleration and estimated from these CFD results ((a) Vertical forces against penetration depth under five acceleration; (b) The separated drag coefficient .)
As shown in Figure 10b, before the wet-deck slamming (i.e., penetration depth at around 0.14 m), the acceleration related functions from different velocity-acceleration combination cases are very consistent, and the value is almost zero. This indicates that before the wet-deck slamming, including the initial water entry of the main hull, the acceleration effect on the slamming force is negligible, which is consistent with the findings in Section 3.2. In the instant of wet-deck slamming, the function started to oscillate and the pattern from different accelerations was consistent with each (though not as repeatable as the curve before wet-deck slamming), but the value was still significantly smaller than .
Based on the above analysis, this force decomposition theory is generally applicable for the slamming analysis of trimaran shape body, and the overall effect from velocity on the dynamics of the slamming process is considerably more significant than that from acceleration. This is also consistent from the pressure discussions in Section 3.2.
4. Conclusions
In this paper, the characteristics of the trimaran hull slamming pressure and force was investigated by CFD. The air between the wet-deck and free surface was guaranteed to be evacuated as freely as possible by choosing the appropriate length in the X direction of the hull. This practice made the two-dimensional assumption within a thin layer centered by the middle plane to be valid.
The influences of entry velocity and acceleration were studied by conducting water entry simulations with constant entry velocities and accelerations. It was found that the initial slamming pressure and force of the main hull were predominantly determined by impact velocity, and the effect from acceleration was negligible. For the wet-deck slamming, the velocity effect was still significantly larger than that from acceleration. More quantitively, for both initial and wet-deck slamming, the pressure and force peaks of wet-deck slamming were all quadratically correlated with entry velocities, whilst the relation was found to be linear with acceleration for wet-deck slamming.
The characteristics of both the initial and wet-deck slamming were consistent with the prediction by analytical models such as Wagner or MLM theories, which are designed for single hull water entry scenarios. Although these models cannot be directly applied for the pressure and force computation of trimaran wet-deck slamming analysis, the essential features of slamming pressure and force indicated by these models are still valid. More specifically, the slamming pressure and force could be separated as velocity and acceleration dependent parts, respectively (linear or quadratic as mentioned above), and the characteristics of slamming pressure and force are only dependent on the penetration depth regardless of the ways of entry.
In the future, the validity of force decomposition concept for 3D bodies are planned to be investigated. Moreover, the correlation between the obtained motion (i.e., velocity and acceleration) dependent slamming force coefficients and the particular shape characteristics are planned to be studied in detail, which could be used as a practical tool for shape optimization of complex hull shapes such as trimaran.
Author Contributions
Conceptualization, investigation, methodology and validation, Z.S., A.K. and Y.D.; supervision, Z.S. and L.Z.; resources, Z.S., L.Z. and Y.J.; writing and editing, Z.S., X.S., Y.D. and L.X. All authors have read and agreed to the published version of the manuscript.
Funding
This research was funded by the National Key Research and Development Program of China, grant number 2019YFC0312400 & 2019YFC0312402, National Natural Science Foundation of China, grant number 51809035, Open Project of State Key Laboratory of Deep Sea Mineral Resources Development and Utilization Technology, grant number SH-2020-KF-A01, China Postdoctoral Science Foundation (Grant No. 2018M641693), Liao Ning Revitalization Talents Program, grant number XLYC1908027, and the Fundamental Research Funds for the Central Universities, grant numbers DUT20TD108, DUT20LAB308.
Institutional Review Board Statement
Not applicable.
Informed Consent Statement
Not applicable.
Data Availability Statement
The data presented in this study are available on request from the corresponding author.
Conflicts of Interest
The authors declare no conflict of interest.
References
- Dias, F.; Ghidaglia, J.M. Slamming: Recent Progress in the Evaluation of Impact Pressures. Annu. Rev. Fluid Mech. 2018, 50, 243–273. [Google Scholar] [CrossRef]
- Sun, Z.; Jang, Y.C.; Zong, Z.; Xing, J.T.; Djidjeli, K. Slamming load on trimaran cross section with rigid and flexible arches. Mar. Struct. 2019, 66, 227–241. [Google Scholar] [CrossRef]
- Wagner, H. Phenomena Associated With Impacts And Sliding on Liquid Surfaces. Z. Angew. Math. Mech. 1932, 12, 193–215. [Google Scholar] [CrossRef]
- Lavroff, J.; Davis, M.R.; Holloway, D.S.; Thomas, G.A.; McVicar, J.J. Wave impact loads on wave-piercing catamarans. Ocean Eng. 2017, 131, 263–271. [Google Scholar] [CrossRef]
- Jacobi, G.; Thomas, G.; Davis, M. An insight into the slamming behaviour of large high-speed catamarans through full-scale measurements. J. Mar. Sci. Technol. 2014, 19, 15–32. [Google Scholar] [CrossRef]
- Yu, H.; Li, Z.J.; Hu, J.J. Slamming Load Forecasts and Analyses of a Trimaran Model Test. J. Ship Mech. 2014, 18, 623–634. [Google Scholar]
- Davis, M.R.; French, B.J.; Thomas, G.A. Wave slam on wave piercing catamarans in random head seas. Ocean Eng. 2017, 135, 84–97. [Google Scholar] [CrossRef]
- Panciroli, R.; Abrate, S.; Minak, G.; Zucchelli, A. Hydroelasticity in water-entry problems: Comparison between experimental and SPH results. Compos. Struct. 2012, 94, 532–539. [Google Scholar] [CrossRef]
- Iranmanesh, A.; Passandideh-Fard, M. A three-dimensional numerical approach on water entry of a horizontal circular cylinder using the volume of fluid technique. Ocean Eng. 2017, 130, 557–566. [Google Scholar] [CrossRef]
- Nair, V.V.; Bhattacharyya, S.K. Water entry and exit of axisymmetric bodies by CFD approach. J. Ocean Eng. Sci. 2018, 3, 156–174. [Google Scholar] [CrossRef]
- McVicar, J.; Lavroff, J.; Davis, M.R.; Thomas, G. Fluid–structure interaction simulation of slam-induced bending in large high-speed wave-piercing catamarans. J. Fluids Struct. 2018, 82, 35–58. [Google Scholar] [CrossRef]
- Chen, Z.Y.; Gui, H.B.; Dong, P.S.; Yu, C.L. Numerical and experimental analysis of hydroelastic responses of a high-speed trimaran in oblique irregular waves. Int. J. Nav. Archit. Ocean Eng. 2019, 11, 409–421. [Google Scholar] [CrossRef]
- Bilandi, R.N.; Jamei, S.; Roshan, F.; Azizi, M. Numerical simulation of vertical water impact of asymmetric wedges by using a finite volume method combined with a volume-of-fluid technique. Ocean Eng. 2018, 160, 119–131. [Google Scholar] [CrossRef]
- Krastev, V.K.; Facci, A.L.; Ubertini, S. Asymmetric water impact of a two dimensional wedge: A systematic numerical study with transition to ventilating flow conditions. Ocean Eng. 2018, 147, 386–398. [Google Scholar] [CrossRef]
- Hu, Z.; Zhao, X.Z.; Li, M.Y.; Fang, Z.H.; Sun, Z.L. A numerical study of water entry of asymmetric wedges using a CIP-based model. Ocean Eng. 2018, 148, 1–16. [Google Scholar] [CrossRef]
- Sun, Z.; Deng, Y.Z.; Zou, L.; Jiang, Y.C. Investigation of trimaran slamming under different conditions. Appl. Ocean Res. 2020, 104, 102316. [Google Scholar] [CrossRef]
- Davis, M.R.; Whelan, J.R. Computation of wet deck bow slam loads for catamaran arched cross sections. Ocean Eng. 2007, 34, 2265–2276. [Google Scholar] [CrossRef]
- Korobkin, A.; Khabakhpasheva, T.; Malenica, S.; Kim, Y. A comparison study of water impact and water exit models. Int. J. Nav. Archit. Ocean Eng. 2014, 6, 1182–1196. [Google Scholar] [CrossRef]
- Korobkin, A. Analytical models of water impact. Eur. J. Appl. Math. 2004, 15, 821–838. [Google Scholar] [CrossRef]
- Seng, S. Slamming And Whipping Analysis Of Ships. DTU Mech. Eng. 2012, 196, 903–1685. [Google Scholar]
Publisher’s Note: MDPI stays neutral with regard to jurisdictional claims in published maps and institutional affiliations. |
© 2021 by the authors. Licensee MDPI, Basel, Switzerland. This article is an open access article distributed under the terms and conditions of the Creative Commons Attribution (CC BY) license (https://creativecommons.org/licenses/by/4.0/).