
Characteristics of Slamming Pressure and Force for Trimaran Hull


 ,
, 
Abstract
:1. Introduction
2. Numerical Models and Two-Dimensionality Verification
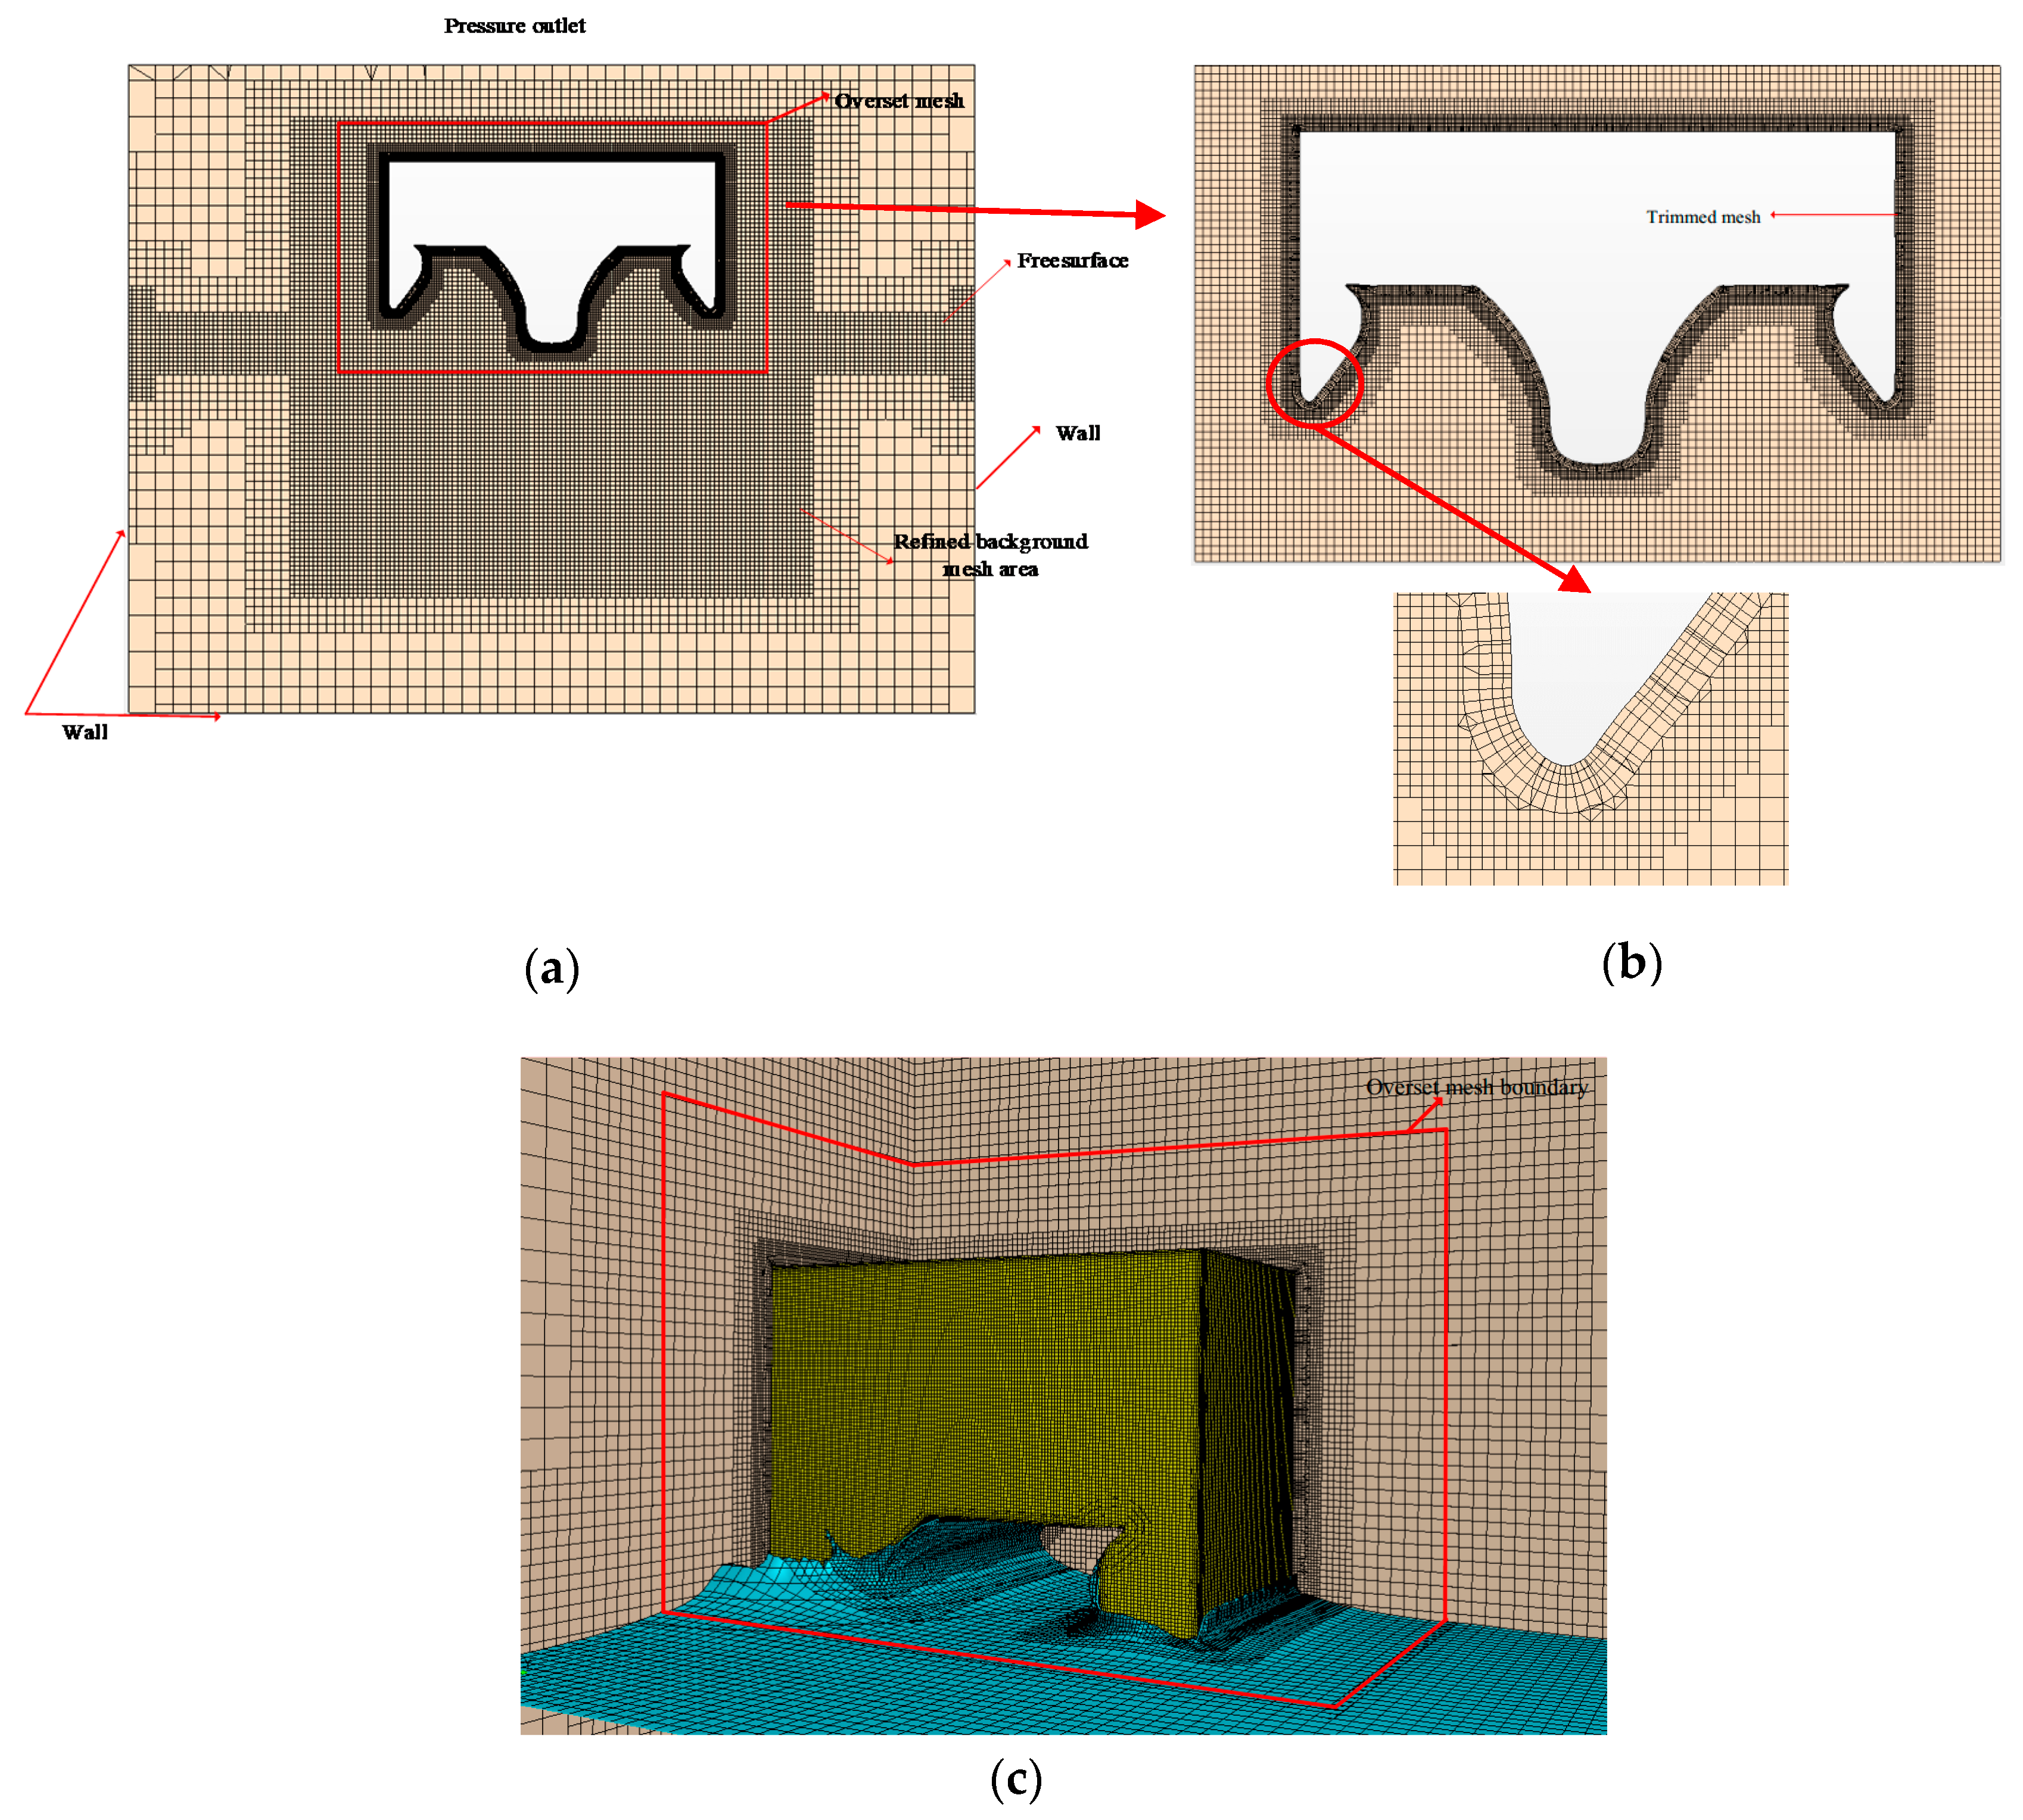
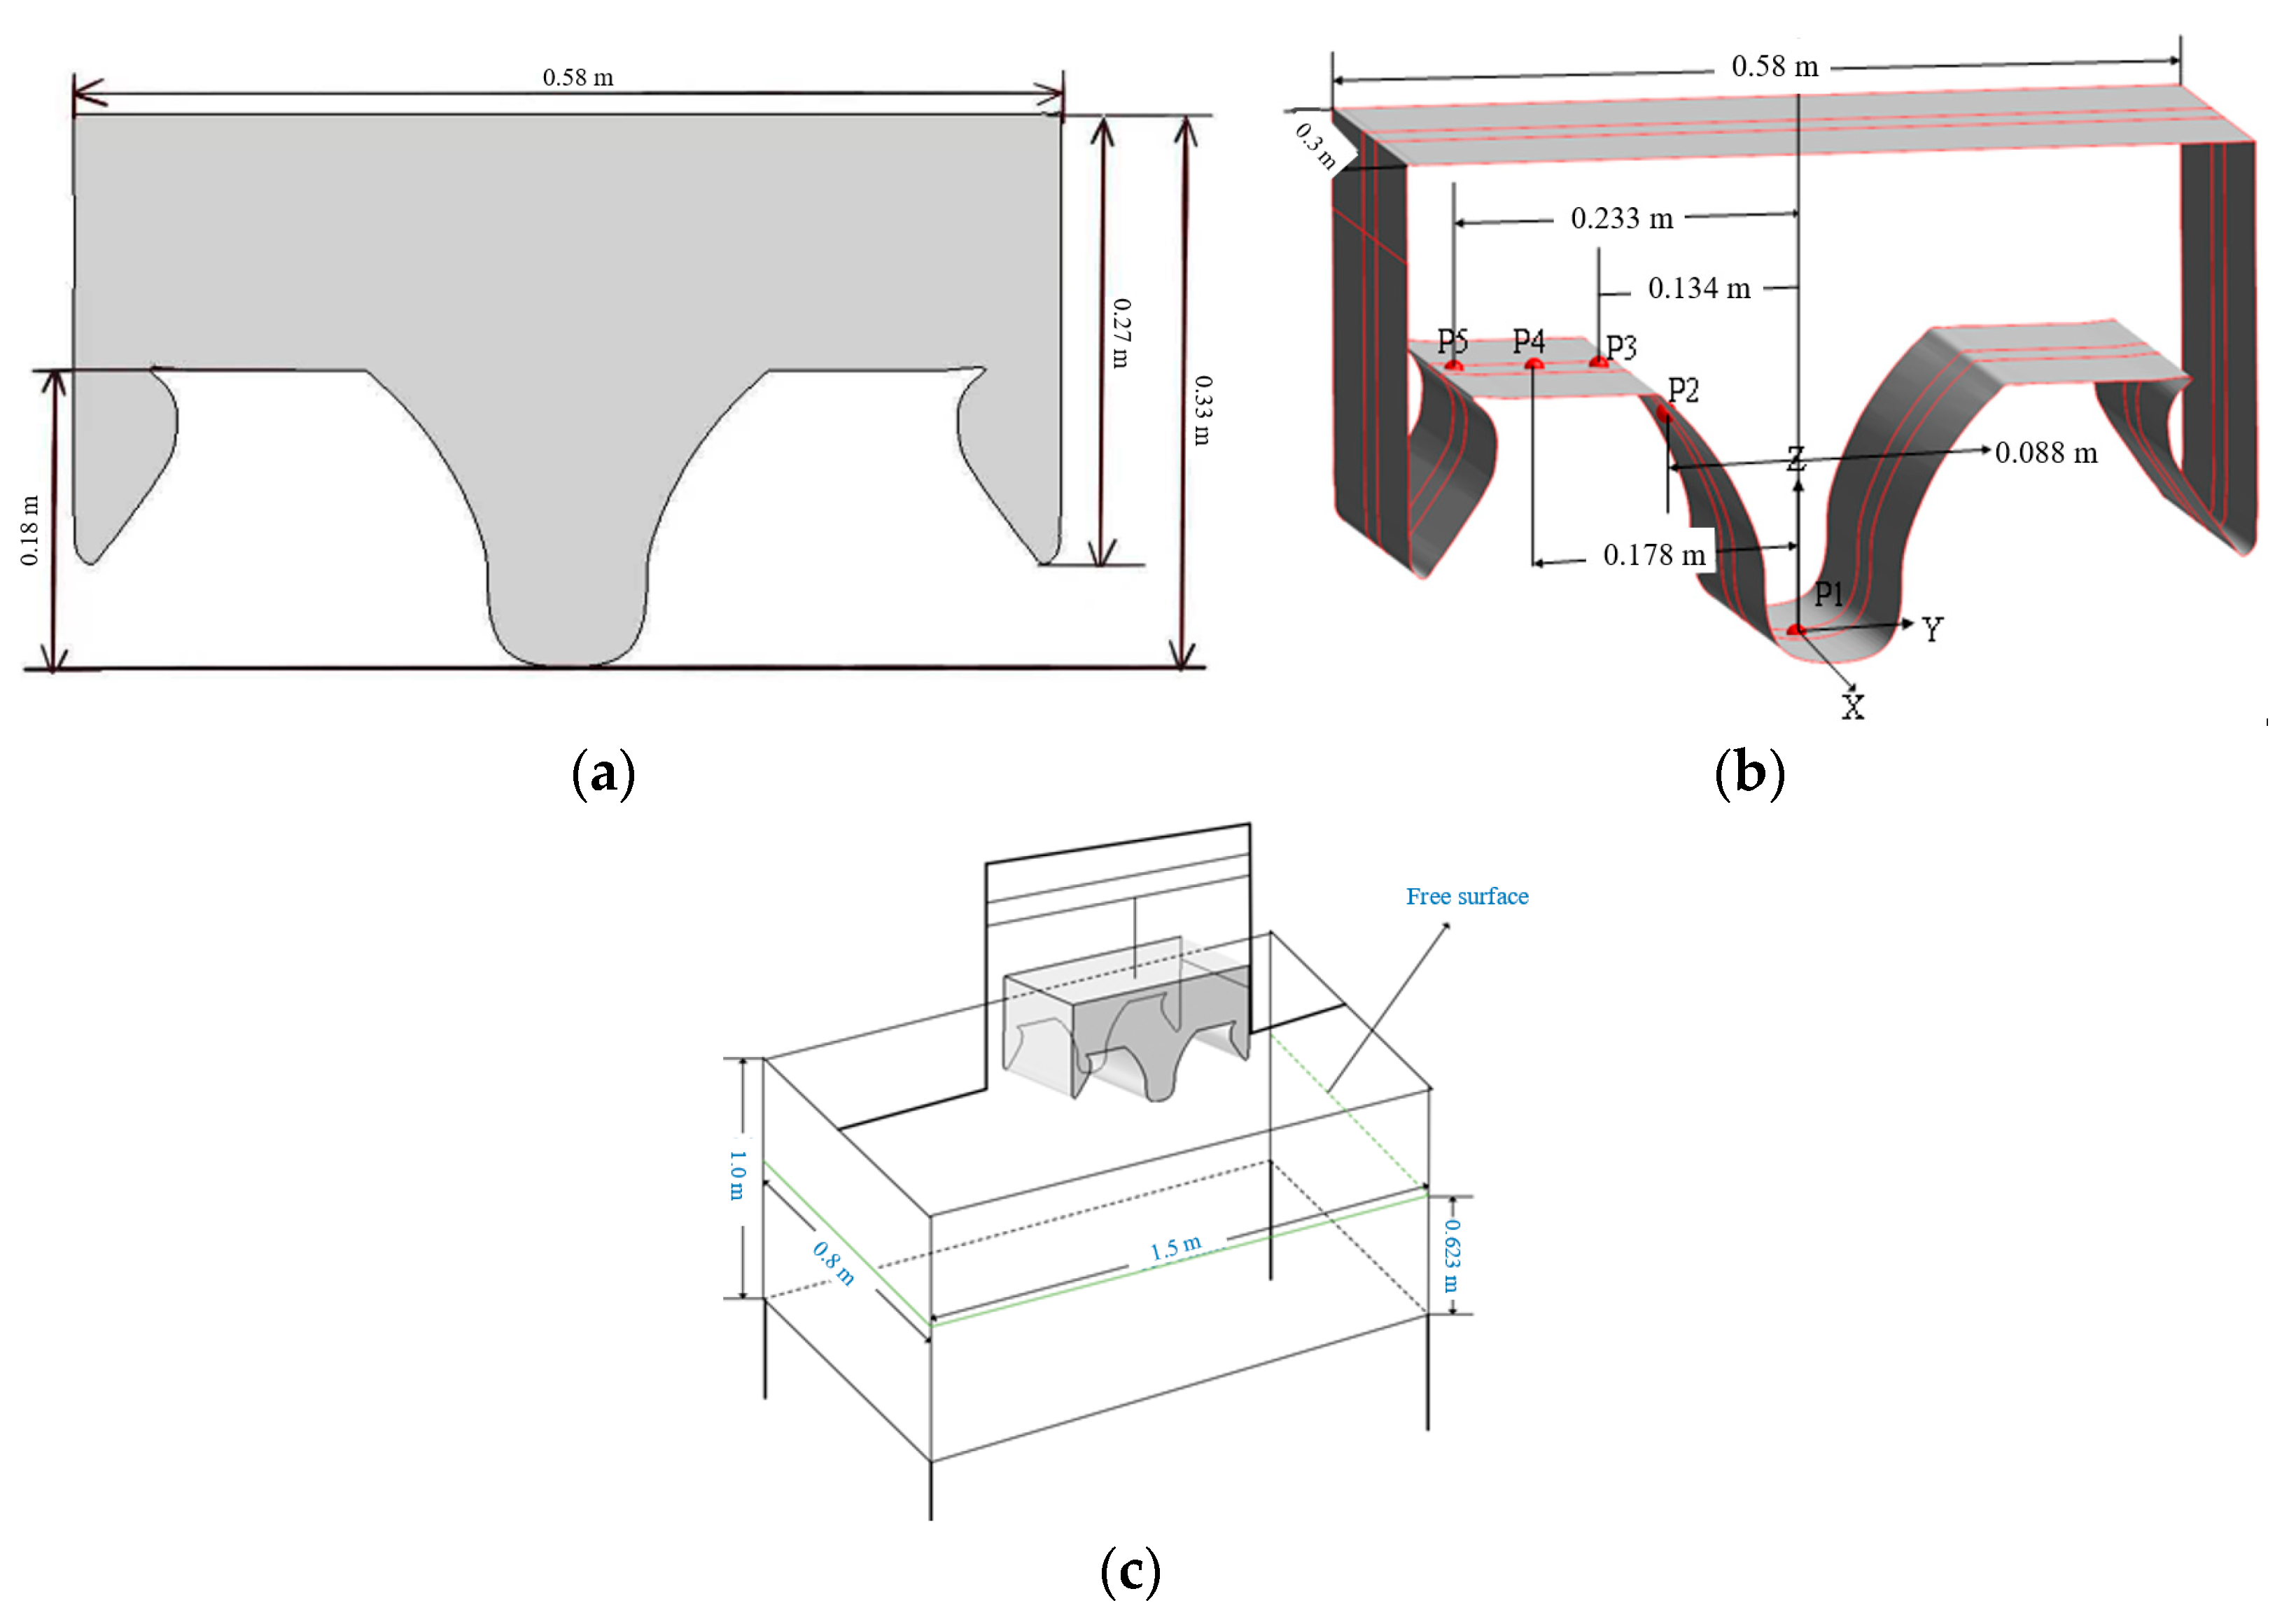
2.1. Numerical Model
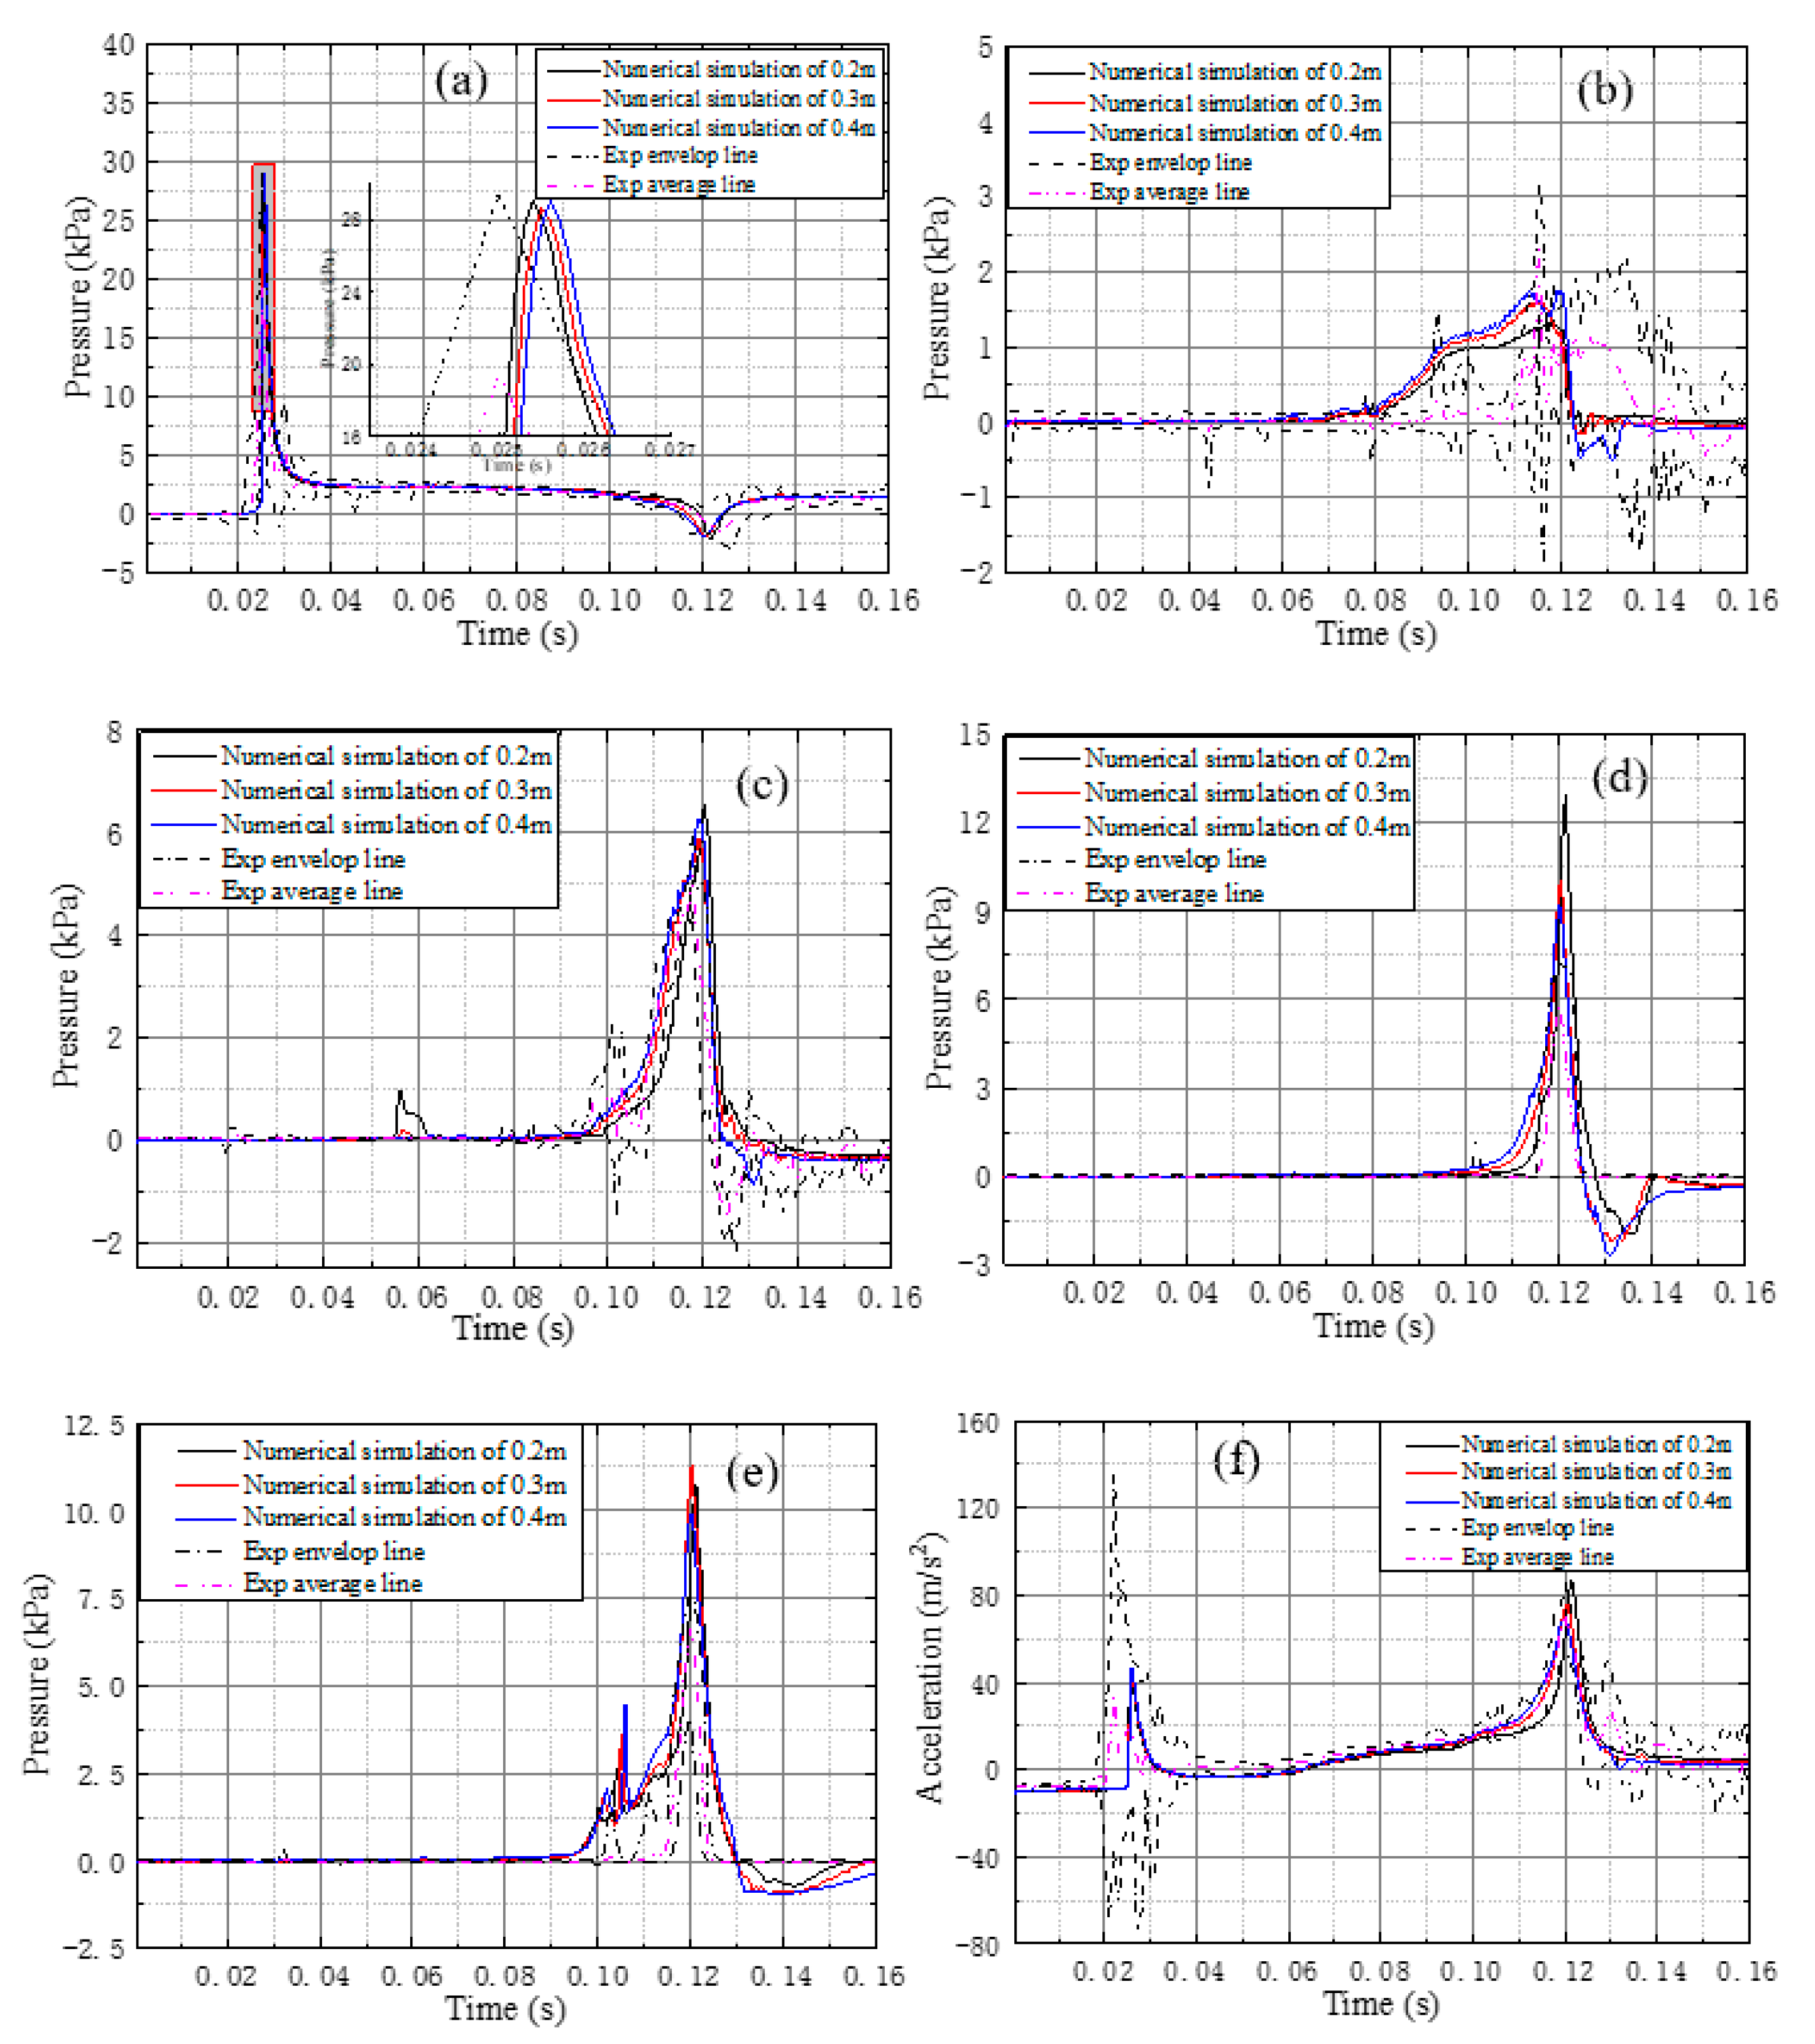
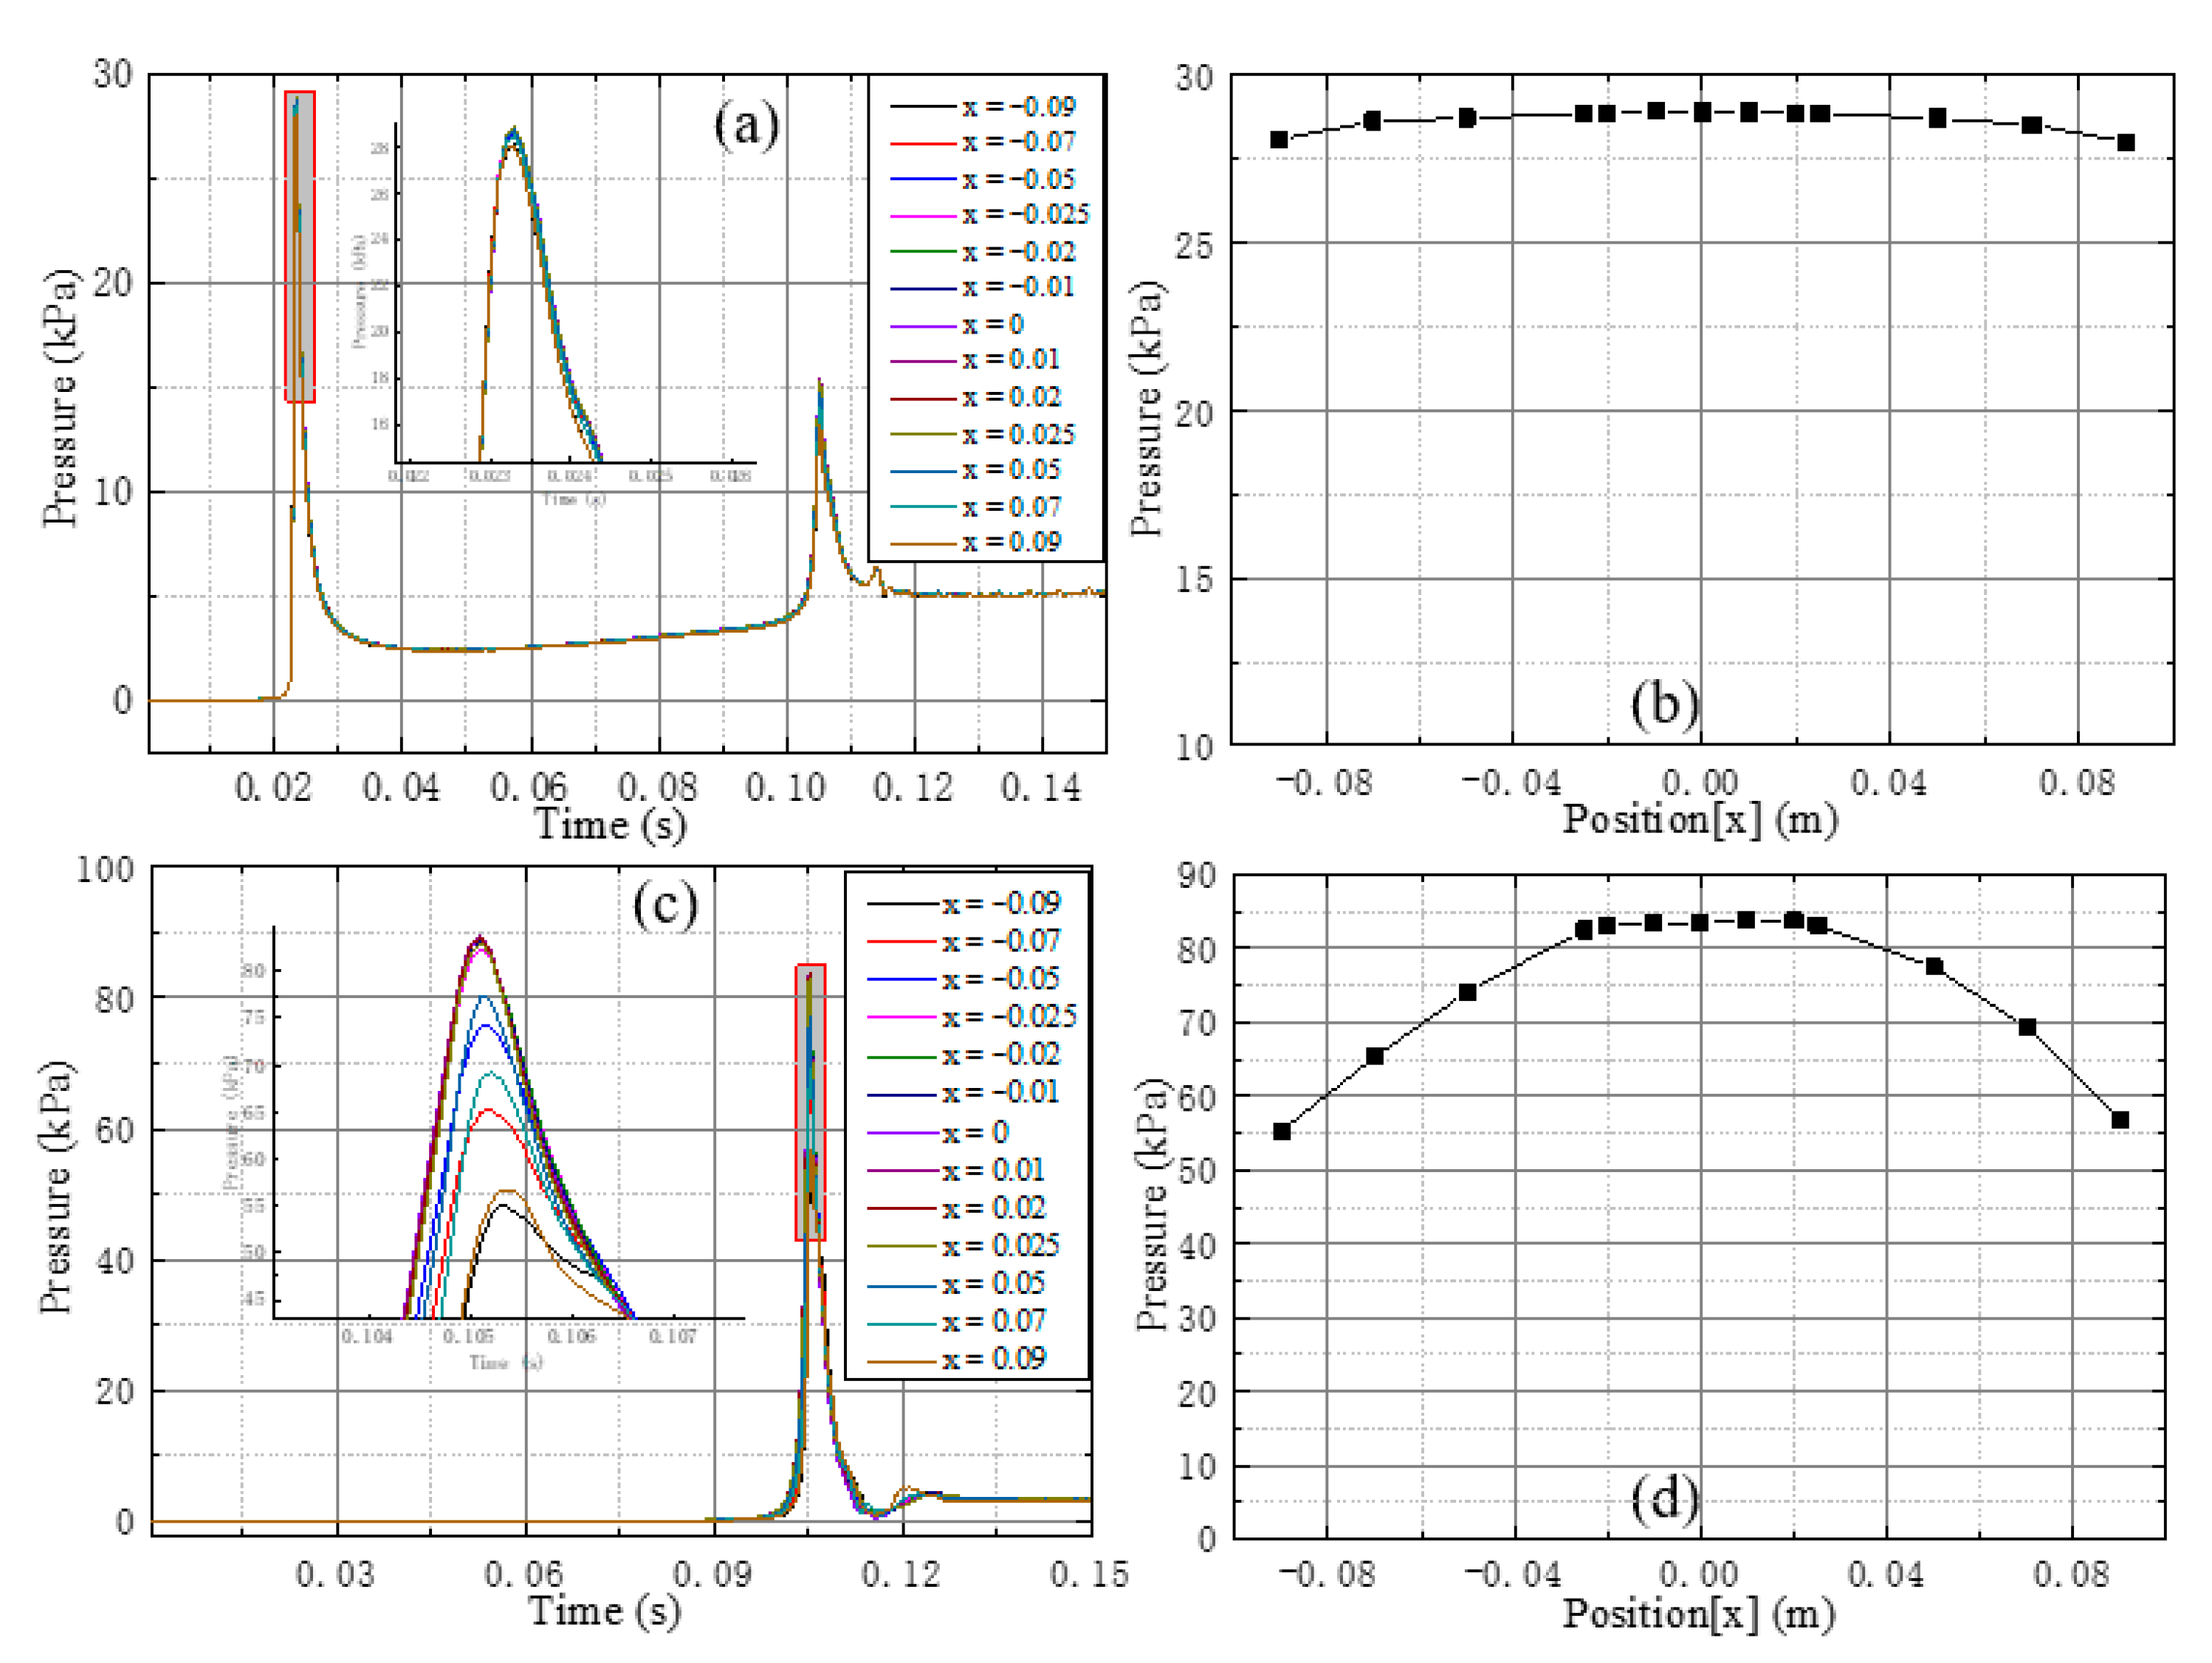
2.2. Two-Dimensionality Verification
3. Results and Discussion
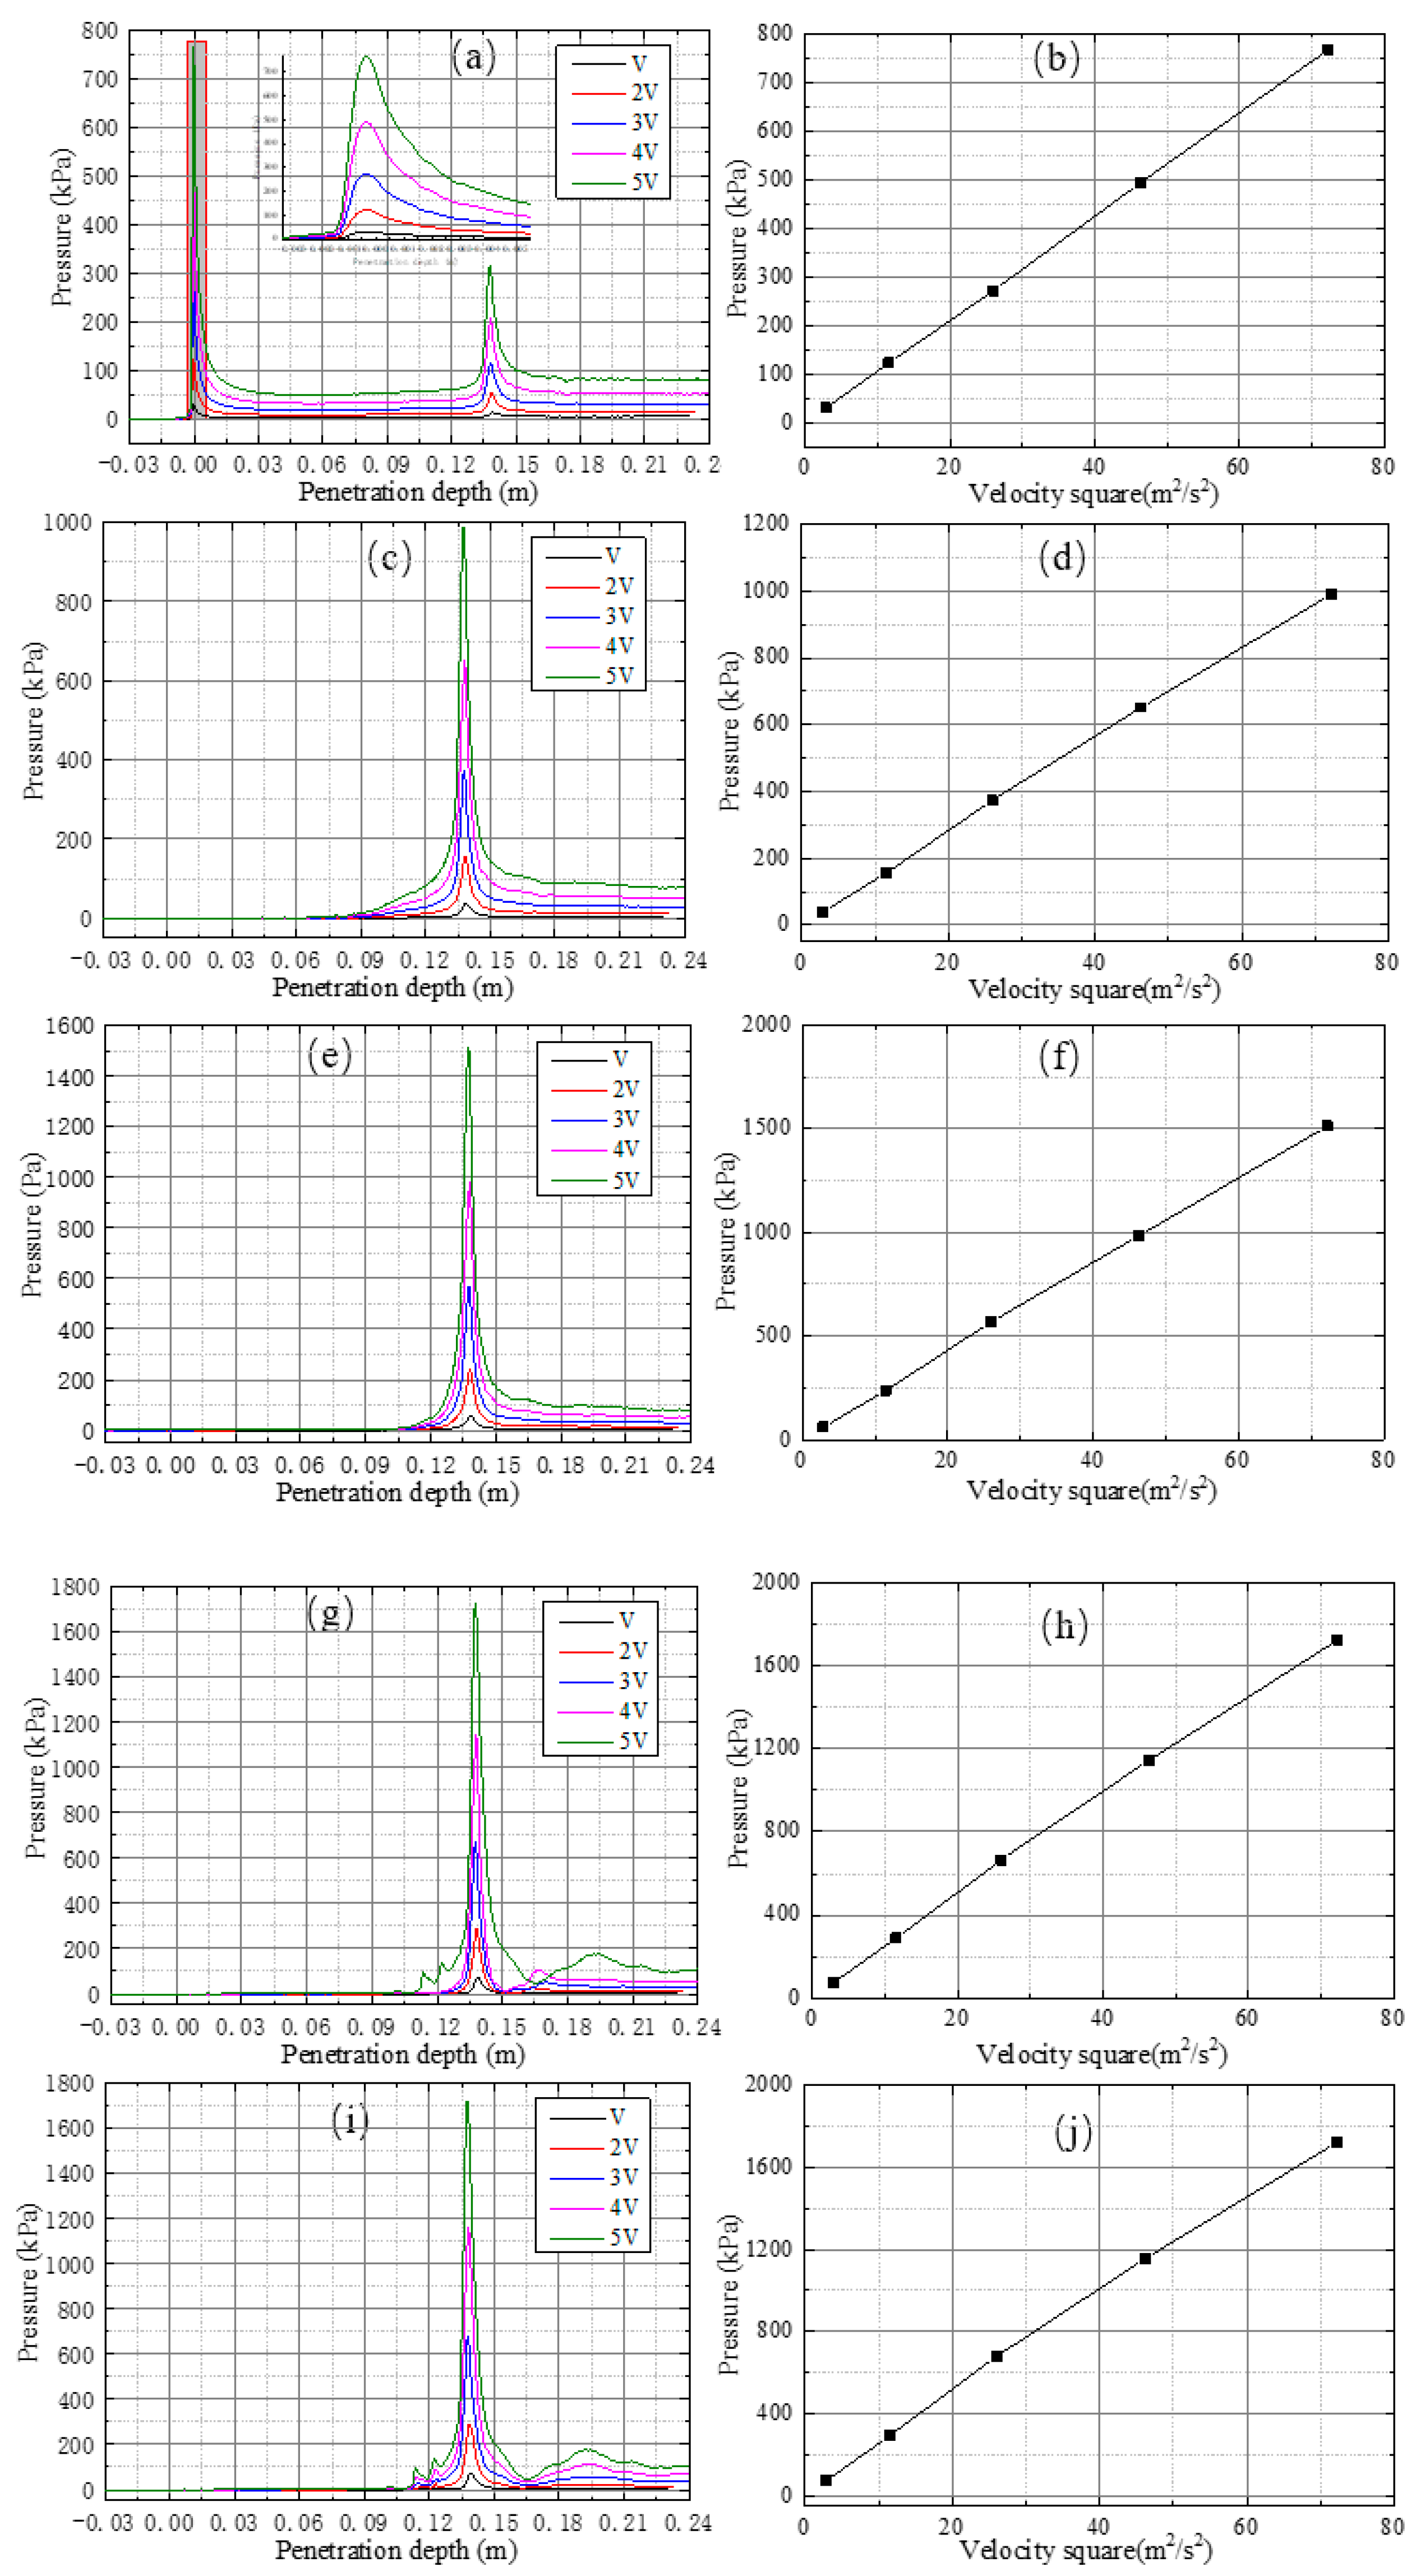
3.1. Simulation Parameters
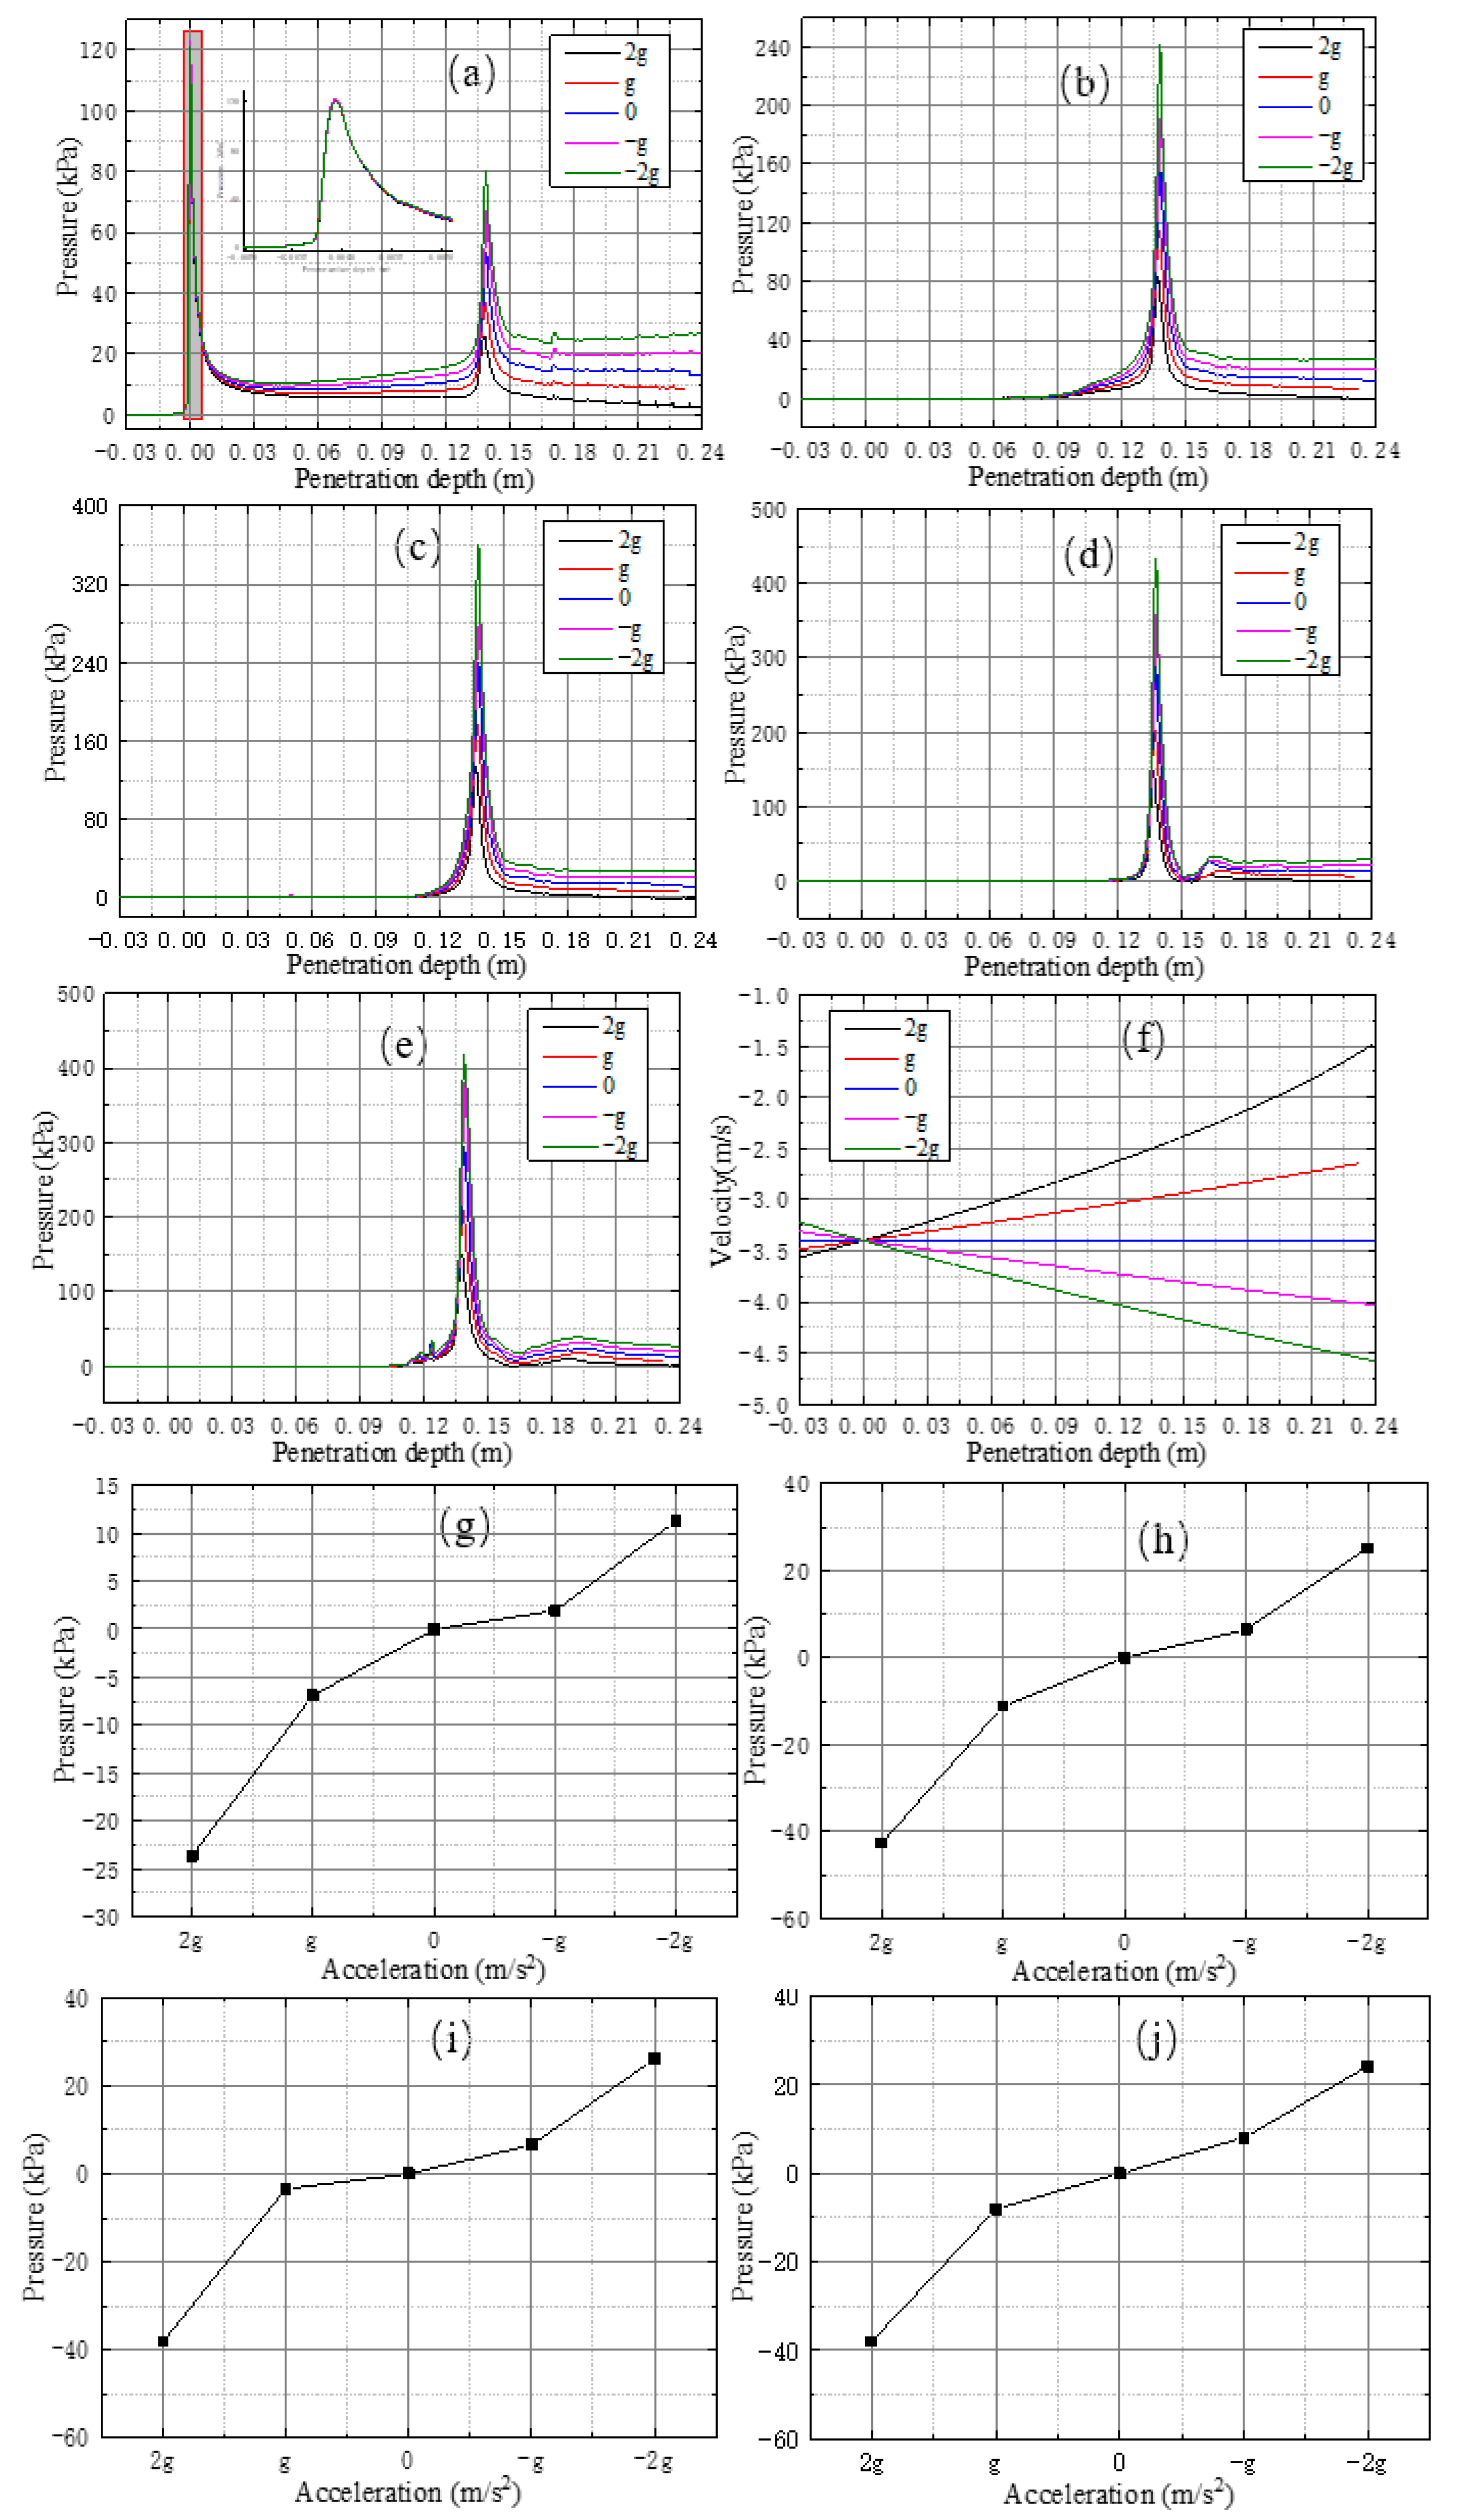
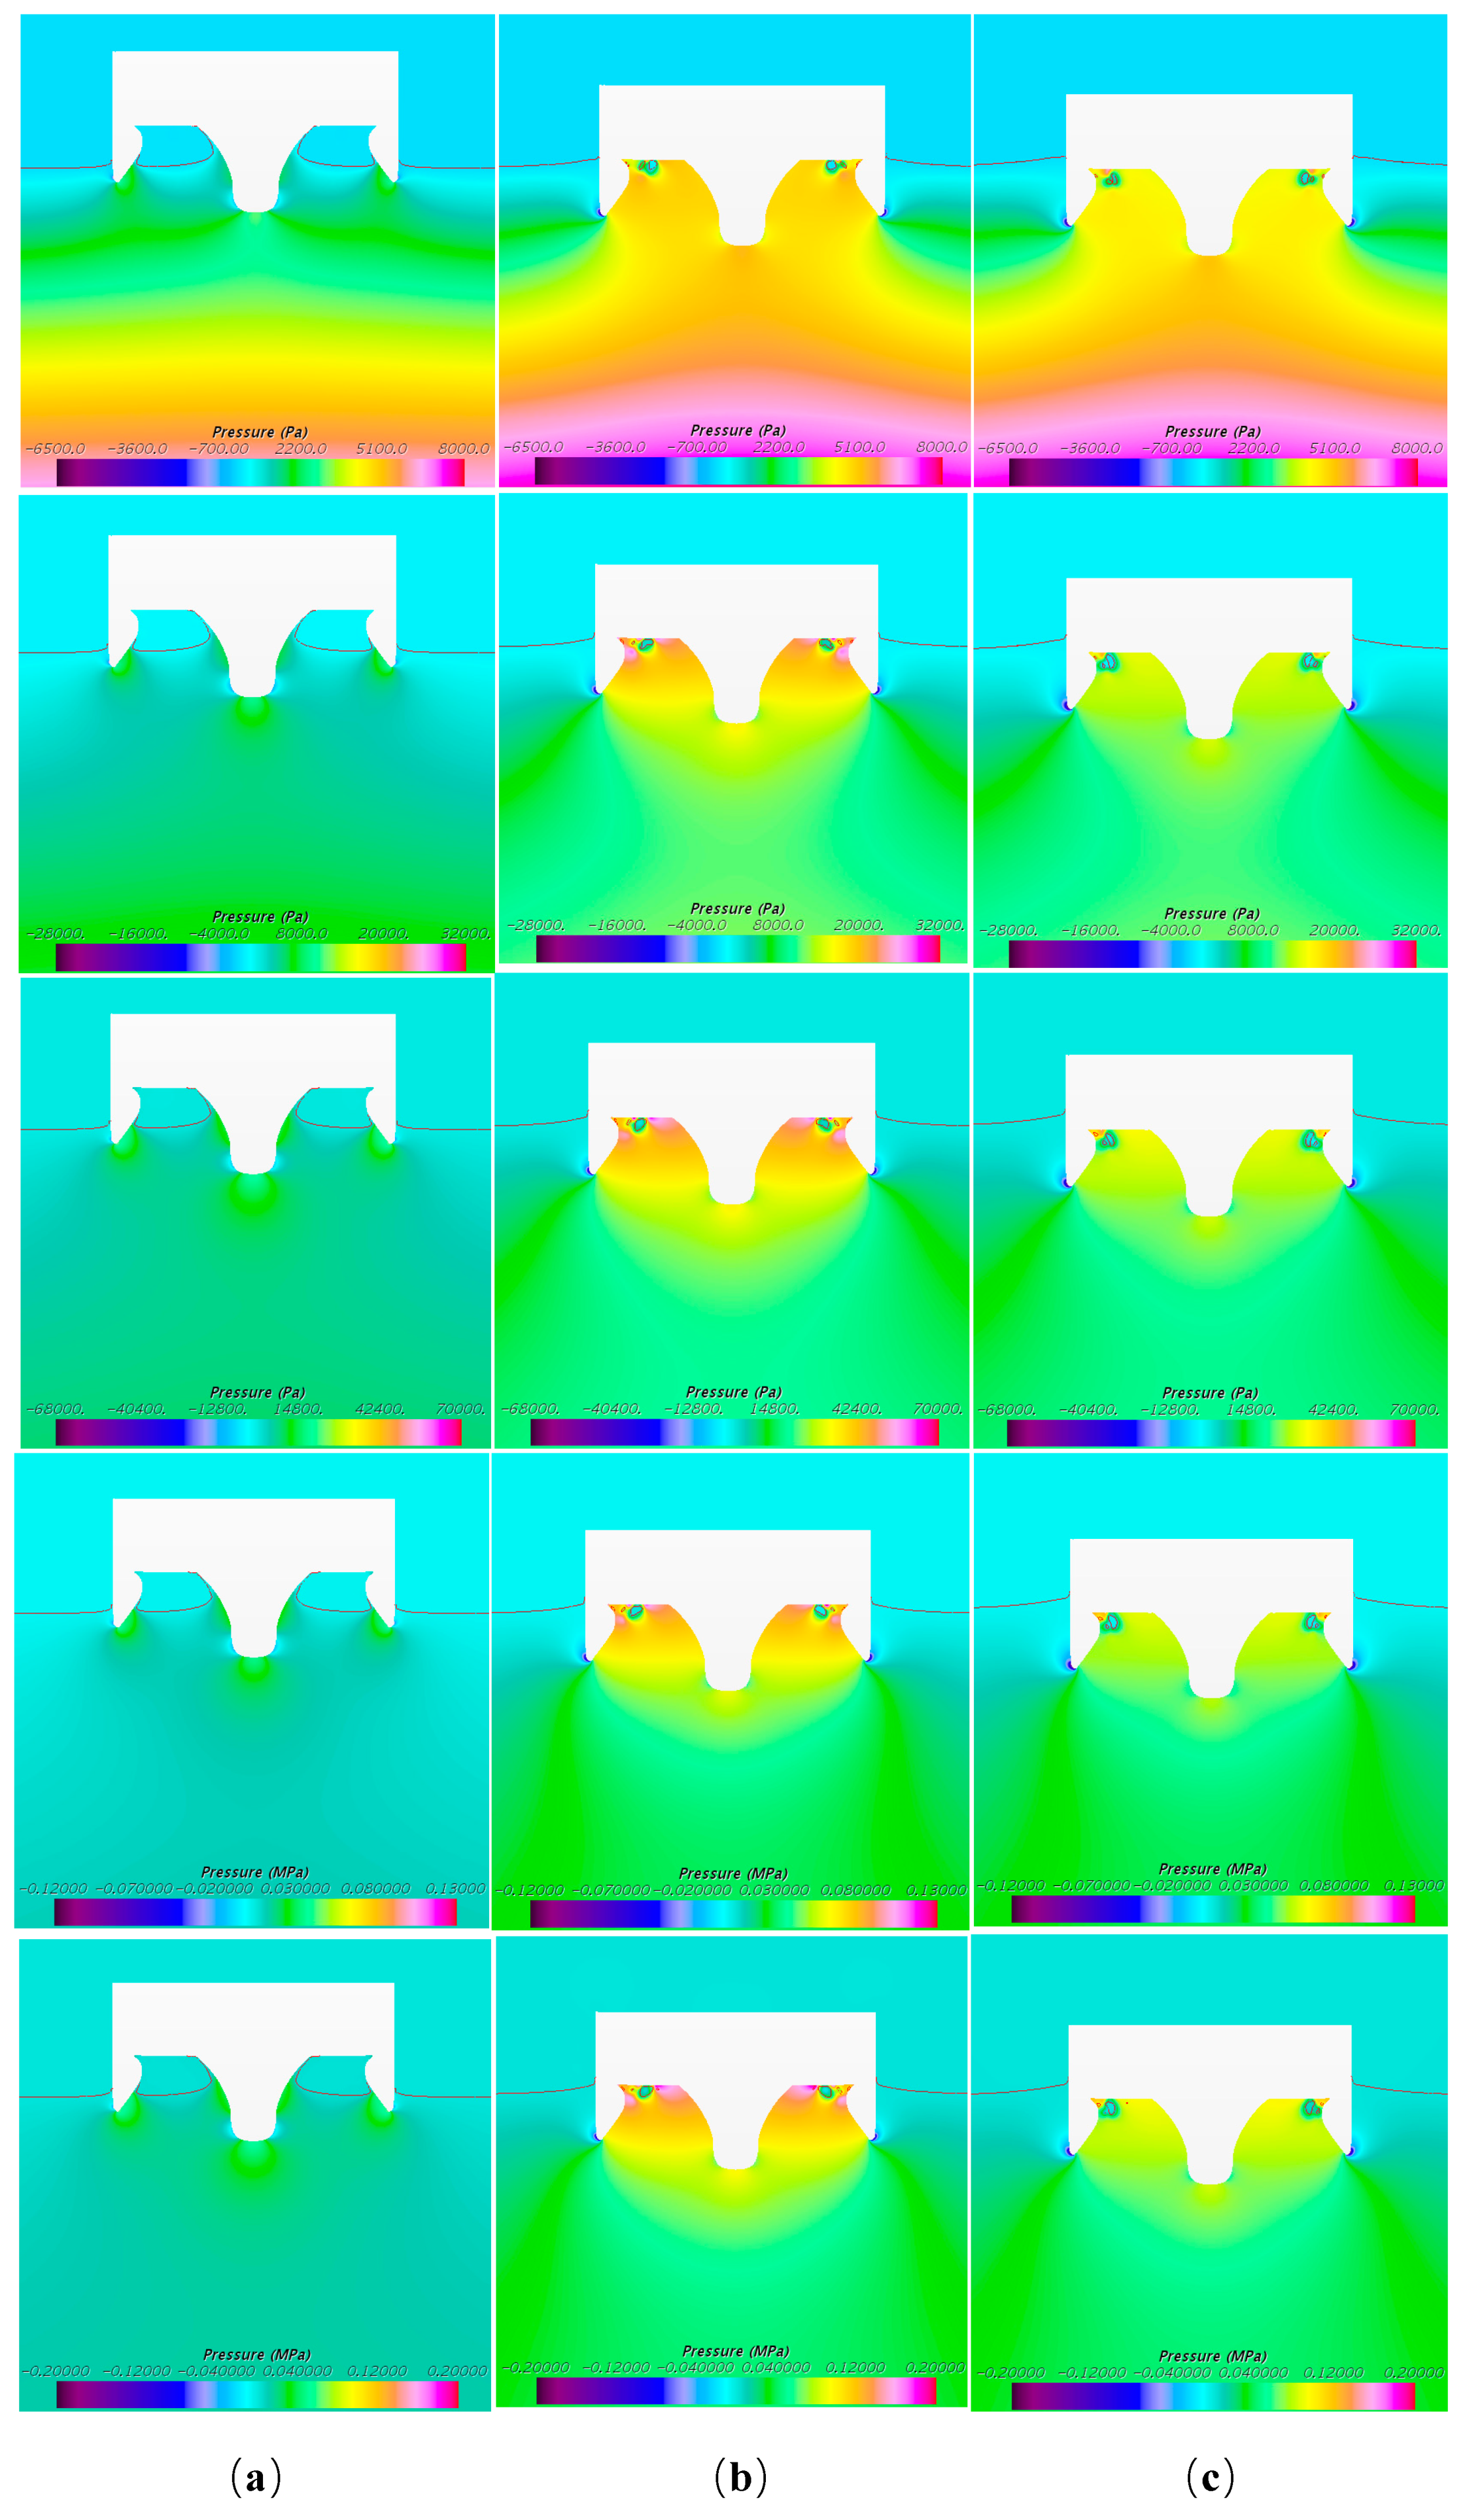
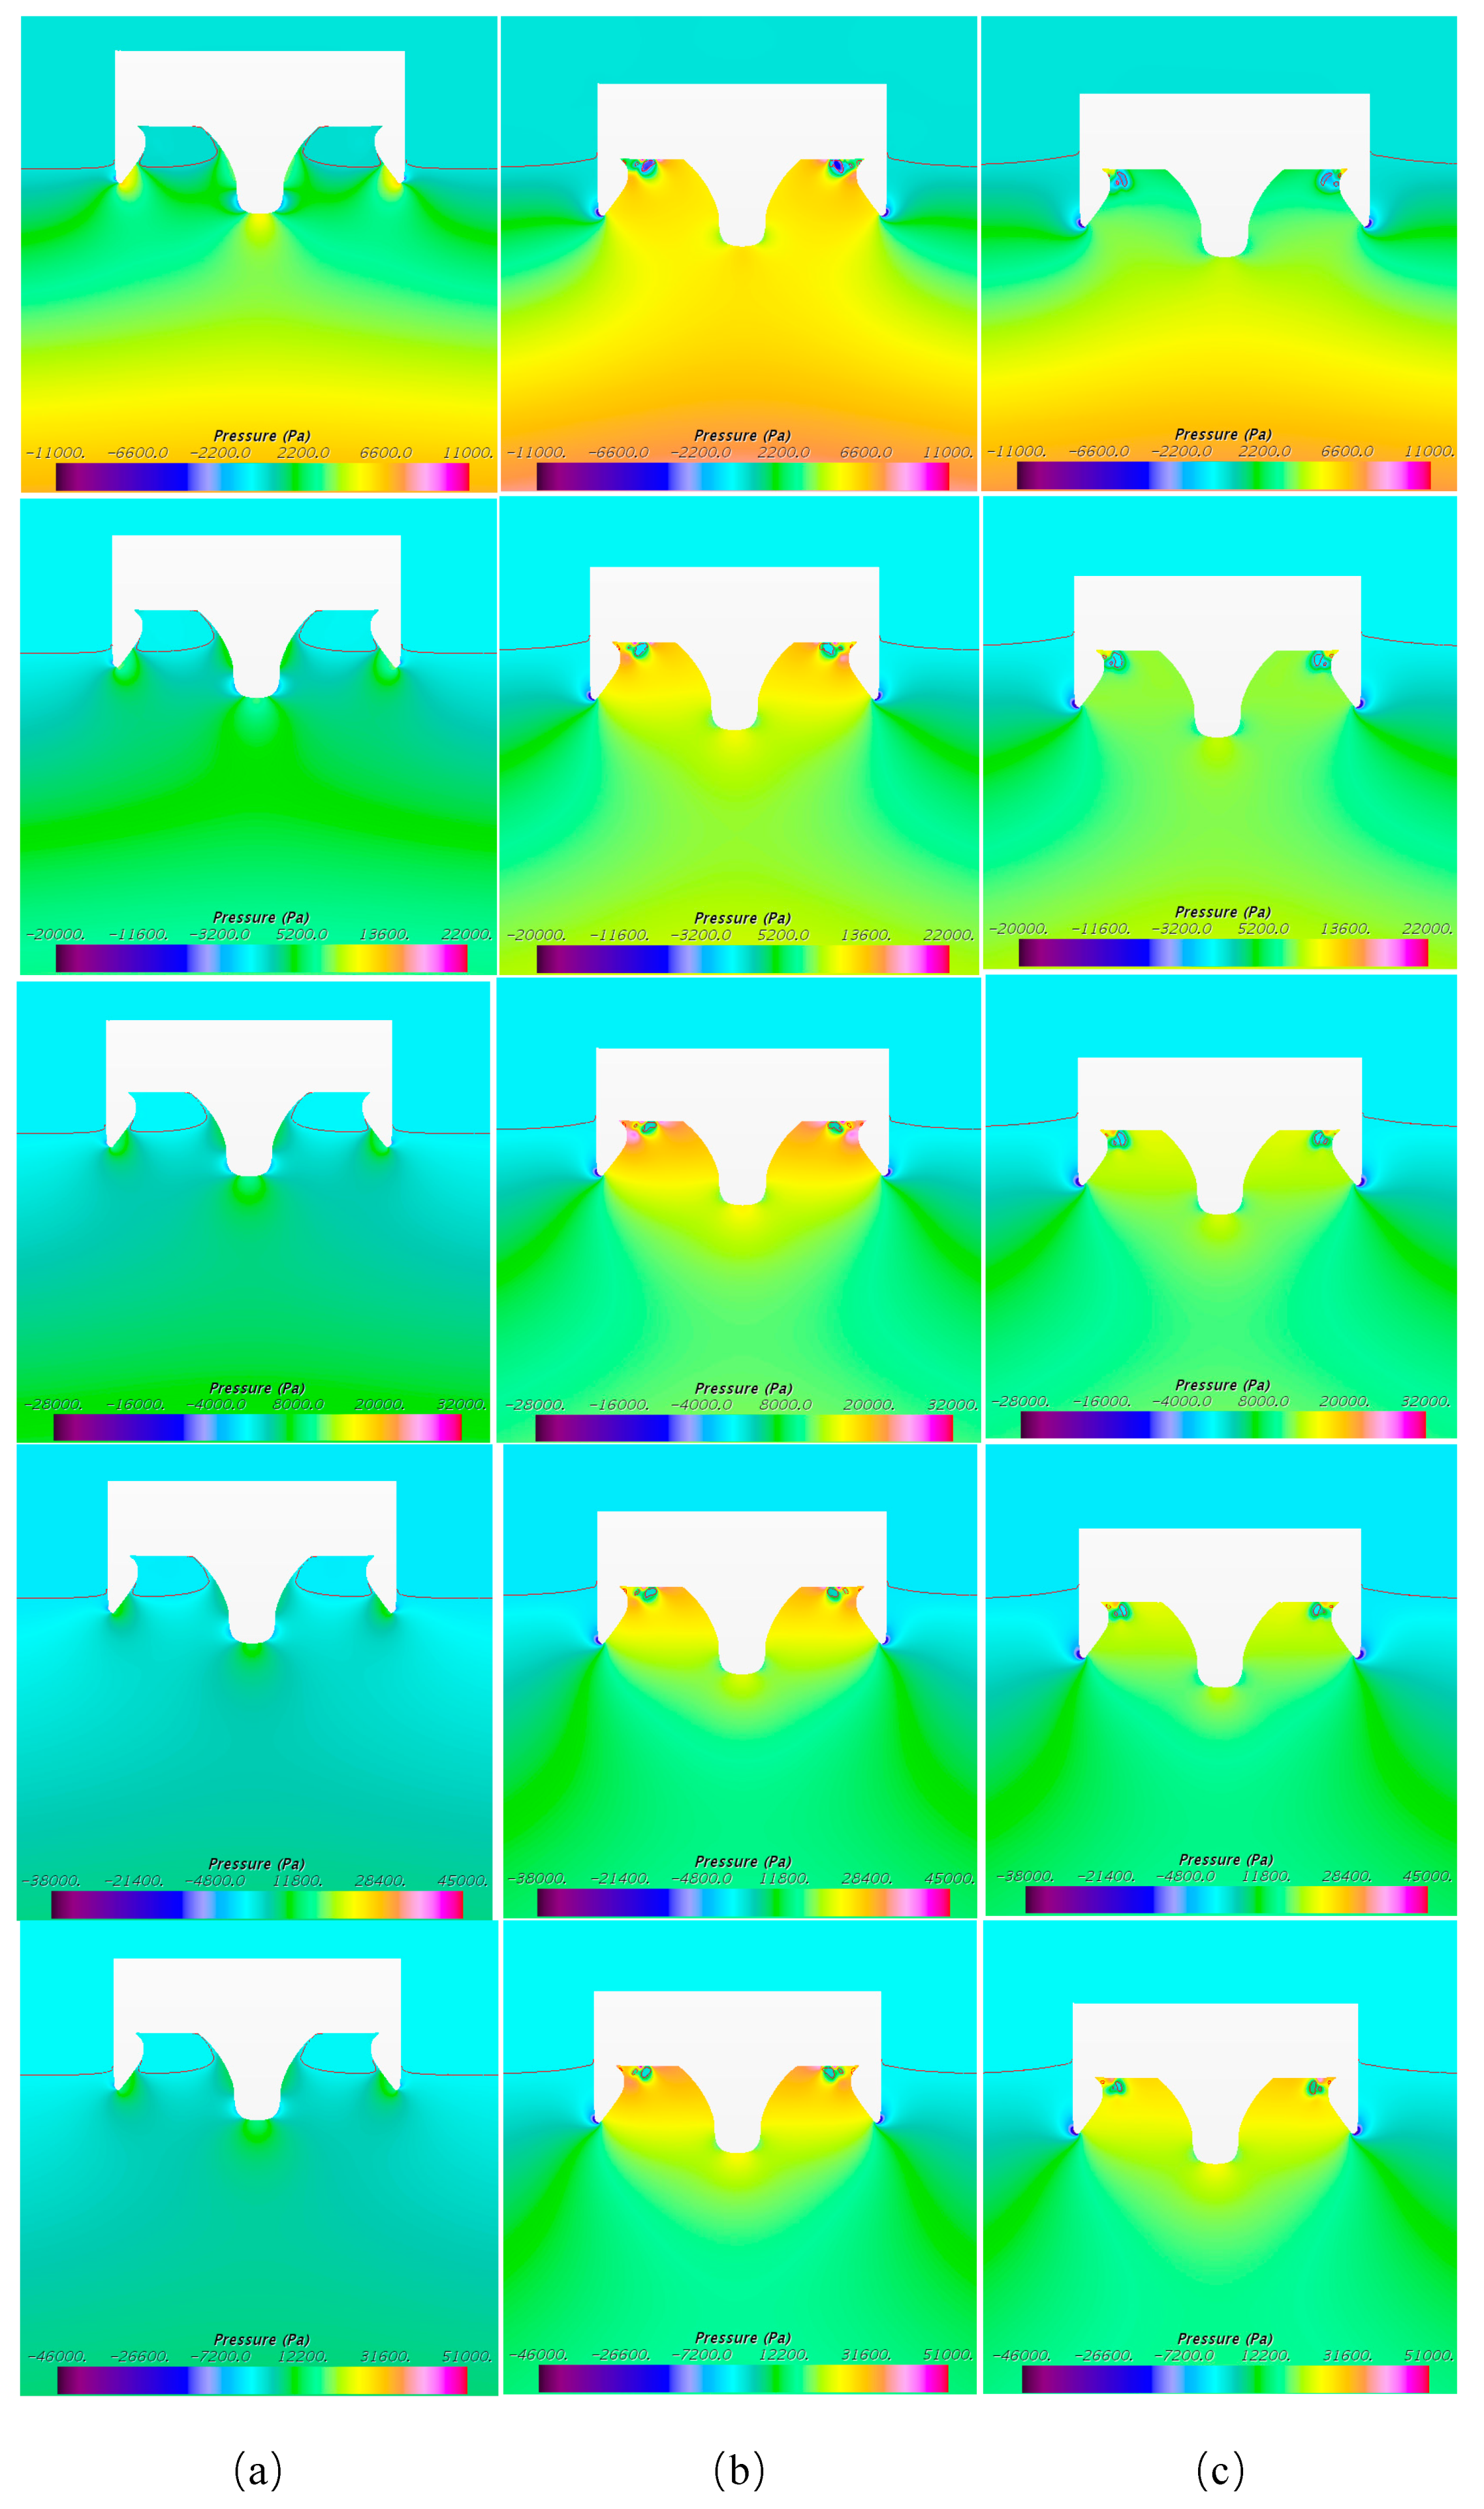
3.2. Pressure Analysis
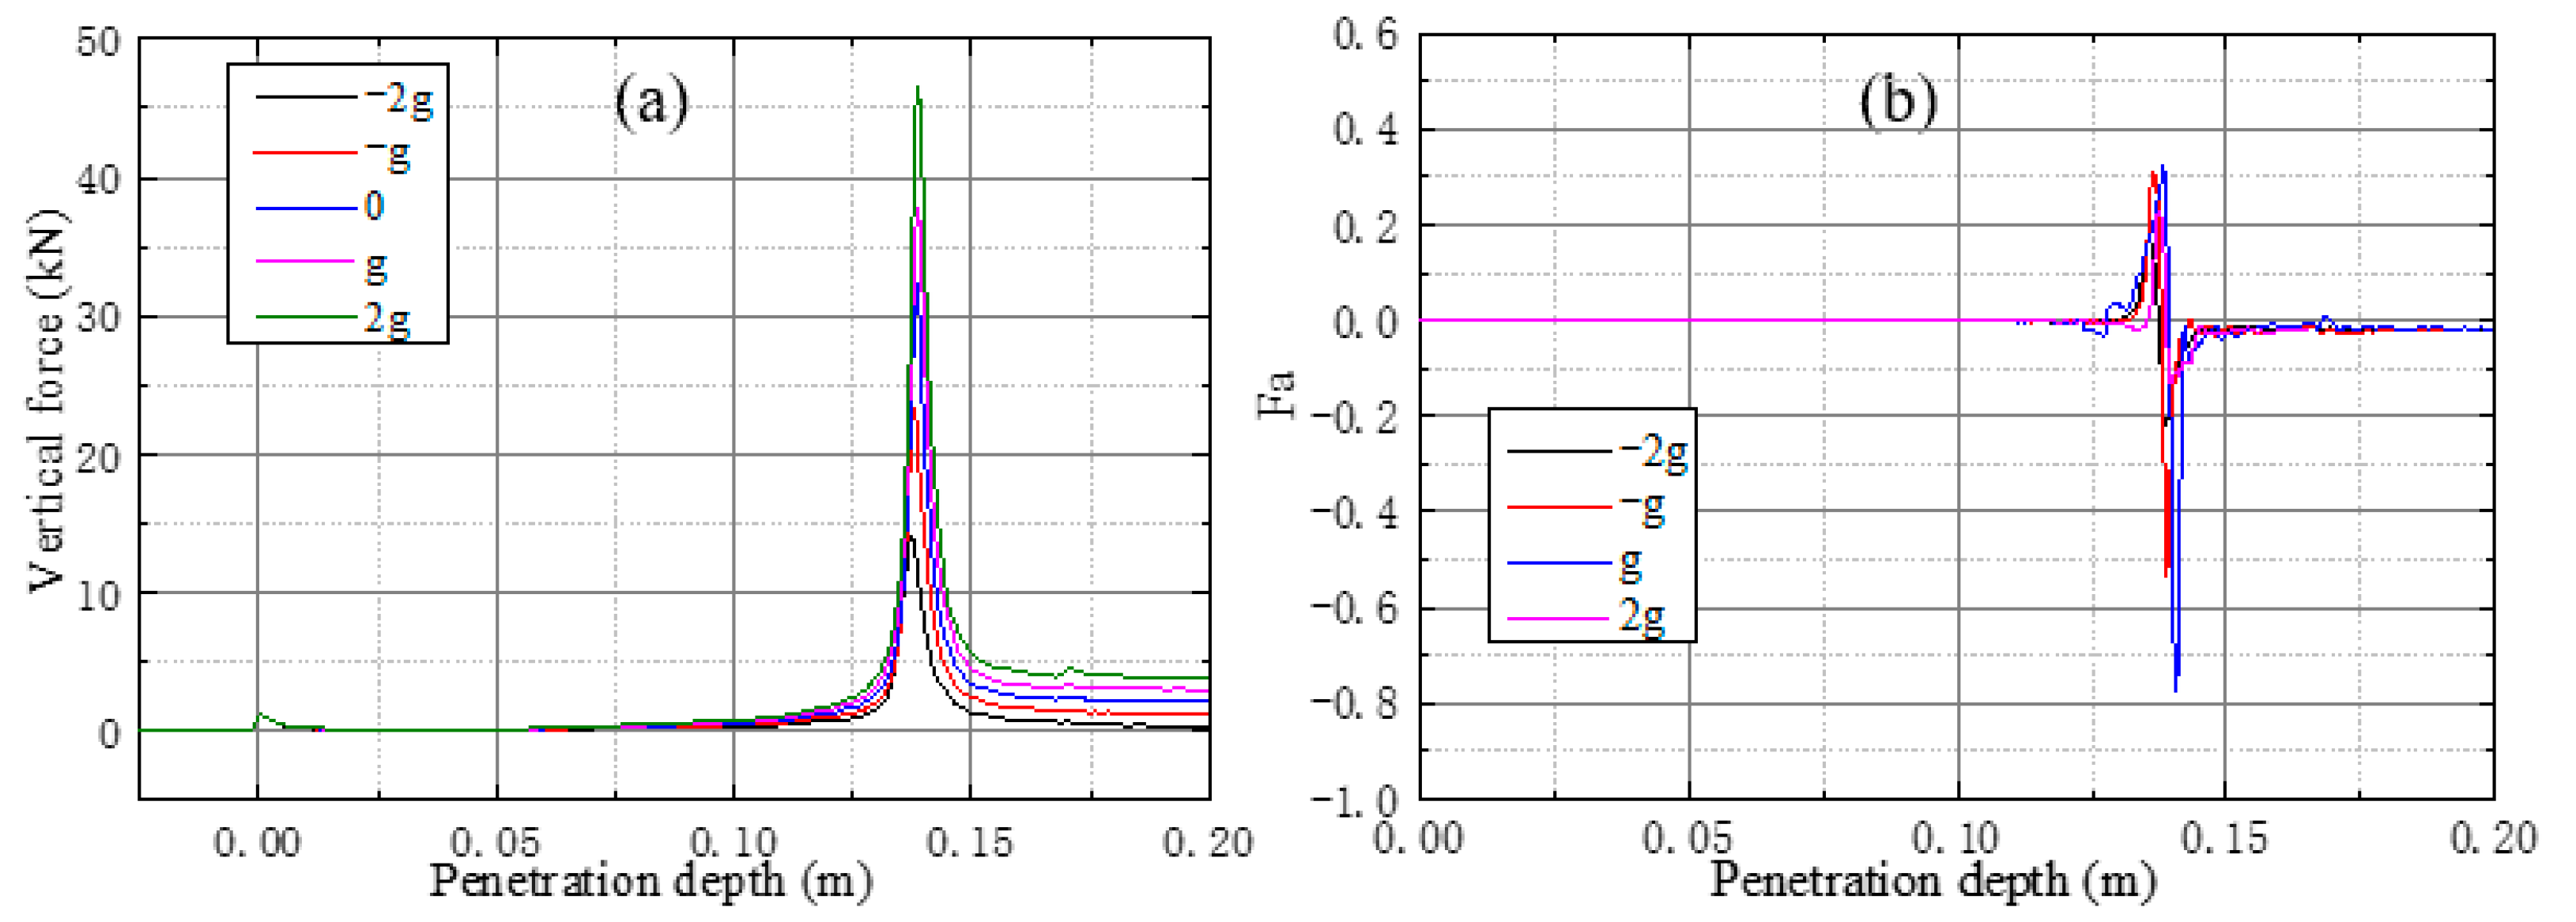
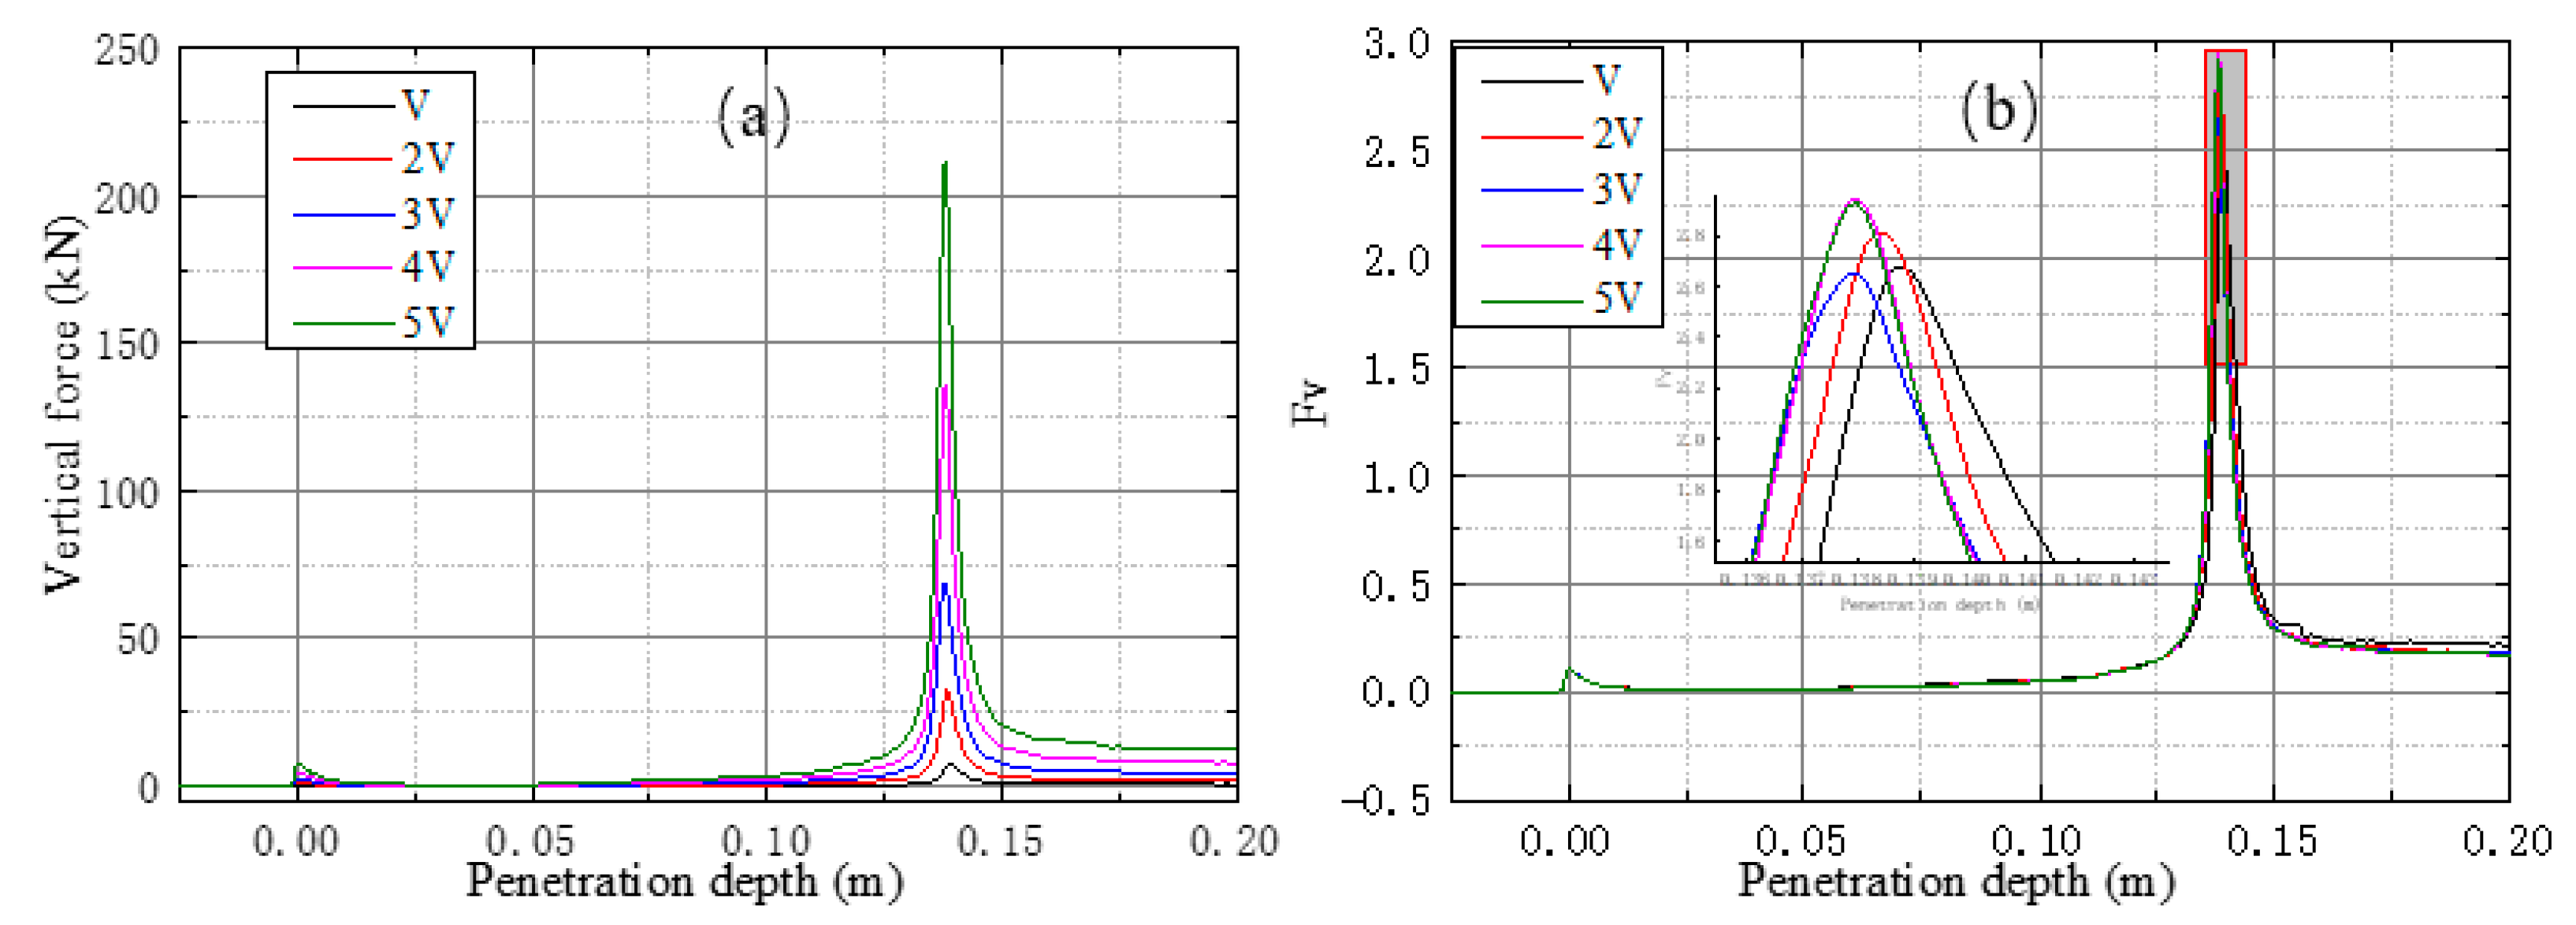
3.3. Force Analysis
4. Conclusions
Author Contributions
Funding
Institutional Review Board Statement
Informed Consent Statement
Data Availability Statement
Conflicts of Interest
References
- Dias, F.; Ghidaglia, J.M. Slamming: Recent Progress in the Evaluation of Impact Pressures. Annu. Rev. Fluid Mech. 2018, 50, 243–273. [Google Scholar] [CrossRef]
- Sun, Z.; Jang, Y.C.; Zong, Z.; Xing, J.T.; Djidjeli, K. Slamming load on trimaran cross section with rigid and flexible arches. Mar. Struct. 2019, 66, 227–241. [Google Scholar] [CrossRef]
- Wagner, H. Phenomena Associated With Impacts And Sliding on Liquid Surfaces. Z. Angew. Math. Mech. 1932, 12, 193–215. [Google Scholar] [CrossRef]
- Lavroff, J.; Davis, M.R.; Holloway, D.S.; Thomas, G.A.; McVicar, J.J. Wave impact loads on wave-piercing catamarans. Ocean Eng. 2017, 131, 263–271. [Google Scholar] [CrossRef]
- Jacobi, G.; Thomas, G.; Davis, M. An insight into the slamming behaviour of large high-speed catamarans through full-scale measurements. J. Mar. Sci. Technol. 2014, 19, 15–32. [Google Scholar] [CrossRef]
- Yu, H.; Li, Z.J.; Hu, J.J. Slamming Load Forecasts and Analyses of a Trimaran Model Test. J. Ship Mech. 2014, 18, 623–634. [Google Scholar]
- Davis, M.R.; French, B.J.; Thomas, G.A. Wave slam on wave piercing catamarans in random head seas. Ocean Eng. 2017, 135, 84–97. [Google Scholar] [CrossRef]
- Panciroli, R.; Abrate, S.; Minak, G.; Zucchelli, A. Hydroelasticity in water-entry problems: Comparison between experimental and SPH results. Compos. Struct. 2012, 94, 532–539. [Google Scholar] [CrossRef]
- Iranmanesh, A.; Passandideh-Fard, M. A three-dimensional numerical approach on water entry of a horizontal circular cylinder using the volume of fluid technique. Ocean Eng. 2017, 130, 557–566. [Google Scholar] [CrossRef]
- Nair, V.V.; Bhattacharyya, S.K. Water entry and exit of axisymmetric bodies by CFD approach. J. Ocean Eng. Sci. 2018, 3, 156–174. [Google Scholar] [CrossRef]
- McVicar, J.; Lavroff, J.; Davis, M.R.; Thomas, G. Fluid–structure interaction simulation of slam-induced bending in large high-speed wave-piercing catamarans. J. Fluids Struct. 2018, 82, 35–58. [Google Scholar] [CrossRef]
- Chen, Z.Y.; Gui, H.B.; Dong, P.S.; Yu, C.L. Numerical and experimental analysis of hydroelastic responses of a high-speed trimaran in oblique irregular waves. Int. J. Nav. Archit. Ocean Eng. 2019, 11, 409–421. [Google Scholar] [CrossRef]
- Bilandi, R.N.; Jamei, S.; Roshan, F.; Azizi, M. Numerical simulation of vertical water impact of asymmetric wedges by using a finite volume method combined with a volume-of-fluid technique. Ocean Eng. 2018, 160, 119–131. [Google Scholar] [CrossRef]
- Krastev, V.K.; Facci, A.L.; Ubertini, S. Asymmetric water impact of a two dimensional wedge: A systematic numerical study with transition to ventilating flow conditions. Ocean Eng. 2018, 147, 386–398. [Google Scholar] [CrossRef]
- Hu, Z.; Zhao, X.Z.; Li, M.Y.; Fang, Z.H.; Sun, Z.L. A numerical study of water entry of asymmetric wedges using a CIP-based model. Ocean Eng. 2018, 148, 1–16. [Google Scholar] [CrossRef]
- Sun, Z.; Deng, Y.Z.; Zou, L.; Jiang, Y.C. Investigation of trimaran slamming under different conditions. Appl. Ocean Res. 2020, 104, 102316. [Google Scholar] [CrossRef]
- Davis, M.R.; Whelan, J.R. Computation of wet deck bow slam loads for catamaran arched cross sections. Ocean Eng. 2007, 34, 2265–2276. [Google Scholar] [CrossRef]
- Korobkin, A.; Khabakhpasheva, T.; Malenica, S.; Kim, Y. A comparison study of water impact and water exit models. Int. J. Nav. Archit. Ocean Eng. 2014, 6, 1182–1196. [Google Scholar] [CrossRef]
- Korobkin, A. Analytical models of water impact. Eur. J. Appl. Math. 2004, 15, 821–838. [Google Scholar] [CrossRef]
- Seng, S. Slamming And Whipping Analysis Of Ships. DTU Mech. Eng. 2012, 196, 903–1685. [Google Scholar]


| Case | 1 | 2 | 3 | 4 | 5 |
| Velocity (m/s) | V | 2 V | 3 V | 4 V | 5 V |
| Case | 5 | 6 | 7 | 8 | 9 |
| Acceleration (m/s) | 2 g | g | 0 | −g | −2 g |
Publisher’s Note: MDPI stays neutral with regard to jurisdictional claims in published maps and institutional affiliations. |
© 2021 by the authors. Licensee MDPI, Basel, Switzerland. This article is an open access article distributed under the terms and conditions of the Creative Commons Attribution (CC BY) license (https://creativecommons.org/licenses/by/4.0/).
Share and Cite
Sun, Z.; Sui, X.; Deng, Y.; Zou, L.; Korobkin, A.; Xu, L.; Jiang, Y. Characteristics of Slamming Pressure and Force for Trimaran Hull. J. Mar. Sci. Eng. 2021, 9, 564. https://doi.org/10.3390/jmse9060564
Sun Z, Sui X, Deng Y, Zou L, Korobkin A, Xu L, Jiang Y. Characteristics of Slamming Pressure and Force for Trimaran Hull. Journal of Marine Science and Engineering. 2021; 9(6):564. https://doi.org/10.3390/jmse9060564
Chicago/Turabian StyleSun, Zhe, Xupeng Sui, Yanzeng Deng, Li Zou, A. Korobkin, Lixin Xu, and Yichen Jiang. 2021. "Characteristics of Slamming Pressure and Force for Trimaran Hull" Journal of Marine Science and Engineering 9, no. 6: 564. https://doi.org/10.3390/jmse9060564
APA StyleSun, Z., Sui, X., Deng, Y., Zou, L., Korobkin, A., Xu, L., & Jiang, Y. (2021). Characteristics of Slamming Pressure and Force for Trimaran Hull. Journal of Marine Science and Engineering, 9(6), 564. https://doi.org/10.3390/jmse9060564