Article

The Role of Beach Morphology and Mid-Century Climate Change Effects on Wave Runup and Storm Impact on the Northern Yucatan Coast

by
Gabriela Medellín
1,*,
Martí Mayor
1,2,
Christian M. Appendini
1,
Ruth Cerezo-Mota
1 and
José A. Jiménez
3
1
Laboratorio de Ingeniería y Procesos Costeros, Instituto de Ingeniería, Universidad Nacional Autónoma de México, Sisal 97356, Mexico
2
Universitat de Barcelona, 08028 Barcelona, Spain
3
Universitat Politècnica de Catalunya, 08034 Barcelona, Spain
*
Author to whom correspondence should be addressed.
J. Mar. Sci. Eng. 2021, 9(5), 518; https://doi.org/10.3390/jmse9050518
Submission received: 17 April 2021 / Revised: 5 May 2021 / Accepted: 6 May 2021 / Published: 11 May 2021
(This article belongs to the Section Coastal Engineering)

Abstract

:
Wave runup is a relevant parameter to determine the storm impact on barrier islands. Here, the role of the beach morphology on wave runup and storm impact was investigated at four coastal communities located on the northern Yucatan coast. Current wave conditions based on regional wind simulations, topo-bathymetric transects measured at each location, and a nonlinear wave transformation model were employed to reconstruct multi-year runup time series. Dune morphology features and extreme water levels (excluding storm surge contributions) were further employed to determine the storm impact at each site for different return periods. Despite the similar offshore conditions along the coast, extreme water levels (i.e., runup and setup) showed intersite differences that were mainly ascribed to subaerial and submerged morphological features. Numerical results showed that the average surf zone beach slope, sandbars, berm, and dune elevation played an important role in controlling extreme water levels and storm impact at the study sites under the present climate. Moreover, in order to assess the potential effect of climate change on coastal flooding, we analyzed wave runup and storm impact in the best-preserved site by considering wave conditions and sea level rise (SLR) projections under the RCP 8.5 scenario. Modelling results suggest no significant increase in the storm impact regime between the present and future conditions in the study area unless SLR is considered. It was found that to accurately estimate SLR contribution, it should be incorporated into mean sea level prior to performing numerical wave runup simulations, rather than simply adding it to the resulting wave-induced water levels.

1. Introduction

Sea level rise and storm intensification, associated with climate change, will severely impact low-lying areas that are prone to coastal flooding [1]. The impact on coastal communities will be exacerbated due to both the expected coastal population growth [2] and the degradation of coastal ecosystems that naturally contribute to coastal protection by dissipation of the incoming wave energy [3].
Coastal flooding due to sea level rise estimations suggest that 630 M people occupy land below projected annual flood levels for 2100 under high (RCP 8.5) global carbon emissions [4]. This scenario might be underestimated since wind-driven waves also contribute to coastal sea level changes at different time scales (i.e., wave setup and wave runup) [5]. Melet et al. [6] found that wave setup can significantly contribute to the projected coastal sea level changes and must be included. However, studies assessing the effect of wind-driven waves are scarce. The understanding of the role of wind waves at a local to regional scale is limited but can be addressed with numerical models, remote sensing, and in situ measurements [5].
The total water level at the shoreline, which determines coastal flooding, is mainly composed of mean sea level, tide, storm surge, and wave runup [7]. Wave runup, defined as the instantaneous maximum water level elevation at the shoreline, is often divided on wave setup (increase in the mean water level due to wave breaking) and swash (fluctuations around the mean) [8]. Several approaches have been adopted in previous studies to estimate wave runup. Most of the existing studies have employed field observations to develop wave runup parameterizations as a function of beach and wave characteristics (e.g., [9]). These parameterizations are widely used to characterize the magnitude of runup for different coastal environments (e.g., [10,11,12]), although there is no universal parameterization valid for different beach morphology settings [13]. To overcome this, during the past decade, nonlinear wave transformation numerical models have been used to derive site-specific runup parameterizations (e.g., [14,15,16,17]; among many others).
Runup parameterizations often rely on the relationship between wave conditions and a single beach parameter (i.e., beach slope). However, subaerial and submerged beach morphology can partially control water levels at the coast. For instance, submerged sandbars can potentially modify wave dissipation in the surf zone, affecting the resulting setup, swash, and runup at the shoreline [13,15]. Observations on a barred beach and numerical simulations carried out by Raubenheimer et al. [18] suggest that the wave setup near the shoreline depends on the bathymetry of the entire surf zone, increasing as the surf zone slope decreases. Moreover, it has been demonstrated through numerical simulations that even though wave setup is mainly controlled by offshore wave height (H0), the cross-shore profile configuration can explain at least as much variance in wave setup as H0, and therefore detailed measurements of the seabed profile should be used for setup predictions [19]. Using the XBeach model, Cox et al. [20] showed that the presence of nearshore bar systems causes a reduction of the (infragravity) swash energy at the shoreline, which may become more important during storm events.
The study of the contribution of waves to extreme water levels at the shoreline is of high importance in low lying areas with increasing coastal population and frequent storm exposure such as the coast of Yucatan. At a regional scale, wind-driven waves have been previously studied in the Gulf of Mexico, bounded on the southeast by the Yucatan coast, for present and future climate. Appendini et al. [21] analyzed 30 years of wave hindcast to identify long-term trends, where a slight increase in the mean wave climate was found, with a larger increase for the 99 percentile waves but only from May through October. Using the same hindcast information, Ojeda et al. [22] examined storm events, finding that there is not a well-defined trend in wave storminess along the Mexican Gulf of the Mexico coast, except for a few locations. Extreme events in the Gulf of Mexico, associated with anti-cyclonic synoptic-scale events—referred to as Central America Cold Surges (CACS)—and tropical cyclones have been also investigated for the future climate. Appendini et al. [23] analyzed the ocean waves derived from tropical cyclones in the Gulf of Mexico using synthetic events, finding that there will be an increase in significant wave height under the RCP 8.5 scenario, although such increase will be smaller in the southern portion of the gulf. With regards to CACS, an overall slight decrease in the number of events was found under RCP 8.5, where the high-intensity CACS frequency will decrease but low-intensity CACS will increase [24].
Mendoza et al. [25] and Rey et al. [26] have estimated the flood potential under the impact of storms on the Yucatan coast by combining wave reanalysis, runup parameterizations, and subaerial beach characteristics. They have identified several locations in the study area where flooding is a potential threat for coastal communities under different conditions including CACS.
Despite of these studies, the potential effects of beach morphology to control water level at the shoreline as well as the effects of climate change on future extreme water levels in the study area have not been addressed to date. Within this context, the main aim of this study was to investigate the role of present and mid-century wind wave and sea level conditions on the storm impact at the northern Yucatan coast. In addition, to identify the role of the beach morphology in the control of coastal flooding, we analyzed four coastal sites that present different topobathymetric configurations but are subjected to similar offshore wave conditions.

2. Study Area

The study area comprises four sites located on barrier islands along the northern Yucatan coast, southeastern Gulf of Mexico (Figure 1a). The Yucatan coast is a low-lying area with a littoral zone elevation below 10 m above mean sea level [27]. A wide (up to 245 km) and shallow (1/1000 slope) continental shelf [28] effectively attenuates wave energy arriving from the Gulf of Mexico. It is a microtidal environment, with diurnal-dominated mixed tides, with a tidal range between 0.75 and 0.15 m during spring and neap tides, respectively [29]. Prevailing trade winds and local breezes (Figueroa et al., 2014) control the mean wave conditions characterized by low-energy ( H s ¯ < 1   m ), short-period ( T p ¯ 5   s ), high-angle (NE) waves (Figure 1b) [30]. Storm conditions are associated with CACS and tropical storms. CACS events play an important role in determining the mean and extreme wave conditions in the Gulf of Mexico; however, the most extreme wave conditions are related to hurricane events [21]. The CACS events (≈22 events/year) usually occur during October–April and present an interannual variability associated with El Niño [31,32,33]. No evidence of wave intensification of CACS events in the Gulf of Mexico has been found due to climate change, where high (low) intensity events will be less (more) frequent in a warming climate [24].
This study focuses on four coastal communities (Celestun, Sisal, Progreso, and El Cuyo), oriented to fisheries and touristic activities (Figure 1b), with different degree of anthropization. Celestun, Sisal, and El Cuyo have small fishing harbors, whereas Progreso exhibits a deep-water port with container and cruise ship terminals. Coastal population in Yucatan has been increasing substantially in the past decades when construction of port infrastructure began. In 1980, the coastal population was 46,694 residents, increasing to 51,079 in 1990, and 63,159 in the year 2000, showing an increment of 20% over the decade of the 1990s [34]. Nowadays, Progreso is the most populated coastal community with 37,369 residents, followed by Celestun with 6810 and Sisal and El Cuyo with 1837 and 1567, respectively [35], which present lower anthropogenic impact and a well-preserved beach and dune morphology. Measurements of the nearshore bathymetry suggest that the depth of closure is located at approximately 4 m water depth. Shoreline orientation with respect to the north at each site varies from 300° at Celestun, 350° at Sisal and Progreso, and 13° at El Cuyo, and measured grain size distributions correspond to medium and fine sands with D50 values ranging from 0.2 to 0.5 mm [25].

3. Materials and Methods

Field observations, regional climatic models, wave generation models, and nonlinear nearshore wave transformation models were herein employed to investigate wave runup at four different sites along the northern Yucatan coast. The role of the beach morphology on wave runup and storm impact was investigated at the four sites under current wave climate. Moreover, in order to assess the potential effect of climate change on future storm impacts in the area, we analyzed wave runup and storm impact in the best-preserved site (Sisal) by considering mid-century wave conditions and sea level rise projections under the RCP 8.5 scenario.

3.1. Wave Data

Wave information was generated using the third-generation wave model MIKE 21 SW [37]. The numerical model employed a non-structured grid covering the Gulf of Mexico and the western Caribbean Sea with boundary at 80° W (e.g., [23]). The mesh has a resolution of approximately 25 km below 300 m depths, reaching a resolution of 10 km at the coast in all areas except the Mexican coast, which reaches a resolution of approximately 4.5 km. The model was set up with a fully spectral formulation and in stationary time formulation. The spectral discretization of the frequencies consisted of a logarithmic discretization with 25 frequencies with a factor of 1.1 covering 0.055 Hz to 0.64 Hz, while the directional discretization consisted of 16 directions covering a 360 degree rise. For our study, we considered the modeling area as an enclosed area that is not affected by swell from neither the Atlantic nor the Caribbean Sea, and thus all the boundaries were closed. The numerical model was forced with wind information simulated by the regional climate model PRECIS (Providing REgional Climates for Impacts Studies) for present and future conditions under RCP8.5 scenario. Tropical cyclones are not accurately resolved with the directional discretization of the wave model as the employed discretization leads to the garden sprinkler effect [38]. Nevertheless, tropical cyclones are not the focus of this study, whereas other relevant weather systems such as CACS events or Nortes are accurately resolved with such discretization [39].
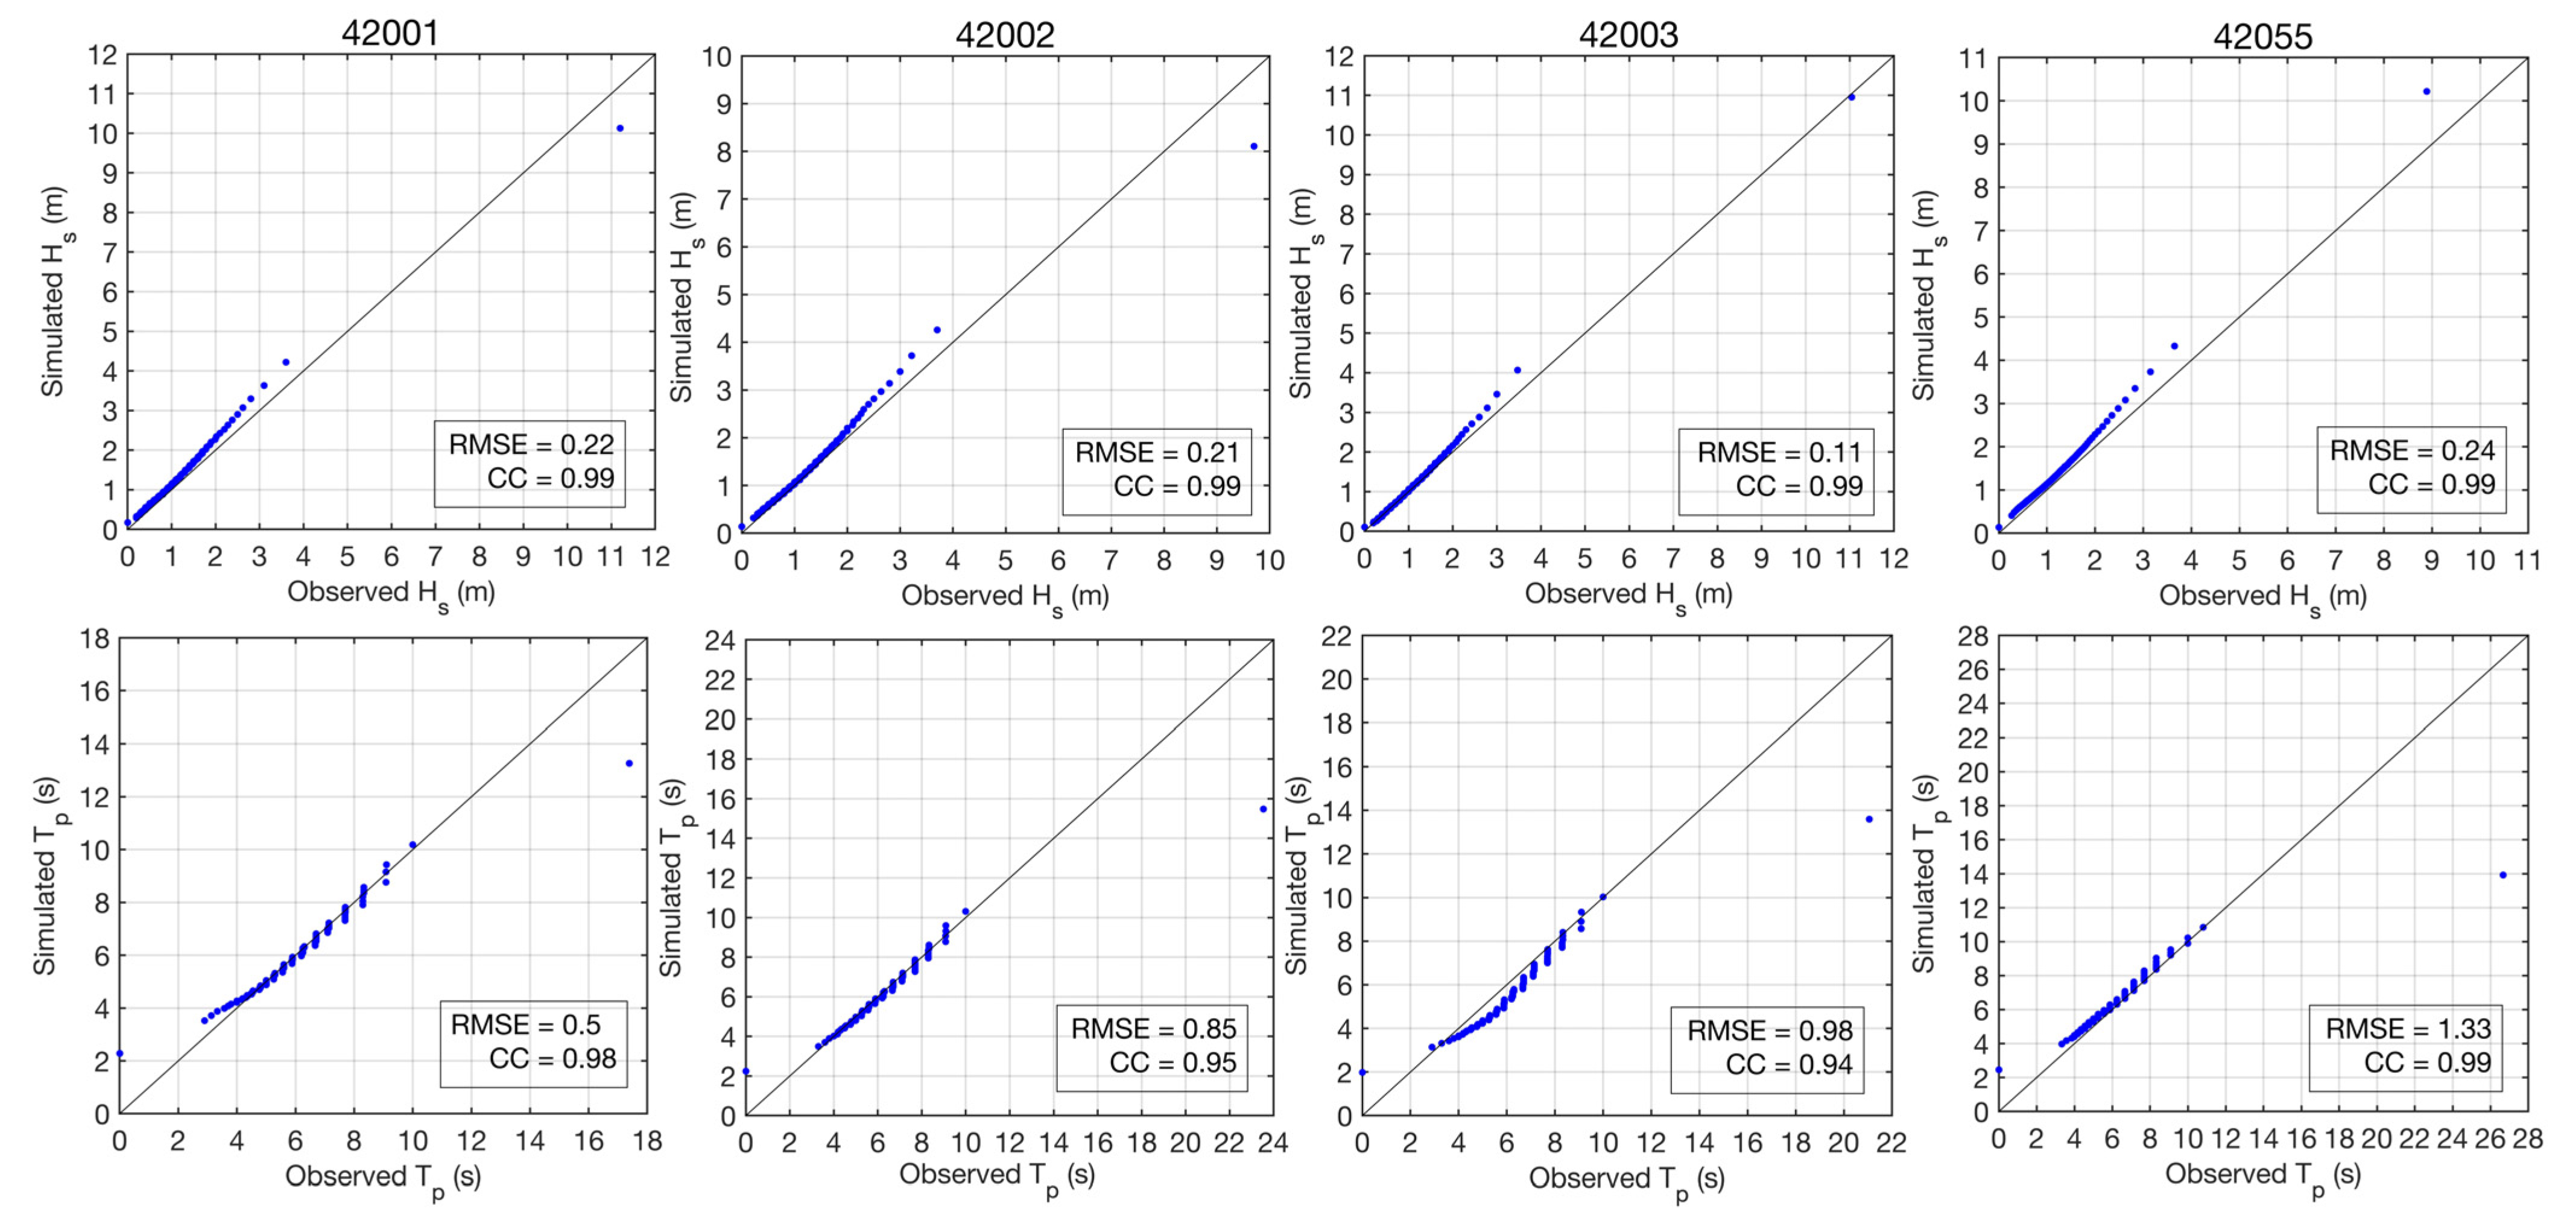
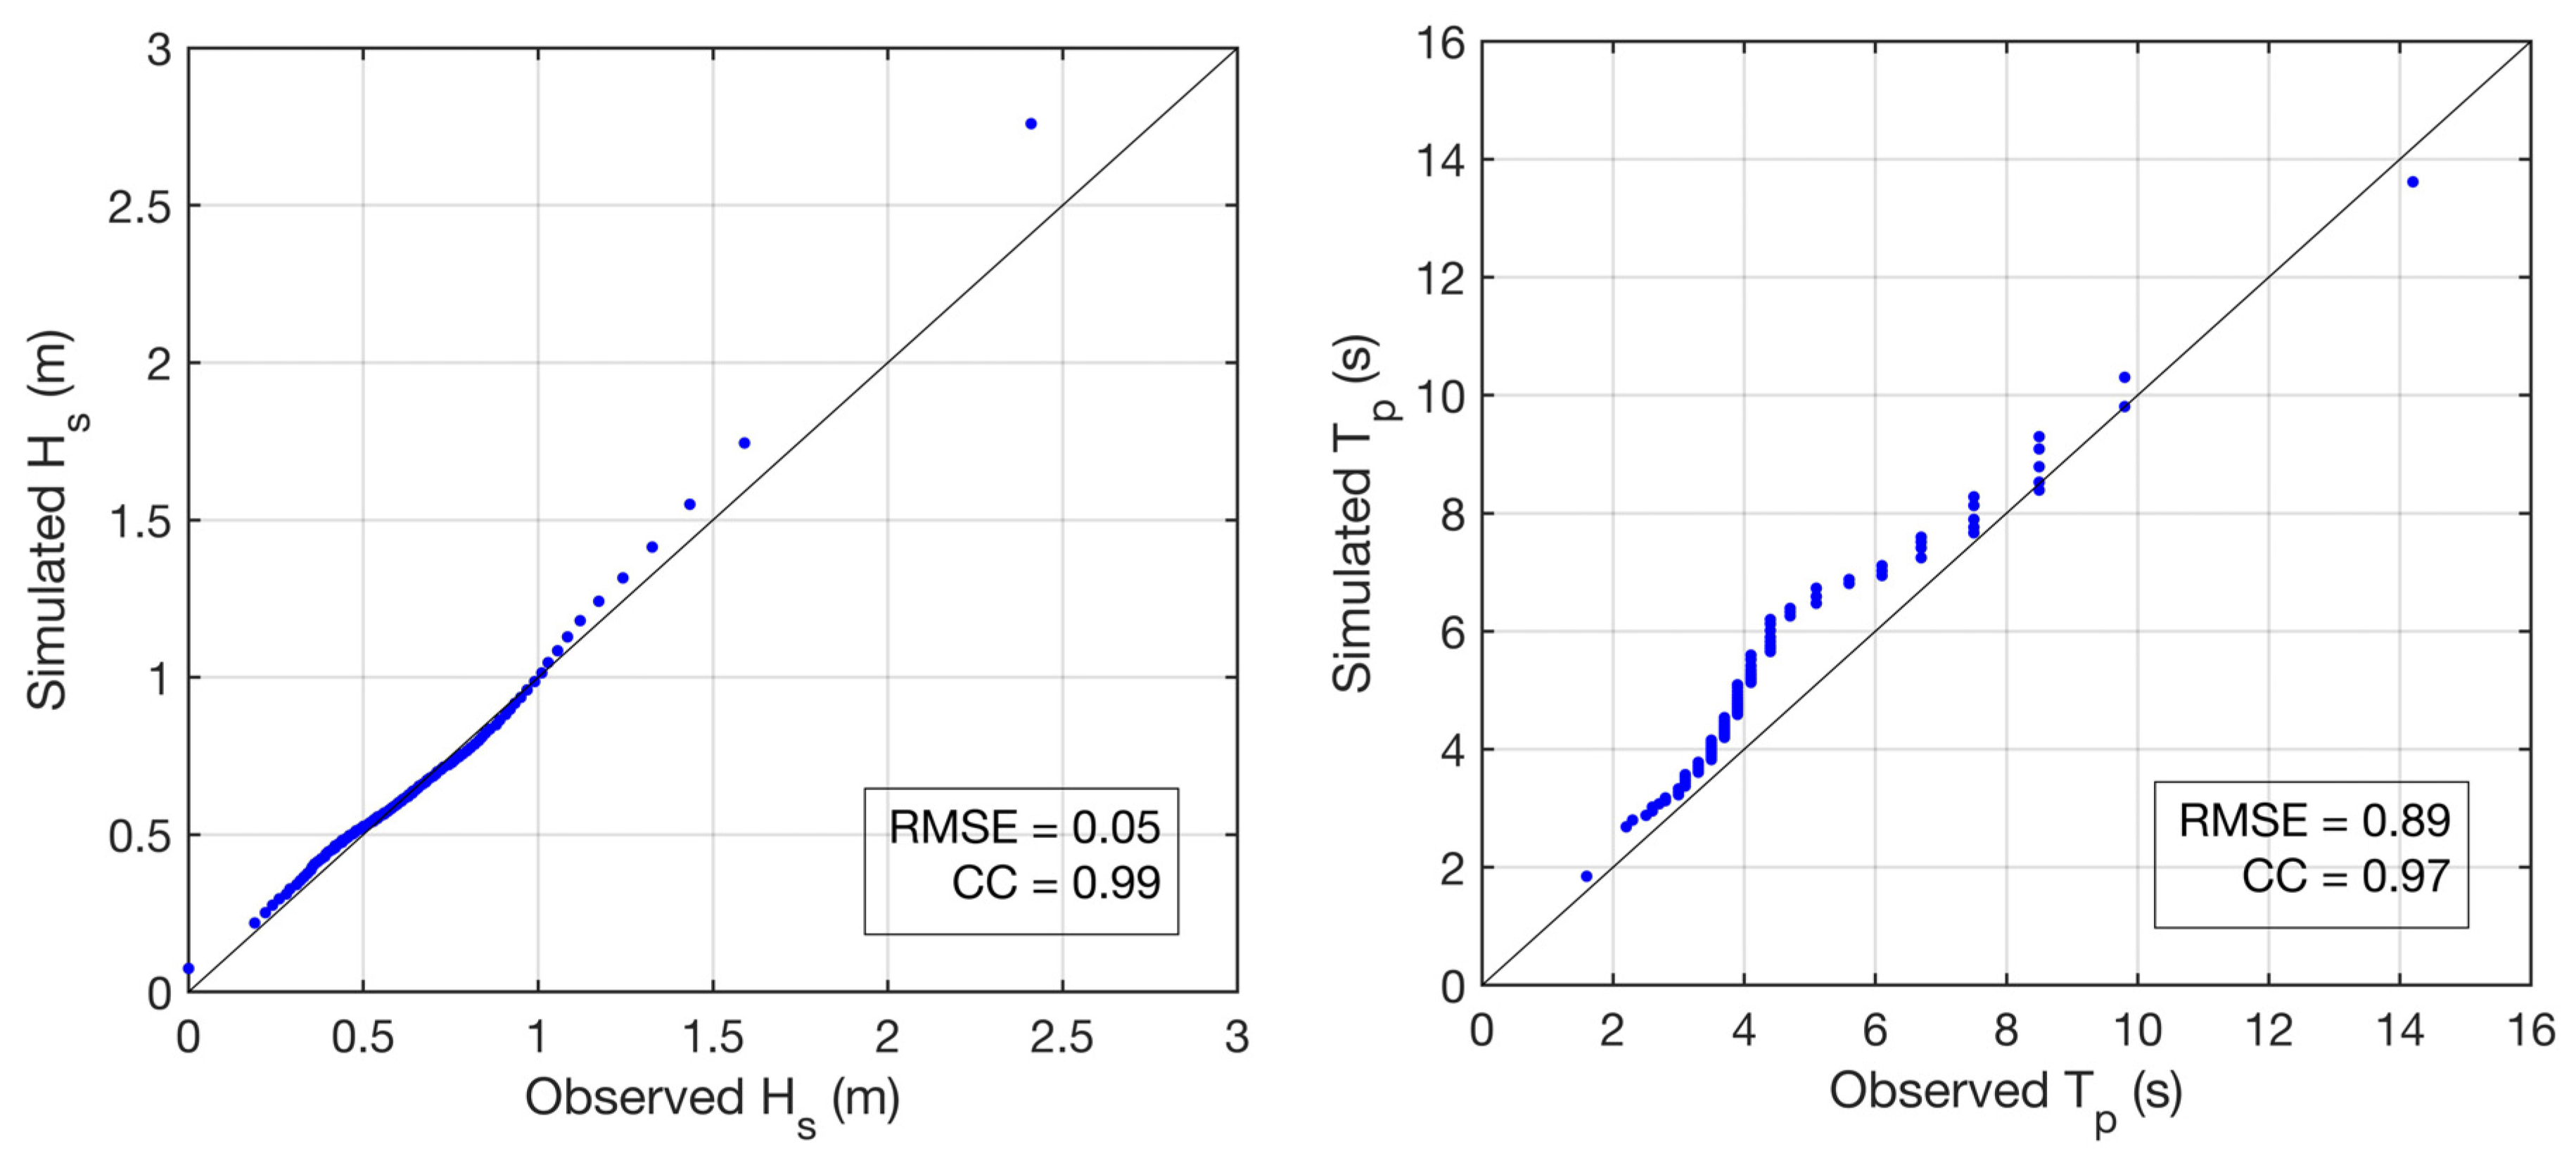
To locally characterize wave conditions, we obtained wave height, period, and mean direction at four grid points located at approximately 10 m water depth in front of the four sites of interest (Figure 1c) for the periods 1980–2005 and 2030–2054. To validate the model, we compared long-term wave climates derived from buoy data (National Data Buoy Center stations 42001, 42002, 42003, and 42055 in Figure 1a) and model results, as represented by their inverse cumulative distributions or quantile function (Figure 2). Correlation analysis resulted in a correlation coefficient of 0.99 for Hs and larger than 0.9 for Tp at all buoy locations. At the study area, we made use of measured wave data acquired with an ADCP located at 10 m depth in Sisal (Figure 1c) to validate nearshore wave model results. The comparison is shown in Figure 3, which resulted in a correlation coefficient, CC, of 0.99 for Hs and 0.97 for Tp. Please note that it was not possible to perform a time series analysis as PRECIS is not a reanalysis but a dynamic downscaling of a general circulation model.

3.2. Topo-Bathymetric Measurements

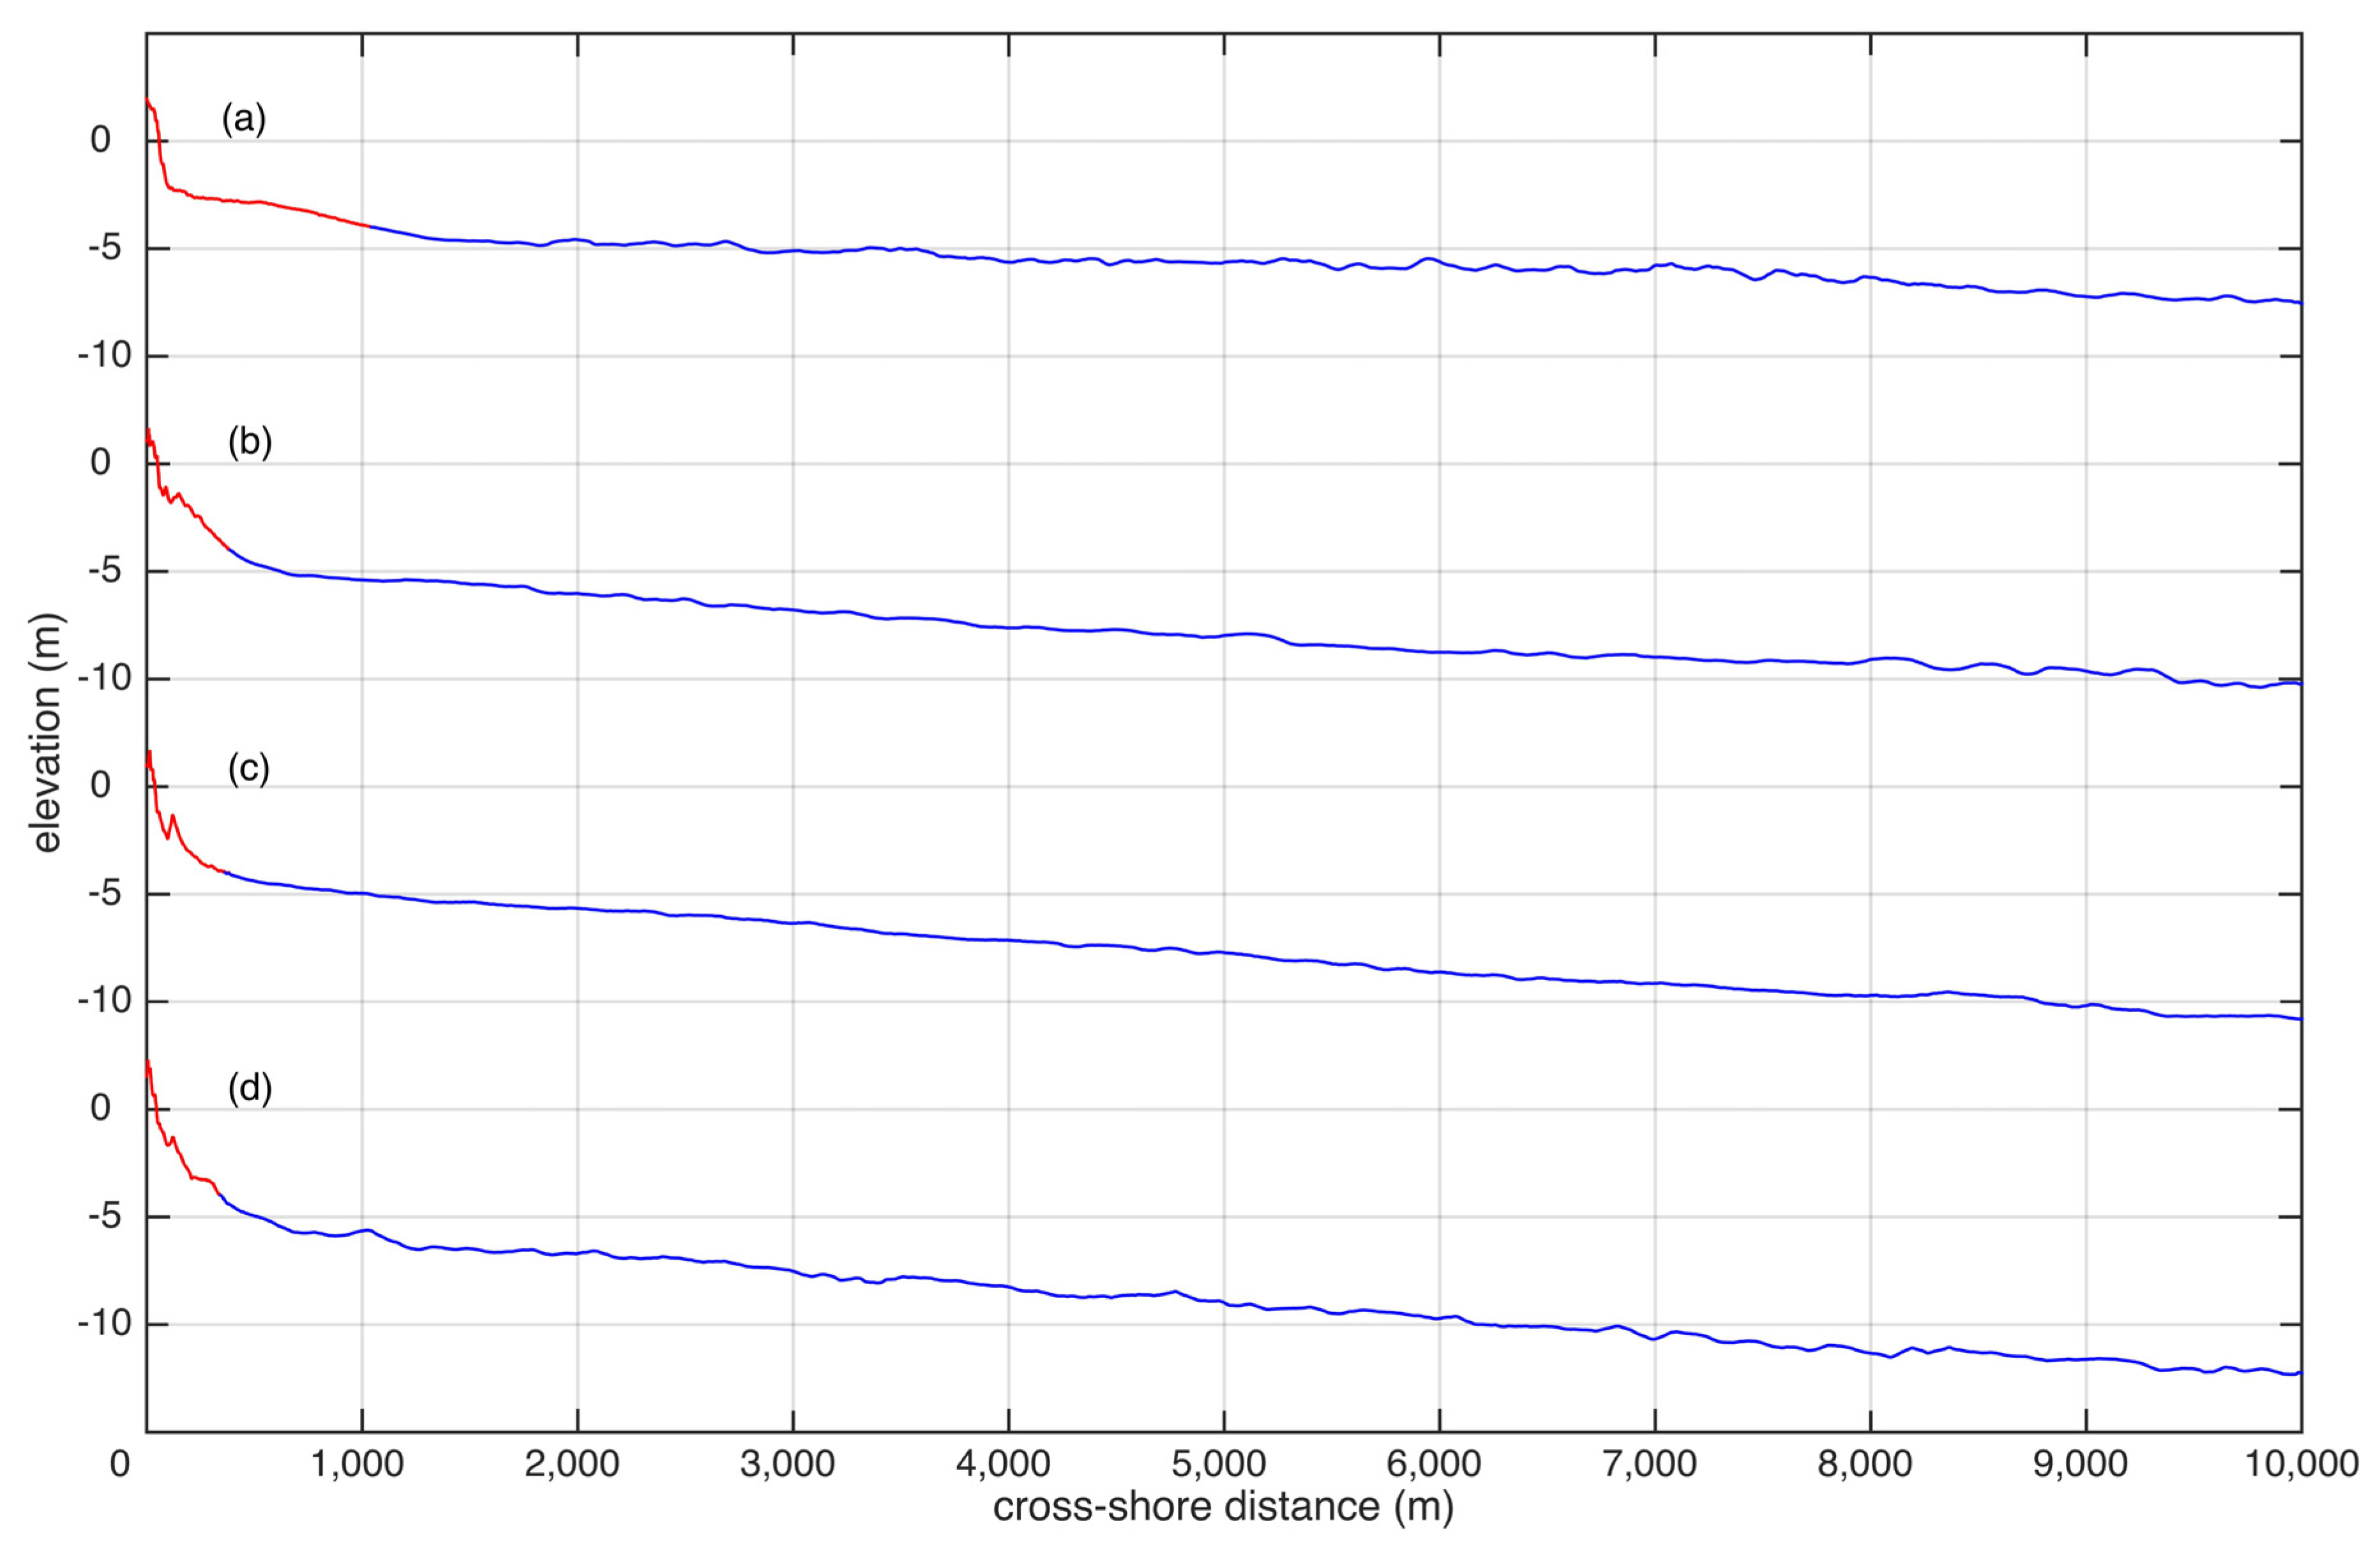
Nearshore bathymetry and beach dune morphology are required for onshore wave propagation, runup prediction, and storm impact assessment. Thus, field campaigns were conducted in the summer of 2019 at four different sites (Figure 1c). Nearshore bathymetry was acquired with an echosounder and DGPS system mounted on a boat. Perpendicular transects were taken from 1.5 m water depth to 10 m water depth, extending approximately 10 km offshore (Figure 1c). On the other hand, beach profiles were surveyed using a DGPS rover carried on a backpack. A base station was installed at each site for at least 12 h prior to each survey for data postprocessing. The transects covered the lee side of the dune up to a water depth of 1.5 m and coincided with the corresponding bathymetric transect extending until 10 m water depth. Measurements overlapping allow for fine adjustment on the bathymetric profile (Figure 4). The elevation is referenced to the MEX97 Geoid [40].

3.3. Wave Propagation and Wave Runup

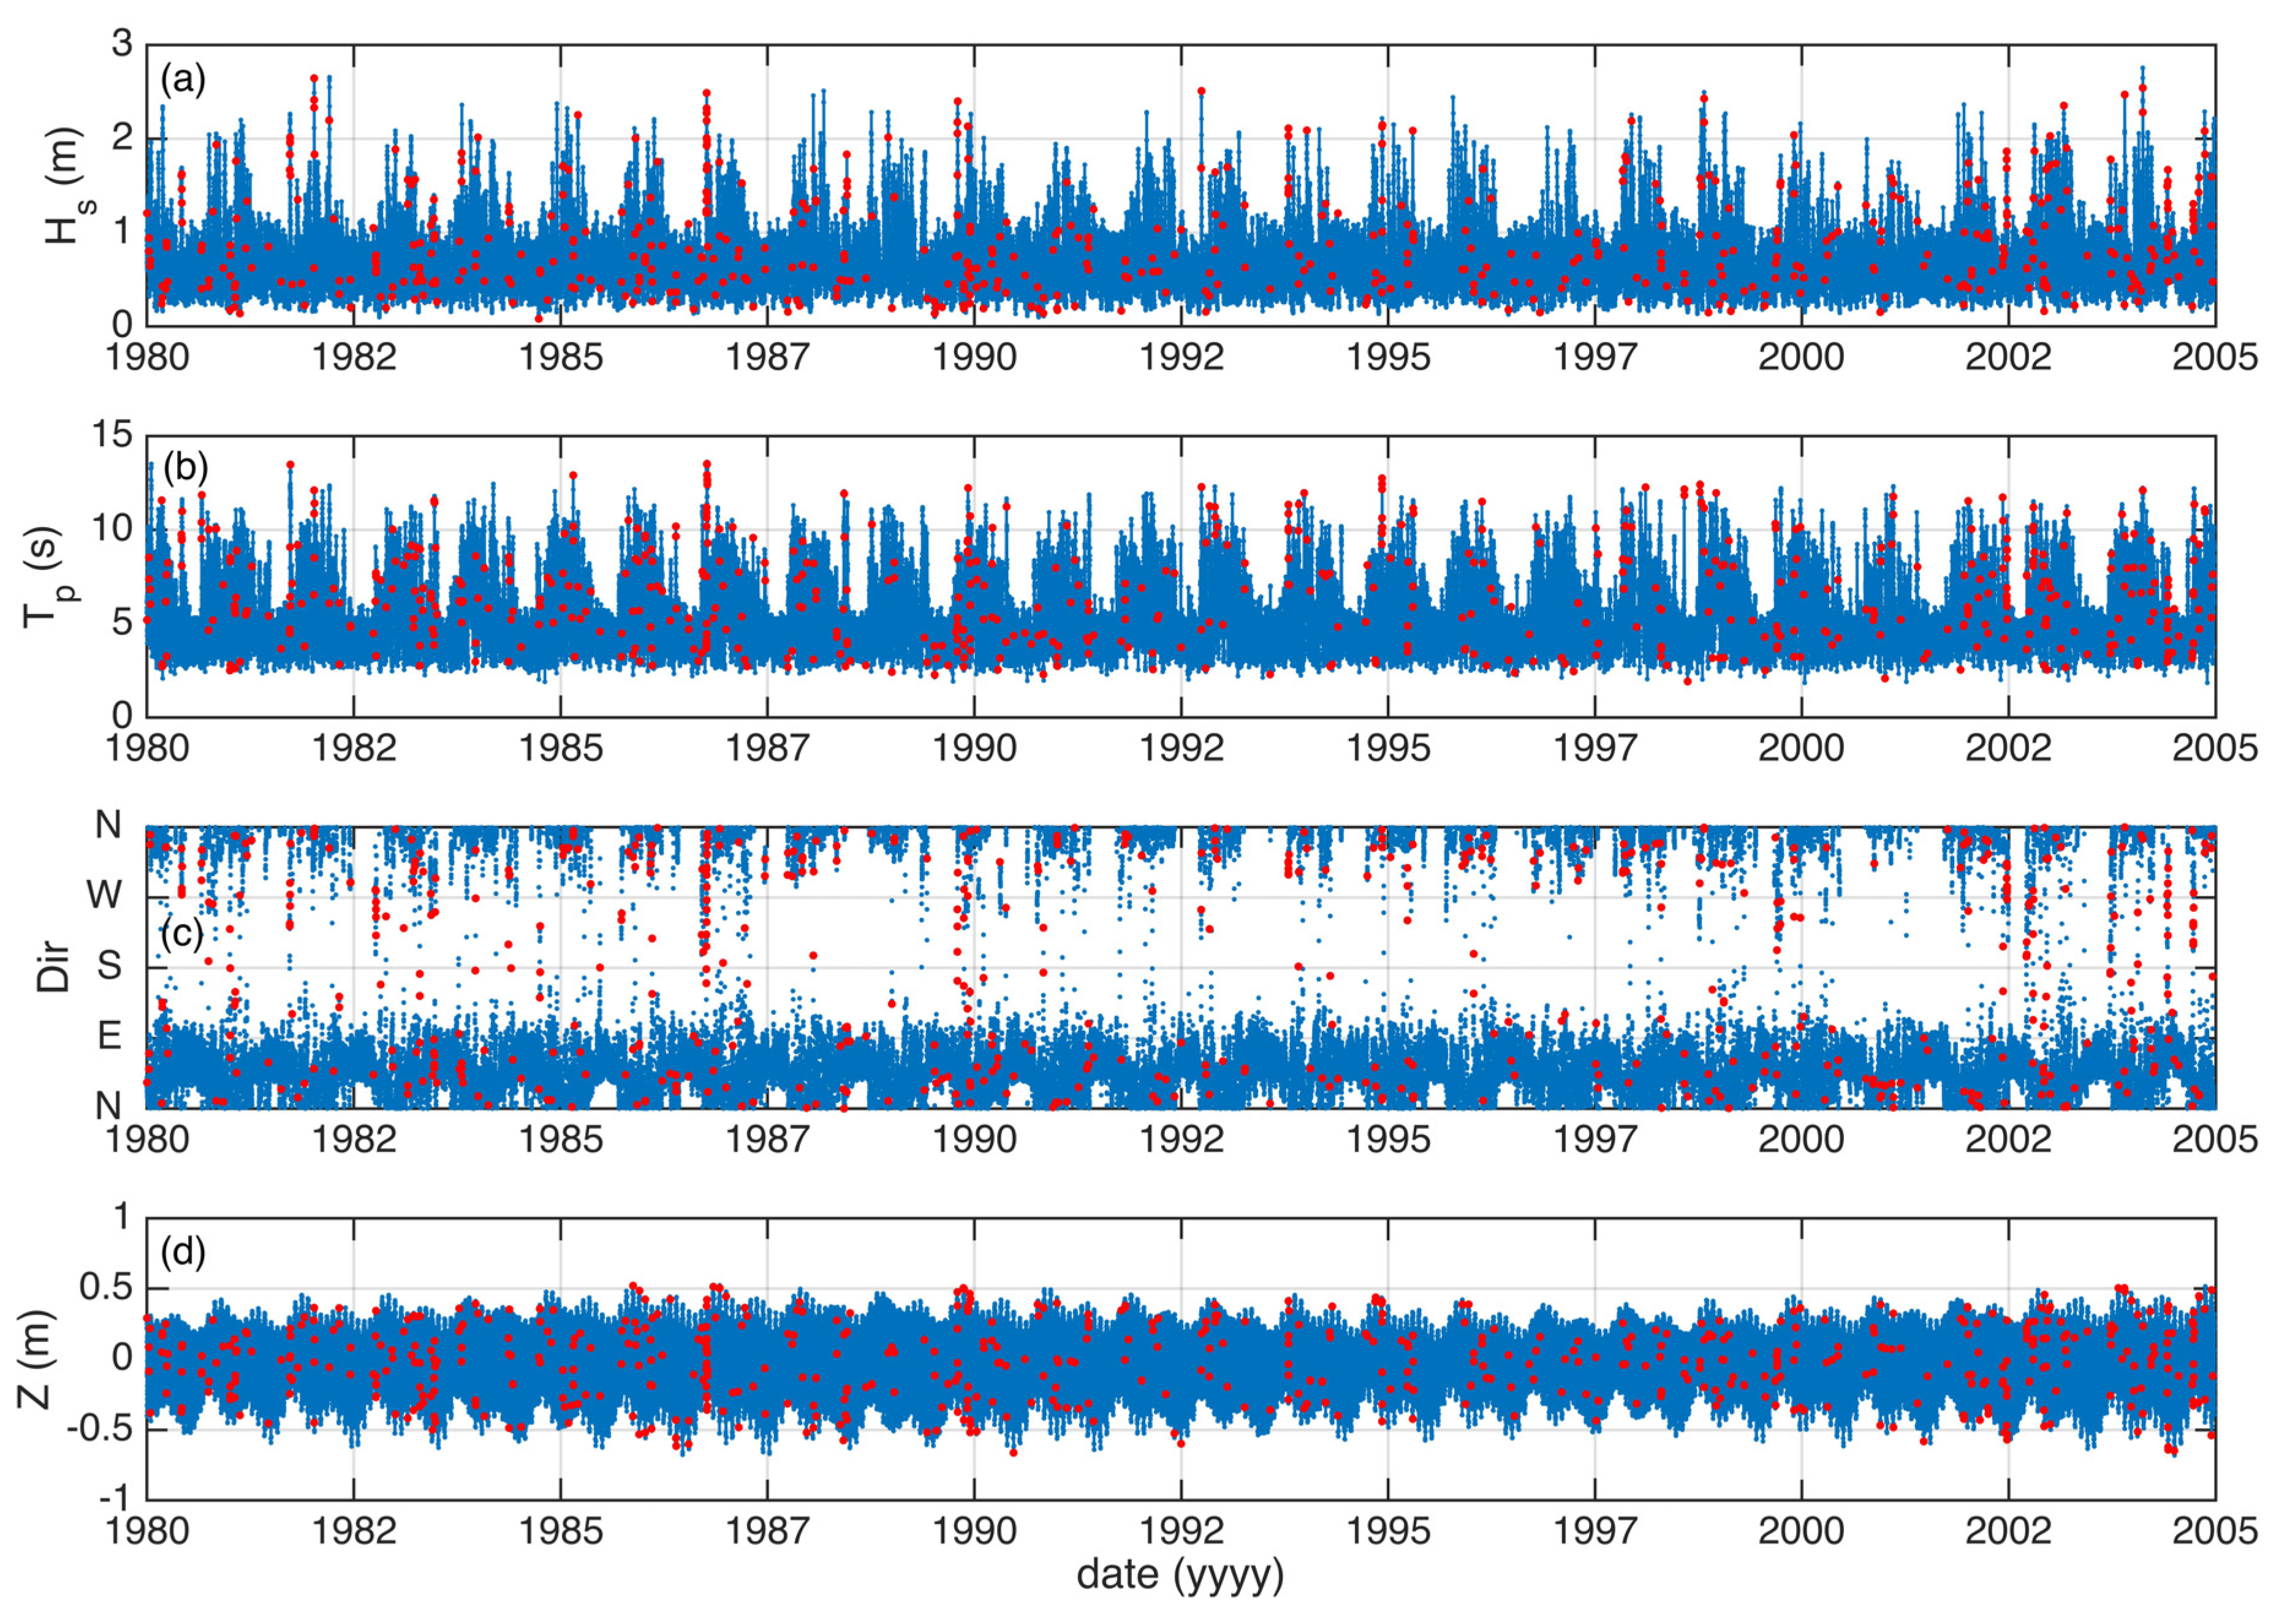
A downscaling approach was employed to reconstruct the 25-year runup time series at the four different sites. Following previous studies [41,42,43,44], a maximum dissimilitude algorithm was employed to select a reduced number of representative cases from the approximately 73,000 wave conditions at each site. The selection was made for present wave conditions (1980–2004) at each site, considering the mean sea level (MSL) prediction at Progreso (Yucatan) provided by CICESE [45], resulting in 600 cases (Hs, Tp, Dir, Z) for each study location (see Sisal, for instance, Figure 5). To assess the effect of climate change, we performed a similar wave selection procedure considering the future wave conditions (2030–2054) under the RCP8.5 scenario at Sisal with the corresponding tide prediction. In addition to this, another set was created by considering future wave conditions and the projection of global mean sea level (GMSL) rise relative to 1986–2005 under the RCP 8.5 scenario [46] (p. 1181). Estimated sea level rise corresponding to the same period (2030–2054) was added to the tide prediction. The scenarios considered in this study resulted in a total of 3600 runs.
The third-generation wave model SWAN [47] was coupled with the non-hydrostatic nonlinear shallow water equations SWASH model (Zijlema et al. [48]) to propagate a total of 600 selected cases, for each of the six scenarios, from 10 m water depth until the coast, employing the corresponding measured topo-bathymetric data at each site. The SWAN model was run in stationary 1D mode from 10 to 4 m depth, with a uniform grid (mesh size of 1 m). The model was forced at the offshore boundary with a Jonswap spectrum on the basis of the selected wave conditions. The energy spectrum obtained at the output location (4 m water depth) was used as input boundary conditions for the SWASH model. The domain in the SWASH model was defined from 4 m water depth to the foredune. For the case of Celestun and Progreso, the beach profiles were extended landward following the existing foredune slope in order to estimate the maximum wave runup. A mesh size of 0.1 m was implemented. The initial time step of computation was set to 0.025 s with a maximum Courant number, Crmax = 0.5. Simulations were sampled for 2700 s at 5 Hz, including spin-up time. The SWASH model simulations allowed us to determine runup time series by tracking the wet–dry interface to be further analyzed to estimate the runup of 2% of exceedance, R2%, and wave setup for each combination of wave and tide conditions (Figure 6). The R2% and setup computed values include the MSL (Z) contribution and are hereinafter called Rhigh and Rlow, respectively, following Sallenger [49]. Finally, a meshless interpolation technique based on radial basis functions [50,51], suitable for multivariate and scattered data, was employed to reconstruct the Rhigh and Rlow time series at each site.
An extreme analysis is carried out employing the annual maxima values of the extreme water levels, Rhigh and Rlow, by means of the generalized extreme value (GEV) distribution [52] using the WAFO toolbox [53]. Subsequently, the obtained return values of Rhigh and Rlow are compared with dune crest and dune toe elevations measured at each site to determine the storm impact for different return periods (e.g., [49,54]). The GEV model was used to perform the extreme value analysis; however, large uncertainty, depicted in the 95% confidence bounds, was expected due to the relatively short length of the time series of wave conditions available for the study (i.e., 25 years). Longer time series would result in more robust and reliable predictions.

3.4. Storm Impact

To assess the potential morphological impact of storms, we made use of the storm impact scale for barrier islands introduced by Sallenger [49]. The scale was based on the relative elevation of the dune morphology features, dune crest (Dhigh) and dune toe (Dlow), and the extreme water levels (Rhigh and Rlow), which corresponded to the runup of 2% exceedance and setup at the shoreline including MSL (Z) contribution. The scale defines four storm impact regimes with associated morphological changes: Swash (Rhigh < Dlow) during which erosion will be restricted to the foreshore, Collision (Dlow < Rhigh < Dhigh) causing base dune erosion where eroded sand is transported offshore/longshore and will not return to the dune, Overwash (Rhigh > Dhigh) generating overtopping and dune erosion with sediment deposition landward of the dune crest, and Inundation (Rlow > Dhigh) when massive net onshore transport and barrier island’s landward migration will occur. In our application, the MSL corresponds to that associated with the astronomical tide, and hence the storm impact regime at each site might be underpredicted due to neglecting storm surge contributions. Put into context, typical magnitude of storm surges in the study area is in the order of 0.40 m. Despite this, the analysis of the role of beach morphology and climate change on the impact of storms would not be significantly affected, since it is not a question of finding absolute values of sea level, but rather a relative analysis.

4. Results

4.1. Present and Mid-Century Wave Conditions

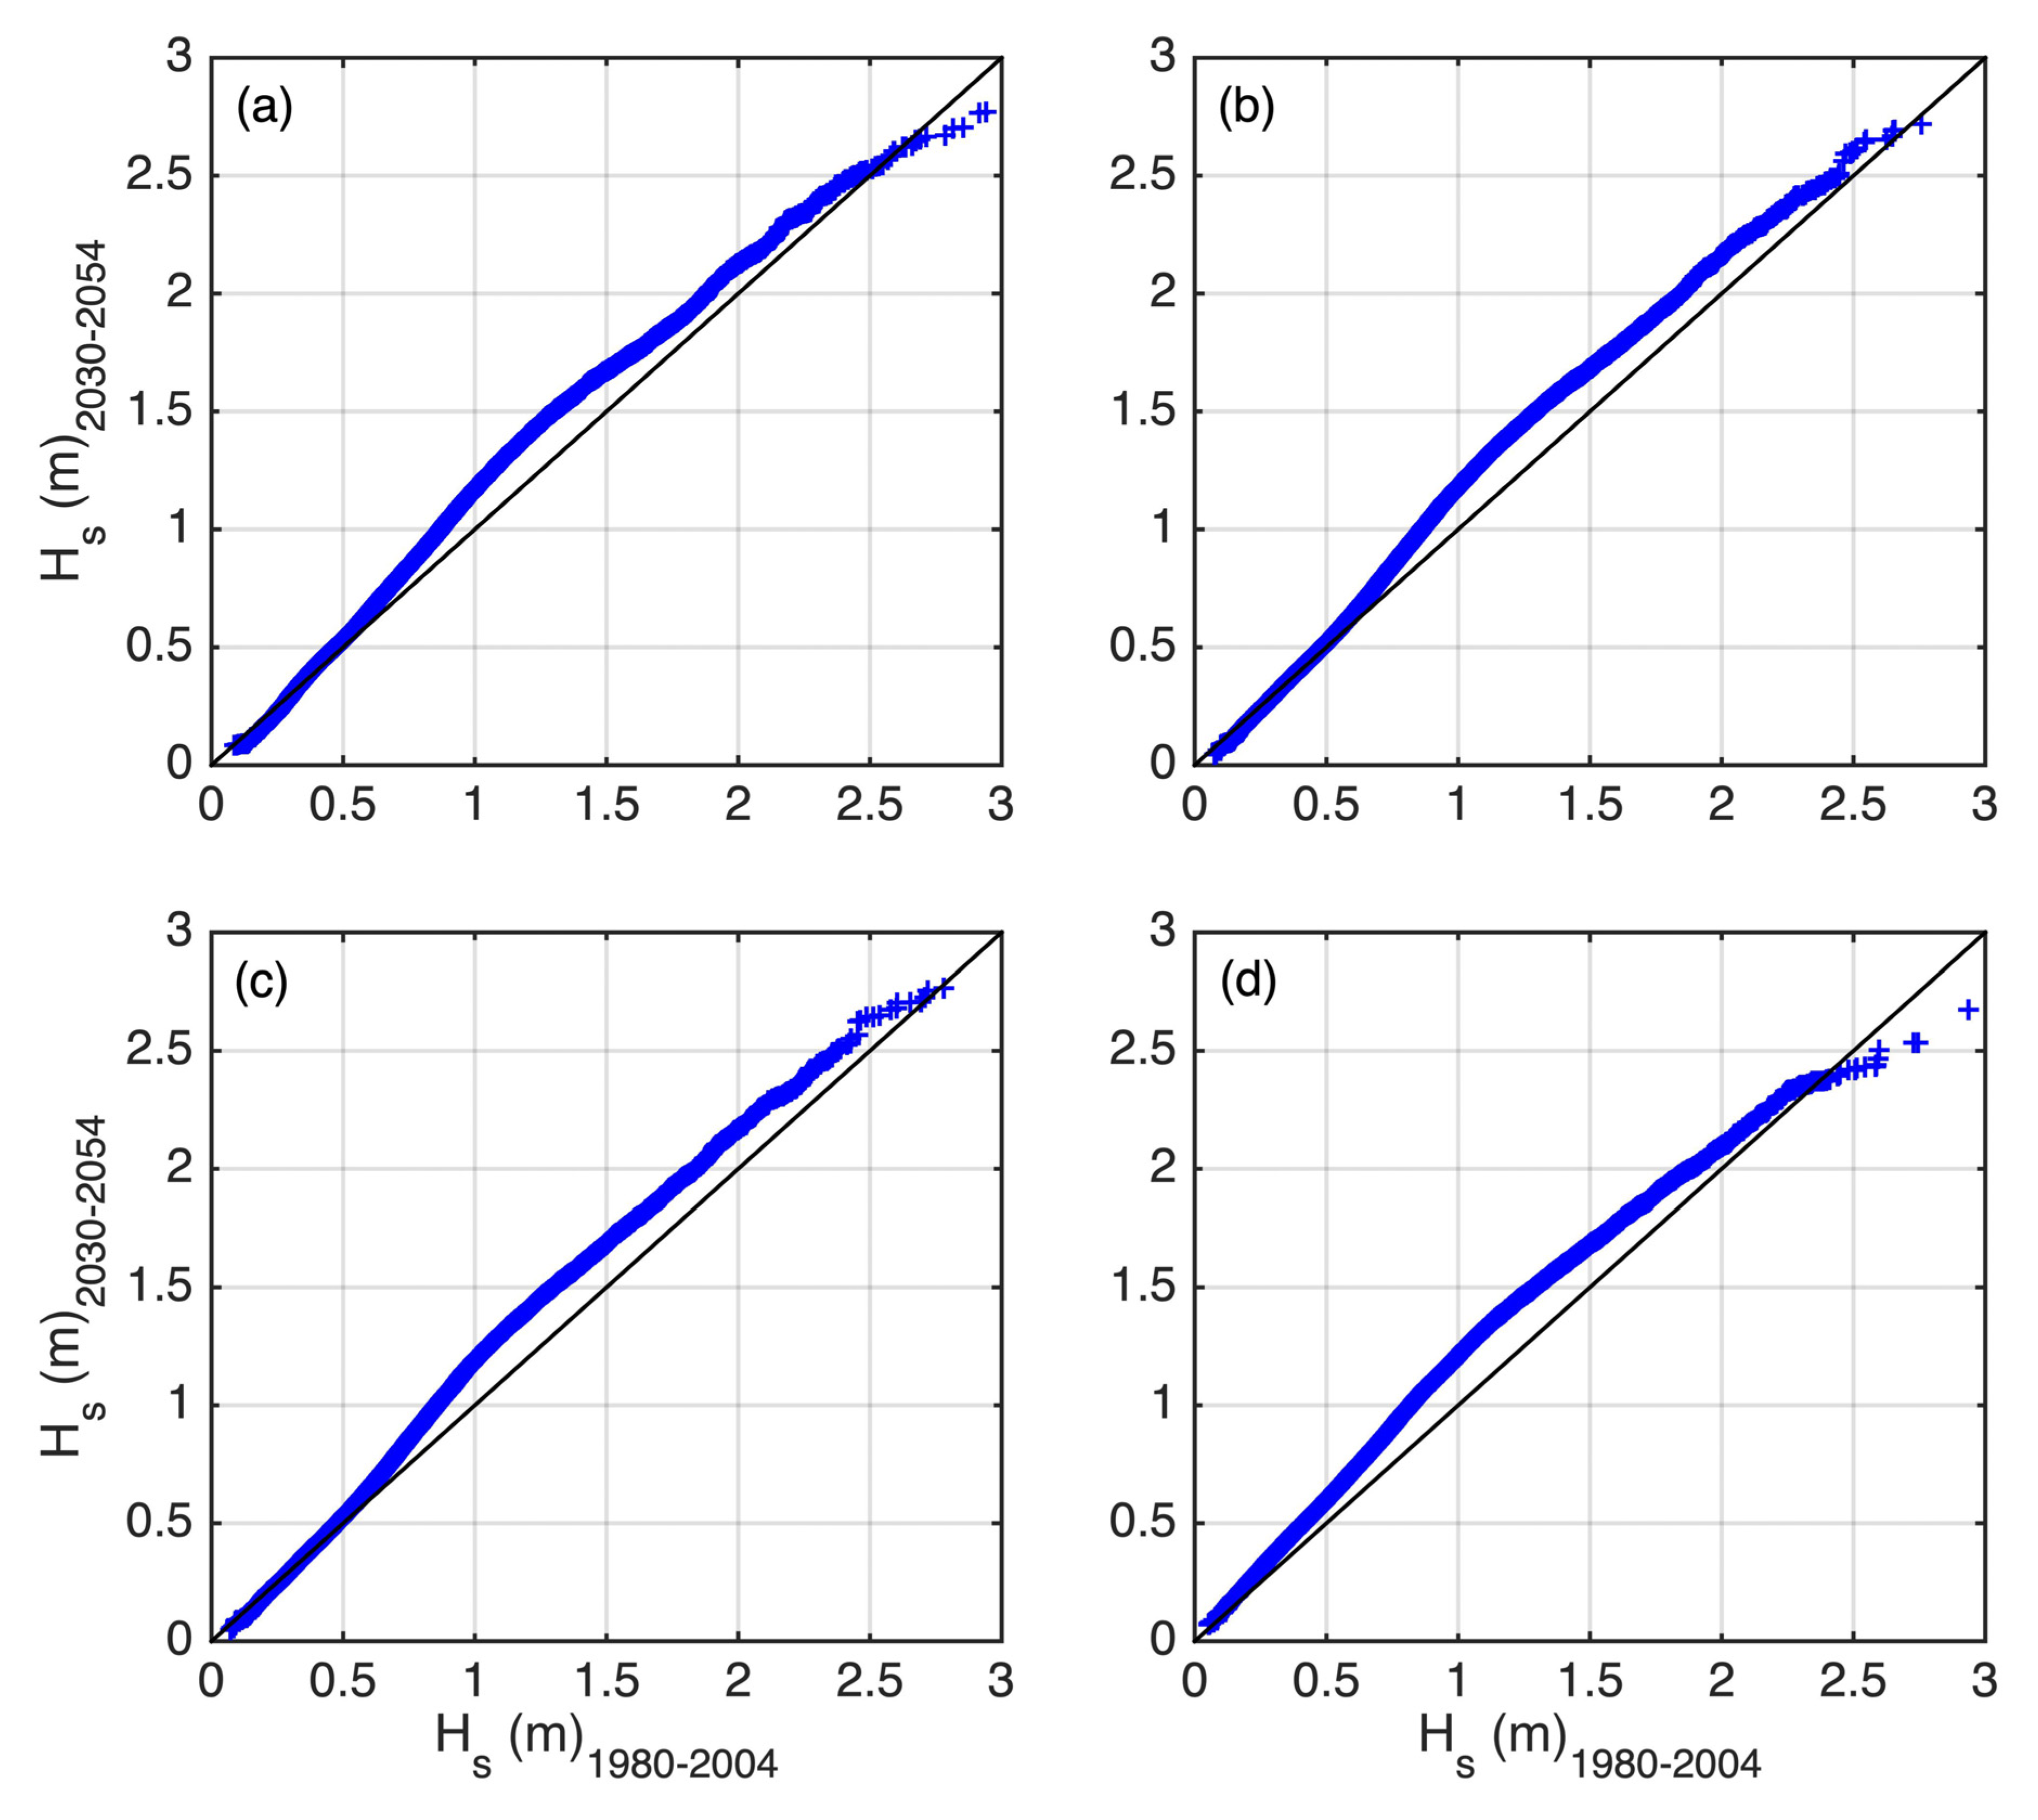
Wave conditions in the study area show a clear seasonality (Figure 5a–c). Higher Hs and Tp values were observed during winter months associated with directions close to the north, due to the dominance of CACS events, whereas less energetic, short-period waves, approaching mainly from the NE, were observed the rest of the year due to persistent sea breezes (Figure 5). Figure 7 shows a comparison of the distribution of the modeled present (1980–2004) and mid-century (2030–2054) Hs at the study sites. As can be seen, they were very similar under low energetic conditions (Hs < 0.5 m). For the most frequent conditions, 0.75 ≤ Hs ≤ 2.5 m approximately, mid-century Hs values were slightly higher than under current conditions. For higher values (Hs 2.5 m), the distributions came closer again, and finally, for the most energetic conditions, the maximum values corresponding to the period 2030–2054 were smaller than under present climate (1980–2004), especially at Celestun and El Cuyo (Figure 7a,d). It is worth mentioning that tropical cyclones were not well represented in the downscaling, and as such, there could be an underestimation of waves from such events.

4.2. Beach Dune Morphology

Field measurements at the four different sites showed alongshore variations of the beach slope, nearshore bathymetry features, subaerial beach profile, and foredune characteristics. The continental shelf presented the steepest slope at El Cuyo, reaching 12 m depth at 10 km offshore, whereas the mildest one was found at Celestun where the beach profile reached 7.5 m water depth at the same offshore distance (Figure 4a,d). The intermediate slopes were found at Sisal and Progreso, where the 10 m isobath was found at 10 km offshore (Figure 4b,c).
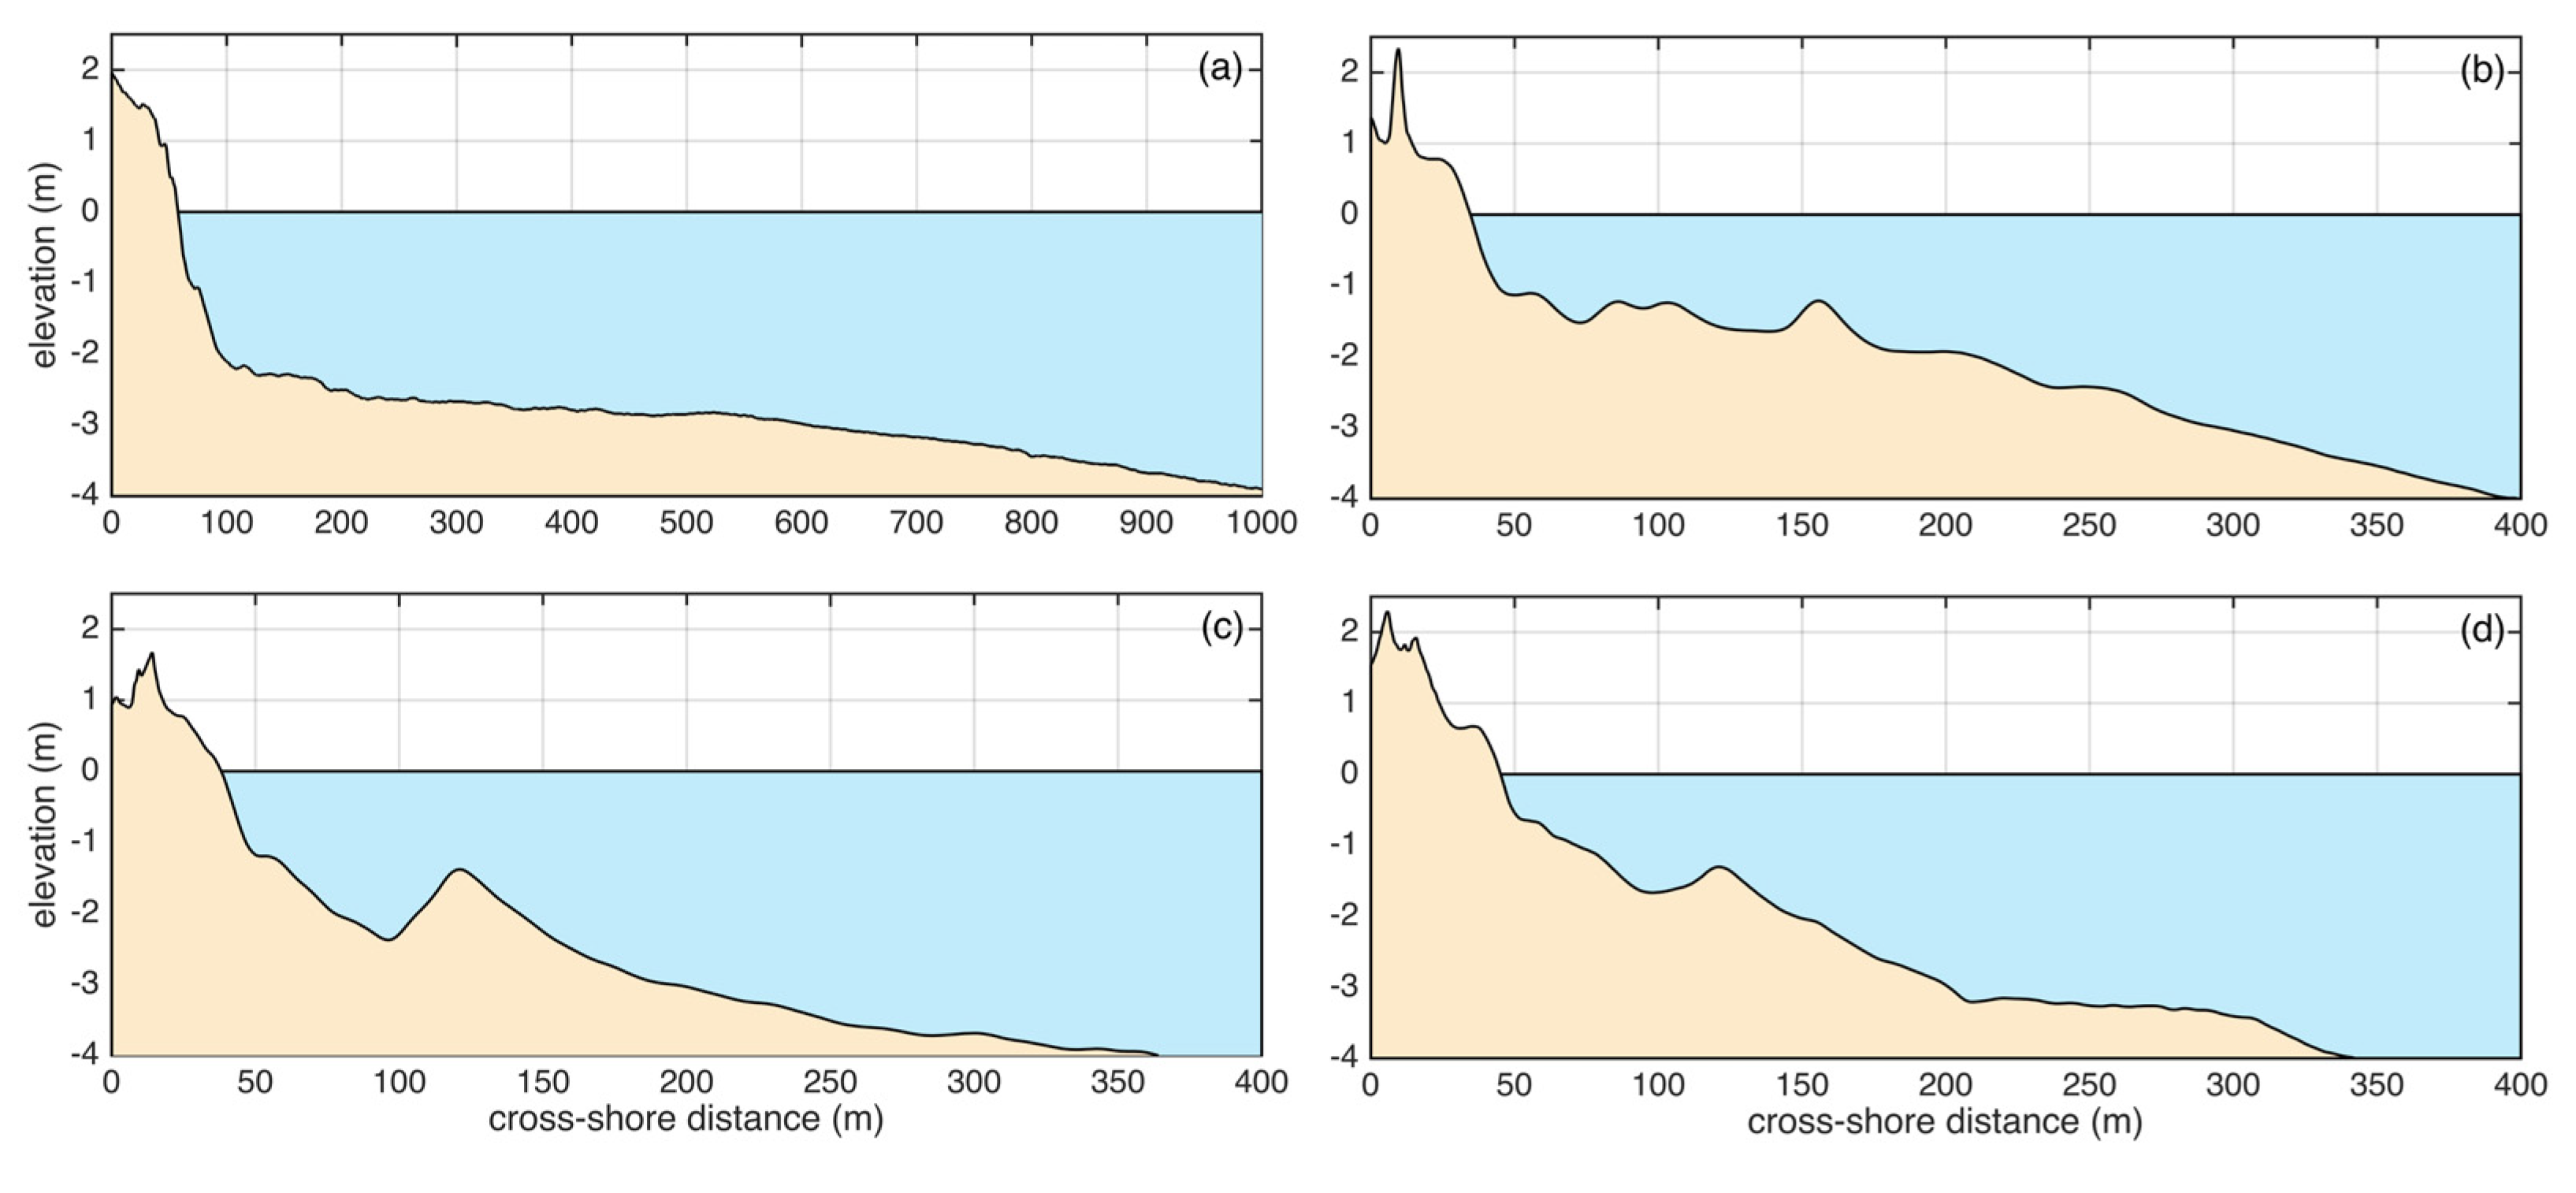
Nearshore bathymetry measurements (Figure 8) showed that sandbars were present at all sites except for Celestun (Figure 8a), and they showed different morphological characteristics, i.e., distance from the shoreline and elevation. Thus, Sisal is characterized by the presence of a multiple sandbar system, whereas Progreso and El Cuyo present a single sandbar, with the largest one observed at Progreso. The average surf zone beach slope, βav, was computed according to Raubenheimer [18] as β a v = h a v / x , where h a v = 1 / x h + η d x and Δx is the distance from the shoreline to the outer edge of the surf zone. Here, the approximate value for the closure depth of 4 m determined the length of Δx, and η was set to 0 (still water level). Celestun presented the smallest value of βav = 0.003, followed by Sisal (βav = 0.006), and then Progreso and El Cuyo, both with a βav = 0.008.
The subaerial profiles also showed differences between sites (Figure 8), which will influence runup values and the level of protection of the hinterland. El Cuyo and Sisal presented a well-defined berm, whereas the beach profile at Celestun was featureless. The beach slope at the foreshore, βf, varied from the steepest values at Sisal and El Cuyo (0.12), followed by Celestun (0.1) and Progreso (0.075), which presented the mildest foreshore beach slope. The foredunes with the highest elevation were found at Sisal and El Cuyo (>2 m), whereas the more urbanized coasts at Progreso and Celestun presented a degraded foredune with a smaller crest elevation (<2 m) (Table 1).

4.3. Extreme Water Levels

4.3.1. Extreme Water Levels: Present Conditions

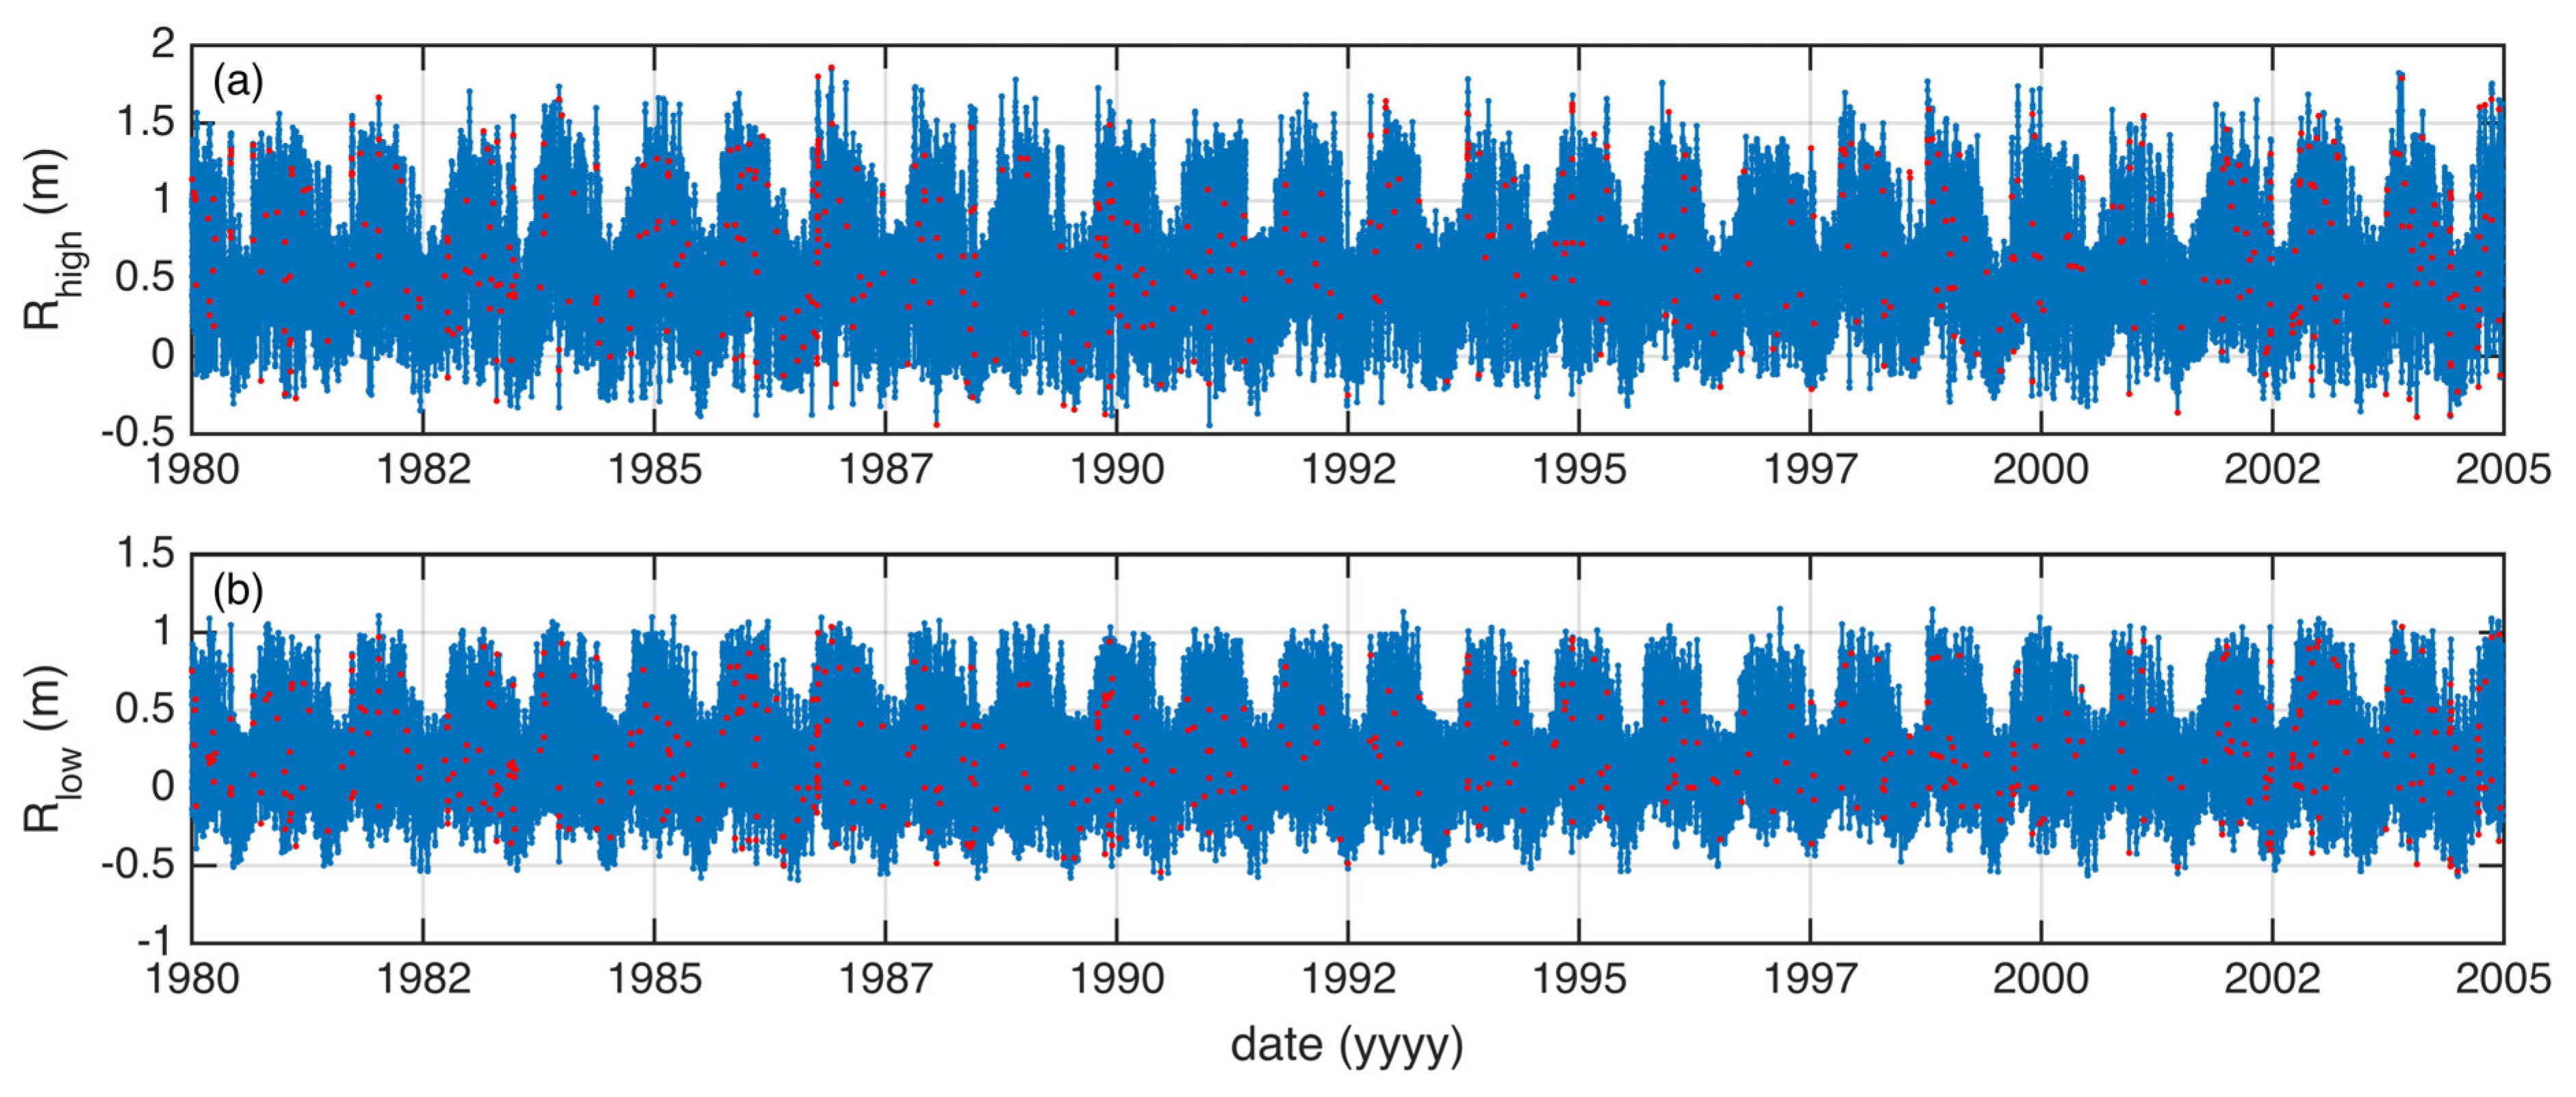
Similar to input wave conditions, simulated extreme water levels, Rhigh and Rlow, time series presented a well-defined seasonal variation (see Figure 9a,b for the Sisal site).
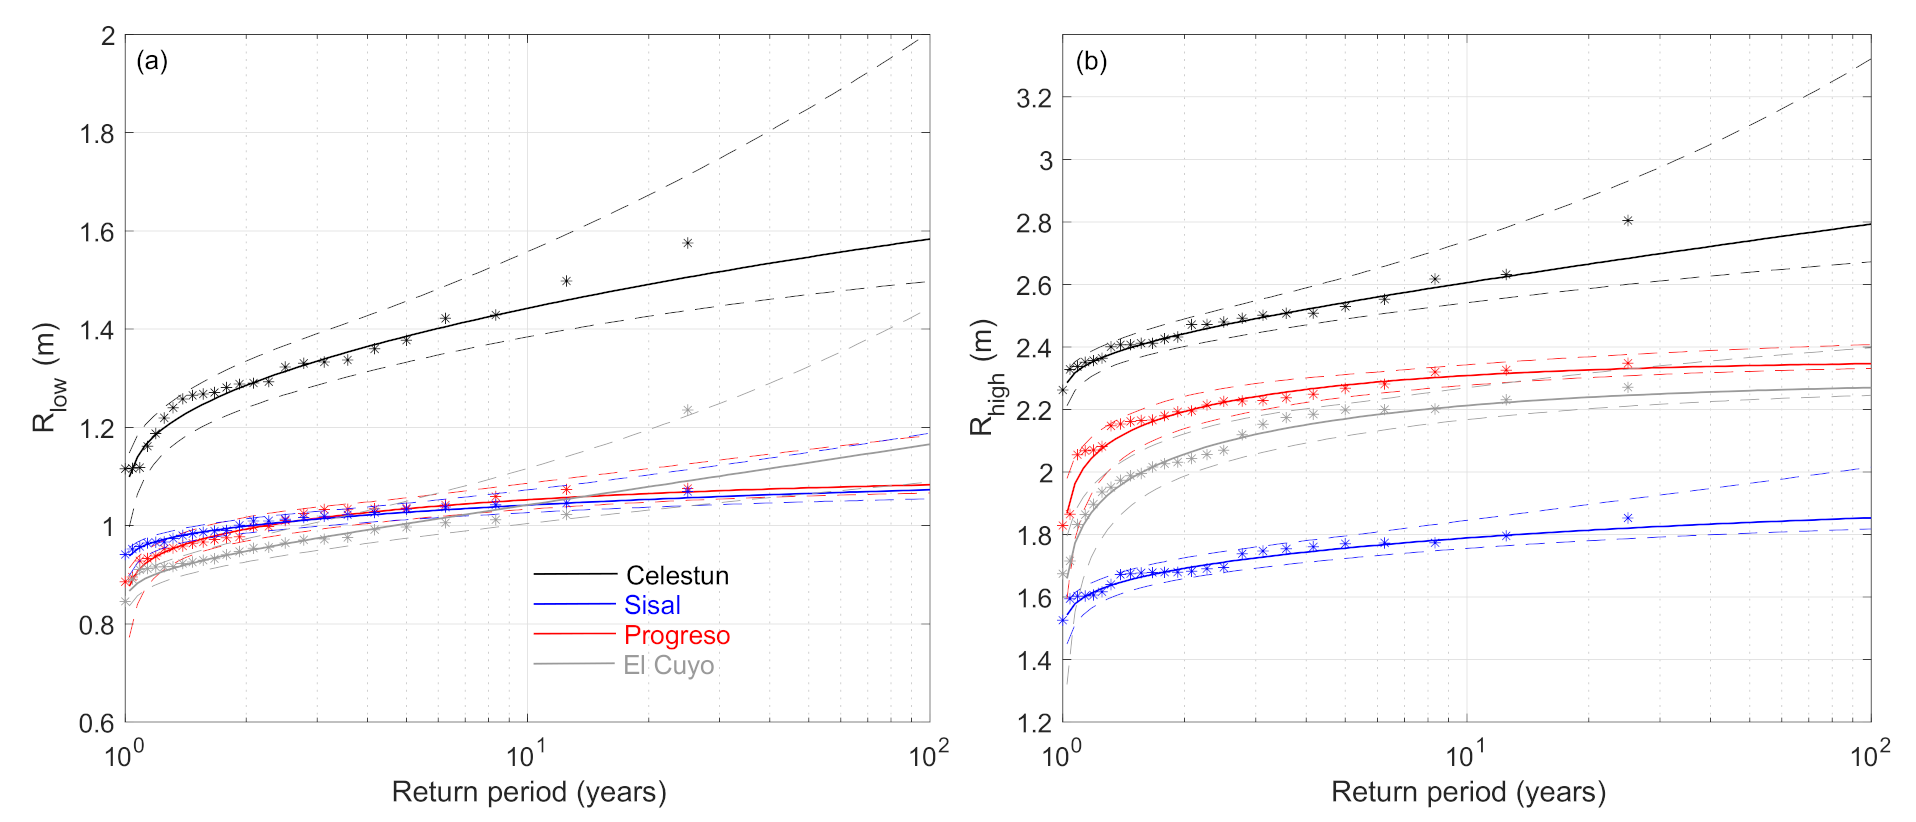
However, despite the similar wave forcing at all sites (Figure 1d–g and Figure 7), significant differences in the simulated water levels were found. These differences were clearly illustrated through results obtained in the extreme value analysis performed for Rhigh and Rlow (Figure 10). On one hand, the return Rlow values in the GEV model were very similar in Sisal, Progreso, and El Cuyo, whereas a significantly higher value was obtained in Celestun (Figure 10a), reaching a value up to 48% higher for a 100-year return period with respect to Sisal (68% considering upper bound values). This pattern was inversely correlated with the values of the average surf zone beach slope (Table 1). On the other hand, return values for Rhigh were found to be the lowest at Sisal, intermediate and of similar magnitude at El Cuyo and Progreso, reaching the maximum values at Celestun, with an increase of 22%, 26%, and 51%, respectively, for a 100-year return period with respect to Sisal (Figure 10b).

4.3.2. Extreme Water Levels: Mid-Century Conditions

To evaluate the potential effects of climate change on the wave runup, we considered mid-century wave conditions (2030–2054) for Sisal and compared them against present climate conditions. This site was selected given the well-preserved bar–berm–dune system to assess its sensitivity to flooding under future conditions. Figure 11 shows the Rlow and Rhigh extreme regimes under different climate scenarios.
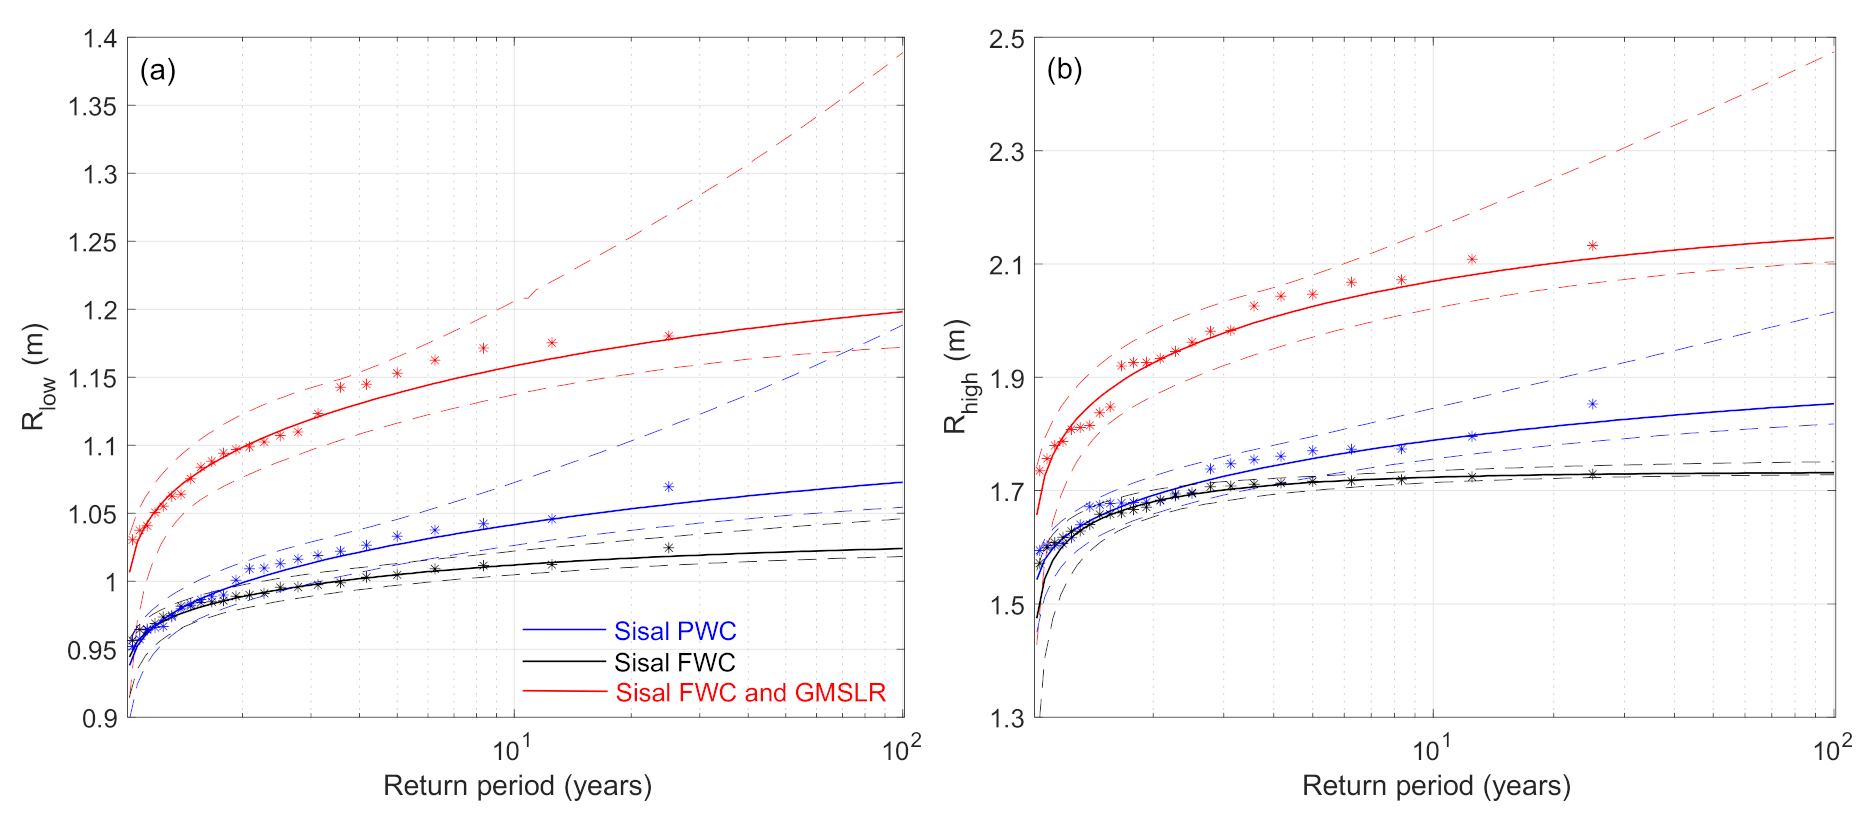
When only changes in wave conditions were compared, they presented very similar values for short return periods (<2 years), whereas a slight decrease in their values was observed for longer return periods under future wave conditions (RCP 8.5), reaching a difference in Rhigh of approximately 0.12 m (7% decrease) for the 100-year return period (0.26 m, 15% decrease, considering the upper bound values). These results indicate that extreme runup was not expected to increase in the study area under mid-century wave conditions for the tested scenario. On the other hand, if sea level rise was also included in the tested RCP 8.5 scenario (≈0.13–0.29 m for the period 2030–2054), a significant increase in total water level was observed, which indicated that SLR was the major hazard (indirectly) affecting changes in coastal flooding. Thus, Rhigh associated with the 100-year return period increased up to 24%, which corresponded to 0.41 m (41% increase, 0.72 m, for upper bound values), whereas Rlow increased up to 12%, which corresponded to 0.13 m (17% increase, 0.20 m, for upper bound values) (Figure 11b).
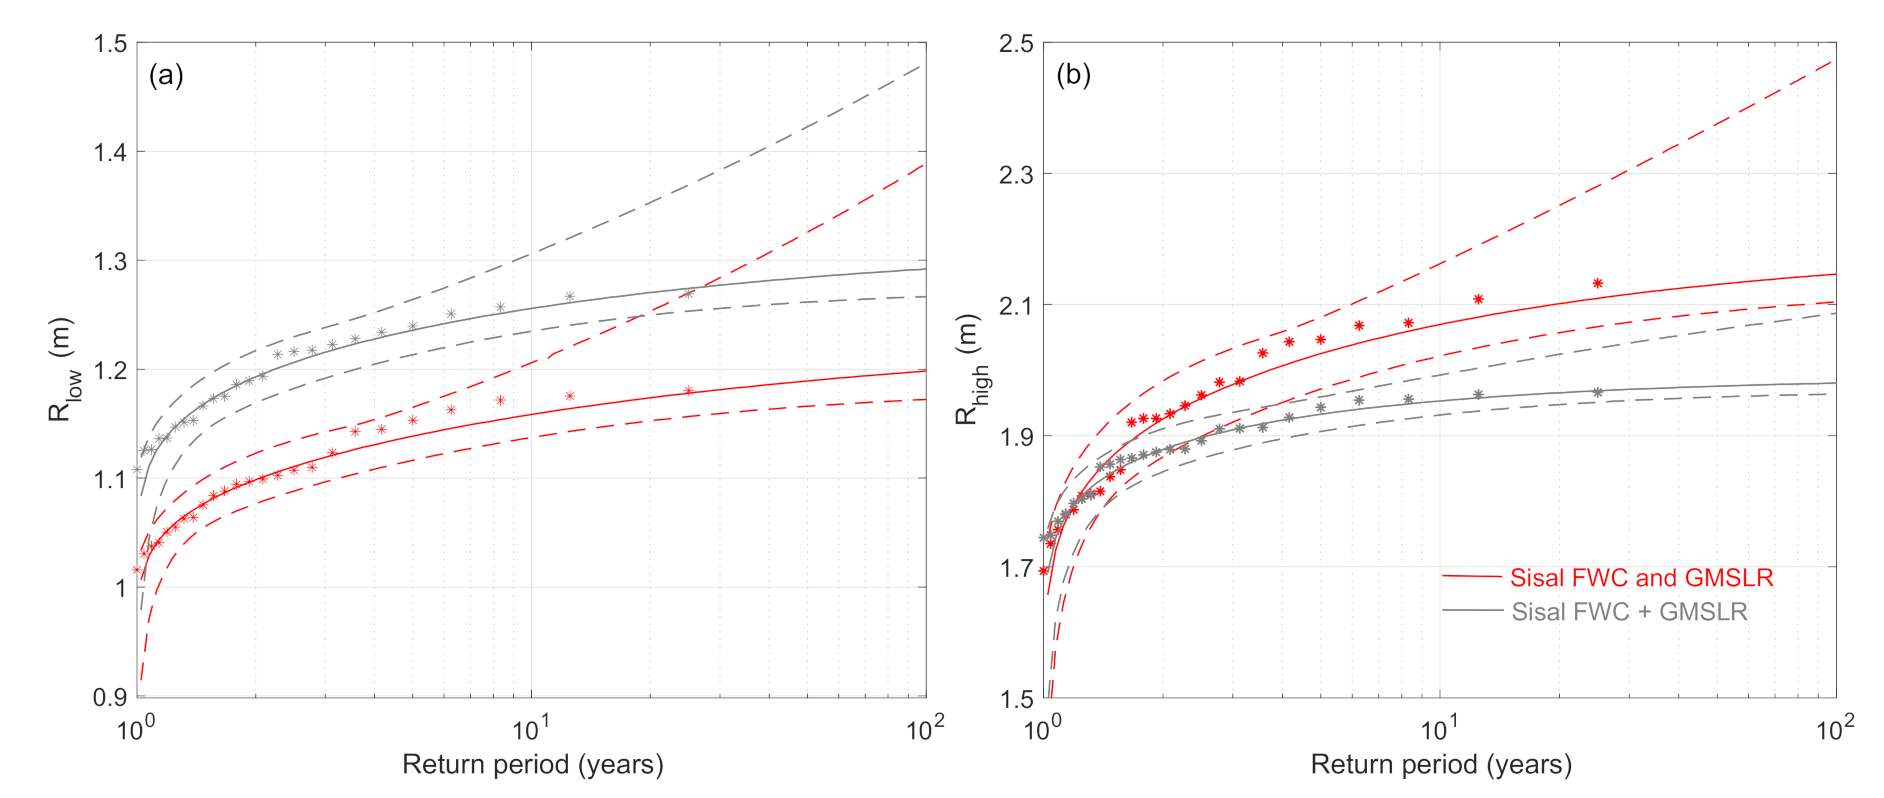
However, when the contribution of SLR was simply added to the resulting water levels associated to future wave conditions, instead of incorporating it prior to perform numerical simulations, the obtained distributions would underestimate the calculated Rhigh and overestimate Rlow for any given return period (Figure 12).

4.4. Storm Impact: Present and Mid-Century Conditions

The expected type of storm impact, determined by comparing the relative elevation between dune morphology and extreme water levels, showed significant variation between the four study sites (Table 2). The largest storm impact should be expected at Celestun and Progreso. The Overwash regime, where Rhigh was greater than the dune crest (Dhigh), was predicted for all return periods under present wave conditions (1980–2004). The Inundation regime, which happens when Rlow is higher than the dune crest, was predicted when considering the upper bound values at Celestun for the 100-year return period. The sites with the most preserved coastal dunes (El Cuyo and Sisal) should be subjected to the Collision regime (Dlow < Rhigh < Dhigh) for all return periods. However, Overwash regime was predicted at El Cuyo for 50- and 100-year return periods, when considering the upper bound values.
In order to assess the potential effect of climate change on the susceptibility of these types of systems to flooding, we evaluated the storm impact at the site with the best-preserved dune system, Sisal. Consistently with the results obtained for Rhigh in Sisal under future wave conditions (FWC, Figure 9), the impact regime was expected to be similar to the current one, PWC, leading to the Collision regime for all return periods (Table 3). When the effect of sea level rise was also accounted for, although the wave induced Rhigh increased (FWC and GMSLR, Figure 9), the storm impact regime only increased up to Overwash for the 50- and 100-year return period when upper bound values were considered.
Nevertheless, when the simple approach was employed to incorporate the GMSL projection, i.e., the addition of SLR to the obtained Rhigh and Rlow distribution, it would artificially reduce the expected storm impact for the upper-bound limits of water levels for the larger return periods (from Overwash to Collision).

5. Discussion

5.1. The Role of Beach Morphology

Previous studies have shown that the morphology of the beach profile (e.g., submerged sandbars) can explain at least as much of the variance in wave setup as the offshore wave height by controlling the dissipation of wave energy [19]. In this study, the presence of submerged sandbars at all sites, except for Celestun (Figure 8), induced further offshore wave breaking during storm events, tending to decrease Rlow values. Moreover, Celestun presented the smallest average surf zone beach slope (βav) and highest wave setup, followed by Sisal, Progreso, and El Cuyo, which presented increasing (decreasing) values of βav (setup) for short return periods. These two morphological characteristics, the absence of sandbars, and the lowest surf zone slope make Celestun more exposed to extreme wave-induced swash than the other sites (Figure 10a), although nearshore wave conditions are not so different (Figure 7). This is consistent with results of other studies stating that the setup near the shoreline increases with decreasing surf zone beach slope (e.g., [18]). Progreso shows the second highest Rhigh return values probably due to the lack of a well-developed berm (Figure 8c), which in the case of Sisal and El Cuyo was present and effectively reduced the swash excursion leading to runup saturation. Numerical results suggest that runup is strongly sensitive to the presence of all geomorphological features in the subaerial profile.
Ultimately, the storm impact and the resulting sensitivity of the hinterland depend on the dune toe and dune crest elevations. This was clearly detected in Progreso, the site with the lowest dune system, which was subjected to a higher impact than El Cuyo despite the fact that both sites have very similar extreme water level regimes. Thus, well-preserved dune–beach–sandbar systems resulted in reduced extreme water levels at the shoreline, as seen in the case of Sisal and El Cuyo, and lower impact regimes (Figure 10 and Table 2). These results highlight the importance of beach and dune conservation for coastal protection under the impact of extreme events.
In order to put obtained results in the right context, we must consider that beach morphology is highly dynamic (temporal variation) and presents alongshore differences (spatial variation). Presented results were obtained by using a representative beach profile in each site that has been measured on a specific date. The employed numerical model does not simulate sediment transport and morphological changes during the life of a storm. To properly characterize the storm impact along the entire study area, researchers should address spatial and temporal variations in beach/dune morphology (e.g., [54,55]).

5.2. The Role of Climate Change

Global wave energy intensification has been ascribed to climate change in previous studies (e.g., [56]); however, offshore wave conditions under the RCP 8.5 scenario, on the basis of a regional scale model, suggest that climate change affects the mean wave climate more severely, whereas the extreme events remain similar in the Gulf of Mexico (Figure 7).
Consistently with existing projections of wave conditions under the RCP 8.5 scenario, extreme water levels at the shoreline will not be significantly affected by climate change unless the indirect effect of sea level rise is accounted for (see Figure 11). This stresses the role of sea level rise in controlling the future evolution of these barrier systems by modulating storm impacts. In this study, this role has been estimated by first increasing the mean sea level according to the RCP8.5 GMSLR projection for the period 2030–2054, and then computing extreme water levels at the shoreline after propagating waves by using the combination of the SWASH and SWAN models.
This adopted approach is different to the usually employed when analyzing the indirect effect of sea level rise on wave-induced water levels at the shoreline, where the future extreme regime is simply calculated by adding the magnitude of sea level rise to the distribution obtained without SLR (e.g., [7]). It has been shown that the obtained distributions comparing both approaches differ significantly (Figure 12), highlighting the non-linear effects of sea level rise on wave-induced water levels at the shoreline, and emphasizing the importance of properly assessing it through wave propagation and runup and setup computations. As a result of this, and depending on the magnitude of the difference between both approaches, the predicted storm impact could change for a given scenario as a function of the adopted approach. The employed approach is implicitly assuming that the beach profile will not respond (or will respond very slowly) to sea level rise, otherwise the profile will readapt to new mean sea level conditions (see e.g., [57]). In any case, it should be crucial for the fate of the barrier to avoid disturbances in the sediment dynamics that may affect its natural resilience by reducing its capacity to accommodate to future sea level conditions.
SLR will also have an effect on breaker angle due to changes in refraction, especially in beaches with oblique wave approach and shallow foreshore [58], such as the ones in the Yucatan Coast. This effect would have an impact in runup and longshore transport, which will affect the overall morphology of the dune system [58]. The present results obtained by means of 1-D SWASH simulations did not address the effect of SLR on wave refraction across the beach profile; therefore, 2-D morphodynamic model simulations at specific areas would allow for a better understanding on the feedback between hydrodynamics and morphological changes.

6. Conclusions

The role of wind-generated waves and beach morphology on wave runup and storm impact on the northern Yucatan peninsula was investigated through field observations and numerical models.
The present work shows that subaerial and submerged morphological features such as the average surf zone beach slope, sandbars, foreshore slope, berm, and dune elevation play an important role in controlling extreme water levels and expected storm-induced morphological impact. They control wave energy dissipation and runup limitation during storm events, making evident the need to incorporate their effect to properly predict the expected magnitude of extreme water levels.
The effects of climate change on the best-preserved barrier section of the area are only significant for the RCP8.5 scenario when changes in wave climate are combined with projected sea level rise. Under this combined scenario, extreme water levels at the selected site will significantly increase with respect to current conditions. It has to be noted that most of the contribution to this increase is due to sea level rise, since future wave storminess will not change. In spite of this, the existence of a well-developed dune prevents a shift in the storm impact regime, stressing the importance of preserving beach/dune morphology to naturally provide protection to the hinterland.
Although the role of SLR is dominant, numerical results suggest that its effect on extreme water levels cannot be accurately predicted, as it is usually done, by simply adding the magnitude of sea level rise to the extreme Ru distribution. To properly reflect the observed role of subjacent beach-surf zone morphology on swash dynamics, we must calculate extreme water levels after wave propagation once the mean sea level has been adjusted according to SLR.

Author Contributions

Conceptualization, G.M.; methodology, G.M. and J.A.J.; formal analysis, M.M. and G.M.; investigation, G.M., M.M., C.M.A., and R.C.-M.; writing—original draft preparation, G.M.; writing—review and editing, J.A.J., M.M., and C.M.A.; visualization, G.M.; supervision, G.M. and J.A.J.; funding acquisition, R.C.-M. and G.M. All authors have read and agreed to the published version of the manuscript.

Funding

This research was funded by CONACYT through projects APN-4890, CB-284819 and Cátedras 1146, and by the UNAM Engineering Institute (project 9601).

Institutional Review Board Statement

Not applicable.

Informed Consent Statement

Not applicable.

Data Availability Statement

Field measurements are available upon request.

Acknowledgments

We acknowledge José López González, Juan Alberto Gómez Liera, and Alec Torres-Freyermuth for field support, Gonzalo Martín Ruiz and Pablo Ruiz-Salcines for IT technical support. We thank Delft University of Technology for making the development of SWAN and SWASH models possible.

Conflicts of Interest

The authors declare no conflict of interest. The funders had no role in the design of the study; in the collection, analyses, or interpretation of data; in the writing of the manuscript; or in the decision to publish the results.

References

  1. Wong, P.P.; Losada, I.J.; Gattuso, J.-P.; Hinkel, J.; Khattabi, A.; McInnes, K.L.; Saito, Y.; Sallenger, A. Coastal systems and low-lying areas. In Climate Change 2014: Impacts, Adaptation, and Vulnerability. Part A: Global and Sectoral Aspects; Field, C.B., Barros, V.R., Dokken, D.J., Mach, K.J., Mastrandrea, M.D., Bilir, T.E., Chatterjee, M., Ebi, K.L., Estrada, Y.O., Genova, R.C., et al., Eds.; Contribution of Working Group II to the Fifth Assessment Report of the Intergovernmental Panel on Climate Change; Cambridge University Press: Cambridge, UK; New York, NY, USA, 2014; pp. 361–409. [Google Scholar]
  2. Neumann, B.; Vafeidis, A.T.; Zimmermann, J.; Nicholls, R.J. Future Coastal Population Growth and Exposure to Sea-Level Rise and Coastal Flooding—A Global Assessment. PLoS ONE 2015, 10, e0118571. [Google Scholar] [CrossRef] [PubMed] [Green Version]
  3. Narayan, S.; Beck, M.W.; Reguero, B.G.; Losada, I.J.; Van Wesenbeeck, B.; Pontee, N.; Sanchirico, J.N.; Ingram, J.C.; Lange, G.-M.; Burks-Copes, K.A. The Effectiveness, Costs and Coastal Protection Benefits of Natural and Nature-Based Defences. PLoS ONE 2016, 11, e0154735. [Google Scholar] [CrossRef] [PubMed] [Green Version]
  4. Kulp, S.A.; Strauss, B.H. New elevation data triple estimates of global vulnerability to sea-level rise and coastal flooding. Nat. Commun. 2019, 10, 4844. [Google Scholar] [CrossRef] [PubMed] [Green Version]
  5. Dodet, G.; Melet, A.; Ardhuin, F.; Bertin, X.; Idier, D.; Almar, R. The Contribution of Wind-Generated Waves to Coastal Sea-Level Changes. Surv. Geophys. 2019, 40, 1563–1601. [Google Scholar] [CrossRef] [Green Version]
  6. Melet, A.; Meyssignac, B.; Almar, R.; Le Cozannet, G. Under-estimated wave contribution to coastal sea-level rise. Nat. Clim. Chang. 2018, 8, 234–239. [Google Scholar] [CrossRef]
  7. Vitousek, S.; Barnard, P.L.; Fletcher, C.H.; Frazer, N.; Erikson, L.; Storlazzi, C.D. Doubling of coastal flooding frequency within decades due to sea-level rise. Sci. Rep. 2017, 7, 1–9. [Google Scholar] [CrossRef]
  8. Holman, R.A.; Sallenger, A.H. Setup and swash on a natural beach. J. Geophys. Res. Space Phys. 1985, 90, 945. [Google Scholar] [CrossRef]
  9. Stockdon, H.F.; Holman, R.A.; Howd, P.A.; Sallenger, A.H. Empirical parameterization of setup, swash, and runup. Coast. Eng. 2006, 53, 573–588. [Google Scholar] [CrossRef]
  10. Poate, T.G.; McCall, R.T.; Masselink, G. A new parameterisation for runup on gravel beaches. Coast. Eng. 2016, 117, 176–190. [Google Scholar] [CrossRef] [Green Version]
  11. Dodet, G.; Leckler, F.; Sous, D.; Ardhuin, F.; Filipot, J.F.; Suanez, S. Wave Runup over Steep Rocky Cliffs. J. Geophys. Res. Ocean. 2018, 123, 7185–7205. [Google Scholar] [CrossRef]
  12. Didier, D.; Caulet, C.; Bandet, M.; Bernatchez, P.; Dumont, D.; Augereau, E.; Floc’H, F.; Delacourt, C. Wave runup parameterization for sandy, gravel and platform beaches in a fetch-limited, large estuarine system. Cont. Shelf Res. 2020, 192, 104024. [Google Scholar] [CrossRef]
  13. Da Silva, P.G.; Coco, G.; Garnier, R.; Klein, A.H.F. On the prediction of runup, setup and swash on beaches. Earth Sci. Rev. 2020, 204, 103148. [Google Scholar] [CrossRef]
  14. Brinkkemper, J.A.; Torres-Freyermuth, A.; Mendoza, E.T.; Ruessink, B.G. Parameterization of wave run-up on beaches in Yucatan, Mexico: A numerical study. Coast. Dynam. 2013, 25, 225–234. [Google Scholar]
  15. Cohn, N.; Ruggiero, P. The influence of seasonal to interannual nearshore profile variability on extreme water levels: Model-ing wave runup on dissipative beaches. Coast. Eng. 2016, 115, 79–92. [Google Scholar] [CrossRef]
  16. Passarella, M.; Goldstein, E.B.; De Muro, S.; Coco, G. The use of genetic programming to develop a predictor of swash excur-sion on sandy beaches. Nat. Hazards Earth Syst. Sci. 2018, 18, 599–611. [Google Scholar] [CrossRef] [Green Version]
  17. Fiedler, J.W.; Young, A.P.; Ludka, B.C.; O’Reilly, W.C.; Henderson, C.; Merrifield, M.A.; Guza, R.T. Predicting site-specific storm wave run-up. Nat. Hazards 2020, 104, 493–517. [Google Scholar] [CrossRef]
  18. Raubenheimer, B.; Guza, R.T.; Elgar, S. Field observations of wave-driven setdown and setup. J. Geophys. Res. Space Phys. 2001, 106, 4629–4638. [Google Scholar] [CrossRef] [Green Version]
  19. Stephens, S.A.; Coco, G.; Bryan, K.R. Numerical simulations of wave setup overbarred beach profiles: Implications for pre-dictability. J. Waterw. Port Coast. Ocean Eng. 2011, 137, 175–181. [Google Scholar] [CrossRef]
  20. Cox, N.; Dunkin, L.M.; Irish, J.L. An empirical model for infragravity swash on barred beaches. Coast. Eng. 2013, 81, 44–50. [Google Scholar] [CrossRef]
  21. Appendini, C.M.; Torres-Freyermuth, A.; Salles, P.; López-González, J.; Mendoza, E.T. Wave Climate and Trends for the Gulf of Mexico: A 30-Yr Wave Hindcast. J. Clim. 2014, 27, 1619–1632. [Google Scholar] [CrossRef]
  22. Ojeda, E.; Appendini, C.M.; Mendoza, E.T. Storm-wave trends in Mexican waters of the Gulf of Mexico and Caribbean Sea. Nat. Hazards Earth Syst. Sci. 2017, 17, 1305–1317. [Google Scholar] [CrossRef] [Green Version]
  23. Appendini, C.M.; Pedrozo-Acuña, A.; Meza-Padilla, R.; Torres-Freyermuth, A.; Cerezo-Mota, R.; López-González, J.; Ruiz-Salcines, P. On the Role of Climate Change on Wind Waves Generated by Tropical Cyclones in the Gulf of Mexico. Coast. Eng. J. 2017, 59, 1740001. [Google Scholar] [CrossRef]
  24. Appendini, C.M.; Hernández-Lasheras, J.; Meza-Padilla, R.; Kurczyn, J.A. Effect of climate change on wind waves generated by anticyclonic cold front intrusions in the Gulf of Mexico. Clim. Dyn. 2018, 51, 3747–3763. [Google Scholar] [CrossRef]
  25. Mendoza, E.T.; Trejo-Rangel, M.A.; Salles, P.; Appendini, C.M.; López-González, J.; Torres-Freyermuth, A. Storm characteri-zation and coastal hazards in the Yucatan Peninsula. J. Coast. Res. 2013, 65, 790–795. [Google Scholar] [CrossRef]
  26. Rey, W.; Salles, P.; Torres-Freyermuth, A.; Ruíz-Salcines, P.; Teng, Y.-C.; Appendini, C.M.; Quintero-Ibáñez, J. Spatiotem-poral Storm Impact on the Northern Yucatan Coast during Hurricanes and Central American Cold Surge Events. J. Mar. Sci. Eng. 2020, 8, 2. [Google Scholar] [CrossRef] [Green Version]
  27. Bautista, F.; Frausto, O.; Ihl, T.; Aguilar, Y. An update soil map of The Yucatan State, Mexico: Geomorphopedological approach and WRB. Ecosistemas Recur. Agropecu. 2015, 2, 303–315. [Google Scholar]
  28. Enriquez, C.; Mariño-Tapia, I.J.; Herrera-Silveira, J.A. Dispersion in the Yucatan coastal zone: Implications for red tide events. Cont. Shelf Res. 2010, 30, 127–137. [Google Scholar] [CrossRef]
  29. Valle-Levinson, A.; Mariño-Tapia, I.; Enriquez, C.; Waterhouse, A.F. Tidal variability of salinity and velocity fields related to intense point-source submarine groundwater discharges into the coastal ocean. Limnol. Oceanogr. 2011, 56, 1213–1224. [Google Scholar] [CrossRef]
  30. Appendini, C.M.; Salles, P.; Mendoza, E.T.; López, J.; Torres-Freyermuth, A. Longshore Sediment Transport on the Northern Coast of the Yucatan Peninsula. J. Coast. Res. 2012, 285, 1404–1417. [Google Scholar] [CrossRef]
  31. Reding, P.J. The Central American Cold Surge: An Observational Analysis of the Deep Southward Penetration of North American Cold Fronts. Master’s Thesis, Texas A&M University, College Station, TX, USA, 1992. [Google Scholar]
  32. Pérez, E.P.; Magaña, V.; Caetano, E.; Kusunoki, S. Cold surge activity over the Gulfof Mexico in a warmer climate. Front. Earth Sci. 2014, 17, 1539–1560. [Google Scholar]
  33. Medellín, G.; Torres-Freyermuth, A. Morphodynamics along a micro-tidal sea breeze dominated beach in the vicinity of coastal structures. Mar. Geol. 2019, 417, 106013. [Google Scholar] [CrossRef]
  34. Fraga, J. Los Habitantes de la Zona Costera de Yucatán: Entre la Tradición y la Modernidad. In En: El Manejo Costero en México; Universidad Autónoma de Campeche, SEMARNAT, CETYS-Universidad; Rivera, E., Ed.; Universidad de Quintana Roo: Chetumal, Mexico, 2004; pp. 497–506. [Google Scholar]
  35. INEGI. Panorama sociodemográfico de Yucatán. Censo de Población y vivienda 2010; Instituto Nacional de Estadística y Geografía: Aguascalientes, Mexico, 2011; 234p, ISBN 978-607-494-196-8. Available online: http://coespo.yucatan.gob.mx/general/31_Panorama_Yuc.pdf (accessed on 16 April 2021).
  36. POETCY. Programa de Ordenamiento Ecológico del Territorio Costero de Yucatán: Informe Final; Centro de Investigación y de estudios Avanzados del IPN; Unidad Mérida; Centro de Investigación Científica de Yucatán; Instituto Tecnológico de Conkal; Instituto Tecnológico de Mérida; Universidad Autónoma de Yucatán: Mérida, Mexico, 2007. [Google Scholar]
  37. Sørensen, O.R.; Kofoed-Hansen, H.; Rugbjerg, M.; Sørensen, L.S. A third-generation spectral wave model using an unstruc-tured finite volume technique. In Proceedings of the 29th International Conference on Coastal Engineering ASCE, Lisbon, Portugal, 19–24 September 2004; pp. 894–906. [Google Scholar]
  38. Tolman, H.L. Alleviating the Garden Sprinkler Effect in wind wave models. Ocean Model. 2002, 4, 269–289. [Google Scholar] [CrossRef]
  39. Appendini, C.M.; Torres-Freyermuth, A.; Oropeza, F.; Salles, P.; López, J.; Mendoza, E.T. Wave modeling performance in the Gulf of Mexico and Western Caribbean: Wind reanalyses assessment. Appl. Ocean Res. 2013, 39, 20–30. [Google Scholar] [CrossRef]
  40. National Geodetic Survey. Available online: https://geodesy.noaa.gov/GEOID/MEXICO97/ (accessed on 8 April 2021).
  41. Camus, P.; Mendez, F.J.; Medina, R. A hybrid efficient method to downscale wave climate to coastal areas. Coast. Eng. 2011, 58, 851–862. [Google Scholar] [CrossRef]
  42. Medellín, G.; Brinkkemper, J.A.; Torres-Freyermuth, A.; Appendini, C.M.; Mendoza, E.T.; Salles, P. Run-up parameteri-zation and beach vulnerability assessment on a barrier island: A downscaling approach. Nat. Hazards Earth Syst. Sci. 2016, 16, 167–180. [Google Scholar] [CrossRef] [Green Version]
  43. Franklin, G.L.; Torres-Freyermuth, A.; Medellin, G.; Allende-Arandia, M.E.; Appendini, C.M. The role of the reef–dune system in coastal protection in Puerto Morelos (Mexico). Nat. Hazards Earth Syst. Sci. 2018, 18, 1247–1260. [Google Scholar] [CrossRef] [Green Version]
  44. Rueda, A.; Cagigal, L.; Pearson, S.; Antolínez, J.A.; Storlazzi, C.; van Dongeren, A.; Camus, P.; Mendez, F.J. HyCReWW: A Hybrid Coral Reef Wave and Water level metamodel. Comput. Geosci. 2019, 127, 85–90. [Google Scholar] [CrossRef]
  45. CICESE Predmar. Available online: http://predmar.cicese.mx/ (accessed on 8 April 2021).
  46. Church, J.A.; Clark, P.U.; Cazenave, A.; Gregory, J.M.; Jevrejeva, S.; Levermann, A.; Merrifield, M.A.; Milne, G.A.; Nerem, R.S.; Nunn, P.D.; et al. Sea Level Change. In Climate Change 2013: The Physical Science Basis, Contribution of Working Group I to the Fifth Assessment Report of the Intergovernmental Panel on Climate Change; Stocker, T.F., Qin, D., Plattner, G.-K., Tignor, M., Allen, S.K., Boschung, A.J., Nauels, Y., Xia, V.B., Midgley, P.M., Eds.; Cambridge University Press: Cambridge, UK; New York, NY, USA, 2013. [Google Scholar]
  47. Booij, N.; Ris, R.C.; Holthuijsen, L.H. A third-generation wave model for coastal regions: 1. Model description and validation. J. Geophys. Res. Space Phys. 1999, 104, 7649–7666. [Google Scholar] [CrossRef] [Green Version]
  48. Zijlema, M.; Stelling, G.; Smit, P. SWASH: An operational public domain code for simulating wave fields and rapidly varied flows in coastal waters. Coast. Eng. 2011, 58, 992–1012. [Google Scholar] [CrossRef]
  49. Sallenger, A.H. Storm impact scale for barrier islands. J. Coast. Res. 2000, 16, 890–895. [Google Scholar]
  50. Franke, R. Scattered data interpolation: Tests of some methods. Math. Comp. 1982, 48, 181–200. [Google Scholar]
  51. Fasshauer, G.E.; Zhang, J.G. On choosing “optimal” shape parameters for RBF approximation. Numer. Algor. 2007, 45, 345–368. [Google Scholar] [CrossRef]
  52. Jenkinson, A.F. The frequency distribution of the annual maximum (or minimum) values of meteorological elements. Q. J. R. Meteorol. Soc. 1955, 81, 158–171. [Google Scholar] [CrossRef]
  53. WAFO-Group. A Matlab Toolbox for Analysis of Random Waves and Loads—A Tutorial; Lund University: Lund, Sweden, 2000. [Google Scholar]
  54. Stockdon, H.F.; Sallenger, A.H., Jr.; Holman, R.A.; Howd, P.A. A simple model for the spatially-variable coastal response to hurricanes. Mar. Geol. 2007, 238, 1–20. [Google Scholar] [CrossRef]
  55. Masselink, G.; van Heteren, S. Response of wave-dominated and mixed-energy barriers to storms. Mar. Geol. 2014, 352, 321–347. [Google Scholar] [CrossRef] [Green Version]
  56. Reguero, B.G.; Losada, I.J.; Méndez, F.J. A recent increase in global wave power as a consequence of oceanic warming. Nat. Commun. 2019, 10, 1–14. [Google Scholar] [CrossRef] [Green Version]
  57. Ashton, A.D.; Lorenzo-Trueba, J. Morphodynamics of Barrier Response to Sea-Level Rise. In Barrier Dynamics and Response to Changing Climate; Springer Science and Business Media: Berlin/Heidelberg, Germany, 2018; pp. 277–304. [Google Scholar]
  58. Dornbusch, U. Design requirement for mixed sand and gravel beach defences under scenarios of sea level rise. Coast. Eng. 2017, 124, 12–24. [Google Scholar] [CrossRef]
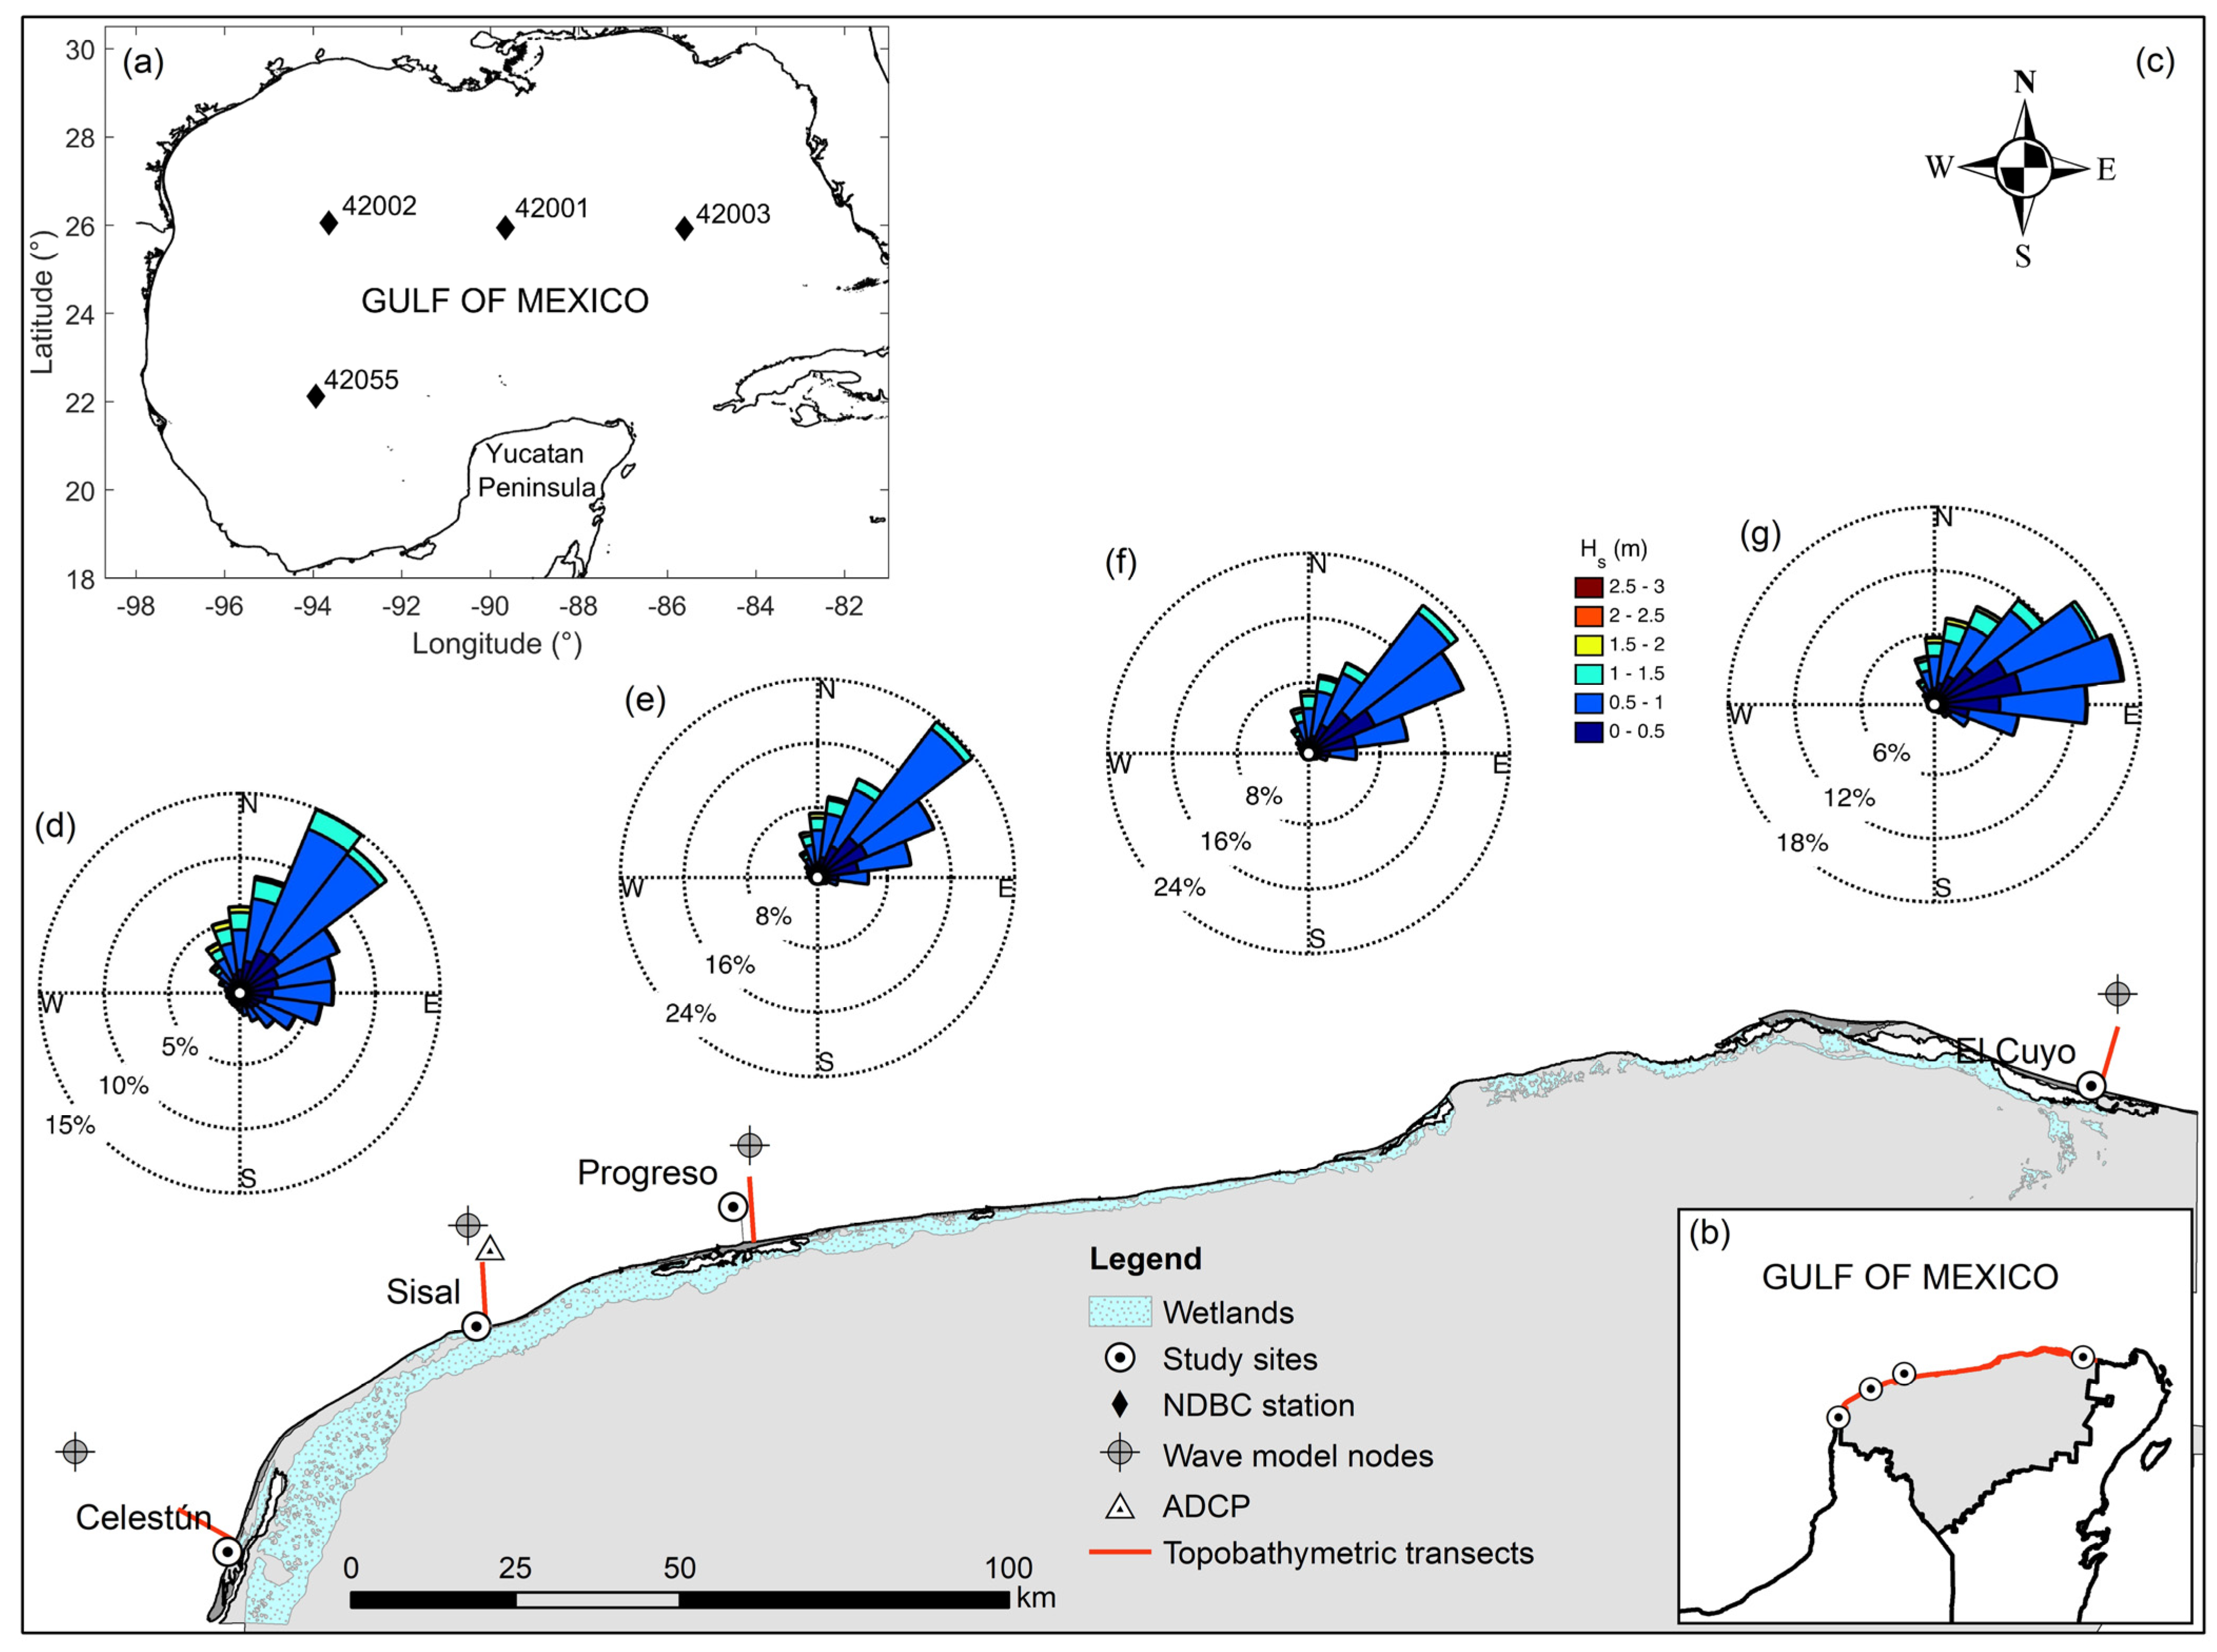
Figure 1. Study area location (a) within the Gulf of Mexico, showing (b) the northern Yucatan coast and (c) the barrier island, wetlands, and the four study sites with its corresponding topo-bathymetric transect and wave rose associated to the wave model node for present wave conditions (1980–2004) at 10 m depth in front of (d) Celestun, (e) Sisal, (f) Progreso, and (g) El Cuyo (Yucatan base map data from: POETCY [36]).
Jmse 09 00518 g001
Figure 2. Quantile plots (QQ plots) for deep-water wave model results validation using NDBC buoys 42001, 42002, 42003, and 42055 located in the Gulf of Mexico.
Jmse 09 00518 g002
Figure 3. Quantile plots (QQ plots) for nearshore wave model results validation with data from an ADCP located at 10 m depth in Sisal.
Jmse 09 00518 g003
Figure 4. Topo-bathymetric profiles undertaken on August 8–14 2019 at (a) Celestun, (b) Sisal, (c) Progreso, and (d) El Cuyo, showing the section used for SWAN simulations in blue (h < −4 m) and the section used for SWASH simulations in red (h > −4 m).
Jmse 09 00518 g004
Figure 5. Time series of wave and tide conditions: (a) significant wave height, (b) peak wave period, (c) wave direction, and (d) astronomical tide at Sisal showing the selected cases for simulation in red.
Jmse 09 00518 g005
Figure 6. (a) Snapshot of the instantaneous free-surface elevation and water level at the shoreline, h(t), in SWASH model simulation; (b) a section of the time series of water level indicating the runup maxima, R, and the setup <η > at the shoreline; (c) normal and empirical cdf showing the 2% exceedance R value. Wave and tide conditions for this simulated case are Hs = 0.96 m, Tp = 10.2 s, Dir = 275.86°, Z = −0.37 m, and computed R2% = 0.73 m.
Jmse 09 00518 g006
Figure 7. QQ plot of present (1980–2004) vs. future (2030–2054) significant wave height at (a) Celestun, (b) Sisal, (c) Progreso, and (d) El Cuyo.
Jmse 09 00518 g007
Figure 8. Beach dune profiles measured at (a) Celestun, (b) Sisal, (c) Progreso, and (d) El Cuyo used for SWASH simulations from 4 m water depth to the shore. Note that subplot (a) presents a different horizontal scale.
Jmse 09 00518 g008
Figure 9. Timeseries of (a) Rhigh and (b) Rlow showing the computed values (red dots) used for the RBF interpolation at Sisal for present wave conditions.
Jmse 09 00518 g009
Figure 10. Return values in the GEV model for the extreme water levels (a) Rlow and (b) Rhigh corresponding to different return periods for the four study sites: Celestun, Sisal, Progreso and El Cuyo. Dashed lines correspond to the associated 95% confidence intervals, and annual maxima data are represented by asterisks.
Jmse 09 00518 g010
Figure 11. Return values in the GEV model for the extreme water levels (a) Rlow and (b) Rhigh at Sisal corresponding to different return periods for present wave conditions (PWC) and future wave conditions (FWC) including the global mean sea level rise (GMSLR) projection under the RCP8.5 scenario. Dashed lines correspond to the associated 95% confidence intervals, and annual maxima data are represented by asterisks.
Jmse 09 00518 g011
Figure 12. Return values in the GEV model for the extreme water levels (a) Rlow and (b) Rhigh at Sisal corresponding to different return periods for future wave conditions (FWC) including the global mean sea level rise (GMSLR) projection under the RCP8.5 scenario for simulations of Rlow and Rhigh (FWC and GMSLR) versus adding the GMSLR projection to predicted Rlow and Rhigh values (FWC and GMSLR). Dashed lines correspond to the associated 95% confidence intervals, and annual maxima data are represented by asterisks.
Jmse 09 00518 g012
Table 1. Measured values of the dune toe (Dlow) and dune crest (Dhigh) elevation; foreshore slope, βf, and average surf zone slope, βav, for each site.
Study SiteDlow (m)Dhigh (m)βfβav
Celestun0.921.970.0990.003
Sisal0.842.340.1240.006
Progreso0.781.670.0750.008
El Cuyo0.662.290.1180.008
Table 2. Storm impact regime associated with different return periods for present wave conditions (1980–2004) at each study site. Regime corresponding to the upper confidence interval is shown in parentheses when different.
Study SiteReturn Period (Years)
51050100
CelestunOverwashOverwashOverwashOverwash (Inundation)
SisalCollisionCollisionCollisionCollision
ProgresoOverwashOverwashOverwashOverwash
El CuyoCollisionCollisionCollision (Overwash)Collision (Overwash)
Table 3. Storm impact regime at Sisal associated with different return periods corresponding to present wave conditions (PWC), future wave conditions (FWC) for the RCP8.5 scenario, and future wave conditions including the global mean sea level rise projection (FWC and GMSLR) for the RCP8.5 scenario. Regime corresponding to the upper confidence interval is shown in parentheses when different.
Study Site: SisalReturn Period (Years)
51050100
PWC (1980–2004)CollisionCollisionCollisionCollision
FWC (2030–2054)CollisionCollisionCollisionCollision
FWC and GMSLRCollisionCollisionCollision (Overwash)Collision (Overwash)
Publisher’s Note: MDPI stays neutral with regard to jurisdictional claims in published maps and institutional affiliations.