Article

Disruption of the Atlantic Meridional Circulation during Deglacial Climates Inferred from Planktonic Foraminiferal Shell Weights

by
Stergios D. Zarkogiannis
Department of Earth Sciences, University of Oxford, South Parks Road, Oxford OX1 3AN, UK
J. Mar. Sci. Eng. 2021, 9(5), 519; https://doi.org/10.3390/jmse9050519
Submission received: 16 April 2021 / Revised: 6 May 2021 / Accepted: 7 May 2021 / Published: 11 May 2021
(This article belongs to the Special Issue Climate Change and Marine Geological Dynamics)

Abstract

:
Changes in the density structure of the upper oceanic water masses are an important forcing of changes in the Atlantic Meridional Overturning Circulation (AMOC), which is believed to widely affect Earth’s climate. However, very little is known about past changes in the density structure of the Atlantic Ocean, despite being extensively studied. The physical controls on planktonic foraminifera calcification are explored here, to obtain a first-order approximation of the horizontal density gradient in the eastern Atlantic during the last 200,000 years. Published records of Globigerina bulloides shells from the North and Tropical eastern Atlantic were complemented by the analysis of a South Atlantic core. The masses of the same species shells from three different dissolution assessed sediment cores along the eastern Atlantic Ocean were converted to seawater density values using a calibration equation. Foraminifera, as planktonic organisms, are subject to the physical properties of the seawater and thus their shells are sensitive to buoyancy forcing through surface temperature and salinity perturbations. By using planktonic foraminifera shell weight as an upper ocean density proxy, two intervals of convergence of the shell masses are identified during cold intervals of the last two deglaciations that may be interpreted as weak ocean density gradients, indicating nearly or completely eliminated meridional circulation, while interhemispheric Atlantic density differences appear to alleviate with the onset of the last interglacial. The results confirm the significance of variations in the density of Atlantic surface waters for meridional circulation changes.

1. Introduction

The Atlantic Meridional Overturning Circulation (AMOC) is a system of ocean currents that has an essential role in Earth’s climate, redistributing heat and influencing the carbon cycle [1,2]. It is a basin-scale baroclinic ocean circulation with a northward flow of warm water and a cold return flow at depth [3]. During its northward travel, the surface water exchanges heat with the atmosphere, modifying the climate of the Northern Atlantic region and contributing to the relatively mild climate in Europe. This overturning circulation is a meridional plane portrait of a much more complex three-dimensional circulation in the Atlantic, which can be conditionally split into wind-driven and thermohaline circulations [4]. This latter circulation depends in part on oceanic density gradients and hence on temperature and salinity gradients controlled by warming/cooling and evaporation/precipitation at the surface of the ocean.
Progress in the reconstruction of past Atlantic circulation changes has revealed that AMOC reductions coincided with colder episodes within the Last Glacial, especially Heinrich Events [5,6]. Additionally, a prominent chemocline has been identified in the North Atlantic during the Last Glacial Maximum (LGM) and Heinrich Event 1 (H1) [6], which suggests an altered deep-water circulation state. However, so far hardly anything is known about the past subsurface density structure in the North Atlantic [7], while it is still poorly constrained beyond the LGM. As this structure is fundamental for understanding deep-water circulation [8], it is critically important that new means are established for assessing changes in oceanic vertical density structures. I present new insight into this structure in the eastern Atlantic from a novel approach that centers on the physical controls on planktonic foraminifera biomineralization through time.
Although the effects of ocean chemistry on plankton are being extensively studied, there is a lack in the literature about the effects of physical oceanic properties such as buoyancy or pressure, which very likely affect foraminifera physiology and morphology [9]. Different foraminifera species have different optimum living depth habitats [10,11], to which they adapt according to the oceanic inhomogeneity. These organisms are able to biosynthesize out of equilibrium with their ambient environment by maintaining chemical gradients [12,13,14]; however, as plankton they must thus always retain equilibrium with the seawater to remain floating. It can thus be argued that plankton physiology is more sensitive to the physical rather than the chemical characteristics of seawater. In order to inhabit certain depths, planktonic foraminifera should regulate their (cell) density to match that of the surrounding liquid in which they are immersed. Should this not be the case, then the organisms must relocate until they reach a particular density horizon to equilibrate.
Foraminifera may have different strategies (e.g., storage of metabolic gases) for short-term displacement or micro-positioning in the water column, such as diurnal migrations, but compared to gasses and lipids the most inert way for non-motile plankton to regulate buoyancy in the long term is by biomineralization [15,16]. Based on the foraminiferal need for certain habitat acquisition and recent findings on the influence of surface ocean density on their calcification [17], the application of foraminifera shell weights as a (paleo)seawater density proxy is introduced here as a means to reconstruct paleoseawater density and stratification of the surface Atlantic Ocean and thus the rigorousness of its meridional overturning circulation. For this purpose, synchronous sieve-based shell weights of the planktonic foraminifera species G. bulloides are compared across three Atlantic locations. G. bulloides is a subsurface, cosmopolitan foraminifera species with a wide use in paleoceanographic studies that thus allowed for the comparison of the results of a new S. Atlantic core with two more shell weight records from the bibliography.

2. Oceanographic Setting of the Core Locations

The present study involves the analyses of three sediment cores from the eastern margins of the Atlantic Ocean (Figure 1). The southernmost one is GeoB 1710-3 from the northern Cape Basin and was taken from the southwestern African lower continental slope (2987 m). The Cape Basin, located in the subtropical eastern South Atlantic Ocean, is bordered to the east by the African continent, to the north and west by the Walvis Ridge and the Mid-Atlantic Ridge, respectively, and to the south by the Agulhas Ridge (Figure 1). The wind system is almost entirely dominated by the southeast trade winds [18]. Surface waters in the Cape basin may be derived from three different regions: the Indian Ocean’s Agulhas current, the South Atlantic current, and the Subantarctic Surface Waters [19,20,21]. Below the surface currents lies the Antarctic Intermediate Water (AAIW), which spreads to the north between 500 and 1000 m water depth. The dominant modem deep water mass, in the Cape Basin, is a mixture of ~60% Circumpolar Deep Water (CPDW) and ~40% North Atlantic Deep Water (NADW) from the western South Atlantic [22,23]. The relatively warm, saline, southward-flowing NADW is injected in the equatorward-flowing CPDW and extends between about 1700 and 3900 m water depth [24]. Between 1000 and 1700 m, the NADW is overlain by Upper Circumpolar Deep Water (UCPDW) and underlain by Lower Circumpolar Deep Water (LCPDW) [25]. The LCPDW is formed when Antarctic Bottom Water (AABW) is mixed with the slightly less dense overlying water [26]. The extremely cold, oxygen-depleted, nutrient-enriched, of low CO32− and high CO2 content AABW is encountered below 4000 m [27]. During glacial times, the conveyor circulation was weak, and the abyssal Cape Basin was filled with less corrosive and aged deep waters [28]. The core location is currently bathed in NADW [27] and must have been so for the last 245 Kyrs [29].
GeoB 8502 (19°13.27’ N, 18°56.04’ W) is a Tropical North Atlantic pelagic site at the lower reaches of the Cap Timiris Canyon, approximately 250 km offshore the Mauritanian coast (Figure 1), and was retrieved from 2956 m water depth on the lower Northwestern African continental rise and consists of levee sediments that are predominantly hemipelagic deposits. As part of the Eastern Boundary Current system, the Mauritanian upwelling region is one of the major upwelling areas in the Atlantic Ocean [30]. Along the NW African margin, the temporal dynamics of the coastal upwelling are driven basically by the intensity of the northeast trade-winds, itself dependent on the seasonal Intertropical Convergence Zone (ITCZ) migration [31,32] on a perennial basis, producing cold nutrient-rich surface waters with modern sea surface temperatures (SSTs) as low as 16°C. The main water masses encountered in the upwelling region are the Tropical Surface Water (TSW), the North and South Atlantic Central Waters (NACW and SACW), and AAIW. Both central water masses appear in the permanent pycnocline between depths of 150 m and 600 m at temperatures greater than about 8°C, below which lies the AAIW [32]. At greater depths, the core sediments are currently bathed in the carbonate-saturated NADW and may have remained so during the glacials [33].
Core ODP 982 was retrieved from the Rockall Plateau, which is an extensive shallow water (~2000 m) area located south of Iceland and west of the British Isles (Figure 1). The surface circulation in the Rockall area is characterized by warm, highly saline water of the North Atlantic Drift Current (NADC), which forms the continuation of the Gulf Stream heading to the Nordic Seas [34]. The NADC is the major surface water component of the AMOC, which is one driving factors behind the global conveyor belt and NADW formation [35,36]. The NADW may be divided into two main components: the upper NADW, in the intermediate depths, and the lower NADW (deeper than 2000 m). Intermediate depths in the North Atlantic, near the Rockall Plateau, contain three principal water masses between the AAIW, Mediterranean Overflow Water (MOW), and Labrador Sea Water (LSW). The upper NADW consists of a mixture of LSW, MOW, and overflows from the Nordic Seas and is the densest of the intermediate water masses, occupying depths between 1500 and 1600 m in the interior ocean. The lower NADW is composed of a mixture of the dense overflows from the Nordic Seas and LSW [37]. The deepest water mass in the Rockall area (≥ 3500 m) consists of modified AABW, which is characterized by lower salinity than the waters above [38].

3. Material and Methods

3.1. Sediment Core Locations and Methodological Overview

The present study is based on the weight analyses of foraminifer shells from three sediment cores (Table 1). G. bulloides shell weights from the 300–355 μm sieve fraction existed for cores ODP 982 [39] in the North Atlantic and GeoB 8502-2 [40] in the Tropical Atlantic and thus the weight analysis was extended to specimens from core GeoB 1710-3 in the South Atlantic. GeoB 1710-3 is 10.45 m long with an average sedimentation rate of ≈ 5 cm/ky [41] and extends back 245 kyr to Marine Isotope Stage (MIS) 7, yet the present analysis was restricted to the last 200 kyr to match the extent of GeoB 8502-2. Samples from GeoB 1710-3 were taken at a resolution of ~2000 years (10 cm sampling interval) by extracting a slice of material, 1 cm in thickness, which corresponds approximately to an average of 200 years of sedimentation. The coarse fraction of all samples was already available from a previous study [42] and was subsequently dry-sieved into several sieve fractions. Non-fragmented G. bulloides shells from the 315–355 μm size fraction were picked for mass analysis. The very narrow size interval (40 μm) should be sufficient to overcome the greater proportion of natural size variability without further normalization [43]. Since any record of shell weight is a composite signal of dissolution superimposed upon the initial shell weight variability, the cores considered here were already assessed for carbonate dissolution using the same method (ODP 982 [17], GeoB 8502-2 [40], GeoB 1710-3 [44]) and their foraminiferal carbonate is reported to be well preserved. The coarse fraction from the studied cores was disaggregated with deionized water and then wet-sieved through a 63 μm mesh. Since all samples underwent the same washing process, any offset due to residual fine debris would be constant among samples. Although treatment solely with water is not a very efficient cleaning method for weighing analyses [45], the examined specimens did not show increased contamination (see Section 4).
The weight analyses revealed two instances where G. bulloides shell masses between the studied cores converge and these convergence intervals were termed Shell Mass Convergence Event (SMCE) I and II, during the last (~18.4 ka) and the penultimate (~122.4 ka) deglaciations, respectively. In order to better understand the physiology of the shells during these intervals, the selected specimens from GeoB cores were analyzed by high resolution X-ray microcomputed tomography (XμCT). The tomographic analysis was extended to the shells that mark the Last Glacial Maximum (LGM) in core GeoB 1710-3, which were the heaviest found in all three records during the last 200 kyr. μCT was used to inspect the interior and the internal structure of the foraminiferal tests. Apart from addressing the test’s integrity, XμCT allowed for the assessment of the degree to which the recorded masses are the result of interference from shell inclusions or of changes in test thickness. Finally, the μCT analysis led to total shell volume estimates that allowed for the calculation of volume-normalized shell weights or G. bulloides shell densities, presenting a more precise method of eliminating the contribution of shell size to shell weight.

3.2. Weight Analysis

Where available, ideally, 50 (minimum 31) G. bulloides shells were weighed in a preweighed aluminum carrier in the Department of Earth Sciences at the University of Oxford using a Sartorius SE 2 ultra-microbalance with a precision of ±0.1 μg. Replicate weight measurements of specimens from core ODP 982 were performed in the Godwin laboratory at the University of Cambridge using a UMX2 Mettler Toledo ultra-microbalance at the same precision. Average shell masses were calculated by dividing the recorded mass by the total number of foraminifera weighed. Subsequently, for each sample, the average shell weights of batches of five individuals (minimum four, maximum eight) were determined, in order to estimate standard shell mass deviations. As explained above, performing shell weight analyses on a narrow size fraction of foraminifera constrains the ontogenic stage of the specimens to a certain number of chambers, and thus minimizes size-related weight differences [43,46]. The analytical error, estimated by triplicate measurements of 50 random specimens, ranged from 0.04 to 0.06 μg for both balances, which is in accordance with their analytical error.

3.3. Determination of Atlantic Seawater Paleodensity

The acquired shell weight measurements were converted to paleoseawater densities using Equation (1) that was derived by correlating weight and geochemical analyses of equally sized G. bulloides specimens between both 250–315 and 300–355 μm from the Atlantic Ocean [17]:
Seawater density=0.29(±0.01) * G. bulloides shell mass+1022.78(±0.11)
This equation is based on the hypothesis that foraminifera shell masses can be used as a direct (paleo)seawater density proxy and is considered to describe the ocean density at 100 m depths. When G. bulloides shell weights approach zero, like the smallest juvenile tests, the density approaches 1023 kg/m3, thus describing well the modern average surface ocean density. The weight-derived ocean densities were also compared to published geochemically derived seawater densities for the penultimate deglaciation from core GeoB 8502-2. The propagated error from the transformation of shell mass to seawater density is ±0.23 kg/m3.

3.4. X-ray Micro-Computed Tomography (μCT)

For X-ray microscopic analysis, in total, 28 specimens were scanned from four samples of cores GeoB 8502-2 and GeoB 1710-3 that correspond to the time intervals of shell mass convergence during the last and penultimate deglaciations (SMCE I and II), and a sample from the last glacial maximum in core GeoB 1710-3, where the highest shell weights of all the studied records were recorded. The dataset was complemented with CT data previously published in Zarkogiannis, et al. [40] that refer to the time-slice of SMCE II in core GeoB 8502-2. On average, seven (min four, max five) specimens were scanned from each of the studied intervals. Each batch of shells was poured into a quartz cylindrical carrier 1 mm in diameter [47]. They were stabilized with diluted tragacanth glue and left to dry prior to scanning. The micro-CT (μCT) scanning was carried out with a Zeiss Xradia 510 Versa at the Maxwell Centre of the University of Cambridge. X-ray source and detector geometry were kept constant throughout the scans. The anode voltage was set at 100 kV, the X-ray tube current was 90 μA, and the exposure time was 2 s at an optical magnification of 4 ×. By processing approximately 1024 images per sample, a scan resolution voxel size of ~1.2 µm3 was typically achieved using this setup in order to maximize the number of specimens that could be analyzed in a single scan. The images were combined to build a 3D rendering using Avizo software, which was also used for segmentation. The segmentation resulted in the separation of the tomographs into shell area, area occupied by clay infillings (dirt), and internal shell (protoplasm) voids.
Subject to the degree of segmentation, the X-ray microscopic analysis allows for the determination and study of a number of biometric characteristics of the foraminifera shells, such as total shell volume, thus shell density (volume-normalized weight) and calcite (test) volume, and thus test density and calcite (test) surface [40]. The calculation of the total cell volume and the volume of shell calcite allowed for the determination of the percentage that the shell occupies within the cell. The ratio of calcite volume/calcite surface provides a linear unidimensional quantity in length units and can thus serve as a measure of average test thickness. In this study, in addition to shell density, that is, the ratio of shell volume to shell mass, we used the “specific surface area”, that is, the ratio of test volume/test surface, as a measure of average test thickness [48] and the test density, that is, the ratio of test volume to shell mass, as an indication of test porosity. Furthermore, by segmenting the area occupied by clay infillings, the degree of contamination in weight measurements was calculated as percent by volume. Links to raw tomographic data can be found in the data availability statement section below.

4. Results

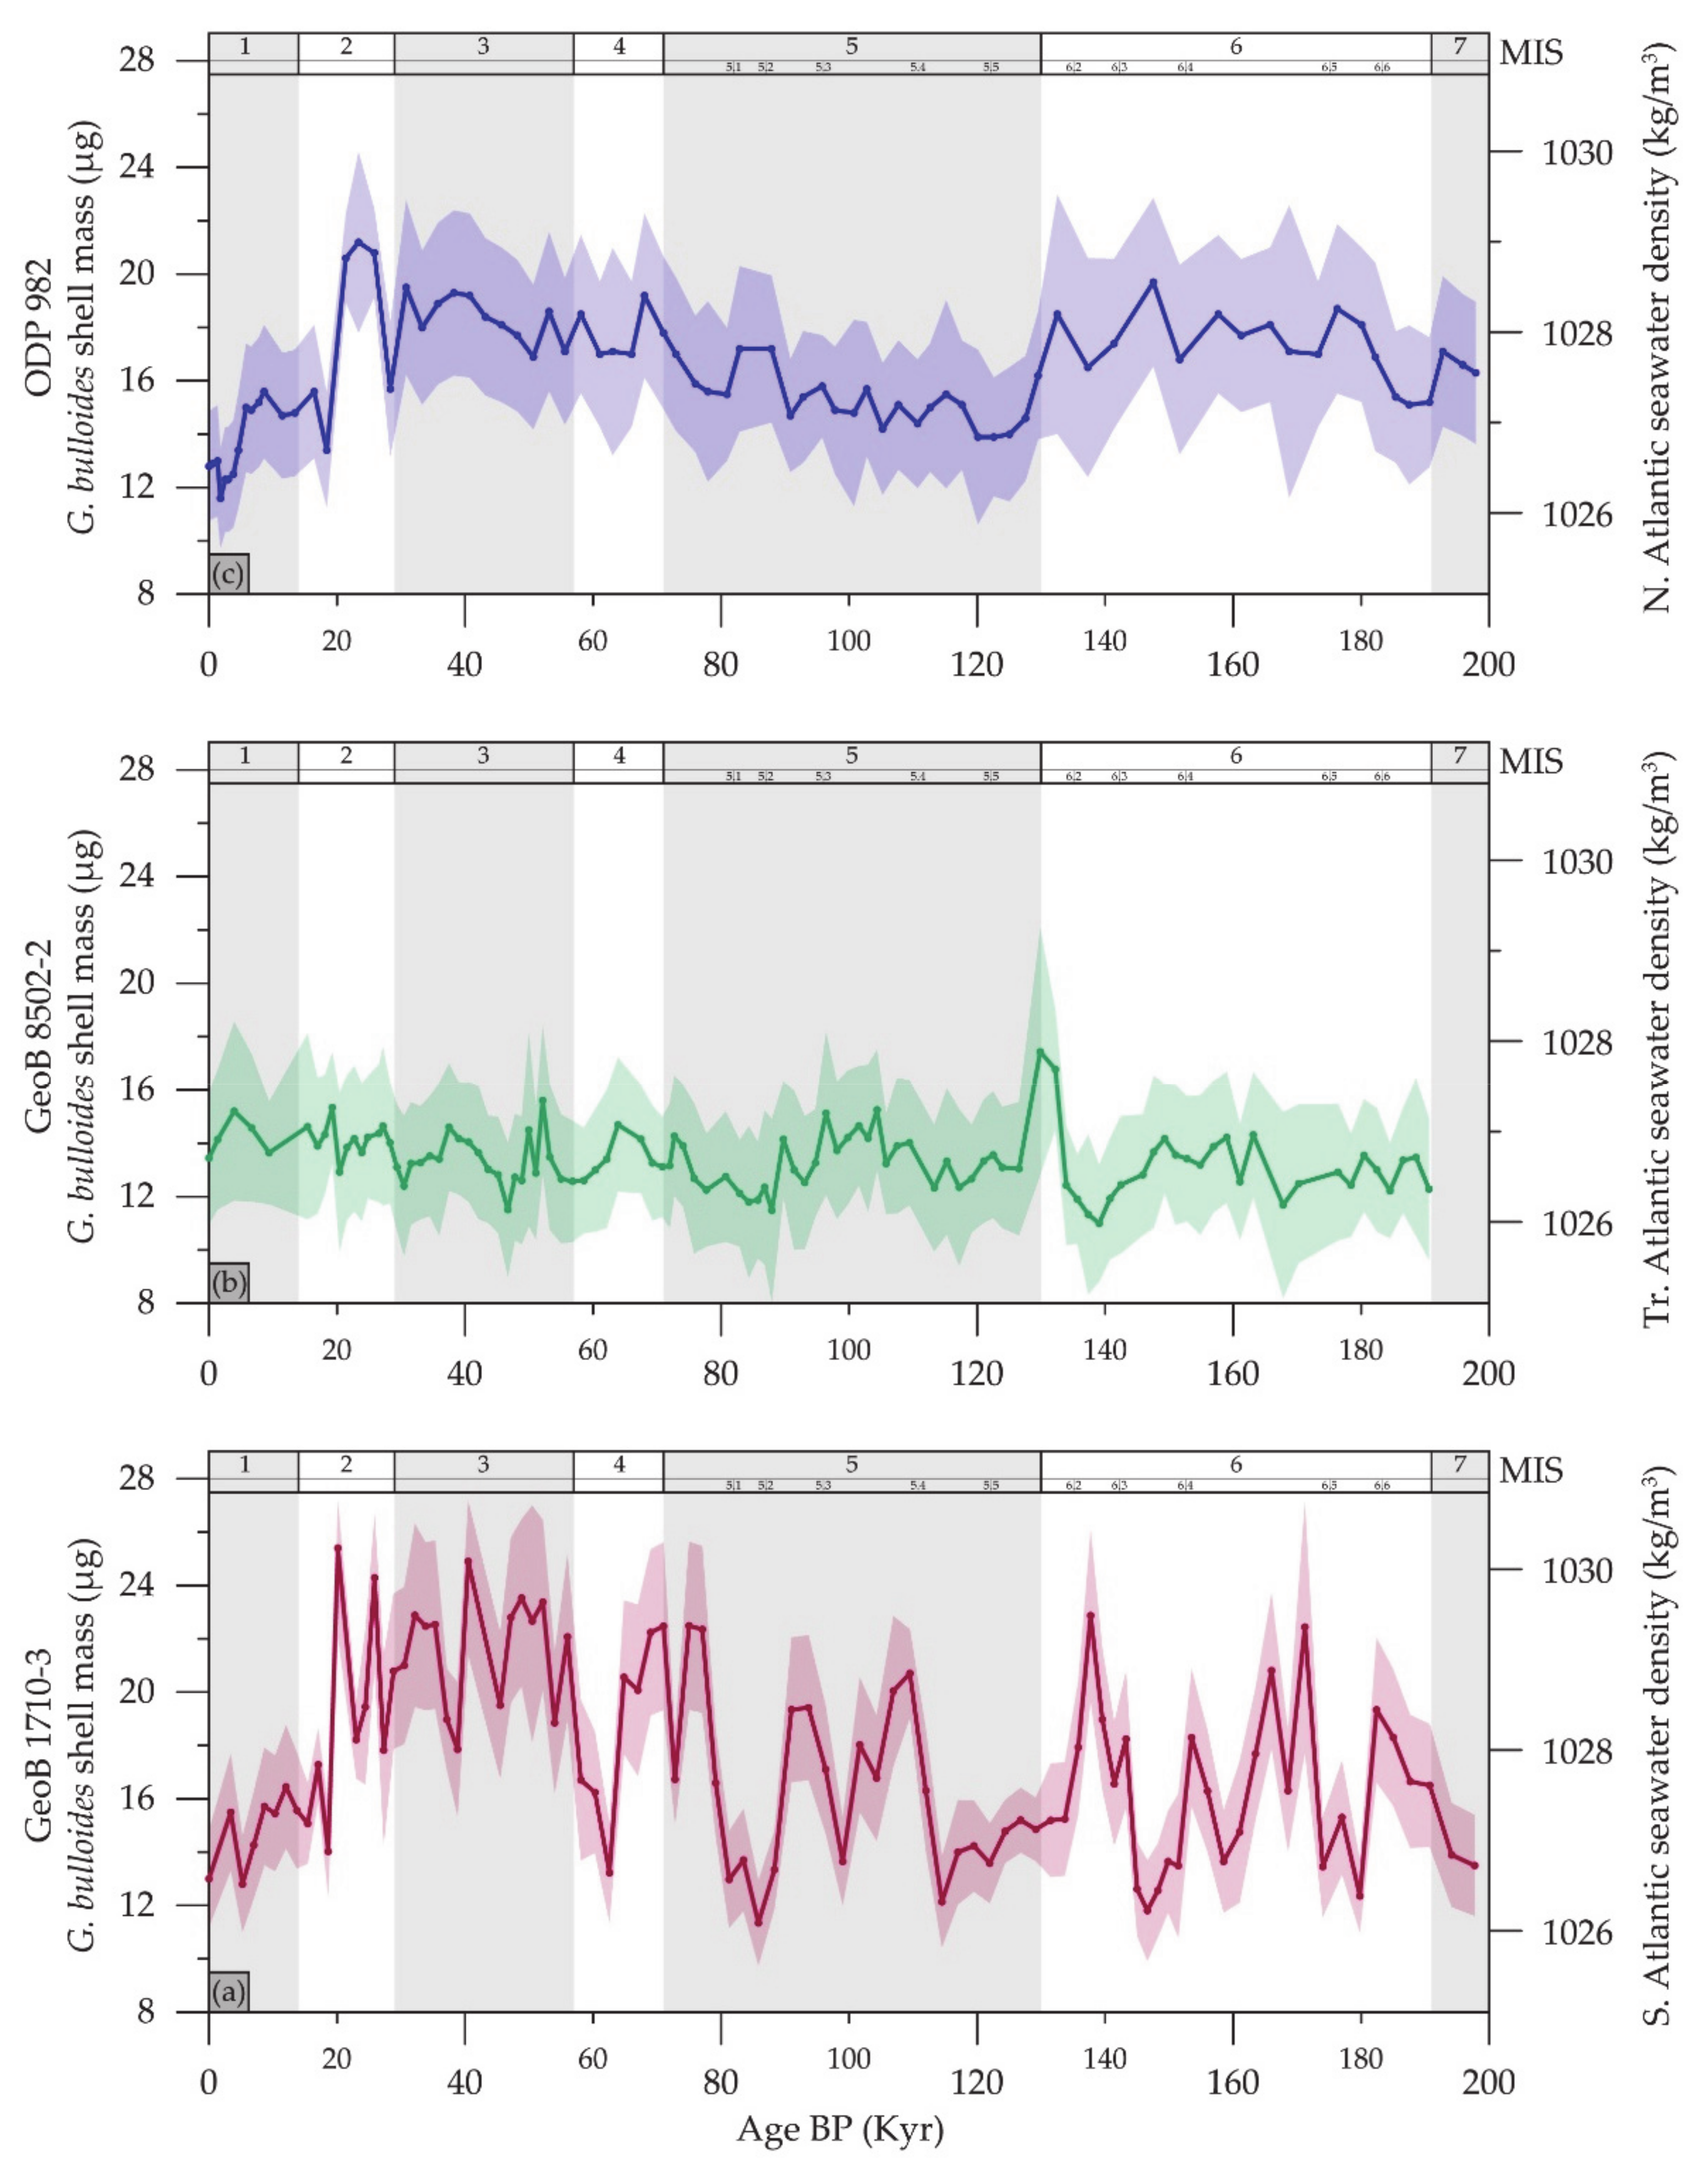
The record of G. bulloides shell mass attained from GeoB 1710-3 for the last 200 kyr shows enhanced climatic cyclicity (Figure 2a) and variability between mass values of more than 100%, but shell weights were consistent between replicates. During the cold MIS 6 interval, shell weights were generally increased but with considerable variation, of up to 80% since some of the lowest mass values in the record are at 148 and 180 ka. During MIS 5e, shell masses are low and they gradually increase after MIS 5d. The lowest shell mass values followed MIS 5b, after which shell weights increase until they reach their maximum value at 20 ka, which possibly marks the LGM interval for this core. During the last deglaciation, mass values drop abruptly and they remained low during the Holocene.
In contrast to GeoB 1710-3, the shell weight record of the lower latitude core GeoB 8502-2 shows no cyclicity between glacial and interglacial periods the last 200 kyr. G. bulloides shell masses are stable, fluctuating only on a small scale (±1.1 μg, 1σ) around an average of 13.4 μg. Lower shell mass weights are found within MIS 6, while values almost increase progressively after MIS 5b. The broad maximum in shell weight centered at the MIS 5/6 boundary of Termination II recorded for approximately 2300 yr, during which shell masses increase by 30% above average, was attributed to contamination clay infillings. In core ODP 982A, shell weights show again a clearer glacial/interglacial pattern, which is less “nervous” than that of GeoB 1710-3. Here, G. bulloides shell masses consistently increased at around 17.3 (±1.3) μg during the cold MIS 6 interval. Low mass values are recorded during the warmest MIS 5e interval, after which weights increase gradually during the course of the last glaciation until around 21 ka. At this age, the highest mass values are recorded, denoting the LGM period in this core, after which values drop and decrease even further during the late Holocene.
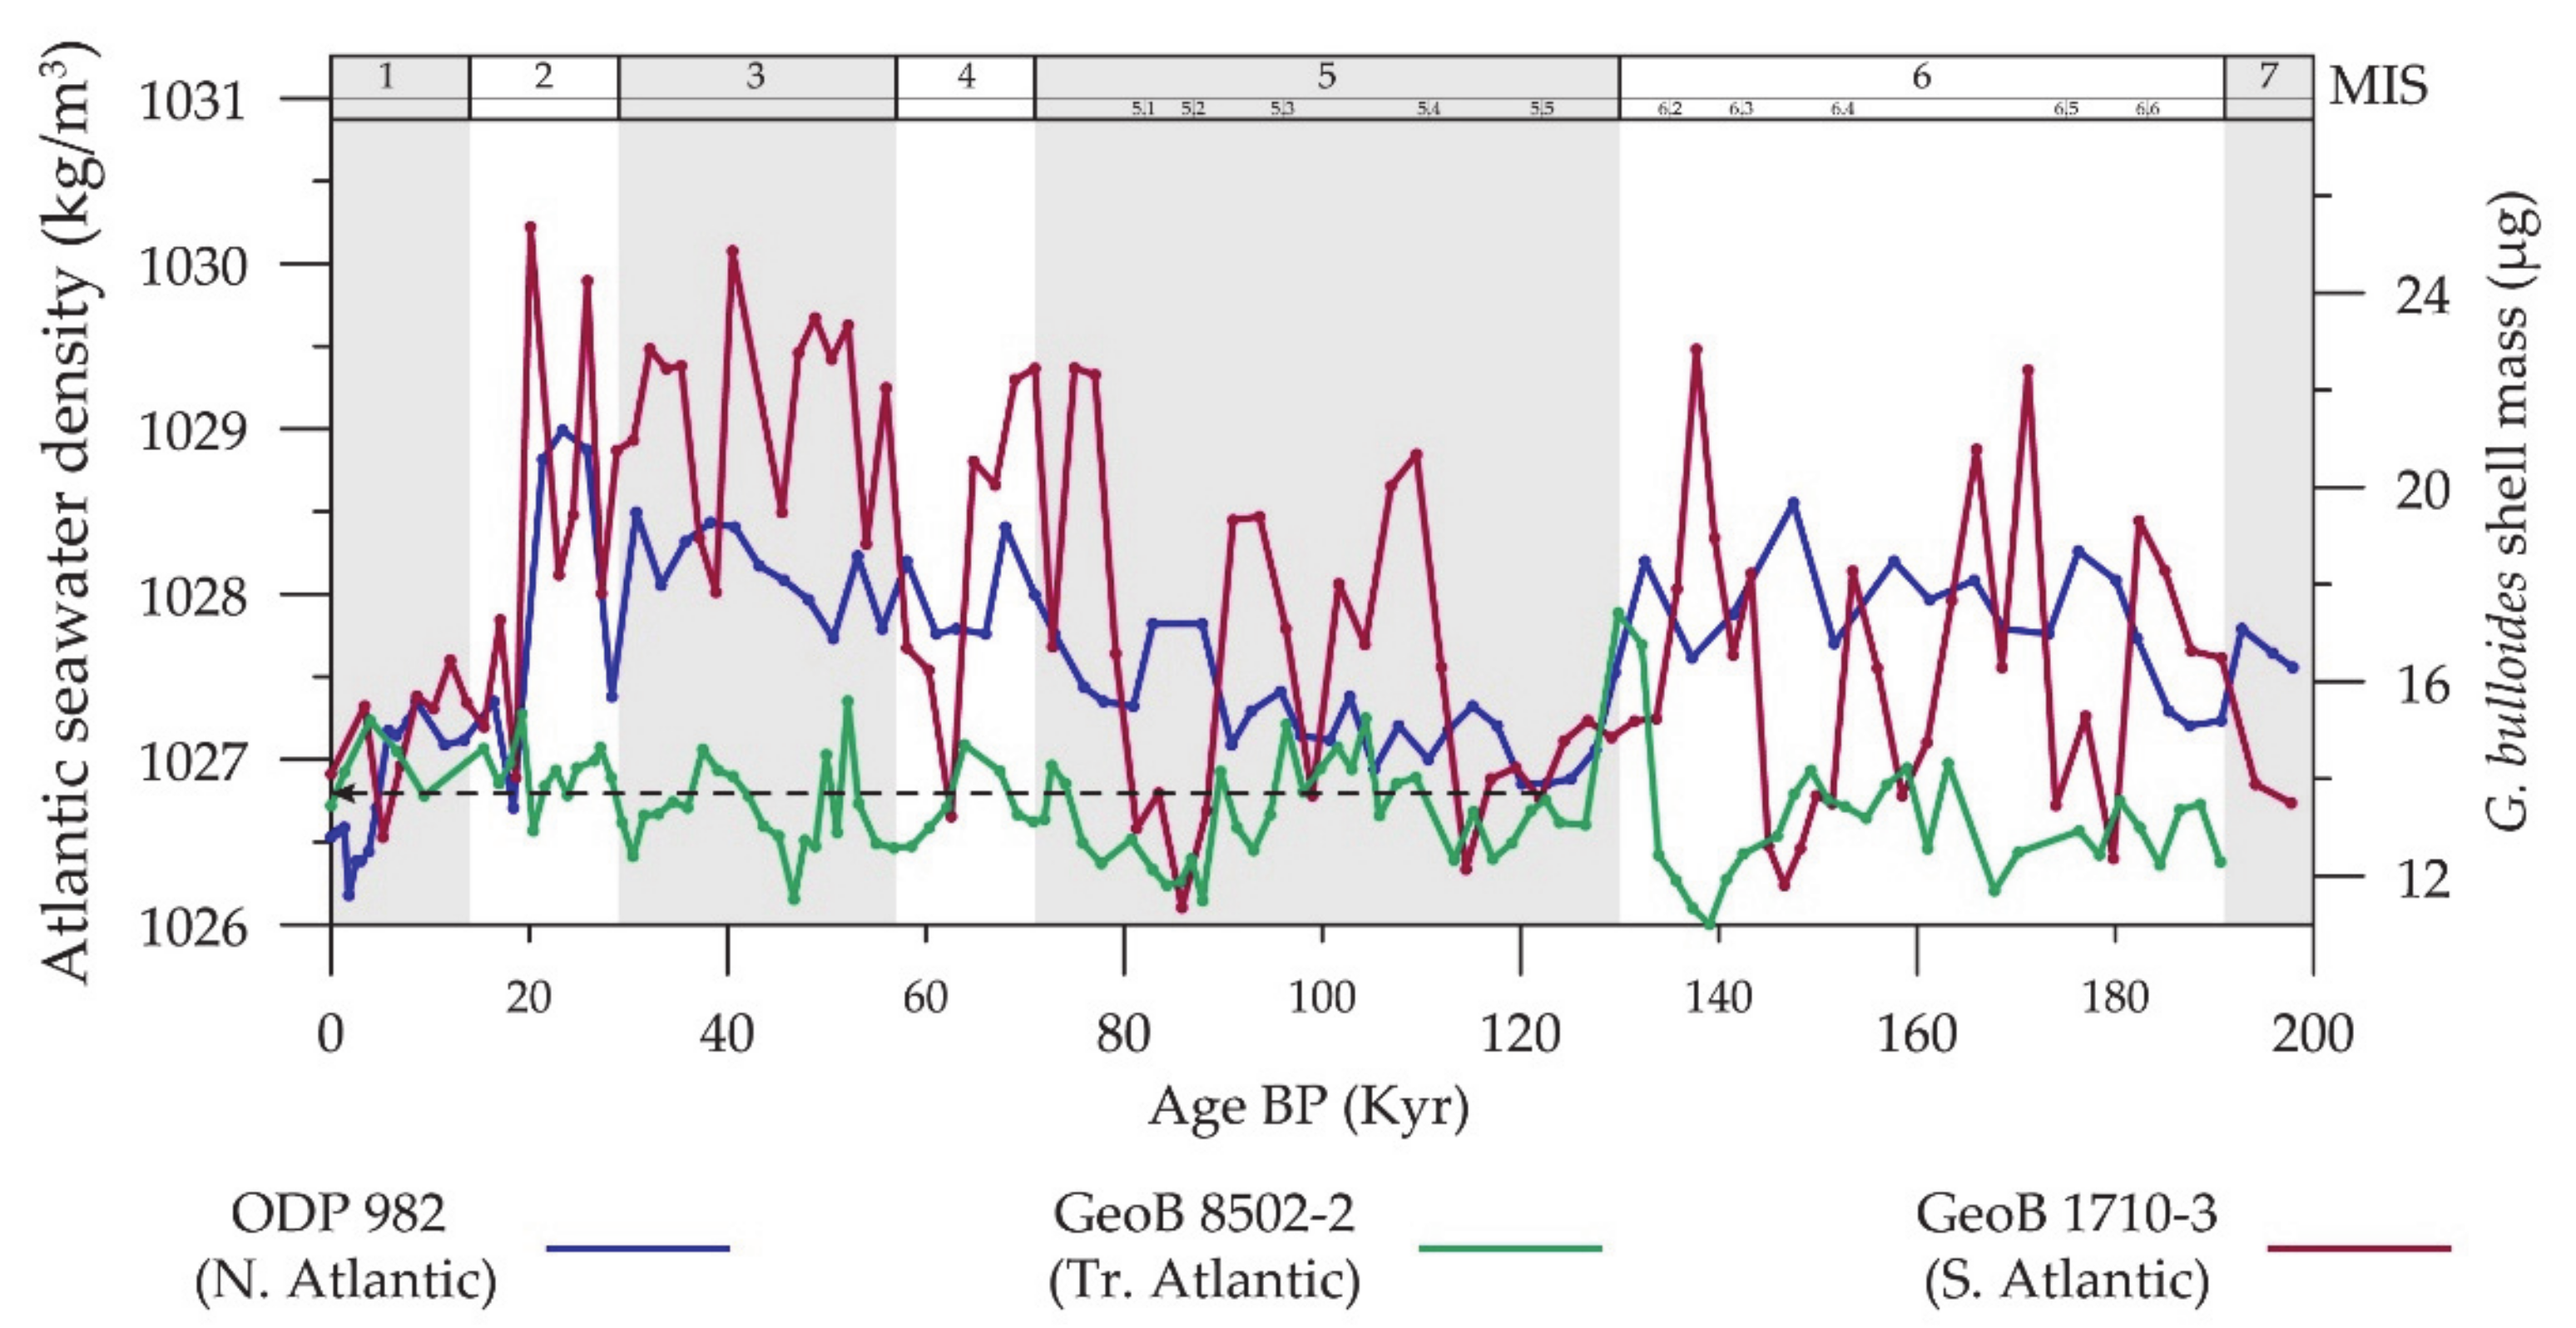
By using Equation (1), the planktonic foraminifera shell weights were converted to ocean density values and the results for the three records are summarized in Figure 3. The superposition of the three records reveals a convergence in Atlantic Ocean densities for two instances during the last 200 kyr. The first convergence event (SMCE I) takes place after the onset of the last deglaciation around 18.4 ka and the second (SMCE II) around 122.4 ka within the peak of the penultimate deglaciation. During both of these instances, the water densities convergence to the same value of ~1026.82 kg/m3 and this value is similar to seawater densities reconstructed for the modern core-top samples. It also appears that most of the time the South Atlantic is densest. Prior to SMCE II, density gradients are more or less constant between the different Atlantic localities, while after this convergence event densities start to diverge between the tropical site and the sites at higher latitudes until the LGM when the divergence becomes the maximum between the sites. After SMCE I, seawater density gradients between the different eastern margins of the ocean alleviate considerably until today.
The results from the intervals that surround the two SMCE events are summarized in Table 2. The average G. bulloides shell masses during SMCE I across the different sites are 13.9 (±0.5) μg and 13.7 (±0.2) μg during SMCE II, which equal to almost identical Atlantic seawater densities (1026.86 and 1026.79 kg/m3, respectively) also between the two intervals. The density value of ~1026.8 kg/m3 to which Atlantic seawater densities converged on average during the two SMCEs resembles that of the modern ocean. The weight-derived Atlantic seawater densities are comparable within error to geochemically reconstructed seawater density values from combined Mg/Ca and δ18O measurements on the weighed G. bulloides specimens from core GoeB 8502-2 for this interval.
The results from the CT analyses are summarized in Table 3. The specimens that were available for CT scanning are from the GeoB cores. The analysis mainly focused on the specimens from SMCE I and II intervals and reveal other physical characteristics of the specimens with the same mass across the Atlantic basins and time intervals. In addition to these intervals, LGM specimens from core GeoB 1710-3 displayed the highest shell mass in the studied records. The CT analyses showed that contamination by sediment infilling of specimens is minimal (only ~5% by volume) and thus the reported shell mass values are not artifacts. Furthermore, the inspection of the tomographs (found in the data availability statement section below) verified the good preservation of the specimens and thus the shell weight variation due to dissolution can be considered minimal too.
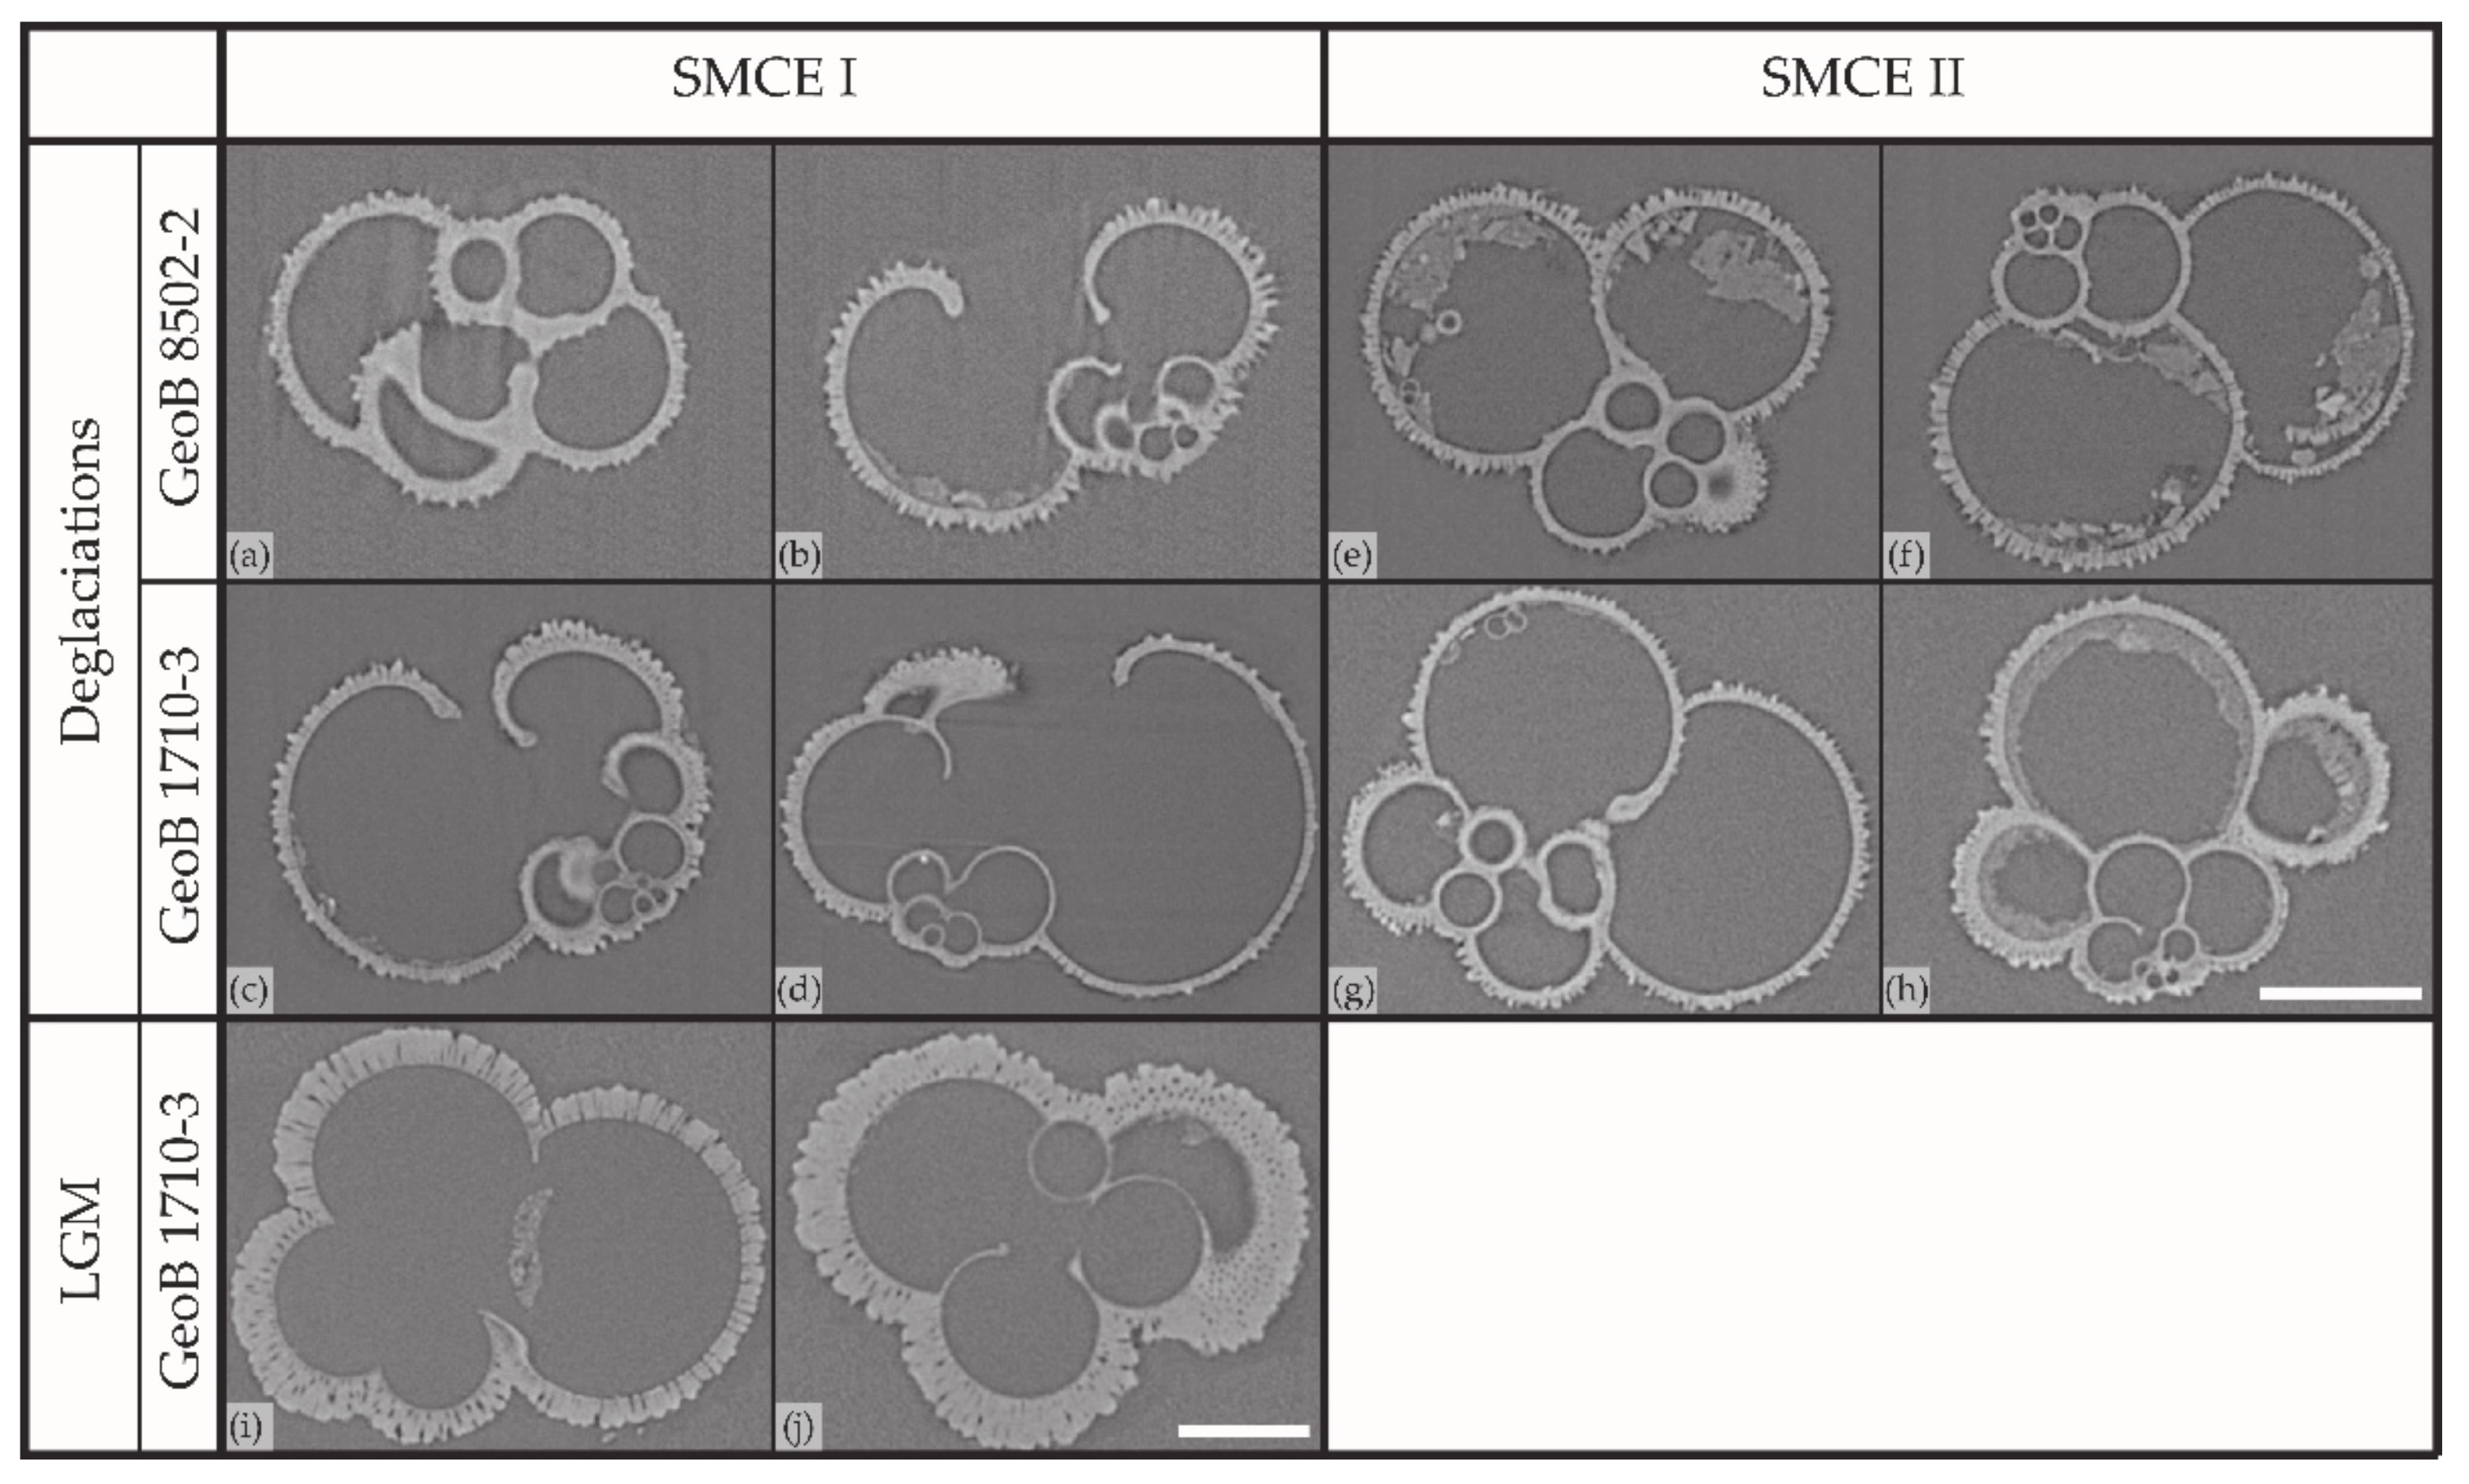
The merging of shell masses is also reflected in a convergence in the mean wall thickness of the shells at ~5 μm (Figure 4a–h). Although the shell thickness is similar, during SMCE I shell masses are slightly more elevated than during SMCE II but the shells are found to be more voluminous. Thus, the shell thickness remains the same because mass changes are compensated for by changes in total volume, and this is reflected in the shell density values of Table 3. Furthermore, during convergence events the foraminifera shell comprise 23% of the total cell, while the overall shell density (i.e., volume-normalized weight) varies only by a little and is on average 0.62 g/cm3. The test density (an indication of test porosity) of SMCE I individuals is slightly increased compared with that of SMCE II. Test density values vary around the values of the calcite’s density.
The LGM specimens of GeoB 17010-3 exhibit different characteristics to those of the SMCEs (Table 3). Their mass almost doubles and so does their shell wall thickness. This is also visually evident in their tomographs of Figure 4i,j, where the specimens are found to be heavily encrusted. Internal chamber walls are very delicate and thin (Figure 4j), while in most of the cases these chamber walls are completely dissolved and are thus not evident within the shell (Figure 4i). LGM shells are ~20% more voluminous that the others and this extra volume is due to the increase in their shell calcite, which now comprises the 42% of the total cell volume (Table 3), while the total volume of the cavities that are filled with protoplasm is similar to the SMCE specimens (Supplementary Table S2). The overall shell density during the LGM is increased by more than 50%, while the test itself is found to be less dense and thus more porous (Table 3).

5. Discussion

5.1. Foraminifera Shell Weights Are Tracers of Past Oceanic Circulation

The sieved-based weight analysis of G. bulloides shells from the South Atlantic core GeoB 1710-3 during the last 200 kyr was combined with two additional eastern Atlantic shell weight records and revealed reorganizations in the meridional circulation of the Atlantic Ocean. The measured foraminifera shell masses were converted to seawater density values using a lineal relationship that was calibrated for the Atlantic Ocean using geochemical data [17]. The mass-based reconstructed seawater densities from the three different eastern Atlantic localities describe their hydrography and unveil two occasions, SMCE I and SMCE II, when the seawater densities between these regions appear similar (Figure 3). Interhemispheric convergence of surface Atlantic densities denotes the absence of seawater density gradients across the basins and thus momentary cessation of the Atlantic Meridional Overturning Circulation (AMOC), which implies an increase in surface ocean stratification [49] and abrupt, large changes in climate [50].
The basin-scale reconstructions of seawater densities using planktonic foraminifera shell mass measurements have enabled the consideration of several aspects of the Atlantic hydrography. Figure 3 showed that planktonic foraminifera can alter their shell mass considerably and verifies that the degree of this alteration in time is a function of latitude [51] with no overall response to atmospheric pCO2. The water from the S. Atlantic site is generally found to be denser than the other two eastern areas. This illustrates the northward water movement towards less dense regions, which is known to feed the northern Atlantic latitudes with southern-sourced waters [52]. The high S. Atlantic densities of enhanced variability may be the result of the site’s location offshore the Kalahari Desert, which as a hyper-arid area would favor the development of high salinity in the sea water, while pulses of leaking warmer and thus lighter Agulhas waters may contribute to abrupt density variabilities (see Section 5.2). Seawater densities at the tropical Atlantic site GeoB 8502-2 are stable throughout the studied interval and G. bulloides specimens were the lightest between records. As discussed in Zarkogiannis, et al. [40], this is a tropical region of insolation and climatic stability, under the influence of the ITCZ, which is a zone of enhanced precipitation and of low-density surface waters [53].
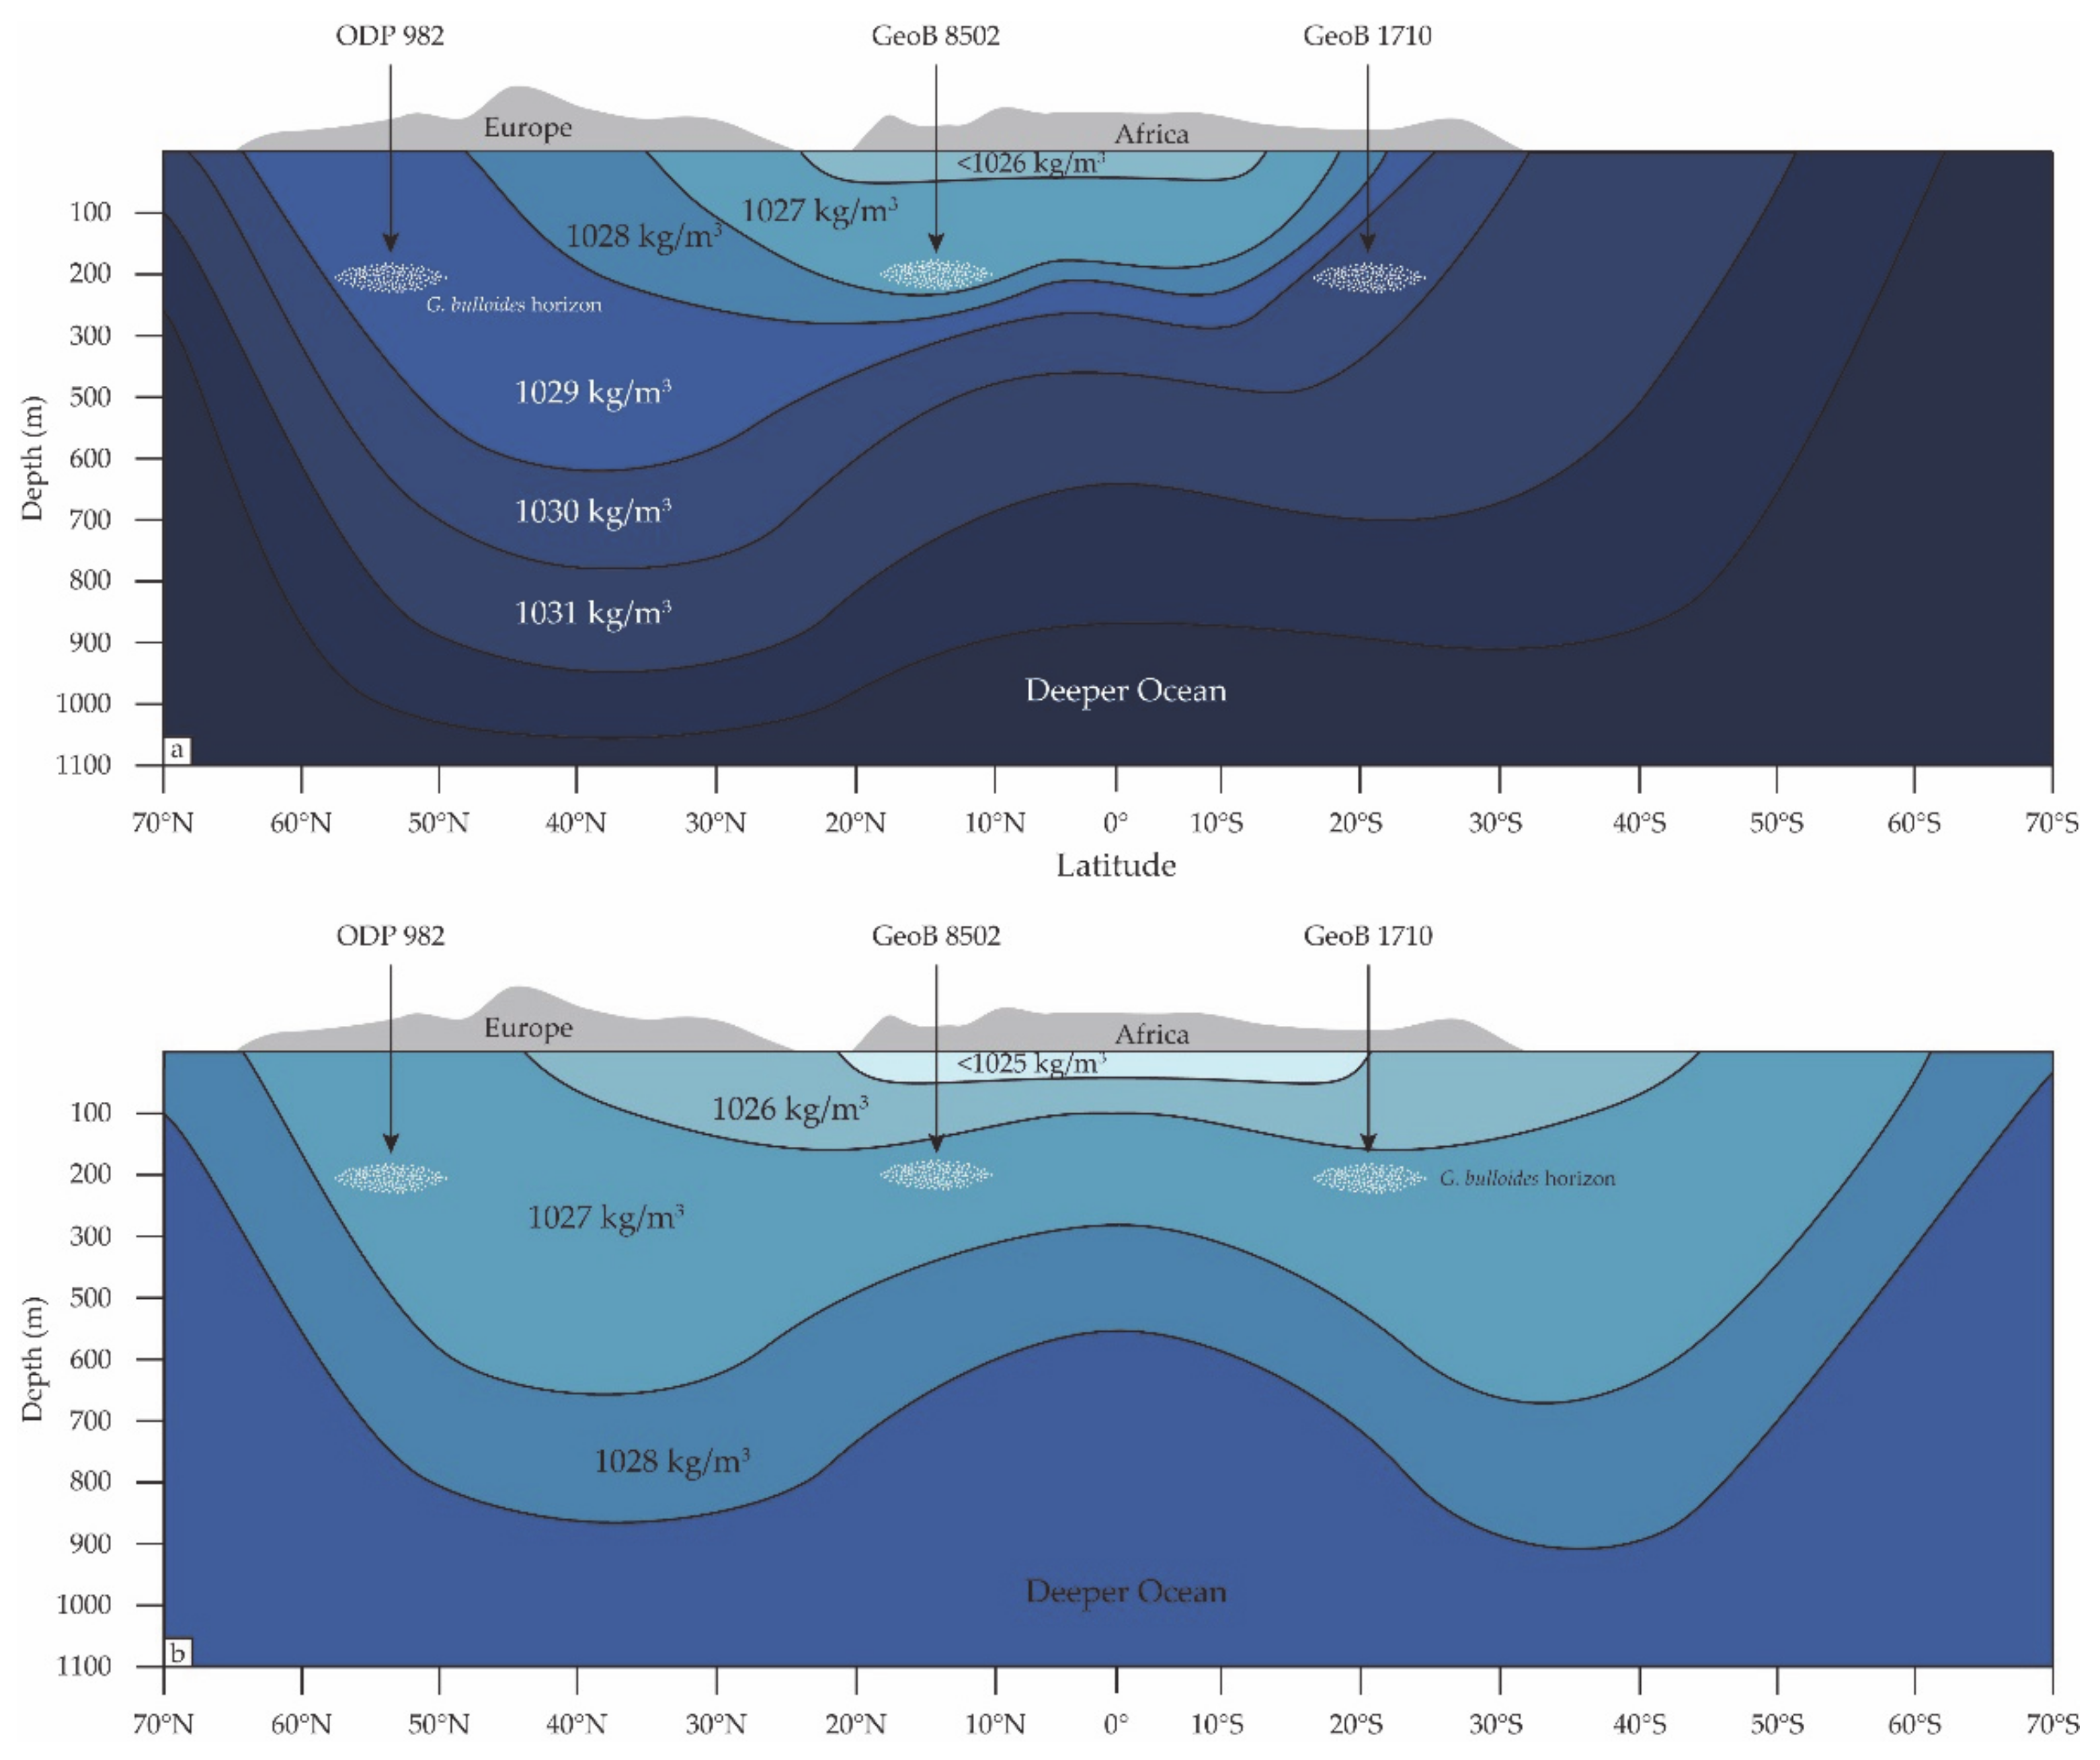
Planktonic foraminifera shell weights start recording the glacial/interglacial cyclicity signal at mid-latitudes or at latitudes that are more sensitive to insolation changes. That seawater densities are here reconstructed higher for the site at 23° S (GeoB 1710-3) than that of 57° N (ODP 982A) might imply that the overturning circulation and oceanic density gradients may not respond directly to the amount of summer insolation falling across northern high-latitude regions. They are possibly dictated by moisture fluxes from Hadley cells, driven by the Earth’s latitudinal insolation gradient (LIG) [54] and the latitudinal temperature gradient (LTG) that it creates, which drives the poleward energy flux via the atmospheric and ocean circulation [55]. Site GeoB 1710-3, where the highest shell weights were recorded, is located directly at the descending limb of the Hadley cell. Furthermore, since the LGM is an arid period [56,57] and may have been more arid that the penultimate glacial maximum [58], the highest-density waters (of increased salinity and decreased temperature) were to be expected in the Atlantic basins of the mid-latitudes (Figure 5a). The response of planktonic calcification to high-density waters is notably manifested in Figure 4i,j.
Furthermore, Figure 3 suggests that the Atlantic Ocean was slightly lighter during MIS 6 than the subsequent glaciation as it can been seen in all three records. The penultimate glacial, MIS 6, appears to have been approximately as extreme as the last ice age in terms of global ice volume and sea level [59,60]. Yet, unlike the last glacial interval, no major ice-rafted debris (IRD) deposits, known as Heinrich events [61,62] that suggest increased iceberg formation, were recorded prior to the penultimate deglaciation in the Atlantic [63,64], while on the Iberian margin, MIS 6 has been described as a warmer glacial interval compared with the last ice age [63,65]. Thus, for occupying the same volume at higher temperatures, its density should have been reduced. Except for this glacial interval, which raises arguments that the interocean salt leakage is not as straightforward as previously suggested [66], the South Atlantic has most of the time been the densest of the three basins as it is today [67]. Furthermore, its record appears to be “nervous” with increased variability.
The most important outcome of Figure 3 in terms of abrupt Atlantic hydroclimate changes may however be the identification of intervals of surface seawater density convergence. Independent indications of a collapse of the Atlantic meridional circulation during SMCE I and SMCE II are provided by geochemical evidence of 231Pa/230Th records from N. Atlantic cores. 231Pa/230Th is a kinematic proxy for the meridional overturning circulation. For a given scavenging rate, lower rates of AMOC in the past would result in comparatively less 231Pa export from the Atlantic and in higher sedimentary 231Pa/230Th, reaching a maximum of 0.093 for a total cessation [68]. In the present study, the first instance of surface ocean density gradient attenuation is recorded at ~122.4 ka (SMCE II), shortly after the peak in the last interglacial (MIS 5.5) within a cold climatic phase [69,70]. During the same interval, the sedimentary record of core MD95-2037 from the north central Atlantic shows increased 231Pa/230Th values that also indicate cessation of the overturning circulation in the region (Figure 2 in [71]).
According to the density differences between the Atlantic regions of Figure 3 and in line with previous findings, the overturning rate at the ocean surface was weak during MIS 5e, and a change to a more vigorous circulation pattern occurred mostly during the glacial inception, i.e., the transition from MIS 5.5 to MIS 5.4 [71,72,73]. Hence, during the warm optimum of MIS 5.5, the structure of the AMOC was similar to the modern one (Figure 5b). The records are also in agreement for a sluggish Atlantic circulation at ~100 ka, since the weak density gradients that appear in Figure 3 are synchronous with an increase in the 231Pa/230Th records [71]. Nevertheless, the weight-based reconstructed density gradients show that the glacial Atlantic circulation mode started after 120,000 years ago with an increase in the overturning rate [71] and thus a more vigorous behavior of the AMOC [74,75] following the decrease in Northern Hemisphere summer insolation, which favored the initiation of ice-sheet growth [76].
The surface ocean density values during MIS 5e (~1026.8 kg/m3) were found to be remarkably similar to the values recorded for SMCE I during Termination I (~18.4 ka) and for most of the Holocene. 231Pa/230Th radiochemical data from sediment core OCE326-GGC5 from the western subtropical Atlantic also provide independent evidence of a collapse and rapid resumption of the AMOC [5]. In that 231Pa/230Th record, the circulation is found to momentarily cease at 17.5 kyr ago, during the H1 stadial. This is a few hundred years later than suggested from the convergence of the planktonic foraminifera shell weight records. This discrepancy may be due to the difference in the resolution of the records and/or because the response time of sediment 231Pa/230Th to changes in circulation is ∼500 yr [68,79]. Thus, the 231Pa/230Th profiles lag the information of surface ocean circulation changes that is provided by the foraminifera proxy.
The two records also agree in the duration of the shutdown of the AMOC, which appears to last 2000 yr by the 231Pa/230Th signal and 1600 to 2000 years in the foraminiferal records. The synchrony between changes in 231Pa/230Th and foraminifera weights suggests a connection between the AMOC and local surface hydrography, and the inferred near-cessation of AMOC during early deglaciation appears to be directly linked to the freshening and increased buoyancy of Northern Atlantic surface water during the H1 [80,81,82]. During this event, decreasing G. bulloides shell weights were recorded in three additional cores from the N. Atlantic, all converging towards the beginning of the Holocene [43]. These findings thus support earlier suggestions that melt water associated with catastrophic iceberg discharge freshened the high-latitude surface ocean, stabilized the water column, and weakened the AMOC [83,84]. The results indicate that the effect was dramatic, resulting in a near-total collapse of the AMOC possibly during periods of substantial regional cooling.
Present planktonic foraminifera shell weight records reveal an attenuation of surface Atlantic density gradients after SMCE 1 (~18.4 ka), and this is supported by investigations that provide ample evidence for large-scale glacial and deglacial AMOC reorganizations [85,86,87]. While discrepancies remain between the different studies regarding the timing, overall tendency, and amplitude of circulation variations [88], there is a general consensus that AMOC variability was subdued during the Holocene compared with the last glacial termination [89,90]. This is also supported by the present record, where similar shell weight values are shown to characterize entire Holocene sections (14.1 ±0.6 μg), suggesting no major changes in AMOC during at least the past 18 kyr (Figure 3). The slightly steeper gradients during the early Holocene imply a weakly increased rate of AMOC, supporting previous findings [5], but the convergence of shell mass values in the most recent sediment samples supports recent studies that suggest a decline in the AMOC strength during the past centuries [91,92,93]. However, these results must be confirmed with additional high-resolution analyses.

5.2. Assessing Atlantic Planktonic Foraminifera Shell Mass Records as Seawater Density and AMOC Proxies

The use of planktonic foraminifera shell mass as a seawater paleodensity proxy has revealed changes in the circulation mode of the Atlantic Ocean and has provided estimates of absolute past density values of the seawater column at the depths where G. bulloides live when they attain a cell size of 300–355 μm. The average Atlantic Ocean density during the periods of quasi-total cessation of the AMOC was found to be ~1026.82 kg/m3. This value is similar to 1026.72 kg/m3, which is the average density reconstructed for the modern ocean by the three core top samples and refers to a depth of 130–170 m in the study area today [94]. Such depths are in the range of the calcification depths reported for G. bulloides for the southern Atlantic [95], the Indian [96] and Southern Ocean [97], and the Atlantic [98,99], although for the N. Atlantic shallower depths have also been reported [100]. Since calcification depths change with ontogeny and thus with size [99,101], it is reasonable to assume that specimens as large as 355 μm calcify at greater depths and so the proposed reconstructions are plausible. However, like many applications of transfer functions on fossil foraminifera to reconstruct past environments, the shell-weight-based seawater density reconstructions fundamentally rely on the assumption of stable environmental niches in both space and time. Niche stability in environmental space is found to be greatest for subpolar species such as G. bulloides across glacial and interglacial intervals [102].
Planktonic foraminifera shell mass biomineralization responds very differently to atmospheric pCO2 with latitude (Figure 2a,c) if at all (Figure 2b). Shell weight variability is greater at intermediate latitudes and especially at those related to the descending limb of the Hadley circulation, such as the region of core GeoB 1710-3. The increased shell masses recorded during the last glacial maximum could also have been attributed to enhanced upwelling, a wind-driven oceanic circulation, of denser water masses during the LGM but this is definitely not the case for core GeoB 8502-2, which is beneath one of the major upwelling areas in the Atlantic Ocean [30]. Furthermore, the intervals of shell weight convergence between the records would suggest an instantaneous decline in the wind-driven circulation and its attenuation of 18 ka for which no evidence exists. Alternatively, the shell weight variations are overall better explained by changes in the thermohaline circulation that match the 231Pa/230Th geochemical indications of AMOC cessation and thus increased shell masses are related to densification of the Atlantic waters. The geochemically reconstructed density estimates for SMCE II from GeoB 8502-2 in Table 2 agree within error (which is ±1.73 kg/m3 [17]) with the weight-based density estimates; however, more geochemical analyses of the present records are required to confirm the accuracy of the results.

6. Conclusions

Species-specific planktonic foraminifera shell weights have the potential to be a valuable tool for the determination of surface ocean paleoseawater circulation and thus a powerful proxy for physical paleoceanographic applications in paleoclimatology. The use of planktonic foraminifera shell weight as a direct seawater paleodensity proxy has revealed two intervals in the Atlantic Ocean during the past 200 kyr, when the meridional circulation may have been disrupted momentarily due to the absence of interhemispheric seawater density gradients in the Atlantic. Shell-weight-based seawater density values not only converge in the three studied cores within these extraordinary intervals but they also converge between both of these intervals to the same value, which also characterizes the modern Atlantic Ocean density at the same depth horizons. After the convergence at 18 ka, the Atlantic seawater density gradients alleviate and this weakening suggests a decline in the AMOC strength with only small variability thereafter.
Furthermore, it confirms that the surface South Atlantic has always been denser [67] and that, after the last convergence (at ~18.4 Ka) towards the Holocene, the interhemispheric surface Atlantic density gradients alleviate, possibly suggesting an attenuated AMOC thereafter.

Supplementary Materials

The following are available online at https://www.mdpi.com/article/10.3390/jmse9050519/s1, Table S1: G. bulloides sieve (300-355 μm) based shell weights from core GeoB 1710-3, Table S2: Biometric analyses of XμCT scanned G. bulloides specimens.

Funding

This research was published during my research fellowship at the University of Oxford funded by the Royal Society.

Data Availability Statement

The raw tomographic data from the XμCT scanning of G. bulloides specimens from core GeoB 8502-2 can be found at 10.6084/m9.figshare.14370959 and for core GeoB 1710-3 at 10.6084/m9.figshare.14397884.

Acknowledgments

I would like to thank the University of Bremen in Germany and the University of Cambridge in the United Kingdom for providing sample materials and resources. I would also like to thank the Maxwell Institute at the University of Cambridge for providing the X-ray facilities. This research was completed during my research fellowship in the University of Oxford, funded by the Royal Society under the Newton International Fellowships scheme.

Conflicts of Interest

The author declares no conflict of interest.

References

  1. Sigman, D.M.; Hain, M.P.; Haug, G.H. The polar ocean and glacial cycles in atmospheric CO2 concentration. Nature 2010, 466, 47–55. [Google Scholar] [CrossRef] [PubMed]
  2. Srokosz, M.A.; Bryden, H.L. Observing the Atlantic Meridional Overturning Circulation yields a decade of inevitable surprises. Science 2015, 348, 1255575. [Google Scholar] [CrossRef] [PubMed] [Green Version]
  3. Wunsch, C. What Is the Thermohaline Circulation? Science 2002, 298, 1179–1181. [Google Scholar] [CrossRef] [PubMed] [Green Version]
  4. Fedorov, A.; Barreiro, M.; Boccaletti, G.; Pacanowski, R.; Philander, S.G. The Freshening of Surface Waters in High Latitudes: Effects on the Thermohaline and Wind-Driven Circulations. J. Phys. Oceanogr. 2007, 37, 896–907. [Google Scholar] [CrossRef] [Green Version]
  5. McManus, J.F.; Francois, R.; Gherardi, J.M.; Keigwin, L.D.; Brown-Leger, S. Collapse and rapid resumption of Atlantic meridional circulation linked to deglacial climate changes. Nature 2004, 428, 834–837. [Google Scholar] [CrossRef]
  6. Robinson, L.F.; Adkins, J.F.; Keigwin, L.D.; Southon, J.; Fernandez, D.P.; Wang, S.-L.; Scheirer, D.S. Radiocarbon Variability in the Western North Atlantic During the Last Deglaciation. Science 2005, 310, 1469–1473. [Google Scholar] [CrossRef] [Green Version]
  7. Rogerson, M.; Bigg, G.R.; Rohling, E.J.; Ramirez, J. Vertical density gradient in the eastern North Atlantic during the last 30,000 years. Clim. Dyn. 2012, 39, 589–598. [Google Scholar] [CrossRef]
  8. Lynch-Stieglitz, J.; Adkins, J.F.; Curry, W.B.; Dokken, T.; Hall, I.R.; Herguera, J.C.; Hirschi, J.J.-M.; Ivanova, E.V.; Kissel, C.; Marchal, O.; et al. Atlantic Meridional Overturning Circulation During the Last Glacial Maximum. Science 2007, 316, 66–69. [Google Scholar] [CrossRef] [Green Version]
  9. Lipps, J.H. Ecology and Paleoecology of Planktic Foraminifera. In Foraminiferal Ecology and Paleoecology; Lipps, J.H., Berger, W.H., Buzas, M.A., Douglas, R.G., Ross, C.A., Eds.; SEPM Society for Sedimentary Geology: Tulsa, OK, USA, 1979; Volume 6, pp. 62–104. [Google Scholar]
  10. Hemleben, C.; Anderson, O.R.; Spindler, M. Modern Planktonic Foraminifera; Springer: New York, NY, USA, 1989. [Google Scholar]
  11. Emiliani, C. Depth habitats of some species of pelagic foraminifera as indicated by oxygen isotope ratios. Am. J. Sci. 1954, 252, 149–158. [Google Scholar] [CrossRef]
  12. de Nooijer, L.J.; Toyofuku, T.; Kitazato, H. Foraminifera promote calcification by elevating their intracellular pH. Proc. Natl. Acad. Sci. USA 2009, 106, 15374–15378. [Google Scholar] [CrossRef] [Green Version]
  13. Toyofuku, T.; Matsuo, M.Y.; de Nooijer, L.J.; Nagai, Y.; Kawada, S.; Fujita, K.; Reichart, G.-J.; Nomaki, H.; Tsuchiya, M.; Sakaguchi, H.; et al. Proton pumping accompanies calcification in foraminifera. Nat. Commun. 2017, 8, 14145. [Google Scholar] [CrossRef]
  14. Erez, J. Vital effect on stable-isotope composition seen in foraminifera and coral skeletons. Nature 1978, 273, 199–202. [Google Scholar] [CrossRef]
  15. Marszalek, D.S. The role of heavy skeletons in vertical movements of non-motile zooplankton. Mar. Behav. Physiol. 1982, 8, 295–303. [Google Scholar] [CrossRef]
  16. Campbell, R.W.; Dower, J.F. Role of lipids in the maintenance of neutral buoyancy by zooplankton. Mar. Ecol. Prog. Ser. 2003, 263, 93–99. [Google Scholar] [CrossRef] [Green Version]
  17. Zarkogiannis, S.D.; Antonarakou, A.; Tripati, A.; Kontakiotis, G.; Mortyn, P.G.; Drinia, H.; Greaves, M. Influence of surface ocean density on planktonic foraminifera calcification. Sci. Rep. 2019, 9, 533. [Google Scholar] [CrossRef]
  18. Embley, R.W.; Morley, J.J. Quaternary sedimentation and paleoenvironmental studies off Namibia (South-West Africa). Mar. Geol. 1980, 36, 183–204. [Google Scholar] [CrossRef]
  19. De Ruijter, W.P.M.; Biastoch, A.; Drijfhout, S.S.; Lutjeharms, J.R.E.; Matano, R.P.; Pichevin, T.; van Leeuwen, P.J.; Weijer, W. Indian-Atlantic interocean exchange: Dynamics, estimation and impact. J. Geophys. Res. 1999, 104, 20885–20910. [Google Scholar] [CrossRef]
  20. Garzoli, S.L.; Gordon, A.L. Origins and variability of the Benguela Current. J. Geophys. Res. 1996, 101, 897–906. [Google Scholar] [CrossRef]
  21. Lutjeharms, J.R.E. The exchange of water between the South Indian and South Atlantic Oceans. In The South Atlantic: Present and Past Circulation; Wefer, G., Berger, W.H., Siedler, G., Webb, D.J., Eds.; Springer: Berlin/Heidelberg, Germany, 1996; pp. 125–162. [Google Scholar]
  22. Bainbridge, A.E. GEOSECS Atlantic Expedition: Sections and Profiles; National Science Foundation: Washington, DC, USA, 1980.
  23. Broecker, W.; Blanton, S.; Smethie, W.M., Jr.; Ostlund, G. Radiocarbon decay and oxygen utilization in the Deep Atlantic Ocean. Glob. Biogeochem. Cycles 1991, 5, 87–117. [Google Scholar] [CrossRef]
  24. Stramma, L.; England, M. On the water masses and mean circulation of the South Atlantic Ocean. J. Geophys. Res. 1999, 104, 20863–20883. [Google Scholar] [CrossRef]
  25. Reid, J.L. On the total geostrophic circulation of the South Atlantic Ocean: Flow patterns, tracers, and transports. Prog. Oceanogr. 1989, 23, 149–244. [Google Scholar] [CrossRef]
  26. Sloyan, B.M. Antarctic bottom and lower circumpolar deep water circulation in the eastern Indian Ocean. J. Geophys. Res. 2006, 111, C02006. [Google Scholar] [CrossRef]
  27. Dittert, N.; Henrich, R. Carbonate dissolution in the South Atlantic Ocean: Evidence from ultrastructure breakdown in Globigerina bulloides. Deep Sea Res. Part 1 Oceanogr. Res. Pap. 2000, 47, 603–620. [Google Scholar] [CrossRef]
  28. Christl, M.; Mangini, A. Water mass properties and circulation in the Cape Basin. A multiproxy approach. Geochim. Cosmochim. Acta 2009, 73, A224. [Google Scholar]
  29. Volbers, A.N.A.; Henrich, R. Late Quaternary variations in calcium carbonate preservation of deep-sea sediments in the northern Cape Basin: Results from a multiproxy approach. Mar. Geol. 2002, 180, 203–220. [Google Scholar] [CrossRef]
  30. Aouni, A.E.; Daoudi, K.; Yahia, H.; Minaoui, K.; Benazzouz, A. Surface mixing and biological activity in the North-West African upwelling. Chaos Interdiscip. J. Nonlinear Sci. 2019, 29, 011104. [Google Scholar] [CrossRef] [Green Version]
  31. Mittelstaedt, E. The ocean boundary along the northwest African coast: Circulation and oceanographic properties at the sea surface. Prog. Oceanogr. 1991, 26, 307–355. [Google Scholar] [CrossRef]
  32. Stramma, L.; Hόttl, S.; Schafstall, J. Water masses and currents in the upper tropical northeast Atlantic off northwest Africa. J. Geophys. Res. 2005, 110, C12006. [Google Scholar] [CrossRef] [Green Version]
  33. Howe, J.N.W.; Piotrowski, A.M.; Noble, T.L.; Mulitza, S.; Chiessi, C.M.; Bayon, G. North Atlantic Deep Water Production during the Last Glacial Maximum. Nat. Commun. 2016, 7, 11765. [Google Scholar] [CrossRef]
  34. Didié, C.; Bauch, H.A. Species composition and glacial-interglacial variations in the ostracode fauna of the northeast Atlantic during the past 200,000 years. Mar. Micropaleontol. 2000, 40, 105–129. [Google Scholar] [CrossRef]
  35. Broecker, W.S. Thermohaline circulation, the Achilles heel of our climate system: Will man-made CO2 upset the current balance? Science 1997, 278, 1582–1588. [Google Scholar] [CrossRef] [PubMed] [Green Version]
  36. Hansen, B.; Østerhus, S.; Quadfasel, D.; Turrell, W. Already the day after tomorrow? Science 2004, 305, 953–954. [Google Scholar] [CrossRef] [PubMed]
  37. Kawase, M.; Sarmiento, J.L. Circulation and nutrients in middepth Atlantic waters. J. Geophys. Res. 1986, 91, 9749–9770. [Google Scholar] [CrossRef] [Green Version]
  38. Manighetti, B.; McCave, I.N. Late glacial and Holocene palaeocurrents around Rockall Bank, NE Atlantic Ocean. Paleoceanography 1995, 10, 611–626. [Google Scholar] [CrossRef]
  39. Barker, S.; Archer, D.; Booth, L.; Elderfield, H.; Henderiks, J.; Rickaby, R.E.M. Globally increased pelagic carbonate production during the Mid-Brunhes dissolution interval and the CO2 paradox of MIS 11. Quat. Sci. Rev. 2006, 25, 3278–3293. [Google Scholar] [CrossRef]
  40. Zarkogiannis, S.D.; Antonarakou, A.; Fernandez, V.; Mortyn, P.G.; Kontakiotis, G.; Drinia, H.; Greaves, M. Evidence of stable foraminifera biomineralization during the last two climate cycles in the tropical Atlantic Ocean. J. Mar. Sci. Eng. 2020, 8, 737. [Google Scholar] [CrossRef]
  41. Schmiedl, G.; Mackensen, A. Age model of sediment core GeoB1710-3. PANGAEA 1997. [Google Scholar] [CrossRef]
  42. Volbers, A.N.A.; Niebler, H.S.; Giraudeau, J.; Schmidt, H.; Henrich, R. Paleoceanographic changes in the northern Benguela upwelling system over the last 245.000 years as derived from planktic foraminifera assemblages. In The South Atlantic in the Late Quaternary: Reconstruction of Material Budget and Current Systems; Wefer, G., Mulitza, S., Ratmeyer, V., Eds.; Springer: Berlin/Heidelberg, Germany; New York, NY, USA, 2004; pp. 601–622. [Google Scholar]
  43. Barker, S.; Kiefer, T.; Elderfield, H. Temporal changes in North Atlantic circulation constrained by planktonic foraminiferal shell weights. Paleoceanography 2004, 19, PA3008. [Google Scholar] [CrossRef]
  44. Volbers, A.N.A.; Henrich, R. Present water mass calcium carbonate corrosiveness in the eastern South Atlantic inferred from ultrastructural breakdown of Globigerina bulloides in surface sediments. Mar. Geol. 2002, 186, 471–486. [Google Scholar] [CrossRef]
  45. Zarkogiannis, S.D.; Kontakiotis, G.; Gkaniatsa, G.; Kuppili, V.S.C.; Marathe, S.; Wanelik, K.; Lianou, V.; Besiou, E.; Makri, P.; Antonarakou, A. An Improved Cleaning Protocol for Foraminiferal Calcite from Unconsolidated Core Sediments: HyPerCal—A New Practice for Micropaleontological and Paleoclimatic Proxies. J. Mar. Sci. Eng. 2020, 8, 998. [Google Scholar] [CrossRef]
  46. Broecker, W.; Clark, E. An evaluation of Lohmann’s Foraminifera weight dissolution index. Paleoceanography 2001, 16, 531–534. [Google Scholar] [CrossRef]
  47. Zarkogiannis, S.; Fernandez, V.; Greaves, M.; Mortyn, P.G.; Kontakiotis, G.; Antonarakou, A. X-ray tomographic data of planktonic foraminifera species Globigerina bulloides from the Eastern Tropical Atlantic across Termination II. Gigabyte 2020, 1. [Google Scholar] [CrossRef]
  48. Iwasaki, S.; Kimoto, K.; Sasaki, O.; Kano, H.; Uchida, H. Sensitivity of planktic foraminiferal test bulk density to ocean acidification. Sci. Rep. 2019, 9, 9803. [Google Scholar] [CrossRef]
  49. Cheng, J.; Liu, Z.; Zhang, S.; Liu, W.; Dong, L.; Liu, P.; Li, H. Reduced interdecadal variability of Atlantic Meridional Overturning Circulation under global warming. Proc. Natl. Acad. Sci. USA 2016, 113, 3175–3178. [Google Scholar] [CrossRef] [Green Version]
  50. Schenk, F.; Väliranta, M.; Muschitiello, F.; Tarasov, L.; Heikkilä, M.; Björck, S.; Brandefelt, J.; Johansson, A.V.; Näslund, J.-O.; Wohlfarth, B. Warm summers during the Younger Dryas cold reversal. Nat. Commun. 2018, 9, 1634. [Google Scholar] [CrossRef] [Green Version]
  51. Zarkogiannis, S.D.; Kontakiotis, G.; Antonarakou, A.; Mortyn, P.G.; Drinia, H. Latitudinal Variation of Planktonic Foraminifera Shell Masses During Termination I. IOP Conf. Ser. Earth Environ. Sci. 2019, 221, 12052. [Google Scholar] [CrossRef]
  52. Gordon, A.L.; Piola, A.R. Atlantic Ocean Upper Layer Salinity Budget. J. Phys. Oceanogr. 1983, 13, 1293–1300. [Google Scholar] [CrossRef]
  53. Johnson, G.C.; Schmidtko, S.; Lyman, J.M. Relative contributions of temperature and salinity to seasonal mixed layer density changes and horizontal density gradients. J. Geophys. Res. Ocean. 2012, 117. [Google Scholar] [CrossRef]
  54. Deininger, M.; McDermott, F.; Cruz, F.W.; Bernal, J.P.; Mudelsee, M.; Vonhof, H.; Millo, C.; Spötl, C.; Treble, P.C.; Pickering, R.; et al. Inter-Hemispheric synchroneity of Holocene precipitation anomalies controlled by Earth’s latitudinal insolation gradients. Nat. Commun. 2020, 11, 5447. [Google Scholar] [CrossRef]
  55. Davis, B.A.S.; Brewer, S. Orbital forcing and role of the latitudinal insolation/temperature gradient. Clim. Dyn. 2009, 32, 143–165. [Google Scholar] [CrossRef] [Green Version]
  56. Stokes, S.; Haynes, G.; Thomas, D.S.G.; Horrocks, J.L.; Higginson, M.; Malifa, M. Punctuated aridity in southern Africa during the last glacial cycle: The chronology of linear dune construction in the northeastern Kalahari. Palaeogeogr. Palaeoclimatol. Palaeoecol. 1998, 137, 305–322. [Google Scholar] [CrossRef]
  57. Fuhrmann, F.; Diensberg, B.; Gong, X.; Lohmann, G.; Sirocko, F. Aridity synthesis for eight selected key regions of the global climate system during the last 60 000 years. Clim. Past 2020, 16, 2221–2238. [Google Scholar] [CrossRef]
  58. Tierney, J.E.; deMenocal, P.B.; Zander, P.D. A climatic context for the out-of-Africa migration. Geology 2017, 45, 1023–1026. [Google Scholar] [CrossRef] [Green Version]
  59. Lisiecki, L.E.; Raymo, M.E. A Pliocene-Pleistocene stack of 57 globally distributed benthic δ18O records. Paleoceanography 2005, 20, PA1003. [Google Scholar] [CrossRef] [Green Version]
  60. Rohling, E.J.; Fenton, M.; Jorissen, F.J.; Bertrand, P.; Ganssen, G.; Caulet, J.P. Magnitudes of sea-level lowstands of the past 500,000 years. Nature 1998, 394, 162–165. [Google Scholar] [CrossRef]
  61. Heinrich, H. Origin and consequences of cyclic ice rafting in the Northeast Atlantic Ocean during the past 130,000 years. Quat. Res. 1988, 29, 142–152. [Google Scholar] [CrossRef]
  62. McManus, J.F.; Oppo, D.W.; Cullen, J.L. A 0.5-Million-Year Record of Millennial-Scale Climate Variability in the North Atlantic. Science 1999, 283, 971–975. [Google Scholar] [CrossRef]
  63. Margari, V.; Skinner, L.C.; Tzedakis, P.C.; Ganopolski, A.; Vautravers, M.; Shackleton, N.J. The nature of millennial-scale climate variability during the past two glacial periods. Nat. Geosci. 2010, 3, 127–131. [Google Scholar] [CrossRef]
  64. Hodell, D.A.; Channell, J.E.T.; Curtis, J.H.; Romero, O.E.; Röhl, U. Onset of “Hudson Strait” Heinrich events in the eastern North Atlantic at the end of the middle Pleistocene transition (∼640 ka)? Paleoceanography 2008, 23. [Google Scholar] [CrossRef] [Green Version]
  65. Chappell, J. Sea level changes forced ice breakouts in the Last Glacial cycle: New results from coral terraces. Quat. Sci. Rev. 2002, 21, 1229–1240. [Google Scholar] [CrossRef]
  66. Martínez-Méndez, G.; Zahn, R.; Hall, I.R.; Peeters, F.J.C.; Pena, L.D.; Cacho, I.; Negre, C. Contrasting multiproxy reconstructions of surface ocean hydrography in the Agulhas Corridor and implications for the Agulhas Leakage during the last 345,000 years. Paleoceanography 2010, 25, PA4227. [Google Scholar] [CrossRef] [Green Version]
  67. Reid, J.L. On the temperature, salinity, and density differences between the Atlantic and Pacific oceans in the upper kilometre. Deep Sea Res. 1961, 7, 265–275. [Google Scholar] [CrossRef]
  68. Marchal, O.; François, R.; Stocker, T.F.; Joos, F. Ocean thermohaline circulation and sedimentary 231Pa/230Th ratio. Paleoceanography 2000, 15, 625–641. [Google Scholar] [CrossRef]
  69. Mokeddem, Z.; McManus, J.F.; Oppo, D.W. Oceanographic dynamics and the end of the last interglacial in the subpolar North Atlantic. Proc. Natl. Acad. Sci. USA 2014, 111, 11263–11268. [Google Scholar] [CrossRef] [Green Version]
  70. Irvalı, N.; Ninnemann, U.S.; Kleiven, H.F.; Galaasen, E.V.; Morley, A.; Rosenthal, Y. Evidence for regional cooling, frontal advances, and East Greenland Ice Sheet changes during the demise of the last interglacial. Quat. Sci. Rev. 2016, 150, 184–199. [Google Scholar] [CrossRef]
  71. Guihou, A.; Pichat, S.; Govin, A.; Nave, S.; Michel, E.; Duplessy, J.-C.; Telouk, P.; Labeyrie, L. Enhanced Atlantic Meridional Overturning Circulation supports the Last Glacial Inception. Quat. Sci. Rev. 2011, 30, 1576–1582. [Google Scholar] [CrossRef]
  72. Labeyrie, L.D.; Duplessy, J.C.; Blanc, P.L. Variations in mode of formation and temperature of oceanic deep waters over the past 125,000 years. Nature 1987, 327, 477–482. [Google Scholar] [CrossRef]
  73. Johnsen, S.J.; Dahl-Jensen, D.; Gundestrup, N.; Steffensen, J.P.; Clausen, H.B.; Miller, H.; Masson-Delmotte, V.; Sveinbjörnsdottir, A.E.; White, J. Oxygen isotope and palaeotemperature records from six Greenland ice-core stations: Camp Century, Dye-3, GRIP, GISP2, Renland and NorthGRIP. J. Quat. Sci. 2001, 16, 299–307. [Google Scholar] [CrossRef]
  74. McManus, J.F.; Oppo, D.W.; Keigwin, L.D.; Cullen, J.L.; Bond, G.C. Thermohaline Circulation and Prolonged Interglacial Warmth in the North Atlantic. Quat. Res. 2017, 58, 17–21. [Google Scholar] [CrossRef]
  75. Risebrobakken, B.; Dokken, T.; Jansen, E. Extent and Variability of the Meridional Atlantic Circulation in the Eastern Nordic Seas During Marine Isotope Stage 5 and its Influence on the Inception of the Last Glacial. In The Nordic Seas: An Integrated Perspective; American Geophysical Union: Washington, DC, USA, 2005; pp. 323–339. [Google Scholar] [CrossRef]
  76. Khodri, M.; Leclainche, Y.; Ramstein, G.; Braconnot, P.; Marti, O.; Cortijo, E. Simulating the amplification of orbital forcing by ocean feedbacks in the last glaciation. Nature 2001, 410, 570–574. [Google Scholar] [CrossRef]
  77. Tomczak, M.; Godfrey, J.S. Water mass formation, subduction, and the oceanic heat budget. In Regional Oceanography; Tomczak, M., Godfrey, J.S., Eds.; Pergamon: Amsterdam, The Netherlands, 1994; pp. 53–65. [Google Scholar] [CrossRef]
  78. Roberts, J.; Gottschalk, J.; Skinner, L.C.; Peck, V.L.; Kender, S.; Elderfield, H.; Waelbroeck, C.; Vázquez Riveiros, N.; Hodell, D.A. Evolution of South Atlantic density and chemical stratification across the last deglaciation. Proc. Natl. Acad. Sci. USA 2016, 113, 514–519. [Google Scholar] [CrossRef] [Green Version]
  79. Yu, E.-F.; Francois, R.; Bacon, M.P. Similar rates of modern and last-glacial ocean thermohaline circulation inferred from radiochemical data. Nature 1996, 379, 689–694. [Google Scholar] [CrossRef]
  80. Bond, G.; Heinrich, H.; Broecker, W.; Labeyrie, L.; McManus, J.; Andrews, J.; Huon, S.; Jantschik, R.; Clasen, S.; Simet, C.; et al. Evidence for massive discharges of icebergs into the North Atlantic ocean during the last glacial period. Nature 1992, 360, 245–249. [Google Scholar] [CrossRef]
  81. Bard, E.; Rostek, F.; Turon, J.-L.; Gendreau, S. Hydrological Impact of Heinrich Events in the Subtropical Northeast Atlantic. Science 2000, 289, 1321–1324. [Google Scholar] [CrossRef] [Green Version]
  82. Duplessy, J.C.; Labeyrie, L.; Arnold, M.; Paterne, M.; Duprat, J.; van Weering, T.C.E. Changes in surface salinity of the North Atlantic Ocean during the last deglaciation. Nature 1992, 358, 485–488. [Google Scholar] [CrossRef]
  83. Vidal, L.; Labeyrie, L.; Cortijo, E.; Arnold, M.; Duplessy, J.C.; Michel, E.; Becqué, S.; van Weering, T.C.E. Evidence for changes in the North Atlantic Deep Water linked to meltwater surges during the Heinrich events. Earth Planet. Sci. Lett. 1997, 146, 13–27. [Google Scholar] [CrossRef]
  84. Elliot, M.; Labeyrie, L.; Duplessy, J.-C. Changes in North Atlantic deep-water formation associated with the Dansgaard–Oeschger temperature oscillations (60–10 ka). Quat. Sci. Rev. 2002, 21, 1153–1165. [Google Scholar] [CrossRef]
  85. Lippold, J.; Gutjahr, M.; Blaser, P.; Christner, E.; de Carvalho Ferreira, M.L.; Mulitza, S.; Christl, M.; Wombacher, F.; Böhm, E.; Antz, B.; et al. Deep water provenance and dynamics of the (de)glacial Atlantic meridional overturning circulation. Earth Planet. Sci. Lett. 2016, 445, 68–78. [Google Scholar] [CrossRef] [Green Version]
  86. Lynch-Stieglitz, J. The Atlantic Meridional Overturning Circulation and Abrupt Climate Change. Ann. Rev. Mar. Sci. 2017, 9, 83–104. [Google Scholar] [CrossRef] [Green Version]
  87. Oppo, D.W.; Gebbie, G.; Huang, K.-F.; Curry, W.B.; Marchitto, T.M.; Pietro, K.R. Data Constraints on Glacial Atlantic Water Mass Geometry and Properties. Paleoceanogr. Paleoclimatol. 2018, 33, 1013–1034. [Google Scholar] [CrossRef]
  88. Lippold, J.; Pöppelmeier, F.; Süfke, F.; Gutjahr, M.; Goepfert, T.J.; Blaser, P.; Friedrich, O.; Link, J.M.; Wacker, L.; Rheinberger, S.; et al. Constraining the Variability of the Atlantic Meridional Overturning Circulation During the Holocene. Geophys. Res. Lett. 2019, 46, 11338–11346. [Google Scholar] [CrossRef] [Green Version]
  89. Keigwin, L.D.; Boyle, E.A. Detecting Holocene changes in thermohaline circulation. Proc. Natl. Acad. Sci. USA 2000, 97, 1343–1346. [Google Scholar] [CrossRef] [PubMed] [Green Version]
  90. Oppo, D.W.; McManus, J.F.; Cullen, J.L. Deepwater variability in the Holocene epoch. Nature 2003, 422, 277. [Google Scholar] [CrossRef] [PubMed]
  91. Caesar, L.; Rahmstorf, S.; Robinson, A.; Feulner, G.; Saba, V. Observed fingerprint of a weakening Atlantic Ocean overturning circulation. Nature 2018, 556, 191–196. [Google Scholar] [CrossRef]
  92. Rahmstorf, S.; Box, J.E.; Feulner, G.; Mann, M.E.; Robinson, A.; Rutherford, S.; Schaffernicht, E.J. Exceptional twentieth-century slowdown in Atlantic Ocean overturning circulation. Nat. Clim. Chang. 2015, 5, 475–480. [Google Scholar] [CrossRef] [Green Version]
  93. Thornalley, D.J.R.; Oppo, D.W.; Ortega, P.; Robson, J.I.; Brierley, C.M.; Davis, R.; Hall, I.R.; Moffa-Sanchez, P.; Rose, N.L.; Spooner, P.T.; et al. Anomalously weak Labrador Sea convection and Atlantic overturning during the past 150 years. Nature 2018, 556, 227–230. [Google Scholar] [CrossRef]
  94. Argo. Argo Float Data and Metadata from Global Data Assembly Centre (Argo GDAC). SEANOE: 2000. Available online: https://www.seanoe.org/data/00311/42182/ (accessed on 1 February 2021). [CrossRef]
  95. Mortyn, P.G.; Charles, C.D. Planktonic foraminiferal depth habitat and δ18O calibrations: Plankton tow results from the Atlantic sector of the Southern Ocean. Paleoceanography 2003, 18, 1037. [Google Scholar] [CrossRef] [Green Version]
  96. Saraswat, R.; Khare, N. Deciphering The Modern Calcification Depth Of Globigerina Bulloides In The Southwestern Indian Ocean From Its Oxygen Isotopic Composition. J. Foraminifer. Res. 2010, 40, 220–230. [Google Scholar] [CrossRef] [Green Version]
  97. Prasanna, K.; Ghosh, P.; Bhattacharya, S.K.; Mohan, K.; Anilkumar, N. Isotopic disequilibrium in Globigerina bulloides and carbon isotope response to productivity increase in Southern Ocean. Sci. Rep. 2016, 6, 21533. [Google Scholar] [CrossRef] [Green Version]
  98. Kretschmer, K.; Jonkers, L.; Kucera, M.; Schulz, M. Modeling seasonal and vertical habitats of planktonic foraminifera on a global scale. Biogeosciences 2018, 15, 4405–4429. [Google Scholar] [CrossRef] [Green Version]
  99. Schiebel, R.; Hemleben, C. Interannual variability of planktic foraminiferal populations and test flux in the eastern North Atlantic Ocean (JGOFS). Deep Sea Res. Part II Top. Stud. Oceanogr. 2000, 47, 1809–1852. [Google Scholar] [CrossRef]
  100. Vázquez Riveiros, N.; Govin, A.; Waelbroeck, C.; Mackensen, A.; Michel, E.; Moreira, S.; Bouinot, T.; Caillon, N.; Orgun, A.; Brandon, M. Mg/Ca thermometry in planktic foraminifera: Improving paleotemperature estimations for G. bulloides and N. pachyderma left. Geochem. Geophys. Geosyst. 2016, 17, 1249–1264. [Google Scholar] [CrossRef] [Green Version]
  101. Emiliani, C. Depth habitats of growth stages of pelagic foraminifera. Science 1971, 173, 1122–1124. [Google Scholar] [CrossRef]
  102. Waterson, A.M.; Edgar, K.M.; Schmidt, D.N.; Valdes, P.J. Quantifying the stability of planktic foraminiferal physical niches between the Holocene and Last Glacial Maximum. Paleoceanography 2017, 32, 74–89. [Google Scholar] [CrossRef] [Green Version]
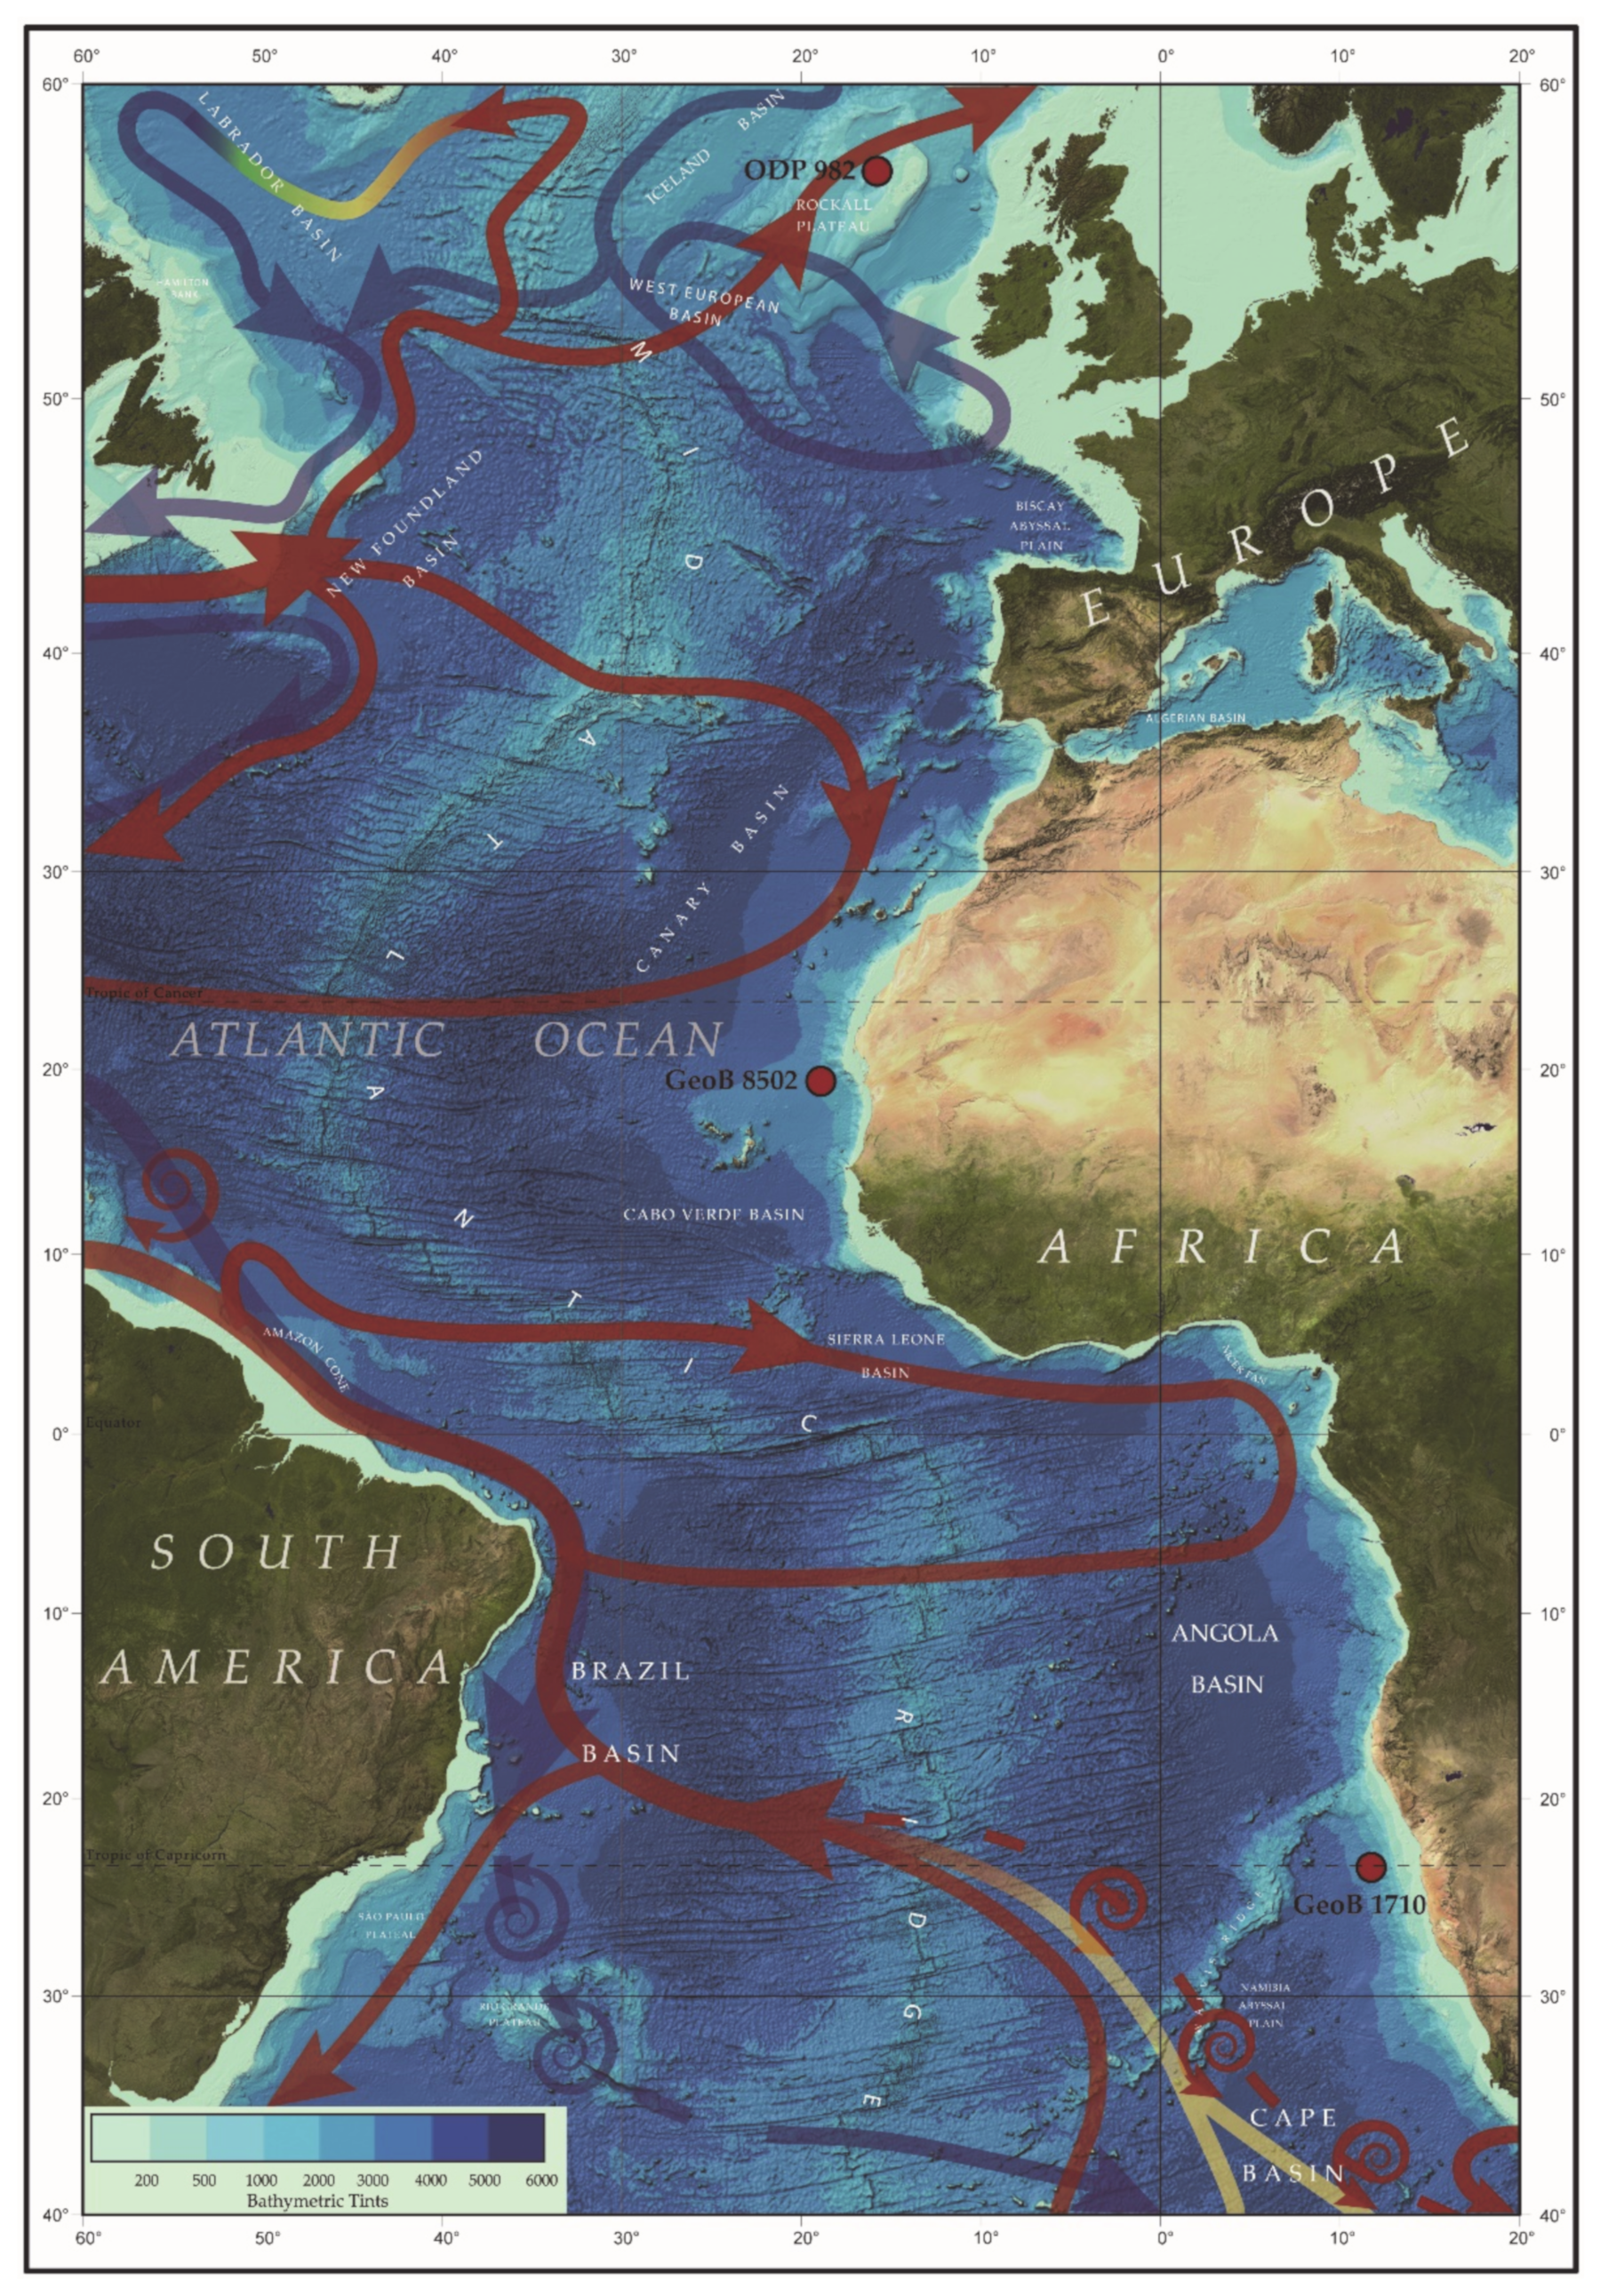
Figure 1. Location of the sediment cores and schematic of the Atlantic Meridional Overturning Circulation. Red is the surface flow, blue the deep one, and yellow and green represent transition flows between depths. Terrain after the general bathymetric chart of the Ocean.
Jmse 09 00519 g001
Figure 2. Shell weight records of the last 200 kyr (before present, BP) for: (a) core GeoB 1710-3 from the eastern South Atlantic; (b) core GeoB 8502-2 from the eastern Equatorial Atlantic [40]; and (c) core ODP 982 from the eastern North Atlantic. The 1σ confidence interval for each shell mass plot is shown as a color-shaded area. Numbers refer to Marine Isotopic Stages (MIS) or substages and grey-shaded areas interglacial periods. Data are available in Supplementary Table S1.
Jmse 09 00519 g002
Figure 3. Atlantic Ocean density reconstructions for the last 200 kyr based on planktonic foraminifera shell weights from three different sites. Note the convergence in seawater density/planktonic foraminifera shell mass values for two instances in the records and how these values match the modern seawater densities.
Jmse 09 00519 g003
Figure 4. X-ray tomographs of G. bulloides specimens of cores GeoB 8502-2 and GeoB 1710-3; (a–d) specimens from shell mass convergence event SMCE I; (e–h) specimens from SMCE II; and (i–j) Last Glacial Maximum specimens from core GeoB 1710-3.
Jmse 09 00519 g004
Figure 5. The hydrographic properties of water parcels are strongly influenced by the atmosphere through air–sea interaction and once subducted from the surface layer the density (temperature and salinity) of a water parcel is conserved and remains constant since mixing across isopycnal surfaces is generally much weaker than mixing on isopycnal surfaces [77]. In oceanic regions of normal salinity conditions, the latitudinal temperature changes determine the density of the subducted waters. (a) During extreme glacial conditions, such as the LGM, enhanced atmospheric thermal gradients increase the number of seawater subduction zones that lead to enhanced oceanic density gradients (Figure 3) and thus more vigorous oceanic circulation; (b) during deglacial times of relaxed thermal gradients, surface ocean stratification prevails that can lead to the cessation of the oceanic circulation (SMCEs). Note the density difference between the glacial and interglacial ocean, which can be up to ~3.5 kg/m3 [78] due to ice cap buildup. However, the seawater density of tropical regions under the influence of the ITCZ is expected to be stable with perhaps only small glacial/interglacial variations.
Jmse 09 00519 g005
Table 1. List of the core sites.
CoreLatitudeLongitudeDepth (m)
ODP 982A57°30.99’ N15°52.00’ W1135
GeoB 8502-219°13.27’ N18°56.04’ W2956
GeoB 1710-323°25.9’ S11°41.9’ E2987
Table 2. Summary of G. bulloides shell masses and the mass-derived seawater densities for the three different Atlantic sites across the two SMCEs during the last two deglaciations. The reconstructed densities presented in the last column are geochemically reconstructed seawater densities during SMCE II published in Zarkogiannis, et al. [40] for core GeoB 8502-2.
SMCE I—Last DeglaciationSMCE II—Penultimate Deglaciation
SitesAge (ka)Weight (μg)Derived Density (kg/m3)Age (ka)Weight (μg)Derived Density (kg/m3)Reconstructed Density (kg/m3)
ODP 982A16.4215.61027.35120.1213.91026.85
18.4013.41026.71122.6013.91026.85
21.3820.61028.82125.0814.01026.88
GeoB 8502-216.9513.91026.85121.0813.31026.691027.21
18.1014.31026.98122.5113.61026.761026.10
19.2615.31027.28123.9313.11026.621027.14
GeoB 1710-317.0817.31027.84119.4914.21026.95
18.6514.01026.89121.9613.61026.76
20.1525.41030.22124.4014.81027.11
Table 3. Biometric data of foraminifera from weighing and XμCT analysis. Test thickness is the ratio of calcite volume to calcite surface, and shell and test density are the ratio of the average shell weight to test and shell volume, respectively. Sediment infilling is the specimen’s internal volume percentage occupied by sediment impurities. The μCT analysis results for individual specimens are given in Supplementary Table S2.
PeriodSiteAge (kyrs)Test Mass (μg)Test Thickness (μm)Cell Volume (μm3)Sediment Infilling (%)Test %Shell Density (g/cm3)Test Density (g/cm3)
Last
Deglaciation
GeoB 850218.1014.3 ± 2.25.1 ± 0.721,737,763 ±15%4%23%0.662.71
GeoB 171018.6514.0 ± 1.74.7 ± 0.524,155,433 ± 7%2%22%0.582.69
Penultimate DeglaciationGeoB 8502122.5113.6 ± 2.45.0 ± 0.422,326,089 ± 9%5%23%0.612.62
GeoB 1710121.9613.6 ± 1.55.2 ± 0.721,270,578 ± 10%7%25%0.642.60
Last Glacial MaximumGeoB 171020.1525.4 ± 0.511.0± 17%27,088,617± 6%6%42%0.942.24
Publisher’s Note: MDPI stays neutral with regard to jurisdictional claims in published maps and institutional affiliations.