Article

Effect of Maritime Traffic on Water Quality Parameters in Santa Marta, Colombia

by
René Rodríguez-Grimón
1,2,3,*,
Nestor Hernando Campos
2 and
Ítalo Braga Castro
4
1
Doctor Program in Marine Biology, Universidad Nacional de Colombia, Bogotá 111321, Colombia
2
Instituto de Estudios en Ciencias del Mar—CECIMAR, Universidad Nacional de Colombia, Bogotá 111321, Colombia
3
Escuela de Ciencias Ambientales, Universidad Espíritu Santo, Guayaquil 092301, Ecuador
4
Instituto de Ciências do Mar, Universidade Federal de São Paulo, Santos 11030-100, Brazil
*
Author to whom correspondence should be addressed.
J. Mar. Sci. Eng. 2021, 9(5), 474; https://doi.org/10.3390/jmse9050474
Submission received: 11 March 2021 / Revised: 22 April 2021 / Accepted: 24 April 2021 / Published: 28 April 2021
(This article belongs to the Special Issue Monitoring and Assessment of Marine Environmental Pressures)

Abstract

:
Since 2013, there has been an increase (>23%) in naval traffic using maritime routes and ports on the coastal fringe of Santa Marta, Colombia. Of major concern, and described by several studies, is the relationship between maritime traffic and coastal contamination. This study proposed a maritime traffic indicator considering the simultaneous effects of several relevant measurements of water quality parameters to estimate the impact of naval activity. The approach involved developing a model including the number of vessels, hull length, and permanence time in berths. In addition, water quality variables, considering climatic seasons, were used to verify association with maritime traffic and touristic activities. The high concentrations of total coliforms (TC) and dissolved/dispersed petroleum hydrocarbons in chrysene equivalents (DDPH) reported by the International Marina of Santa Marta (SM) were affected by the local anthropic activities, including tourism, naval traffic, and urban wastewater discharges. Moreover, our results suggest the occurrence of multiple chemical impacts within Tayrona National Natural Park (PNNT) affecting conservation goals. The estimation of the maritime traffic indicator proposed in this study may be an easy and more complete tool for future studies evaluating the impact of naval activities on environmental quality.

1. Introduction

Maritime transport is one of the world’s largest economic entrepreneurships accounting for 80% of the world’s commercial trade [1]. A great number of maritime routes have been established around the world to provide logistically efficient and rentable paths for sea transportation. However, at the same time, maritime traffic (MT) is negatively affecting marine environments [2,3]. In fact, ship and boat traffic produce water contamination by oil [4,5,6], toxic metals [7,8], and several antifouling biocides [9]. In addition, atmospheric emissions contributing to the greenhouse effect are also a relevant impact related to MT [10,11,12]. Consequently, marine water chemistry changes, including ocean acidification and coastal contamination, have often been reported worldwide [13,14]. In urban environments and particularly in marine port cities, pollutant inputs can act together, affecting air quality conditions and water quality parameters. In such locations, terrestrial and maritime traffic associated with industrial complexes, marinas, and commercial ports, have been considered relevant contaminant sources [3,6,14,15,16,17].
In several studies assessing ship and boat traffic impacts on environmental quality, the MT variable has been used as semi-quantitative data, expressing the number of ships in scale (null, low, medium, and high) [6,18,19,20]. On the other hand, quantitative treatments of the MT variable have used the number of boats or ships [21,22,23,24], transported load weight [23,25,26], number of transported passengers [27], and ship/boat permanence time during commercial operations [10,14,28]. In this regard, the historical records of quantitative estimates of MT, considering simultaneously different variables in a unique indicator, were carried out by [7]. This study used the number and length of boats and time of exposition, seeking to estimate the maritime traffic indicator that allows studying its impact on the aquatic environment.
Munim and Schramm [29] ratified the relevance of continuous improvements in port infrastructure quality for developing countries. These improvements provide better logistics performance and, consequently, more sustainable and efficient maritime trade and economic growth. Santa Marta’s maritime port has a natural draft that makes it the deepest port of the American continent, allowing mooring operations even for high tonnage commercial ships such as post-Panama carriers. Since 2013, this port has improved the capacity to store refrigerated cargo in containers, developed technology for foreign trade procedures, and expedited customer attention service. Hence, Santa Marta’s port is becoming the most important maritime terminal in Colombia. The port lies in the Caribbean Sea and is situated to the northwest of Santa Marta, which, since 2012, has had a modern marina with excellent access located very close to the National Natural Park of Tayrona (PNNT) and the mountains of Sierra Nevada. Thus, touristic activities are also important attractions to the region. Moreover, the area has been recognized by yachters as a secure port during hurricane seasons (from June to October) [30].
The city of Santa Marta is the second preferred touristic destination by visitors to the Colombian Caribbean, with the main local economic activities taking place around the port and touristic locations. The PNNT’s bays and coves are reference points for touristic boats’ anchorage in official navigation charts [31]. Garay et al. [32] warned that the increase in tourist demand would bring, as a consequence, a rise in the contaminant inputs, especially during the high touristic season. Historically, the water quality of Santa Marta’s coastal fringe has been evaluated with regard to solid and liquid urban wastes treatment and disposal [33,34]. However, according to the above mentioned authors, maritime traffic may also affect water quality parameters and should be considered in environmental assessments. This approach is especially relevant in busy naval traffic areas located in coastal zones, where pollutant discharges are more likely to occur [4,6,10,13,14,28].
Based on this scenario, this study proposed an easy quantitative estimation of the influence of maritime traffic on water quality parameters during different climatic seasons. The approach was applied to the coastal fringe of Santa Marta (Colombia), considering the available access to “open data” related to local maritime traffic.

2. Materials and Methods
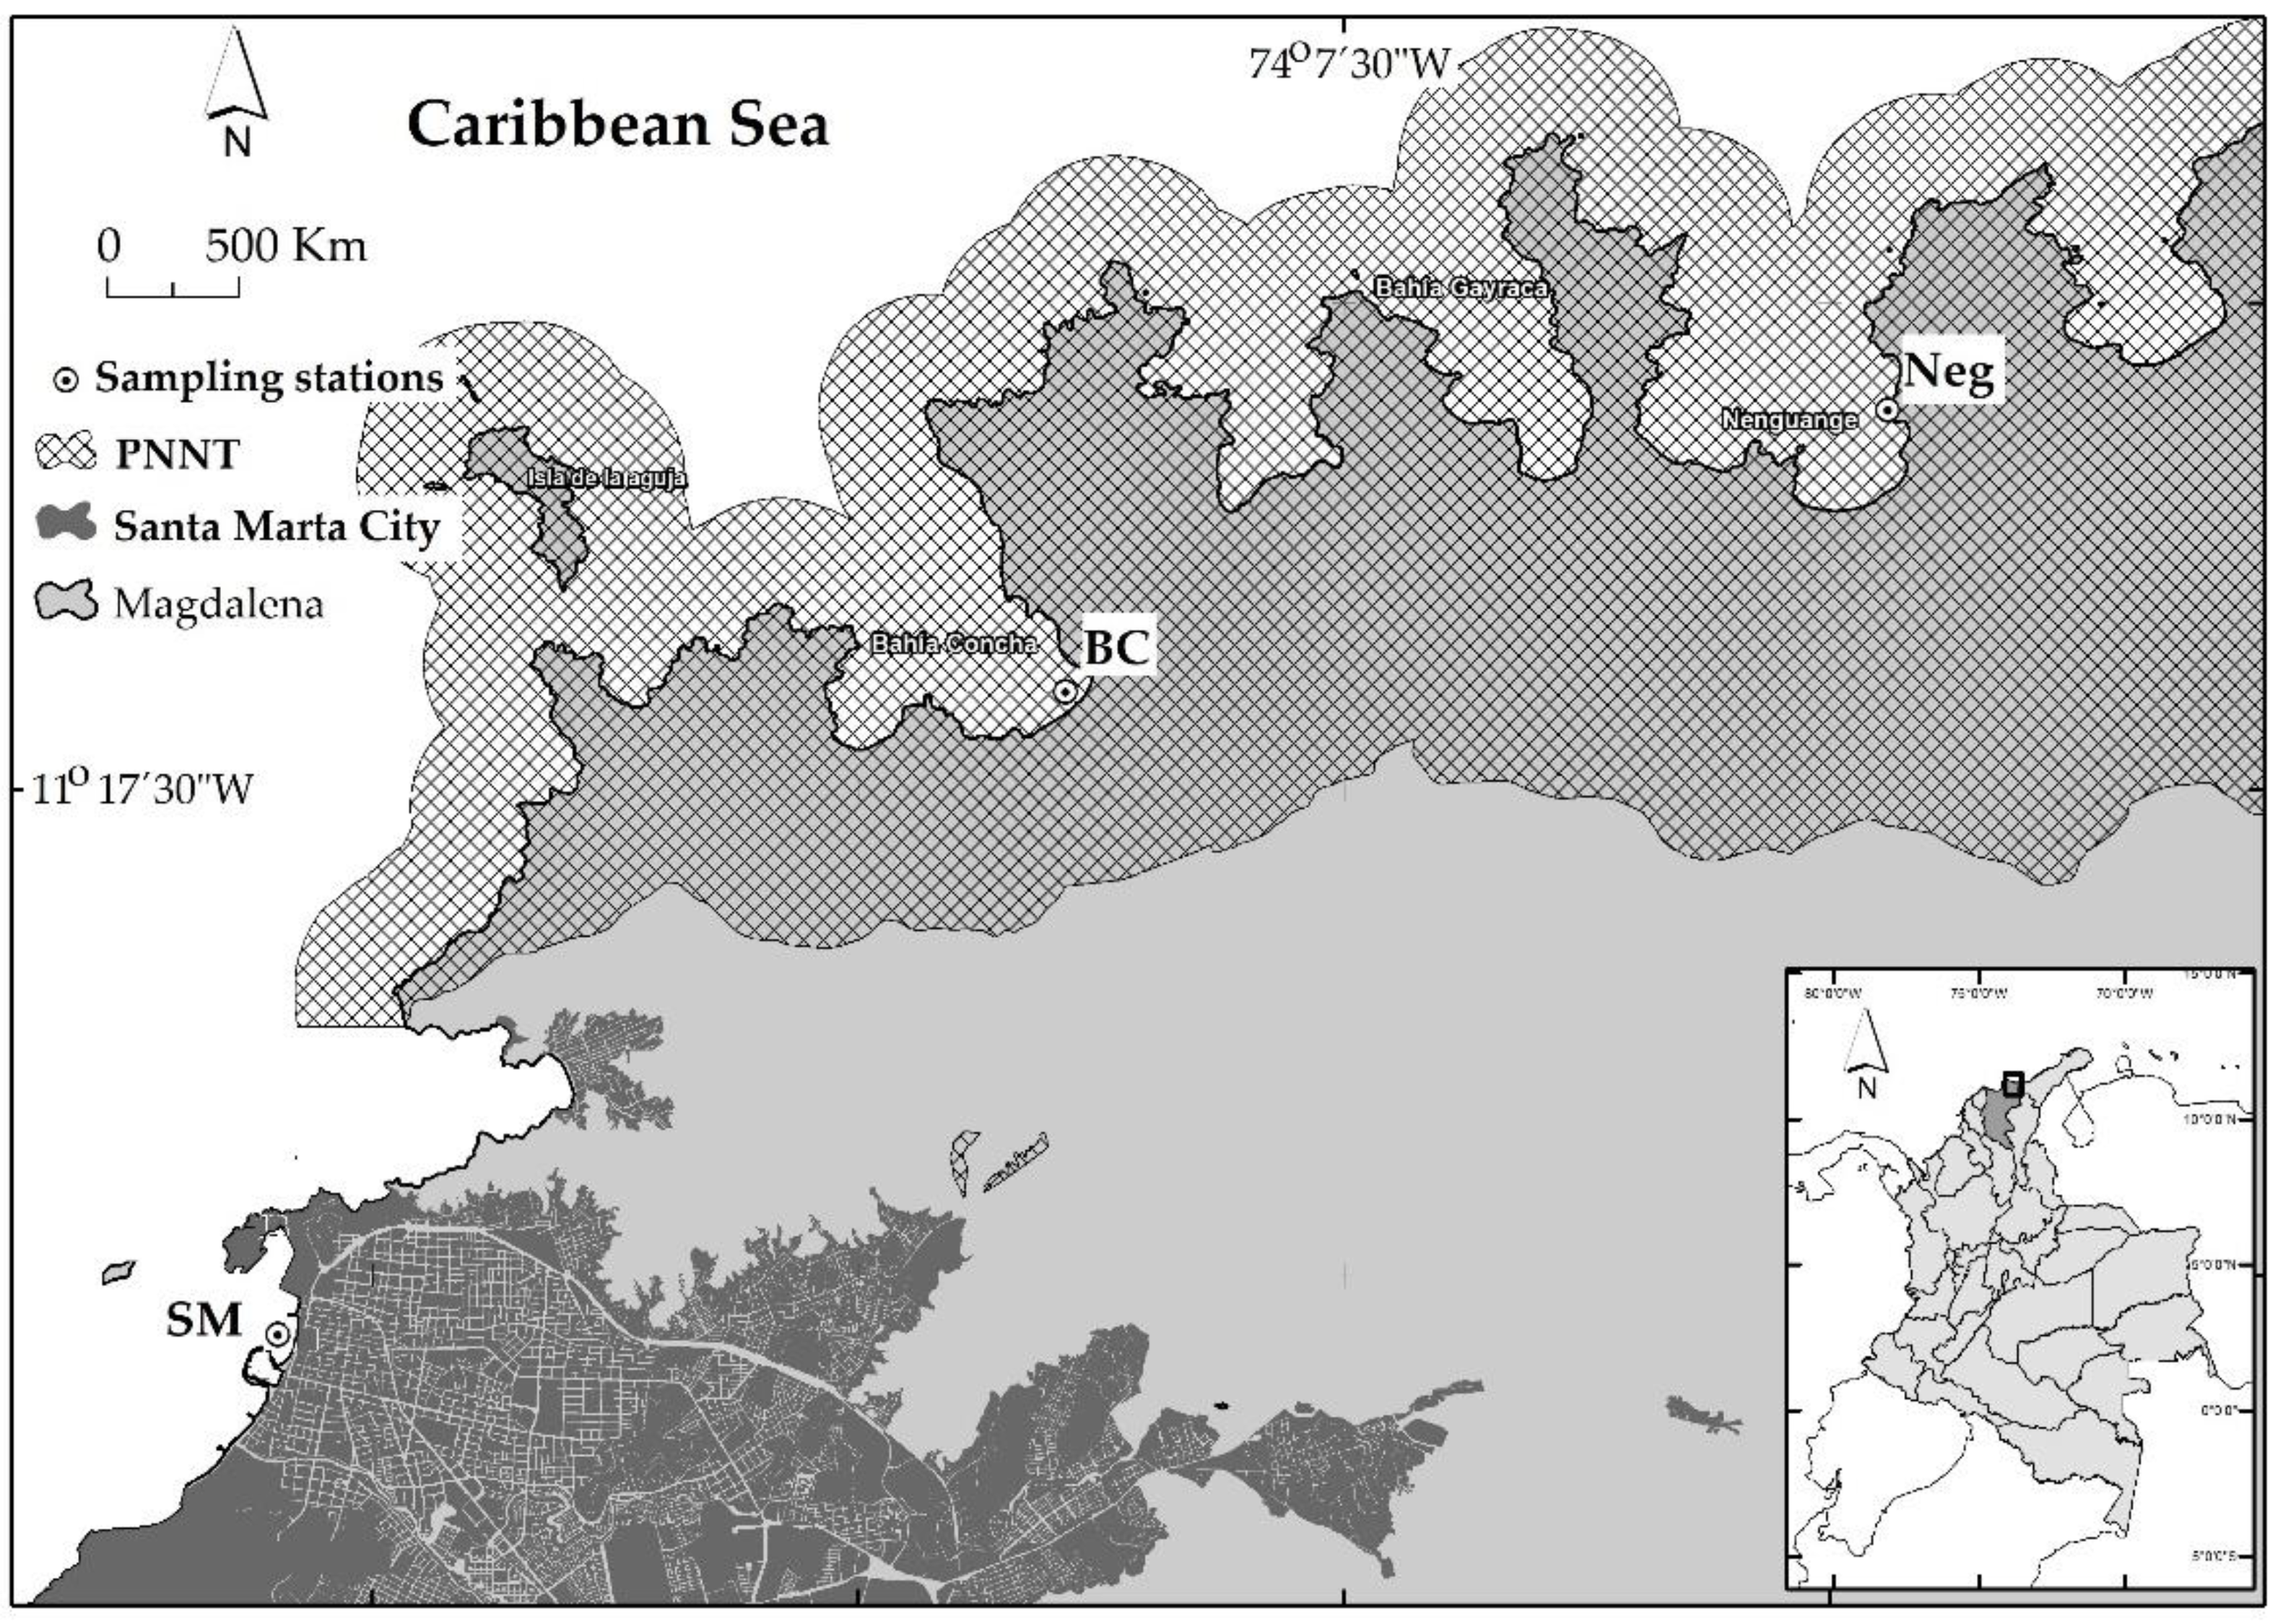
2.1. Areas of Study

The coastal fringe of Santa Marta is a highly dynamic zone in which many different socioeconomic factors such as tourism, fishing, commerce trade, and carbon transport and storage activities occur [35]. Under the criterion to have controlled maritime activities, the zones selected for this study were the bay of Santa Marta (BSM), presenting port facilities, touristic and fishing activities, and Tayrona National Natural Park (PNNT), where touristic activities are held. Such zones have different levels of urban and maritime port influences. The BSM is a semi-closed bay, with an approximate area of 5 km2 and coastlines limited to the north and south by rock formations. In the central part of BSM, a sandy beach is a predominant feature. In this zone, the sampling station was located at International Santa Marta Marina (SM). The PNNT is a protected area in the northern Santa Marta region, categorized as a National Park according to the International Union for Conservation of Nature (IUCN). The area is a hotspot of coral reef biodiversity in the Caribbean region and has been declared a biosphere reserve by UNESCO due to its strategic importance for conservation [36]. In the PNNT, data from two sampling stations were collected in Concha Bay (BC) and Nenguange (Neg). These sites were located at the northwest of the main beach of Concha and the northwest of the main beach of Nenguange, respectively (Figure 1).

2.2. Physicochemical and Microbiological Variables of Superficial Water

All physicochemical and microbiological variables used in the present study were obtained from “open data” made available by the Surveillance Network for the Conservation and Protection of Marine and Coastal Waters of Colombia [37]. These variables were collected from the superficial water level and included salinity, dissolved oxygen (DO), pH, nitrates, nitrites, ammonium, orthophosphates, suspended total solids (SST), dissolved and dispersed petroleum hydrocarbons (DDPH), and total coliforms (TC). The methods used to generate all variables were described in detail by [38]. The data included in the present study were measured during six sampling campaigns performed in SM, BC, and NEG from the years 2015 to 2017. According to the local rainfall regime, climatic seasons were defined as dry (December, January–April) and rainy (May–November). In Santa Marta, during the studied years (2015–2017), the average of pluviometry indexes in the dry season was 7.3 mm, while in the rainy season it was 72.7 mm [39] (Figure 2).

2.3. Estimation of Maritime Traffic

Data regarding boat traffic from each studied site were obtained by [30], and such data included the daily number of boats, the measures of all boat lengths, and permanence time in docking/anchorage. Data on boat length by sampling stations were complemented using information available on the website (www.marinetraffic.com, accessed on 26 April 2021) which provides real-time information on naval traffic. The boat length variable was used as unique information estimating the surface area of hulls of boats and ships in contact with water. This approach was adopted due to high heterogeneity in boat types (passenger, cruisers, motor yachts, sailboats, and small boats) present in studied areas, including a very large variation hull area of the boats.
A monthly index for each analyzed site was calculated by a direct relationship between the number of boats per month, length, and boats’ permanence time in each sampling station. The data were standardized to have values between 0 and 1, as proposed by [40], using Equations (1)–(4).
Traffic = VEc + VEe + Vet
V E c = C M i n M a x M i n
V E e = E M i n M a x M i n
V E t = T M i n M a x M i n
where:
VEc: Standardized data of the number of boats per month.
VEe: Standardized data of boat length per month.
VEt: Standardized data of boat permanence time per month.
Max y Min: Maximum and minimum values for each variable for the entire population of data.
C, E, y T: Each one of the observations on the number of boats, boat length, and boat permanence time, respectively.

2.4. Data Analysis

In order to assess differences between the variables of maritime traffic and water quality levels, a variance analysis (ANOVA) was made, with a previous evaluation of normality and homogeneity assumptions, according to the Shapiro–Wilk and Levenne tests, respectively. When detecting significant differences between mean values, Tukey’s honesty statistical difference test was applied. When some of the assumptions were not fulfilled, the Kruskal–Wallis nonparametric analysis was performed. The Wilcoxon’s rank sum contrast proof with continuity correction was made for pared comparisons. Canonical correlation analysis identified relevant variables of water quality and their association with maritime traffic. The importance level of each variable was verified by linear discriminant classification analysis (assuring a success percent in variable identification bigger than 95%). Seeking to explain the behavior of the number of boats in PNNT, the total number of visitors and the weather seasons (dry and rainy) were taken as independent variables. Linear models were prepared considering those variables as additive influence and interaction using “Im” in the R packet. Then, the model that best explained the variation of the number of visitors in PNNT considering the number of boats was selected using the lowest value of Akaike information criterion (AIC), significant p values, and adjusted R2 values. All statistical analyses were performed using the “R” program employing the RWizard interphase [41]. Statistical significance was set at p < 0.05.

3. Results

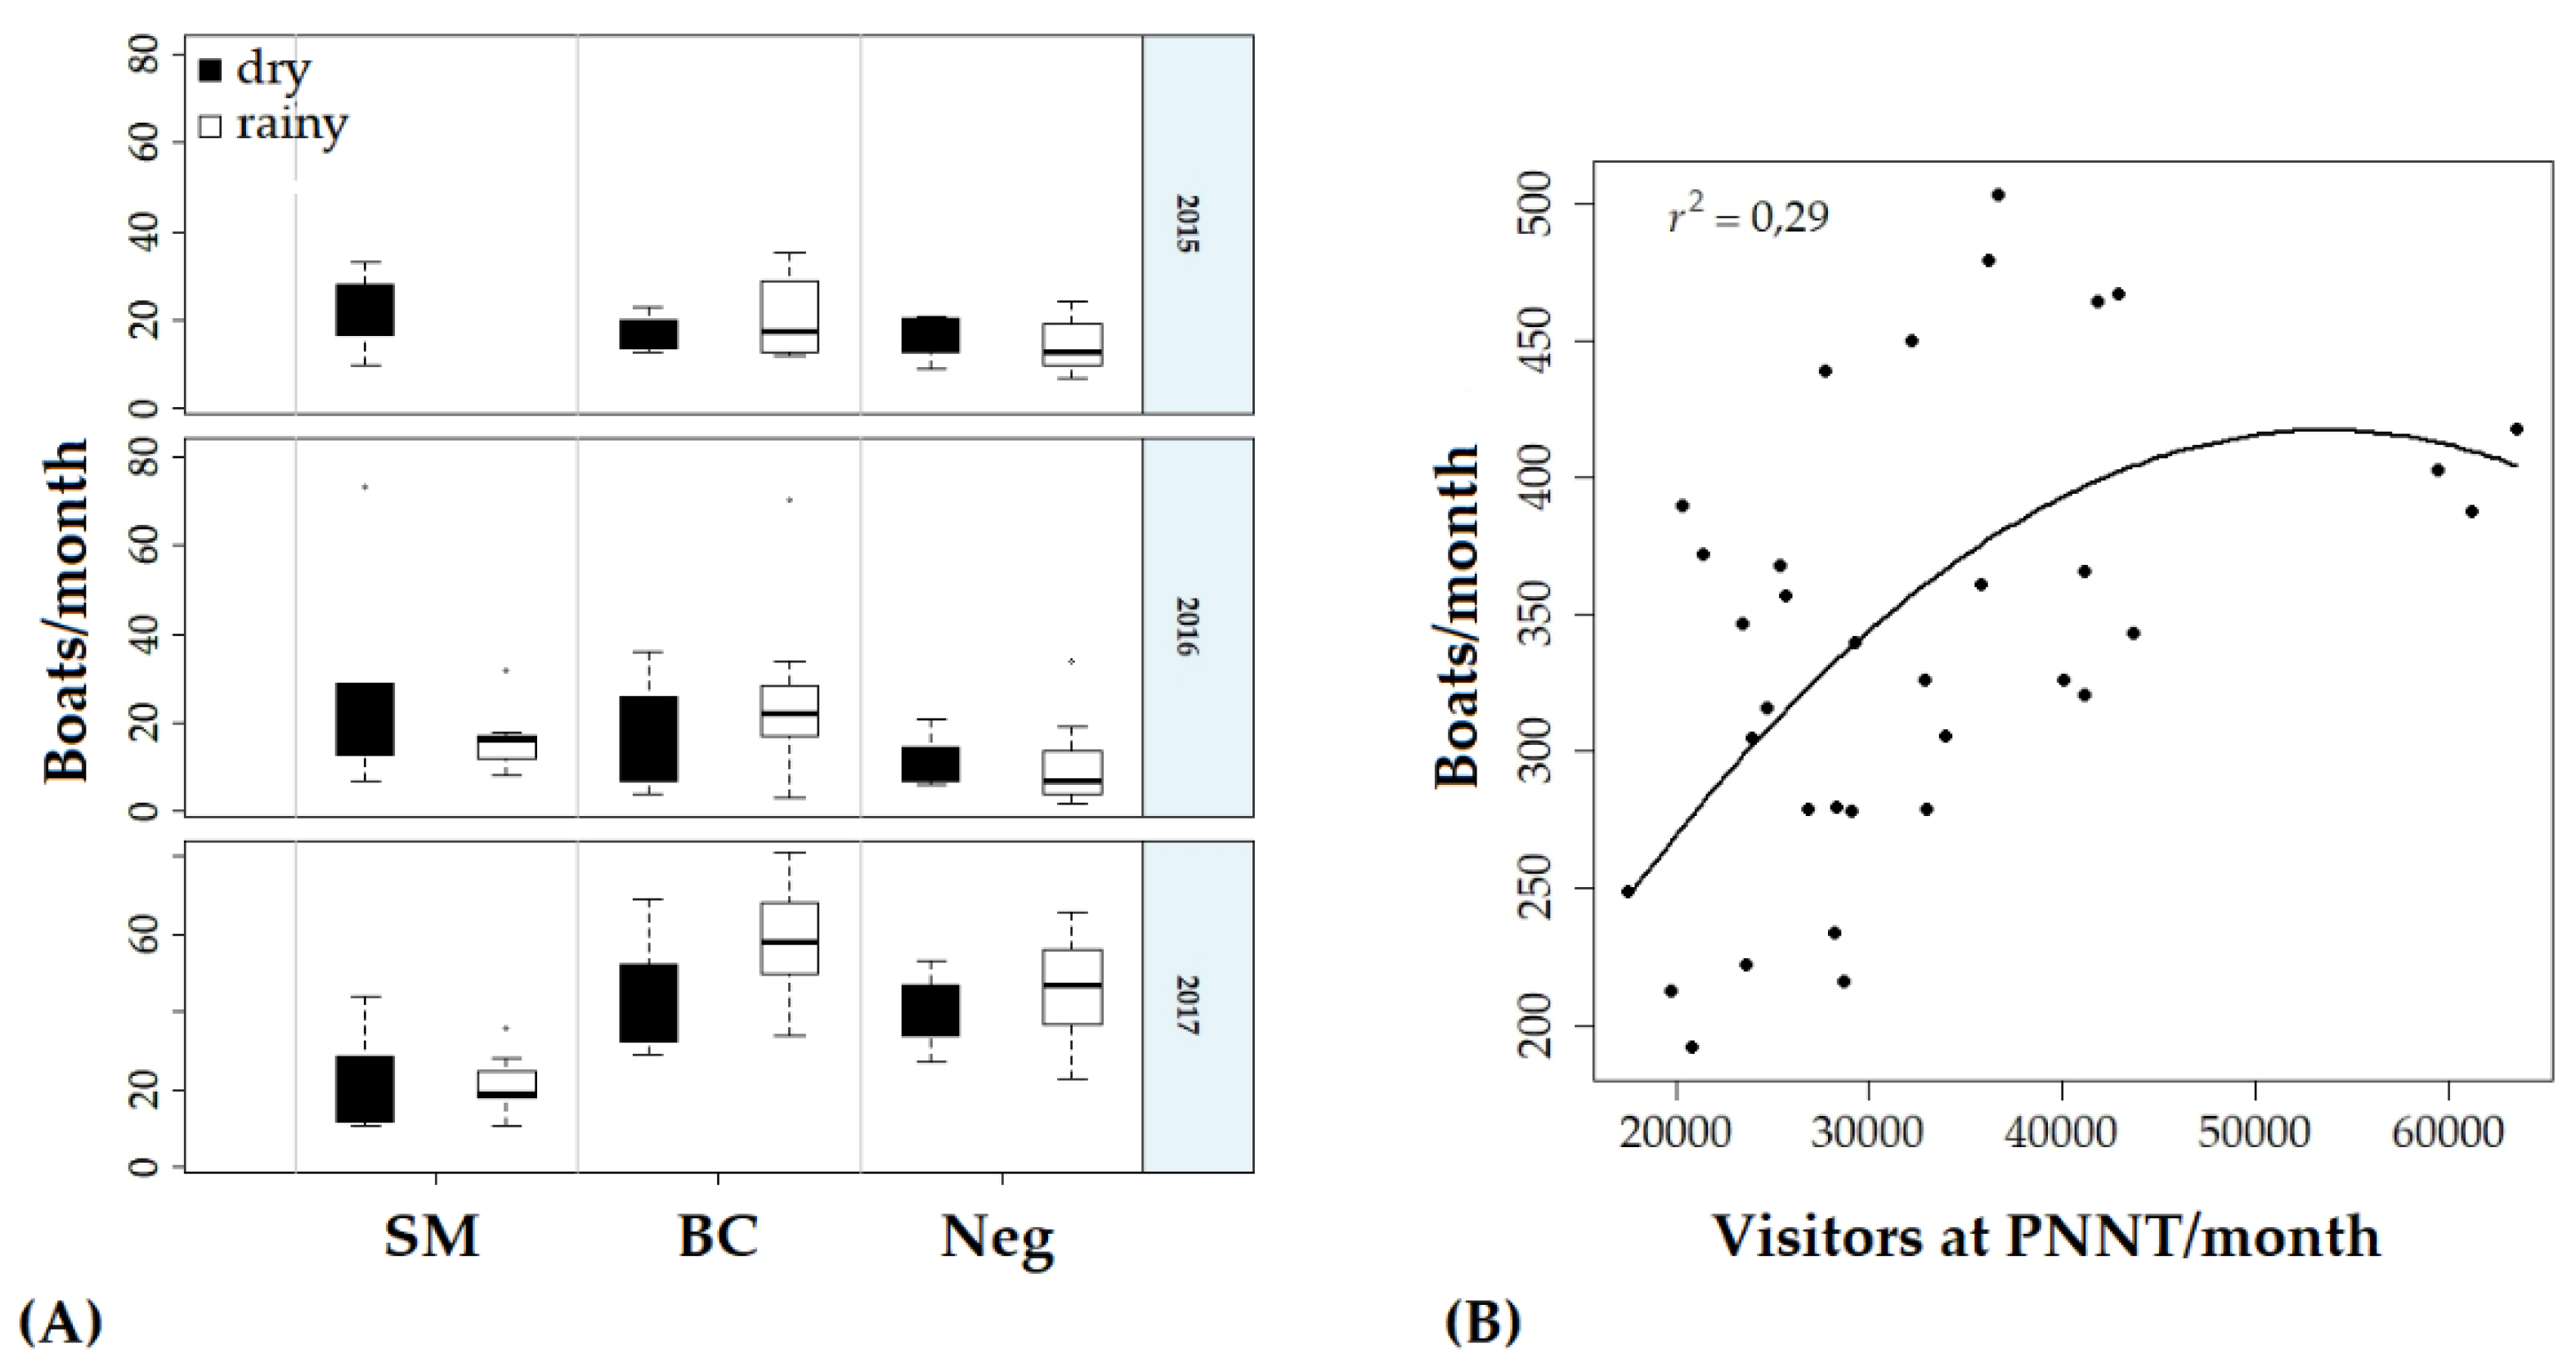
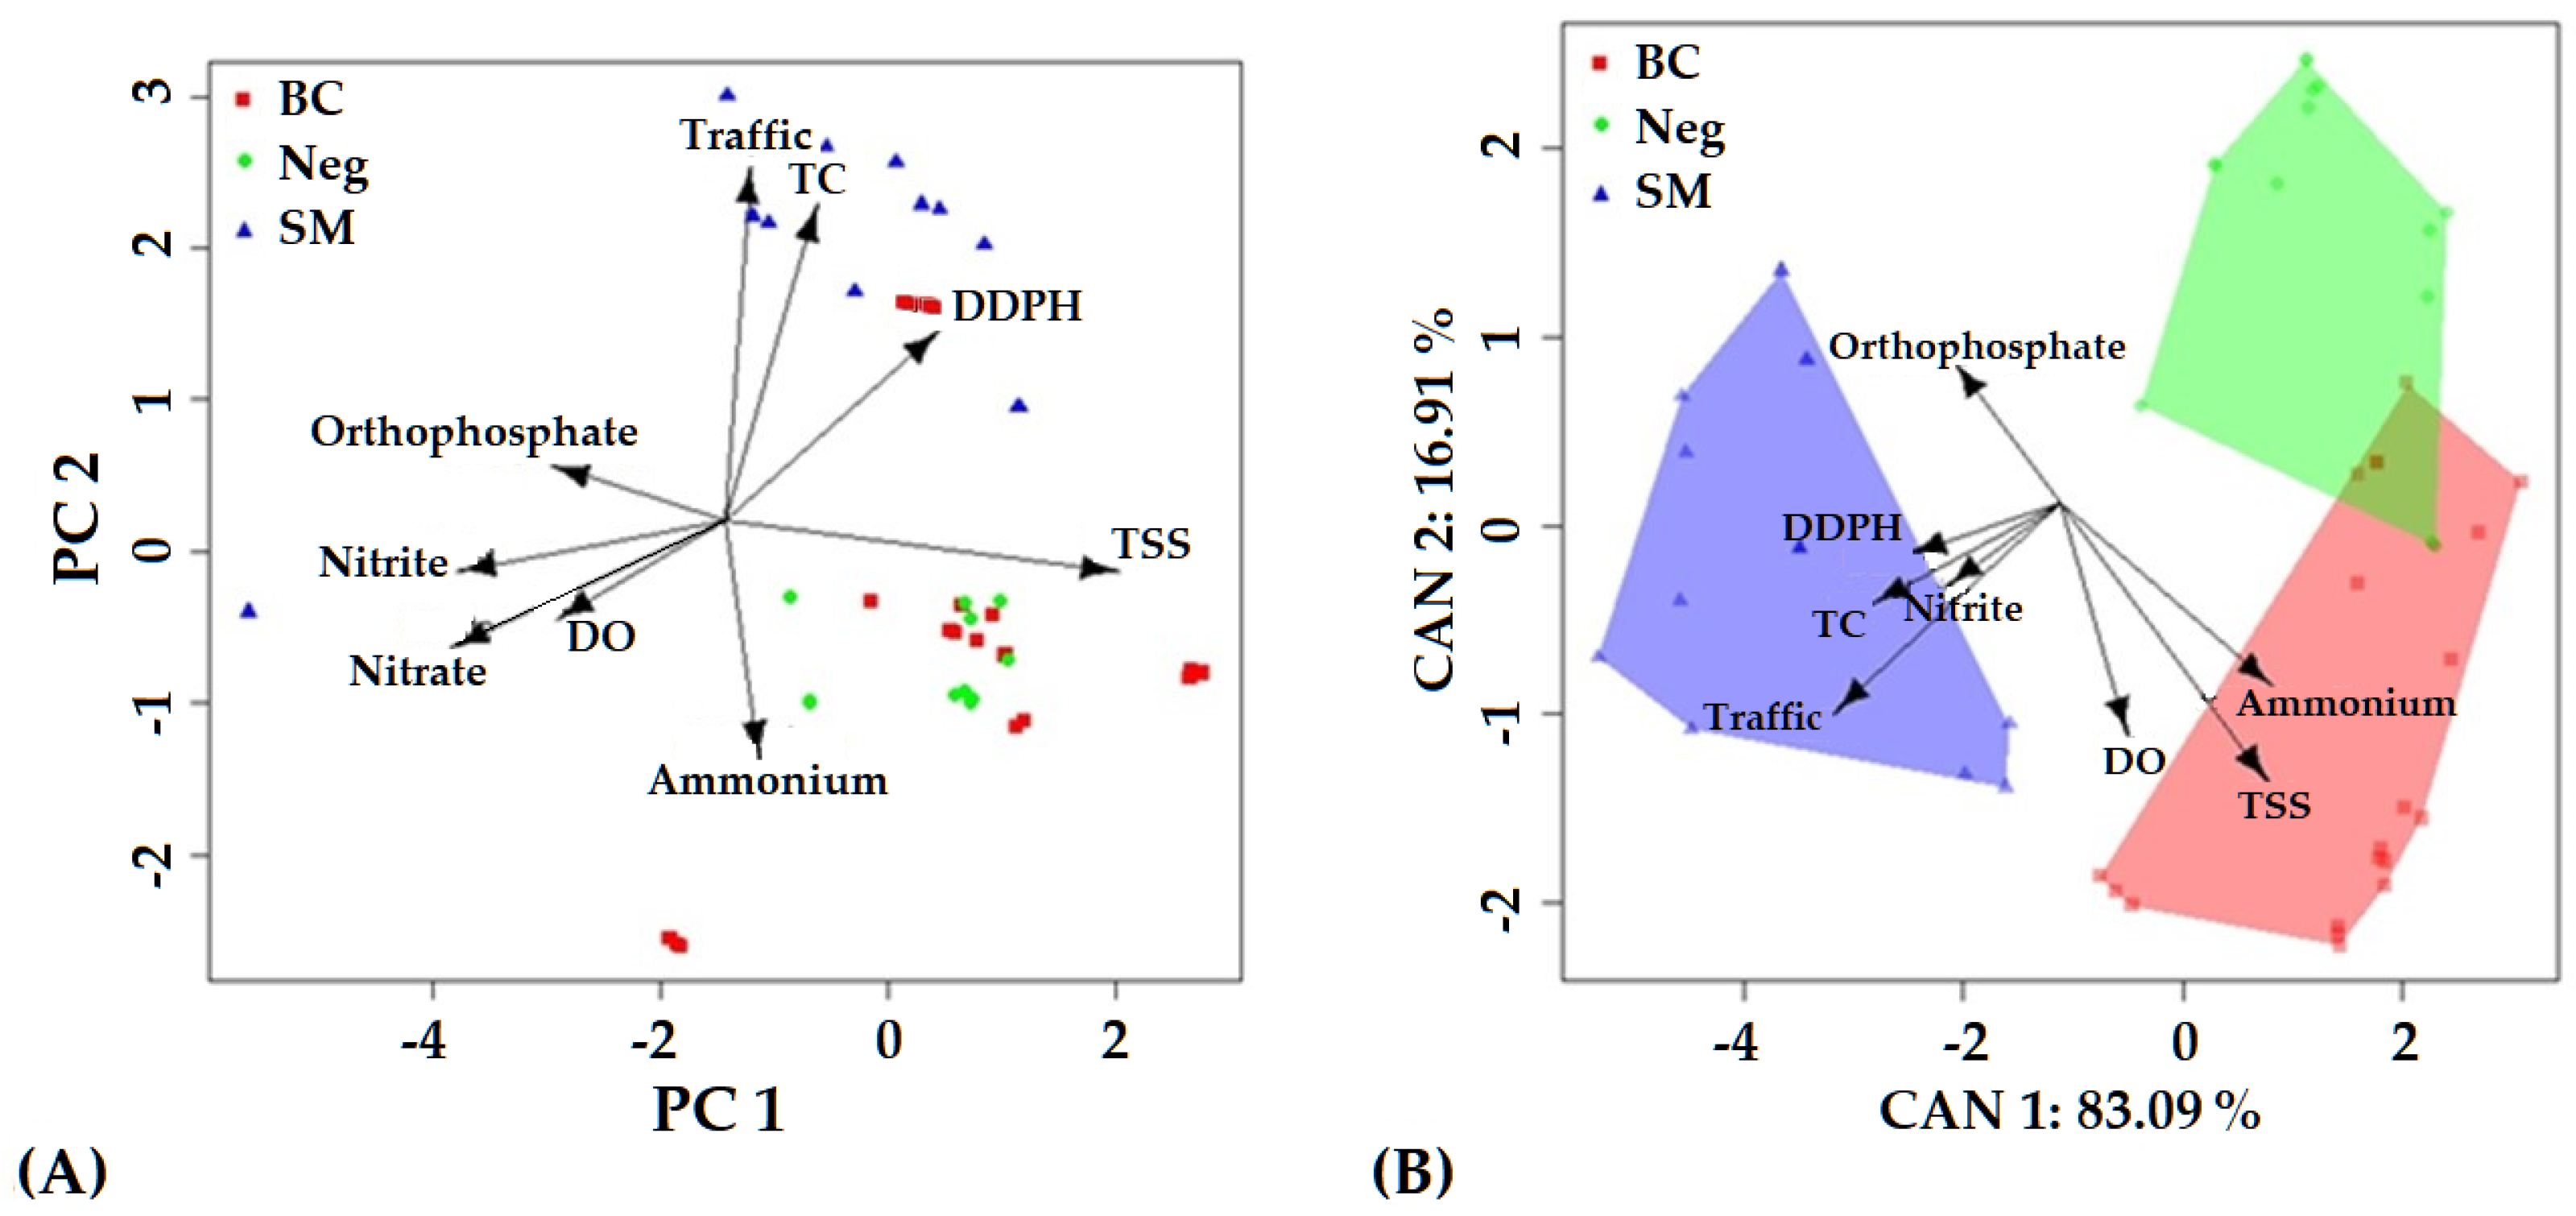
3.1. Physicochemical and Microbiological Variables in Superficial Water

Table 1 shows the results of the quality parameters for shallow waters in studied sites (SM, BC, and Neg). In all cases, physicochemical variables, inorganic nutrients, and microbiological amounts showed values below the maximum limits allowed in Colombian legislation (Decree 1594, issued in 1984). The concentrations of dissolved and dispersed petroleum hydrocarbons related to chrysene equivalents (DDPH) did not exceed the limits allowed for coastal sea waters presenting low contamination levels (> 5 < 10 µg/L) [42]. The influence of weather seasonality was evident during the dry season in which higher levels of salinity, pH, nitrates, and ammonium were reported, while the TC concentration showed higher values during the rainy months. In this regard, significant differences were seen only in SM with an average of 438 NMP/100 mL (p < 0.05). The ammonium ion concentrations varied, over the analyzed period, between the detection limit of the analytical method used (2.0 μg/L) and a peak value of 107.4 µg/L, which was reported in Neg station in April 2015.

3.2. Estimation of Maritime Traffic

Based on reports about maritime traffic during 2015–2017, 585 boats moored in the International Marina of Santa Marta (SM). Considering all studied periods, an average value of 22 boats/month was seen, with an average permanence time on dock of 19 days and boat lengths ranging from 11 to 25 m. During the rainy season, minor boat traffic (19 boats/month) occurred, presenting no statistical differences (p > 0.05) in comparison to the dry season (25 boats/month) (Figure 3A). The number of boats docked in different places of the PNNT showed a gradual increase over the years (2015 = 3150 boats, 2016 = 3795 boats, and 2017 = 3872 boats). During 2015, Concha Bay (CB) and Nenguange (Neg) received 11% of the total number of boats going to PNNT, and in 2017, this number increased to 23%. The gradual increase in amounts of boats visiting PNNT presented a direct correspondence with the total number of visitors to the national park. The quadratic regression model (p < 0.001) indicates a related increase in the number of visitors and reaching saturation limits (Figure 3B).
The higher visitor amount in PNNT was reported during January (dry season), which represented 17% of the annual total. Another high visitor affluence was registered in July and August during the rainy season. Considering visitors traveling using maritime routes to BC and Neg, the month of August, followed by April, presented higher boat traffic. Based on linear regression models, seeking to evaluate the relationship between boat traffic (in BC and Neg) and visitors amounts in PNNT by weather seasons, it was ascertained that the best fit considered the additive influence of independent variables (visitors amounts and weather seasons). In fact, the higher significance level was obtained with the lowest register of Akaike’s information criterion (AIC), showing a significant correlation in BC and Neg (p < 0.001). On the other hand, considering the effects of weather seasons, the presence of boats could be explained only during the rainy season.
The maritime traffic index calculated for the coastal fringe of Santa Marta ranged between 0.02 and 2.11 with an average value of 0.71 and a median value of 0.39. The heterogeneity explains the vast differences in the central trend values in the type of boats associated with touristic activities. SM presented higher traffic values and permanence time, which were influenced by boat length (p < 0.001). It is important to highlight that calculated marine traffic values did not consider the number of boats used by informal touristic enterprises, which frequently operate in the area and are not accounted for by the maritime authorities.

3.3. Maritime Traffic and the Quality of Water Variables in SM, BC, and Neg Sampling Stations

The principal components analysis (PCA) showed that 56% of the analyzed variables’ fluctuation was explained by two components (PC1 with 34% and PC2 with 22%). The variables most related to PC1 were orthophosphate, nitrite, nitrate, and DO, while in PC2, they were ammonium, traffic, and TC. The second principal component (PC2) demonstrated higher influence distinguishing the SM sampling station from the sites close to PNNT, highlighting boat traffic and TC with relevant influence on the total variability. In addition, boat traffic was also significantly correlated to TC (r = 0.741) and DDPH (r = 0.313) concentrations (Figure 4A). This behavior was confirmed by the quadratic discriminant analysis (QDA), demonstrating 100% of agreement in the classification and 90% of correctly identified cases by crossed validation. Thus, SM differed from BC and Neg, presenting higher maritime traffic associated with higher TC and DDPH concentrations. Such variables determined the first discriminant axis explaining 83% of the total variability observed (Figure 4B).

4. Discussion

The salinity variation related to weather seasons in the studied zone has been documented by scientific literature [38,44] and environmental monitoring reports [34,35,45]. Such studies have demonstrated significantly lower salinity during rainy seasons. In this regard, the present study results were strongly influenced by the increase in pluviosity during rainy seasons that occurred between 2015 and2016. Indeed, the accumulated rainfall monthly average from August to November was higher than 93 mm [39]. In addition, the combined effects of water upwelling in the dry season have also contributed to affecting salinity parameters [44,46,47]. A similar pattern was already observed in southern Ecuador, where water quality parameters are affected by rainfall regimes influencing the local salinity [48].
The higher ammonium concentration (107.4 µg/L) reported during the end of the dry season was associated with wastewaters generated by the touristic activity. High concentrations of nitrites, nitrates, and ammonium in coastal areas are often related to inland water flows, as well as land-based human activities [45,49,50]. Moreover, physicochemical processes such as oxidation of organic matter, added to the hydrodynamics, may lead to the release of nutrients to the water column [51,52]. Thus, the high ammonium levels were probably corroborated by the high number of visitors (25.658) reported at the same time in studied sites, which also registered higher values in a beach close to BC during Holy Easter vacations. It is well known that the quantity and type of waste disposed of on the beaches are directly correlated to the number of persons in such locations [53]. Also, oceanographic characteristics such as tides, coastal currents, and upwelling systems added to the influence of socioeconomic activities may locally influence levels of hazardous substances disposed of as sewage [54]. In the present study, higher average ammonium concentrations were seen in BC (17.8 µg/L) and Neg (3.7 µg/L), suggesting coastal transport of residues from more populated zones to PNNT. Moreover, urban inland sources, not directly related to naval traffic, also contributed to the observed levels. Thus, it is not possible to distinguish contamination sources based on the measured concentrations. Despite this, the statistical approach used in the present study indicates the influence of marine traffic on observed variations.
In Santa Marta, TC’s main source of coastal waters is a sewage outfall that drains wastewater generated in the city towards Santa Marta bay. It is important to highlight that previous studies have demonstrated overflow and spillage episodes in this system during the rainy seasons [35,55]. TC levels were significantly raised during the rainy season in SM. In contrast, TC values decreased towards BC and Neg, establishing a spatial and temporal contamination gradient. In fact, this indicator of organic contamination was related to water drainage from the urban area and visitors seasonally, presenting increments during tourist seasons in the months of July and August. This chronic contamination has been historically described by [33,56] and REDCAM reports [35,55] for the studied area. Therefore, as seen in several Latin American cities, Santa Marta has a deficit coverage of urban sanitation. Despite this, TC values, recommended as the limit for recreational use by primary and secondary contact according to Colombian decree about quality criteria for water used for recreational purposes, were never surpassed [57]. It is important to highlight that primary contact includes swimming, diving, and medicinal baths, while secondary contact refers to water sports and fishing.
As seen for TC, the high DDPH concentration in Santa Marta had been reported previously by [38], who attributed the contamination rates to touristic and port activities associated with urban wastewater discharges. This assertion is supported by several scientific publications reporting petroleum hydrocarbons’ impacts in areas under the influence of ports (commercial and fishing) and tourist marinas, even in pristine areas [58]. In addition, accidental spills during operations of transport and refueling of crude oil or derivatives are very frequent, especially in zones with heavy maritime traffic [16,59,60]. Thus, based on our results, the occurrence of DDPH in SM was directly associated with tourist activities, and ship/boat traffic. However, the values measured during the present study were below the limits (> 5 < 10 µg/L) proposed in several environmental guidelines for coastal waters [42,61,62]. Further, the same temporal and spatial gradient pattern among sampled sites was verified for DDPH.
Hurricanes in the Atlantic Ocean are quite common phenomena between June and November. Such extreme events, originating over the warm water’s surface, play an essential role in the ship and boat traffic in Santa Marta. The historical distribution percentages indicate the Caribbean Sea (11%) and western Pacific areas (39%) have the highest probability of hurricane incidence [63]. In this regard, there are geophysical and meteorological factors making the Colombian coast a particularly safe place during these storms. These factors include: (1) Coriolis force makes hurricanes coming from the African coast move to a west-northwest direction; (2) Colombian coastlines minimize the perpendicular wind impact; and (3) the mountains of Sierra Nevada, according to theoretical approaches, act as a natural shield against storms [64]. Despite this, Santa Marta presents yacht affluence without significant differences between climatic seasons [65]. The number of boats received by the PNNT depends directly on the number of visitors received, until reaching a limit that depends on the number of tourist transport boats in the area. It is noted that the osio tourism water transport in Santa Marta needs to be corrected towards sustainable transport initiatives, as they can have serious negative effects on both the protected area and local communities [66].
The high concentrations of TC and hydrocarbon pollutants registered in SM were related to proximity with industrialized urban zones and the number of visitors [56,67]. Although water quality parameters were below acceptable limits in SM, the occurrence of TC, DDPH, and ammonium concentrations in the PNNT (BC and Neg) arouses concern. Protected areas, such as national parks, are created for conservation purposes and seek to protect the local biodiversity. Recent studies have demonstrated chemical impacts within protected zones severely threatening local species despite low contaminant concentrations [68,69]. Considering that water quality parameters adopted worldwide were developed based on urban areas, those limits may fail to assure environmental protection to pristine zones [68]. PNNT is a unique and vulnerable ecosystem, a hotspot of coral reef biodiversity, and declared as a biosphere reserve by UNESCO. Despite this, previous impacts caused by tributyltin contamination and imposex incidence were reported and associated with marine traffic in the region [70]. Therefore, based on our findings, multiple chemical impacts can affect the conservation goals foreseen for PNNT.
The PCA and discriminant results showed that the sites located inside PNNT presented similar water quality parameters, while they were different from SM. Indeed, the concentrations of total coliforms (TC) and hydrocarbons (DDPH) were the most distinctive variables and strongly associated with marine traffic. In addition, the simultaneous use of different variables (daily number of boats, boat length, and permanence time) makes this model more predictive than those considering merely qualitative or semi-quantitative data. These findings support the proposed model as a valuable tool to be used by monitoring programs assessing environmental quality parameters of coastal waters under the influence of maritime traffic. Moreover, the proposed indicator is specifically recommended to be used in areas with high heterogeneity in the types of vessels, as is often seen in Latin American coastal areas [8].

5. Conclusions

The high levels of TC and DDPH in SM were explained by the proximity to urban contamination sources associated with intense maritime traffic in Santa Marta bay. Although it is not possible to distinguish contributions from each source, the statistical approach showed a strong relationship between analyzed variables and naval traffic. In fact, the trends observed in PNNT clearly indicated that maritime traffic was related to the number of visitors during the vacation seasons (from December to January, April, and August). The estimation of the maritime traffic effect on the water quality parameters implemented in this work may be a reference for future studies evaluating the impact of naval activities on environmental quality. In addition, it represents an easy and more complete tool considering the previous approaches used only quantitative and semi-quantitative data. Therefore, this method is particularly recommended for zones presenting high heterogeneity in ship/boat categories. Moreover, our results suggest the occurrence of multiple chemical impacts within PNNT affecting conservation goals.

Author Contributions

Conceptualization, Í.B.C. and R.R.-G.; methodology, R.R.-G.; software, R.R.-G.; validation, R.R.-G.; formal analysis, Í.B.C. and R.R.-G.; investigation, Í.B.C., N.H.C. and R.R.-G.; resources, N.H.C. and R.R.-G.; data curation, R.R.-G.; writing—original draft preparation, Í.B.C., N.H.C. and R.R.-G.; writing—review and editing, Í.B.C., N.H.C. and R.R.-G.; visualization, Í.B.C., N.H.C. and R.R.-G.; supervision, N.H.C.; project administration, N.H.C.; funding acquisition, N.H.C. All authors have read and agreed to the published version of the manuscript.

Funding

Castro (PQ 302713/2018-2) was the recipient of a research productivity fellowship from the CNPq.

Institutional Review Board Statement

Not applicable.

Informed Consent Statement

Not applicable.

Data Availability Statement

Not applicable.

Acknowledgments

Í.B.C. (PQ 302713/2018-2) was the recipient of a research productivity fellowship from the CNPq.

Conflicts of Interest

The authors declare no conflict of interest.

References

  1. UNCTAD (UN Conference on Trade and Development). Review of Maritime Transport 2016; UNCTAD: Geneva, Switzerland, 2016. [Google Scholar]
  2. Halpern, B.S.; Frazier, M.; Potapenko, J.; Casey, K.S.; Koenig, K.; Longo, C.; Stewart-Lowndes, J.; Cotton-Rockwood, R.; Selig, E.R.; Selkoe, K.A.; et al. Spatial and temporal changes in cumulative human impacts on the world’s ocean. Nat. Commun. 2015, 6, 7615. [Google Scholar] [CrossRef] [Green Version]
  3. Bracker, E. Impacts of Shipping on Environment and Climate. In International Climate Protection; Palocz-Andresen, M., Szalay, D., Gosztom, A., Sípos, L., Taligás, T., Eds.; Springer: Cham, Switzerland, 2019; pp. 183–189. [Google Scholar] [CrossRef]
  4. Bajt, O. Aliphatic and Polycyclic Aromatic Hydrocarbons in Gulf of Trieste Sediments (Northern Adriatic): Potential Impacts of Maritime Traffic. Bull. Environ. Contam. Toxicol. 2014, 93, 299–305. [Google Scholar] [CrossRef] [PubMed]
  5. Liubartseva, S.; De Dominicis, M.; Oddo, P.; Coppini, G.; Pinardi, N.; Greggio, N. Oil spill hazard from dispersal of oil along shipping lanes in the Southern Adriatic and Northern Ionian Seas. Mar. Pollut. Bull. 2015, 90, 259–272. [Google Scholar] [CrossRef] [PubMed]
  6. Gregoris, E.; Barbaro, E.; Morabito, E.; Toscano, G.; Donateo, A.; Cesari, D.; Contini, D.; Gambaro, A. Impact of maritime traffic on polycyclic aromatic hydrocarbons, metals and particulate matter in Venice air. Environ. Sci. Pollut. Res. 2016, 23, 6951–6959. [Google Scholar] [CrossRef] [PubMed] [Green Version]
  7. Caric, H.; Klobu, G.; Stambuk, A. Ecotoxicological risk assessment of antifouling emissions in a cruise ship port. J. Clean. Prod. 2014, 121, 159–168. [Google Scholar] [CrossRef]
  8. Mikhailenko, A.V.; Ruban, D.A.; Ermolaev, V.A.; van Loon, A.J. Cadmium Pollution in the Tourism Environment: A Literature Review. Geosciences 2020, 10, 242. [Google Scholar] [CrossRef]
  9. Abreu, F.E.L.; Lima, J.N.; Castro, Í.B.; Fillmann, G. Are antifouling residues a matter of concern in the largest South American port? J. Hazard. Mater. 2020, 398, 122937. [Google Scholar] [CrossRef] [PubMed]
  10. Lucialli, P.; Ugolini, P.; Pollini, E. Harbour of Ravenna: The contribution of harbour traffic to air quality. Atmos. Environ. 2007, 41, 6421–6431. [Google Scholar] [CrossRef]
  11. Hassellöv, I.-M.; Turner, D.R.; Lauer, A.; Corbett, J.J. Shipping contributes to ocean acidification. Geophys. Res. Lett. 2013, 40, 2731–2736. [Google Scholar] [CrossRef] [Green Version]
  12. Lenzen, M.; Sun, Y.-Y.; Faturay, F.; Ting, Y.-P.; Geschke, A.; Malik, A. The carbon footprint of global tourism. Nat. Clim. Chang. 2018, 8, 522–528. [Google Scholar] [CrossRef]
  13. Donateo, A.; Gregoris, E.; Gambaro, A.; Merico, E.; Giua, R.; Nocioni, A.; Contini, D. Contribution of harbour activities and ship traffic to PM 2.5, particle number concentrations and PAHs in a port city of the Mediterranean Sea (Italy). Environ. Sci. Pollut. Res. 2014, 21, 9415–9429. [Google Scholar] [CrossRef] [PubMed]
  14. Merk, O. Shipping Emissions in Ports. In Proceedings of the International Transport Forum, Paris, France, 10–11 April 2014. [Google Scholar] [CrossRef]
  15. Gibbs, D.; Rigot-Muller, P.; Mangan, J.; Lalwani, C. The role of sea ports in end-to-end maritime transport chain emissions. Energy Policy 2014, 64, 337–348. [Google Scholar] [CrossRef] [Green Version]
  16. De Serio, F.; Mossa, M. Environmental monitoring in the Mar Grande basin (Ionian Sea, Southern Italy). Environ. Sci. Pollut. Res. 2015, 23, 12662–12674. [Google Scholar] [CrossRef] [PubMed]
  17. Luna, G.M.; Manini, E.; Turk, V.; Tinta, T.; D’Errico, G.; Baldrighi, E.; Baljak, V.; Buda, D.; Cabrini, M.; Campanelli, A.; et al. Status of faecal pollution in ports: A basin-wide investigation in the Adriatic Sea. Mar. Pollut. Bull. 2019, 147, 219–228. [Google Scholar] [CrossRef] [PubMed]
  18. Ten Hallers-Tjabbes, C.C.; Wegener, J.-W.; Van Hattum, B.; Kemp, J.F.; Ten Hallers, E.; Reitsema, T.J.; Boon, J.P. Imposex and organotin concentrations in Buccinum undatum and Neptunea antiqua from the North Sea: Relationship to shipping density and hydrographical conditions. Mar. Environ. Res. 2003, 55, 203–233. [Google Scholar] [CrossRef]
  19. Miloslavich, P.; Penchaszadeh, P.E.; Bigatti, G. Imposex in gastropods from Venezuela. Cienc. Mar. 2007, 33, 319–324. [Google Scholar] [CrossRef]
  20. Roos, N. Imposex in Marine Gastropods from the Atlantic Coast of South Africa. Master’s Thesis, North-West University, Potchefstroom, South Africa, 2016; 155p. [Google Scholar]
  21. Castro, I.B.; Oliveira, C.A.; Lopes, J.C.; Matthews-Cascon, H.; Rocha-Barreira, C. The increasing incidence of imposex in Stramonita haemastoma (Mollusca: Gastropoda: Muricidae) after the establishment of the Pecém Harbor, Ceará State, northeast Brazil. Thalassas 2005, 21, 71–75. [Google Scholar]
  22. Strand, J.; Jørgensen, A.; Tairova, Z. TBT pollution and effects in molluscs at US Virgin Islands, Caribbean Sea. Environ. Int. 2009, 35, 707–711. [Google Scholar] [CrossRef] [PubMed]
  23. Elhasni, K.; Vasconcelos, P.; Ghorbel, M.; Othman, J. Inshore/offshore gradients of imposex in Bolinus brandaris (Gastropoda: Muricidae) from the Gulf of Gabès (southern Tunisia, Central Mediterranean Sea). Acta Adriat. 2013, 54, 299–313. [Google Scholar]
  24. Márquez, F.; Primost, M.A.; Bigatti, G. Shell shape as a biomarker of marine pollution historic increase. Mar. Pollut. Bull. 2016, 114, 816–820. [Google Scholar] [CrossRef] [PubMed]
  25. Juretic, S.; Cerovic, L.; Galovic, T. Optimal analytical instruments in the function of estimation of total traffic in the port of Rijeka. Sci. J. Marit. Res. 2013, 27, 265–277. [Google Scholar]
  26. Hajbi, A. Traffic Forecasting in Moroccan Ports. Supply Chain Forum Int. J. 2011, 12, 26–35. [Google Scholar] [CrossRef]
  27. Miotke-Dzięgiel, J. Ports in development of maritime tourism–problems and challenges. The case of the Pomeranian region. Tour. Hosp. Manag. 2007, 13, 483–492. [Google Scholar]
  28. Trozzi, C.; Vaccaro, R.; Nicolo, L. Air pollutants emissions estimate from maritime traffic in the italian harbours of Venice and Piombino. Sci. Total Environ. 1995, 169, 257–263. [Google Scholar] [CrossRef]
  29. Munim, Z.H.; Schramm, H.J. The impacts of port infrastructure and logistics performance on economic growth: The mediating role of seaborne trade. J. Shipp. Trade 2018, 3, 1. [Google Scholar] [CrossRef] [Green Version]
  30. [Dataset] Dirección General Marítima (DIMAR). Filed No. MD-DIMAR-SUBMERC-ATRANC in Connection with the Delivery of Information from: Ships in the Port of Santa Marta, Santa Marta International Marina and Access to the Tayrona National Natural Park. 2018. Available online: https://www.dimar.mil.co/ (accessed on 7 March 2019).
  31. Centro de Investigaciones Oceanográficas e Hidrográficas del Caribe (CIOH). Guía Náutica Turística de Colombia; COSMOGUIAS: Cartagena de Indias, Colombia, 2017. [Google Scholar]
  32. Garay, J.A.; Marín, B.; Ramírez, G.; Betancourt, J.; Troncoso, W.; Gómez, M.L.; Cadavid, B.; Vélez, A.M.; Vivas, D.y.L.J. Diagnóstico y Evaluación de la Calidad Ambiental Marina en el Caribe y Pacífico Colombiano. Red de Vigilancia para la Protección y Conservación de la Calidad de las Aguas Marinas y Costeras; Diagnóstico 2002; INVEMAR: Santa Marta, Colombia, 2003; 263p. [Google Scholar]
  33. Moscarella, M.V.; García, F.; Palacio, C. Calidad Microbiológica del agua de la Bahía de Santa Marta, Colombia. Rev. Dyna 2011, 167, 132–141. [Google Scholar]
  34. INVEMAR. Diagnóstico y Evaluación de la Calidad de las Aguas Marinas y Costeras en el Caribe y Pacífico Colombianos. Red de Vigilancia para la Conservación y Protección de las aguas Marinas y Costeras de Colombia–REDCAM: INVEMAR, MinAmbiente, CORALINA, CORPOGUAJIRA, CORPAMAG, CRA, CARDIQUE, CARSUCRE, CVS, CORPOURABÁ, CODECHOCÓ, CVC, CRC y CORPONARIÑO. Informe Técnico 2017; Serie de Publicaciones Periódicas No. 4 del INVEMAR; INVEMAR: Santa Marta, Colombia, 2018; 336p. [Google Scholar]
  35. INVEMAR. Diagnóstico y Evaluación de la Calidad de las Aguas Marinas y Costeras en el Caribe y Pacífico Colombianos. Red de Vigilancia para la Conservación y Protección de las Aguas Marinas y Costeras de Colombia–REDCAM: INVEMAR, MinAmbiente, CORALINA, CORPOGUAJIRA, CORPAMAG, CRA, CARDIQUE, CARSUCRE, CVS, CORPOURABÁ, CODECHOCÓ, CVC, CRC y CORPONARIÑO. Informe Técnico 2019; Serie de Publicaciones Periódicas No. 4 del INVEMAR; INVEMAR: Santa Marta, Colombia, 2020; 171p. [Google Scholar]
  36. Bayraktarov, E.; Pizarro, V.; Wild, C. Spatial and temporal variability of water quality in the coral reefs of Tayrona National Natural Park, Colombian Caribbean. Environ. Monit. Assess. 2014, 186, 3641–3659. [Google Scholar] [CrossRef] [PubMed]
  37. [Dataset] REDCAM, 2018. Open Data of the Surveillance Network for the Conservation and Protection of Marine and Coastal Waters of Colombia (REDCAM). The Physicochemical and Microbiological Variables Considered on Superficial Water Level. Available online: http://www.invemar.org.co/datos-abiertos (accessed on 27 June 2019).
  38. Vivas-Aguas, L.J.; Ibarra, K.; Sánchez, J.; Martínez, M.; Nieto, Y.; Moreno, Y.; Cuadrado, I.P.; Obando Garcés, O.; Sánchez, D.; Villarraga, M.; et al. Diagnóstico y Evaluación de la Calidad de las Aguas Marinas y Costeras del Caribe y Pacifico Colombianos; Serie de Publicaciones del INVEMAR No. 4 Red de Vigilancia para la Conservación y Protección de las Aguas Marinas y Costeras de Colombia (REDCAM), Informe Técnico 2014; INVEMAR: Santa Marta, Colombia, 2015; 320p. [Google Scholar]
  39. Instituto de Hidrología, Meteorología y Estudios Ambientales (IDEAM). Gráficos de Seguimiento Diario de la Precipitación. 2019. Available online: http://www.ideam.gov.co/web/tiempo-y-clima/graficos-seguimiento-diarioprecipitacion-principales-ciudades (accessed on 28 March 2019).
  40. Guisande, C.; Vaamonde, A.; Barreiro, A. Tratamiento de datos con R, STATISTICA y SPSS; Ediciones Díaz de Santos: Madrid, Spain, 2013; 978p. [Google Scholar]
  41. Guisande, C.; Heine, J.; González-Da Costa, J.; García-Roselló, E. RWizard Software; RWizard: Vigo, Spain, 2014. [Google Scholar]
  42. UNESCO. Manual para la Vigilancia del Aceite y de los Hidrocarburos del Petróleo Disueltos/Dispersos en el Agua de Mar y en las Playas; Manuales y Guías No. 13 de la COI; UNESCO: Paris, France, 1984; 87p. [Google Scholar]
  43. [Dataset] Centro de Información Turística de Colombia (CITUR). Visitantes a Parques Nacionales Naturales. Ministerio de Comercio, Industria y Turismo. 2019. Available online: http://www.citur.gov.co/estadisticas/df_parques_naturales/all/18 (accessed on 17 July 2019).
  44. Mancera, J.; Pinto, G.; Vilardy, S. Patrones de distribución estacional de masas de agua en la bahía de Santa Marta, Caribe colombiano: Importancia relativa del upwelling y outwelling. Bol. Investig. Mar. Costeras 2013, 2, 329–360. [Google Scholar] [CrossRef]
  45. INVEMAR. Diagnóstico y Evaluación de la Calidad de las Aguas Marinas y Costeras en el Caribe y Pacífico Colombianos. Red de Vigilancia para la Conservación y Protección de las Aguas Marinas y Costeras de Colombia: INVEMAR, MADS y CAR costeras. Informe Técnico 2016; Serie de Publicaciones Periódicas No. 4 (2017) del INVEMAR; INVEMAR: Santa Marta, Colombia, 2017; 260p. [Google Scholar]
  46. Franco-Herrera, A.; Torres, C.; Sanjuán, A.; García, L.; Ramírez, S.; López, D. Variabilidad Oceanográfica en la zona Costera de Departamento del Magdalena, Caribe Colombiano: Un Sistema de alto valor Trófico. Centro de Formación de la Cooperación Española en Cartagena de Indias: Biodiversidad y Turismo para un Desarrollo Sostenible. 2011. Available online: https://www.academia.edu/4026069/Variabilidad_oceanogr%C3%A1fica_en_la_zona_costera_de_departamento_del_Magdalena_Caribe_colombiano_Un_sistema_de_alto_valor_tr%C3%B3fico (accessed on 18 January 2019).
  47. Bastidas, M.; Ordóñez, S.; Ricaurte, C. Eventos de intensificación y relajación del viento en la bahía de Santa Marta (Caribe colombiano): Implicaciones oceanográficas. Bol. Investig. Mar. Costeras 2016, 45, 181–196. [Google Scholar] [CrossRef]
  48. Iñiguez-Armijos, C.; Sánchez, J.; Villareal, M.; Aguilar, S.; Rosado, D. Effects of bathing intensity, rainfall events, and location on the recreational water quality of stream pools in southern Ecuador. Chemosphere 2020, 243, 125442. [Google Scholar] [CrossRef] [PubMed]
  49. Liu, S.; Zhang, J.; Chen, H.; Zhang, G. Factors influencing nutrient dynamics in the eutrophic Jiaozhou Bay, North China. Prog. Oceanogr. 2005, 66, 66–85. [Google Scholar] [CrossRef]
  50. Betancourt, J.; Sánchez, J.; Mejía-Ladino, L.; Cantera, J. Calidad de las aguas superficiales de bahía Málaga, Pacífico colombiano. Acta Biol. Colomb. 2011, 16, 175–192. [Google Scholar]
  51. Smith, V.H.; Tilman, G.D.; Nekola, J.C. Eutrophication: Impacts of excess nutrient inputs on freshwater, marine, and terrestrial ecosystems. Environ. Pollut. 1999, 100, 179–196. [Google Scholar] [CrossRef]
  52. Paerl, H. Assessing and managing nutrient-enhaced eutrophication in estuarine and coastal waters: Interactive effects of human and climatic perturbations. Ecol. Eng. 2006, 26, 40–54. [Google Scholar] [CrossRef]
  53. Castro, I.B. Improper environmental sampling design bias assessments of coastal contamination. Trends Environ. Anal. Chem. 2019, 24, e00068. [Google Scholar] [CrossRef]
  54. Pusceddu, F.H.; Sugauara, L.E.; Rodrigues de Marchi, M.; Choueri, R.B.; Castro, Í.B. Estrogen levels in surface sediments from a multi-impacted Brazilian estuarine system. Mar. Pollut. Bull. 2019, 142, 576–580. [Google Scholar] [CrossRef] [PubMed]
  55. Garcés-Ordóñez, O.; Arteaga, E.; Obando, P.; Vivas-Aguas, L.J.; Espinosa, L.; González, M.; Giraldo, C.; Ricaurte, C. Atención a Eventuales Emergencias Ambientales en la Zona Marino-Costera del Departamento del Magdalena; Convenio CORPAMAG-INVEMAR No. 14 de 2014, Código: PRY-CAM-011-14, Informe Técnico Final; INVEMAR: Santa Marta, Colombia, 2016; 79p. [Google Scholar]
  56. Kocasoy, G. The relationship between coastal tourism, sea pollution and public health: A case study from Turkey. Environmentalist 1989, 9, 245–251. [Google Scholar] [CrossRef]
  57. MinSalud. Decreto No. 1594 del 26 de Junio de 1984. Por el cual se Reglamenta Parcialmente el Título I de la Ley 9 de 1979, así como el Capítulo II del Título VI–Parte III-Libro II y el Título III de la Parte III–Libro I–del Decreto–Ley 2811 de 1974 en Cuanto a Usos del Agua y Residuos Líquidos; MinSalud: Bogotá, Colombia, 1984; 61p. [Google Scholar]
  58. Commendatore, M.G.; Franco, M.A.; Gomes, P.; Castro, I.B.; Fillmann, G.; Bigatti, G.; Esteves, J.; Nievas, M.L. Butyltins, polyaromatic hydrocarbons, organochlorine pesticides, and polychlorinated biphenyls in sediments and bivalve mollusks in a mid-latitude environment from the Patagonian coastal zone. Environ. Toxicol. Chem. 2015, 34, 2750–2763. [Google Scholar] [CrossRef] [PubMed] [Green Version]
  59. Pikkarainen, A.; Lemponen, P. Petroleum hydrocarbon concentrations in Baltic Sea subsurface water. Boreal Environ. Res. 2005, 10, 125–134. [Google Scholar]
  60. El-Tohamy, W.; Azab, Y.; Aziz, N.A. Evaluation of the Water Quality of Damietta Harbor: Using the Zooplankton Diversity and the Traditional Water Quality Parameters. Int. J. Ocean. Oceanogr. 2019, 13, 229–246. [Google Scholar]
  61. Zanardi, E.; Bícego, M.C.; Weber, R.R. Dissolved dispersed petroleum aromatic hydrocarbons in the São Sebastião Channel, São Paulo, Brazil. Mar. Pollut. Bull. 1999, 38, 410–413. [Google Scholar] [CrossRef]
  62. Acuña-González, J.; Vargas-Zamora, J.; Gómez-Ramírez, E.; García-Céspedes, J. Hidrocarburos de petróleo disueltos y dispersos, en cuatro ambientes costeros de Costa Rica. Rev. Biol. Trop. 2004, 52, 43–50. [Google Scholar] [PubMed]
  63. Rubiera, J. Early Warning for Hurricanes. In Proceedings of the Thematic Session Cluster 2 World Conference on Disaster Reduction, Kobe, Japan, 18–22 January 2005. [Google Scholar]
  64. Ortíz, J.C. Huracanes y tormentas tropicales en el Mar Caribe colombiano desde 1900. Bol. Científico (CIOH) 2007, 25, 54–60. [Google Scholar] [CrossRef]
  65. Centro de Investigaciones Oceanográficas e Hidrográficas del Caribe (CIOH). Climatología del Caribe: Ciclones Tropicales. 2019. Available online: https://www.cioh.org.co/meteorologia/Climatologia/ClimatologiaCaribe6.php (accessed on 13 March 2019).
  66. Yu-Fai, L.; Anna, S.; Glen, H.; Ralf, B.; Groves, C. (Eds.) Tourism and Visitor Management in Protected Areas: Guidelines for Sustainability; Best Practice Protected Area Guidelines Series No. 27; IUCN: Gland, Switzerland, 2018; 120p. [Google Scholar] [CrossRef]
  67. Makri, P.; Stathopoulou, E.; Hermides, D.; Kontakiotis, G.; Zarkogiannis, S.D.; Skilodimou, H.D.; Bathrellos, G.D.; Antonarakou, A.; Scoullos, M. The Environmental Impact of a Complex Hydrogeological System on Hydrocarbon-Pollutants’ Natural Attenuation: The Case of the Coastal Aquifers in Eleusis, West Attica, Greece. J. Mar. Sci. Eng. 2020, 8, 1018. [Google Scholar] [CrossRef]
  68. Castro, I.B.; Machado, F.B.; Tavares de Sousa, G.; Paz-Villarraga, C.; Fillmann, G. How protected are marine protected areas: A case study of tributyltin in Latin America. J. Environ. Manag. 2021, 278 Pt 2, 111543. [Google Scholar] [CrossRef]
  69. Nunes, B.; Zanardi-Lamardo, E.; Choueri, R.B.; Castro, Í.B. Marine protected areas in Latin America and Caribbean threatened by polycyclic aromatic hydrocarbons. Environ. Pollut. 2021, 269, 116194. [Google Scholar] [CrossRef] [PubMed]
  70. Rodríguez-Grimon, R.; Campos, N.H.; Castro, Í.B. Imposex Incidence in Gastropod Species from Santa Marta Coastal Zone, Colombian Caribbean Sea. Bull. Environ. Contam. Toxicol. 2020, 105, 728–735. [Google Scholar] [CrossRef] [PubMed]
Figure 1. Location of sampling stations in Santa Marta Bay (BSM) and Tayrona National Natural Park (PNNT). SM: International Santa Marta Marina; BC: Concha Bay; Neg: Nenguange.
Jmse 09 00474 g001
Figure 2. Average of rainfall regime by season in Santa Marta between the years of 2015 and 2017. Source: Instituto de Hidrología, Meteorología y Estudios Ambientales (IDEAM).
Jmse 09 00474 g002
Figure 3. (A) Number of boats per month visiting Santa Marta, Bahía Concha, and Nenguange between seasons and (B) quadratic regression model between the number of boats and visitors per month in PNNT. Source: [30,43].
Jmse 09 00474 g003
Figure 4. (A) Principal component analysis (PCA), and (B) representation of canonical variables showing the relevance of studied variables in discriminating sampling station. SM: International Marina of Santa Marta; BC: Concha Bay; Neg: Nenguange.
Jmse 09 00474 g004
Table 1. Physicochemical and microbiological variables, marine traffic and pluviosity between seasons for studied sites in the coastal fringe of Santa Marta, Colombia, years 2015–2017. N: number of samples; Av: average; sd: standard deviation; (*) denotes significant differences between seasons for each site by Wilcoxon paired comparison test, p < 0.05.
VariablesN
Dry/Rainy
Sampling Stations
Santa Marta (SM)Bahía Concha (BC)Nenguange (Neg)
DryRainyDryRainyDryRainy
AvsdAvsdAvsdAvsdAvsdAvsd
Salinity (o/oo)9/636.30.236.10.236.3 *0.135.50.436.6 *0.136.00.4
DO (mg/L)9/66.8 *0.95.30.86.5 *0.45.60.55.80.35.50.6
pH9/68.10.18.10.18.20.18.10.18.00.08.00.1
SST (mg/L)9/621.29.824.38.430.59.429.613.121.912.118.11.7
P-PO43− (µg/L)9/63.11.12.50.82.1 *0.51.20.62.40.12.30.1
N-NO2 (µg/L)9/62.4 *1.51.40.91.20.10.50.10.90.40.60.1
N-NO3 (µg/L)9/69.98.73.92.04.6 *2.91.50.46.13.52.60.9
N-NH4+ (µg/L)9/62.90.12.70.523.9 *41.82.60.24.32.02.90.3
DDPH (µg/L)9/60.80.70.40.10.20.20.20.10.2 *0.10.10.1
TC (NMP/100 mL)9/6119163438 *89659353182231
Maritime traffic11/90.7330.3630.5470.1880.2220.1440.2660.1870.1460.0910.2090.153
VEc11/90.2080.1490.1400.0610.2020.1390.2460.1830.1280.0920.1900.152
VEe11/90.1280.0520.1260.0250.0150.0060.0160.0070.0140.0070.0140.006
VEt11/90.3980.2960.2830.1760.0050.0030.0060.0040.0020.0020.0030.003
Pluviosity (mm)10/14121389 *317113148 *747113148 *74
Publisher’s Note: MDPI stays neutral with regard to jurisdictional claims in published maps and institutional affiliations.

