Article

Cavitating Flow in the Volute of a Centrifugal Pump at Flow Rates Above the Optimal Condition

1
National Research Center of Pumps, Jiangsu University, Zhenjiang 212013, China
2
School of Mechanical Engineering, Nantong University, Nantong 226019, China
3
Zhejiang LBX pump industry CO., LTD., Wenling 317500, China
*
Author to whom correspondence should be addressed.
J. Mar. Sci. Eng. 2021, 9(4), 446; https://doi.org/10.3390/jmse9040446
Submission received: 22 March 2021 / Revised: 19 April 2021 / Accepted: 19 April 2021 / Published: 20 April 2021
(This article belongs to the Section Ocean Engineering)

Abstract

:
Cavitation is regarded as a considerable factor causing performance deterioration of pumps under off-design conditions, especially at overload conditions. To investigate the unsteady cavitation evolution around the tongue of a pump volute, and its influence on the flow field within passages of the impeller, numerical calculations and several hydraulic tests were performed on a typical centrifugal pump with a shrouded impeller. Emphasis was laid on the cavitation evolution and blade-loading distribution at flow rates above the optimal value. Results indicated that vapor is likely to first emerge from the tongue of the volute rather than at the leading edge of the blades at overload conditions. In contrast to the designed condition, the flow distribution in each passage is obviously different. The flow rate of the passage reaches a maximum just past the location of the tongue, while the minimum flow rate value is projected to appear at the passage upstream. The cavitation at the tongue squeezes the flow area at the outlet of the corresponding flow passage of the tongue, thereby causing a huge growth in the flow rate at the impeller outlet.

1. Introduction

The generation of cavitation is a significant contributory factor to the performance deterioration in hydraulic machinery [1,2,3]. As for volute pumps, widely used in marine and other fields, cavitation always plays a role in the causing of vibration and noise under off-design conditions. A number of factors are known to affect the cavitation performance, such as the blade structure, inducer, and installation condition, etc. [4,5,6]. Furthermore, the occurrence of cavitation in each path of the impeller can cause a gradual decline in energy exchange between the liquid and blades, which would result in a sudden deterioration of performance, even apparatus failure. Generally, in the case of centrifugal pumps, the flow separation, characterized by the unsteady shedding of vortices from the leading edges of the blades, is the main location of cavitation inception [7]. Nevertheless, the separated flow around the tongue can also lead to a sharp drop in local pressure, and in some special cases, the cavitation first appears at the tongue of the volute rather than the blade inlet [8,9]. Meanwhile, the head curve has a precipice shape as well as the typical characteristic curve of centrifugal pumps. Furthermore, the head drop due to cavitation does not come from cavitation in the impeller but the cavitation evolution at the tongue.
The investigation of flow field in the vicinity of or inside a vapor cloud is complex, and most studies in the field of cavitation in centrifugal pumps have only focused on the cavitation in the impeller. Maklakov et al. [10] visualized the cavitation structure on an arbitrarily shaped airfoil by utilizing a high-speed camera and Laser Doppler Velocity, which showed the cloud cavitating area consisting of two parts: attached vapor in the foreside and an unsteady two-phase mixture in the rear region. Fu et al. [11] proposed that the variation in radial force on the impeller are strongly influenced by the rotor–stator interaction, and cavitation causes the distortion of radial force. Dumitrescu et al. [12] analyzed the leading-edge separation bubbles on rotating blades at different rotation speeds, showing the flow around the bubbles reattaches to the section surface, with a turbulent boundary layer extending from the reattachment point to the trailing edge. By means of direct visualization and PIV measurements, Rudolf et al. [13] investigated the cavitation phenomena at the tongue of the volute and found it is similar to the cavitation on a single hydrofoil. The unsteady cavitation cloud generation results from the unsteady flow field generated by the passing of the blades. Based on the analysis of vibration signal using the mean and RMS amplitudes features, Ahmed et al. [14] found that using a low-frequency range between 1 kHz and 2 kHz was effective for monitoring cavitation in the pump. Wang et al. [15] developed a novel entropy production diagnostic model, with phase transition, to predict the irreversible loss of cavitation flow in hydraulic machinery by including the mass transfer and slip velocity, as well as the low-frequency excitation that is caused by a cavitation-induced vortex, which is consistent with the frequency-domain characteristics of the interface entropy production rate. Dular et al. [16] made a transient simulation of cavitating flow under different conditions for two hydrofoils and acquired the images of the vapor structures. Compared with the experiment results, numerically predicted results shows similar cavity structure length. Qiu et al. [17] conducted the numerical computation of a pumpjet propulsor with different tip clearances in oblique flow, and at the different cavitation numbers, the difference in the hydrodynamic parameters between the different tip clearances are relatively small. Xia et al. [18] simulated the cavitation of a waterjet propulsion pump, and the cavitation development trend is similar with it being under a small flow-rate condition. Cavitation emerges in the hub before the blade rim, and the maximum value of the vapor fraction in blade rim is larger than that in the hub. Yang et al. [19,20,21] determined the design of an inducer to improve the anticavitation performance, and as the cavitation number decreases, the bubbles occurs in the leakage vortex firstly, and the leakage vortex cavitation is connected with the shear cavitation in the leakage flow, forming a stable leakage cavitation. Jiang et al. [22] found that the cavitation performance can be improved effectively by arranging a variable pitch inducer and adopting an annular nozzle scheme. Jain et al. [23] illustrated that when a pump is operated as a turbine, it might be suffering from traveling bubble and von Karman vortex cavitation near the impeller blades, and vortex rope cavitation in the draft tube. Wang et al. [24] and Liu et al. [25] investigated several improved turbulence models to obtain high resolution results of the successive stages of unsteady cavitating flow in a centrifugal pump. Hu et al. [26] conducted a visualization experiment to validate the unsteady simulation of cavitation in the centrifugal pump, and the cavitation inception, shedding off, and collapse procedure of the cavitation evolution were successfully captured.
The above research results indicate that the vaporization preferably emerges on the suction side of the blade leading edges in the impeller. Otherwise, only a few studies on the cavitation within the volute have been investigated. Therefore, this paper proposed a special case, in which the cavitation at the tongue causes a 3% head drop, while there is no obvious cavitation at the impeller inlet. Through numerical computation and hydraulic tests, the cavitation structure in the volute as well as the effect of its evolution process on the energy exchange within the impeller were demonstrated to provide a certain guidance for the optimization of the volute.

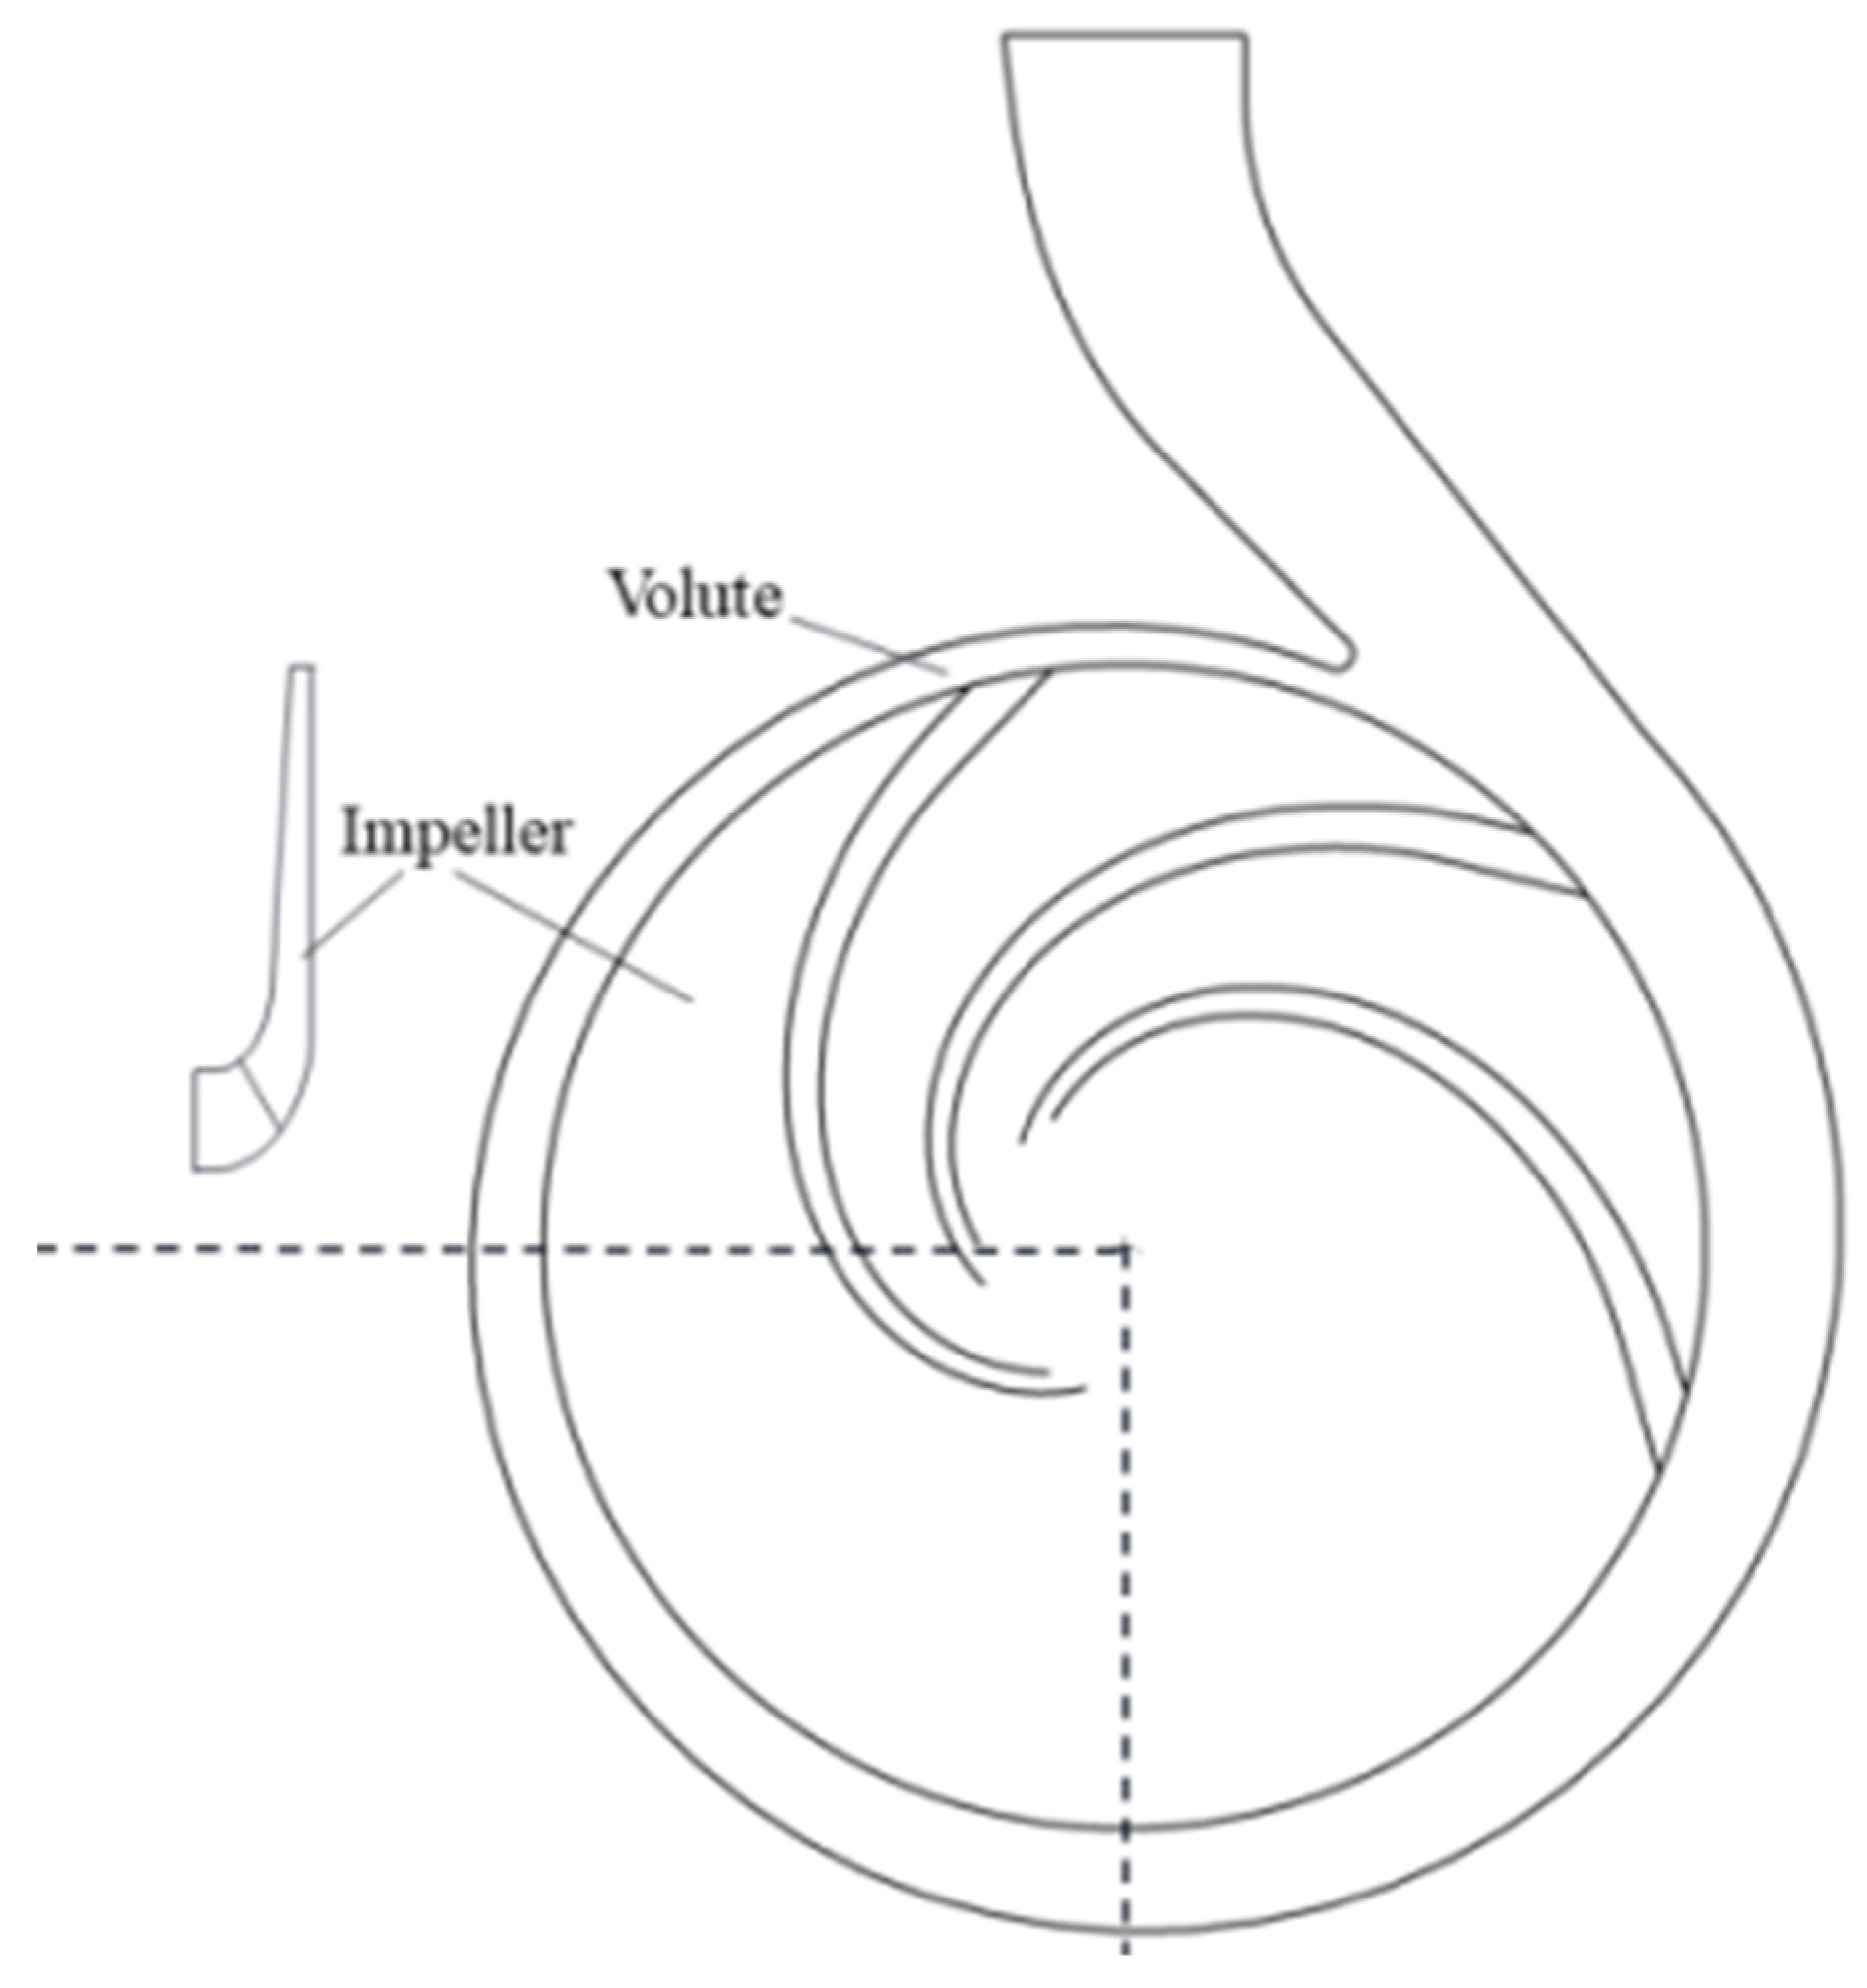
2. Geometry and Parameters

In this article, the model pump design parameters are as shown in Table 1, and Figure 1 illustrates the 2D hydraulic assembly sketch. The main hydraulic components of this model are the impeller and the volute. The impeller plays a role to transfer energy to the conveying fluid, while the spiral volute collects the fluid from the impeller and conveys fluid to the outlet section.

3. Numerical Modeling

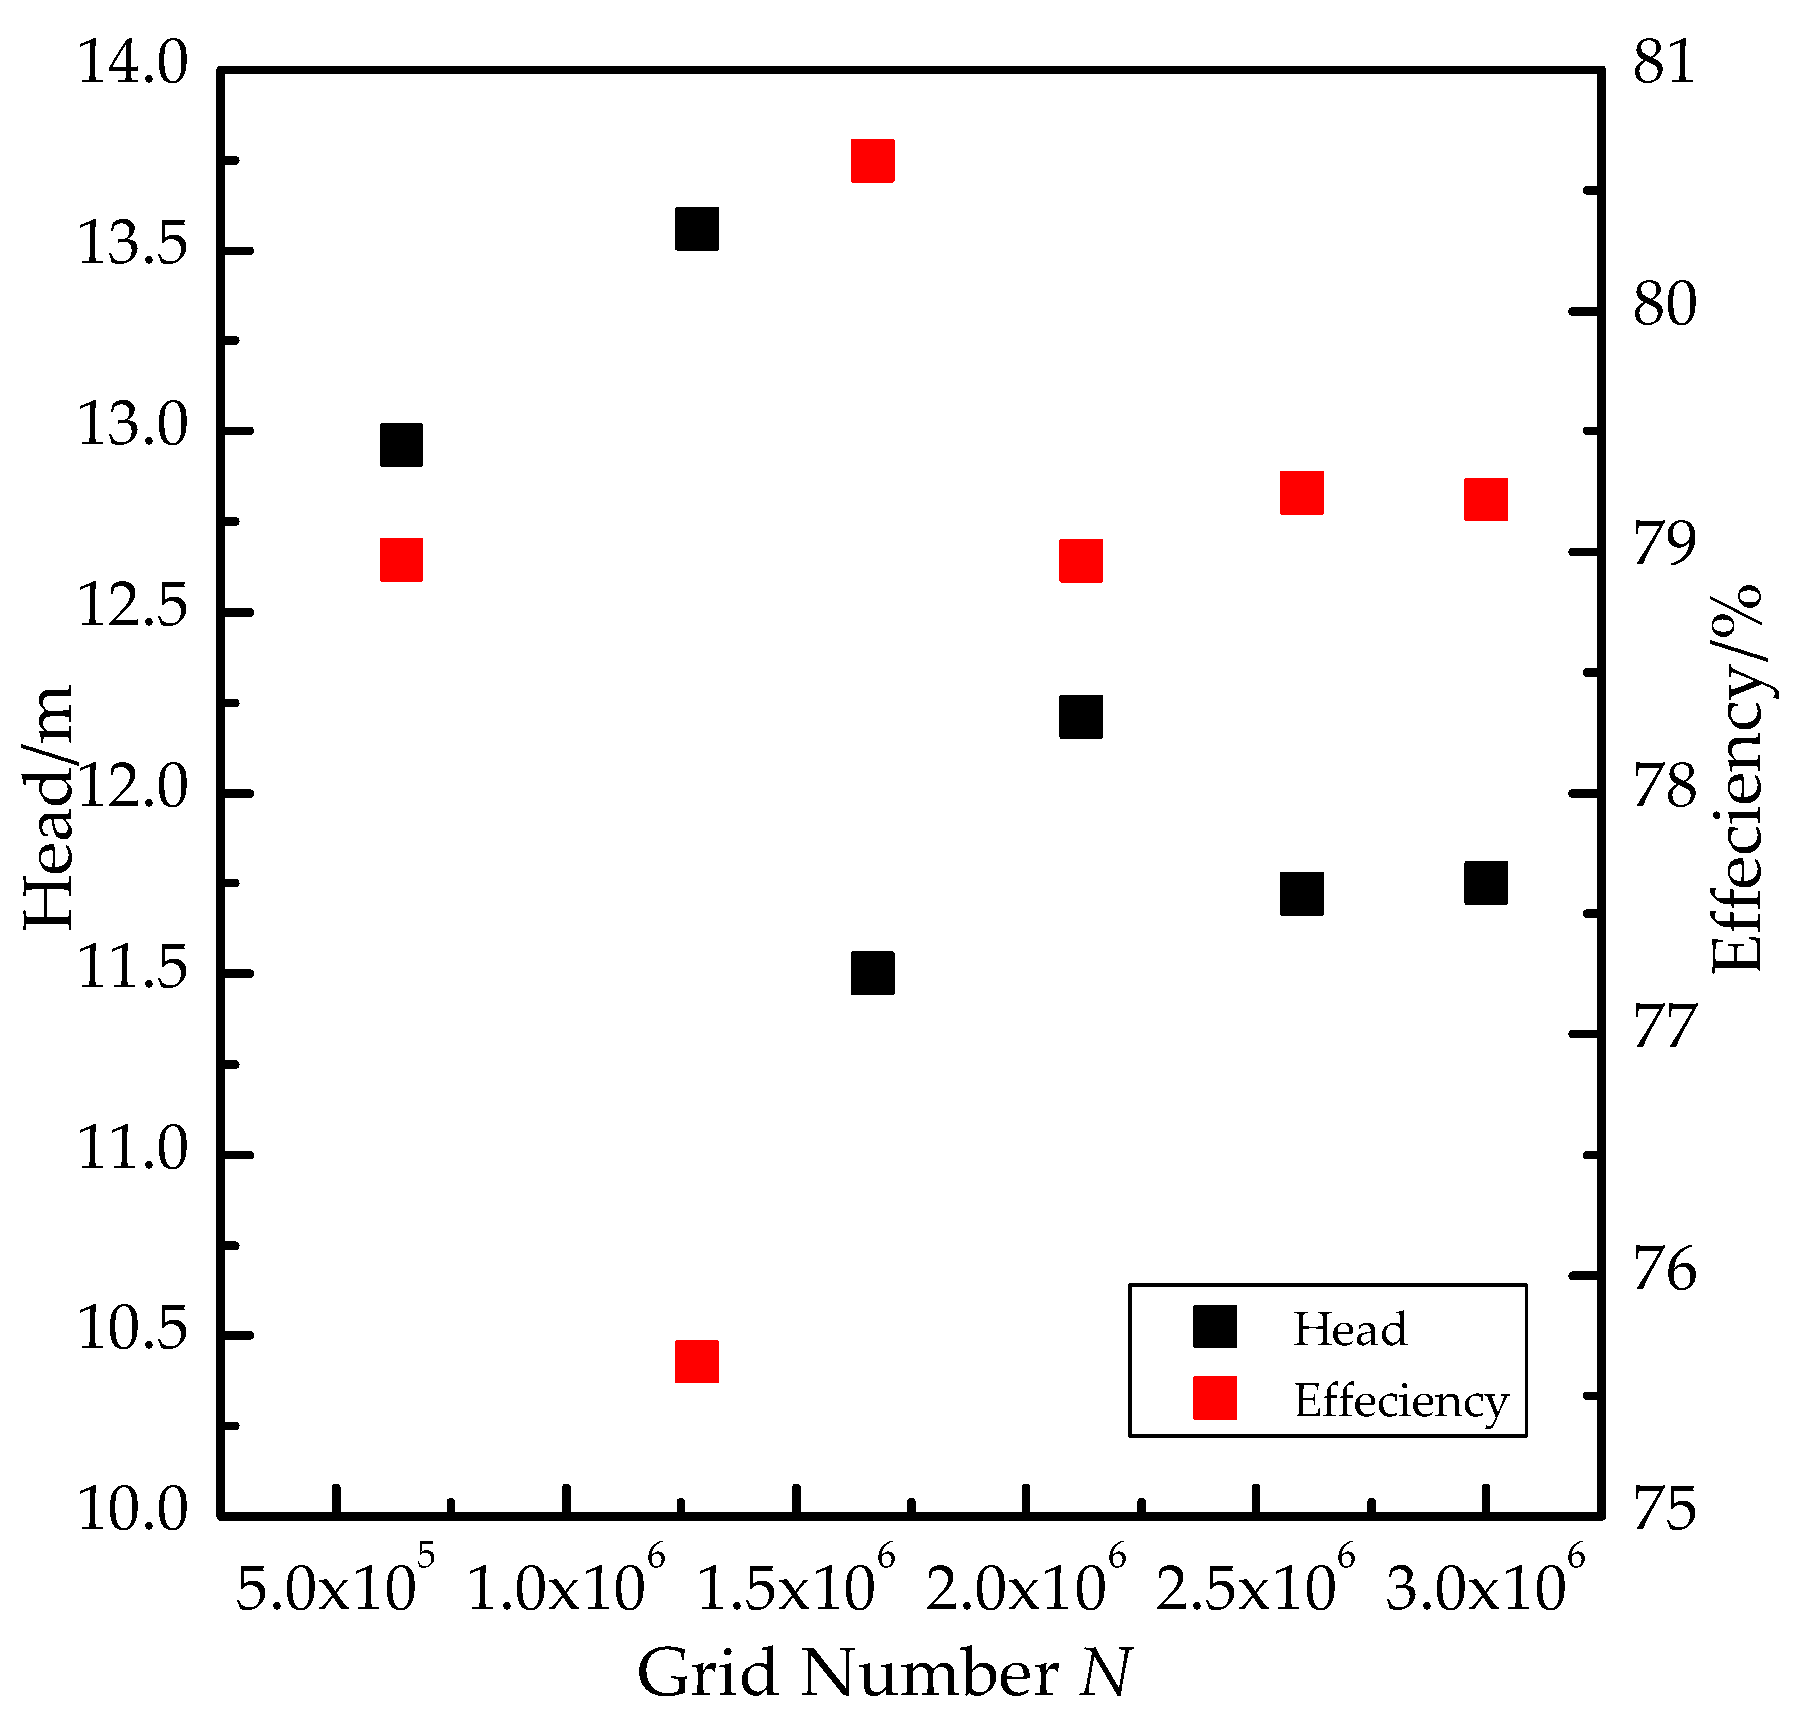
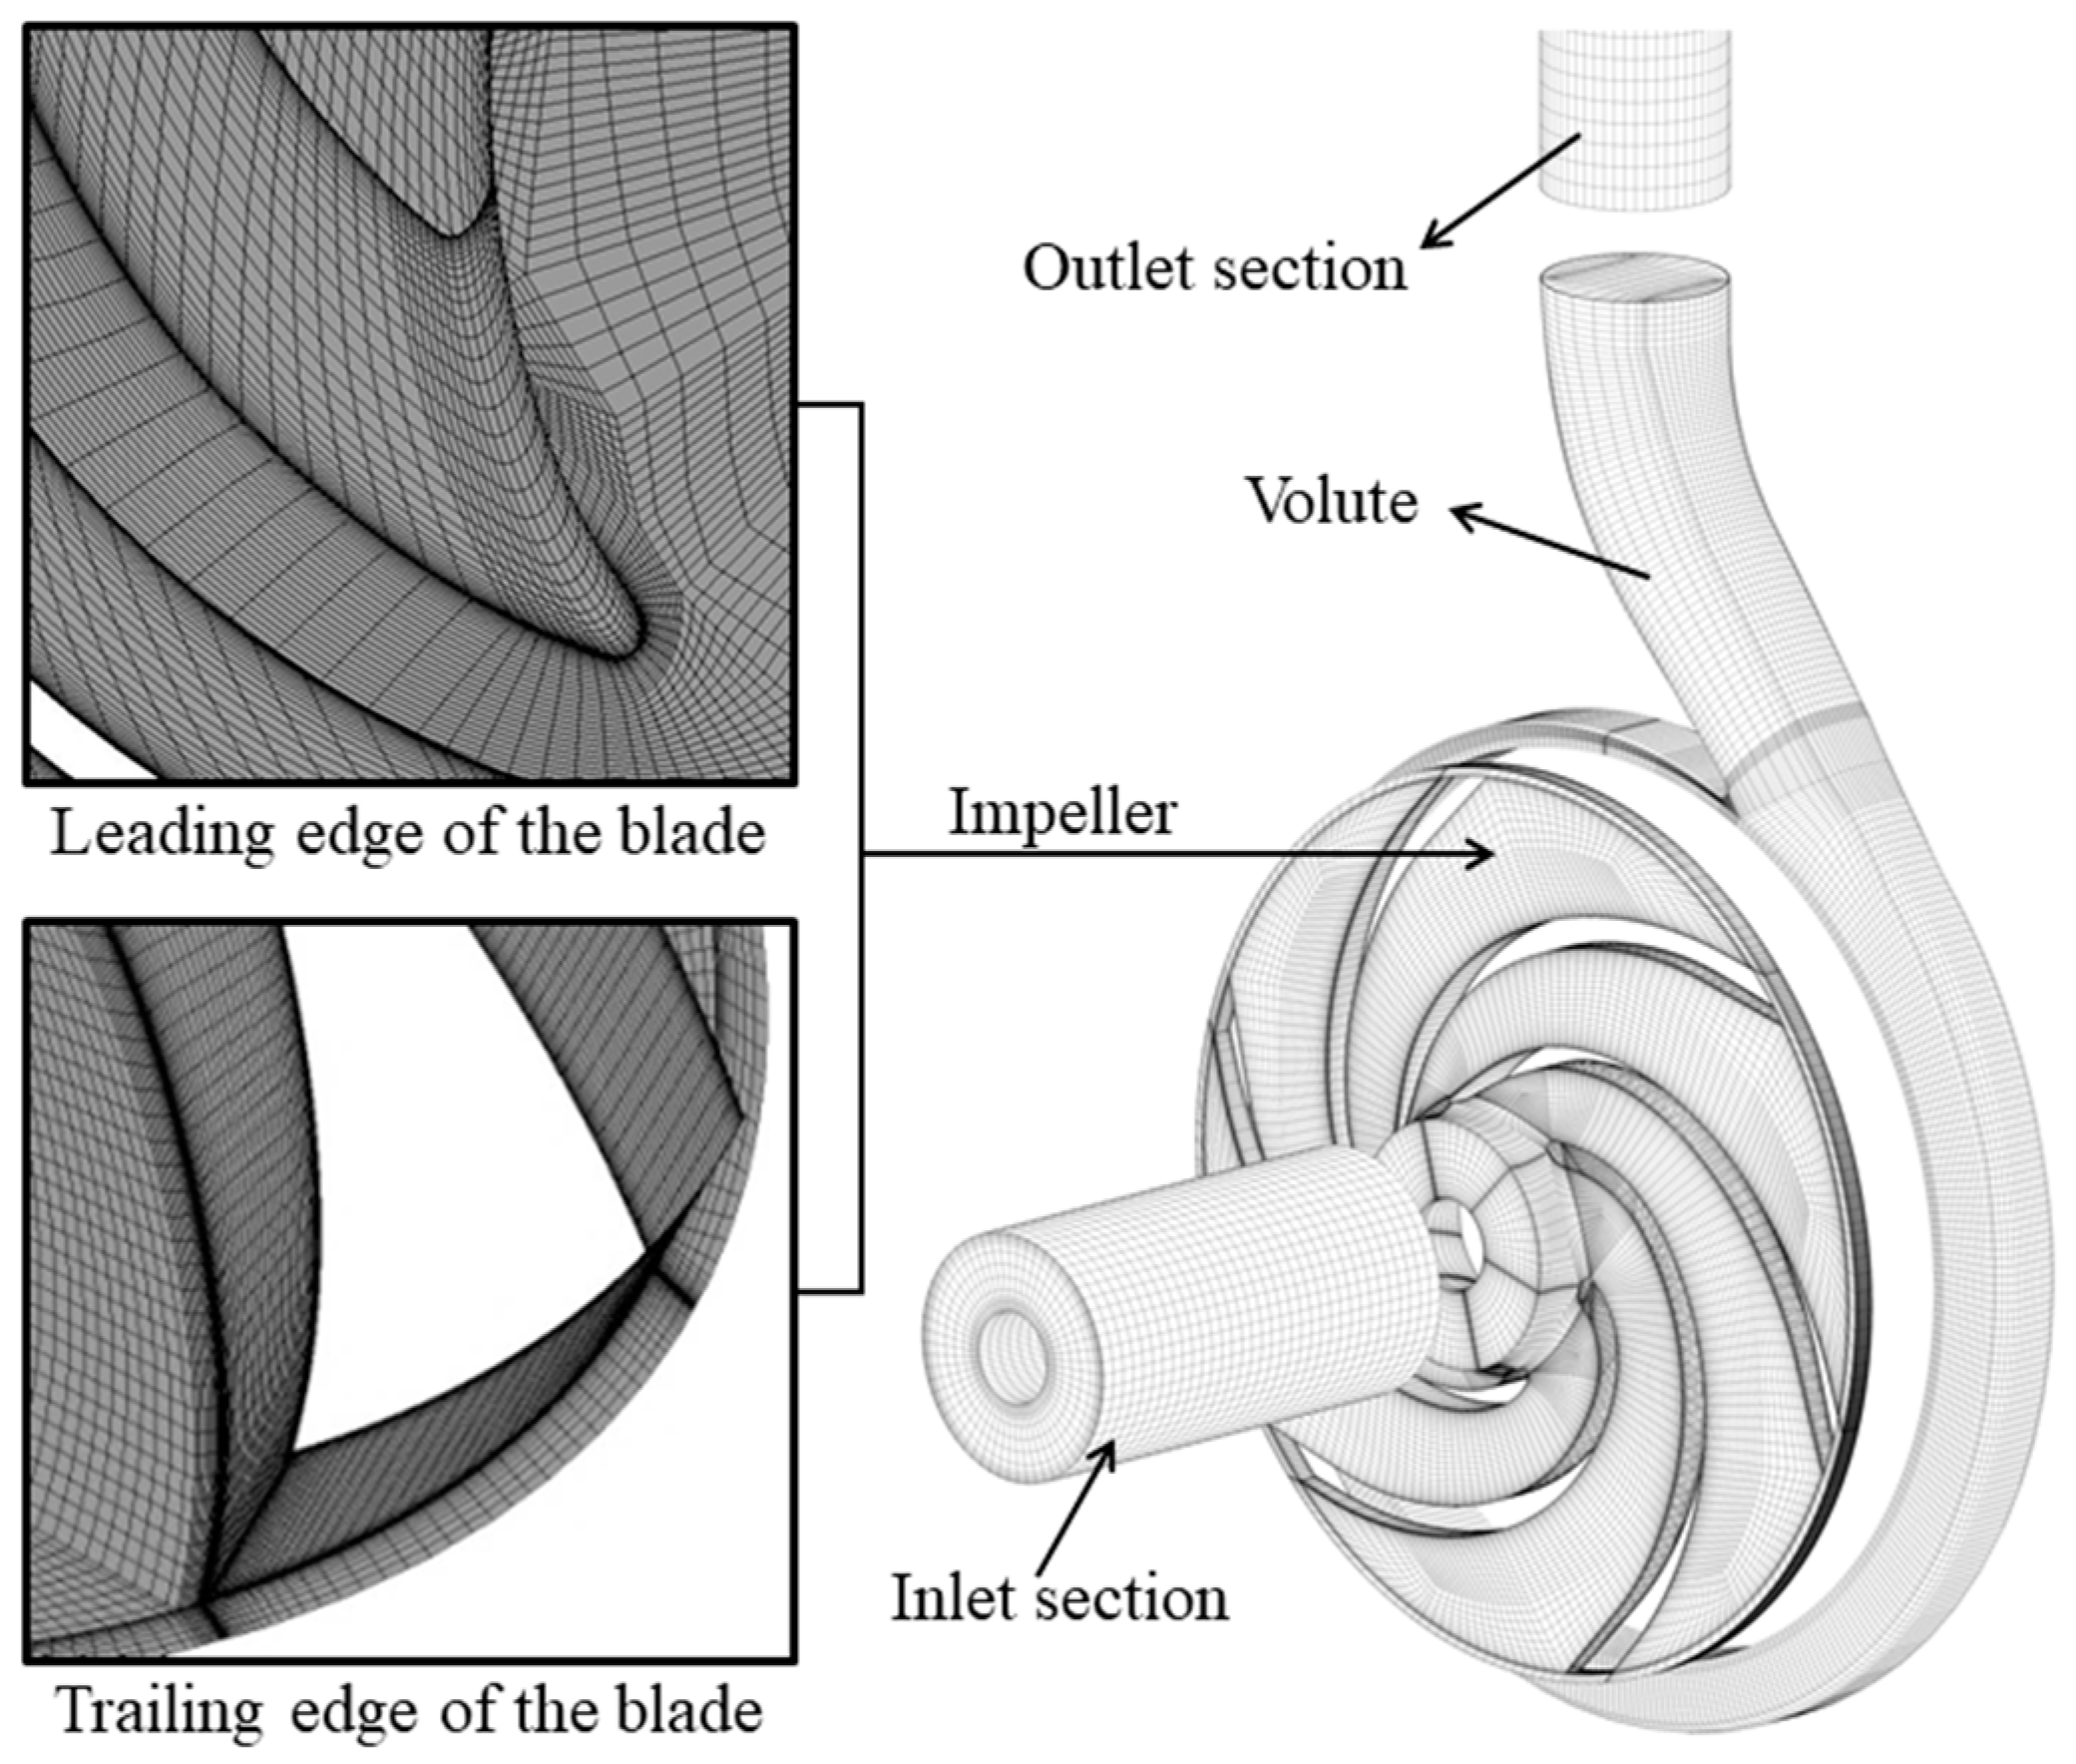
3.1. Three-Dimensional Model and Grids

The computational domain is simplified as the inlet, impeller, volute, and outlet section. Compared with tetrahedral meshes, hexahedral meshes can easily fit the boundary of the domain and is suitable for the calculation of fluid and concentration stress on wall surfaces, which not only improves the accuracy of the calculation, but also reduces the computing time. Therefore, ANSYS ICEM was used to generate hexahedral meshes for each computation domain, and 15 layers of boundary mesh was adopted near the wall of each subdomain. Figure 2 shows the mesh independence validation of the computation domains, and as the grid number was greater than 2.6 × 10⁶, the numerical results give an inapparent difference. Then, the grids of the computation domains were established, as shown in Figure 3.

3.2. Boundary Conditions

The transient simulation of the model pump was conducted with several flow rates above the designed value by utilizing ANSYS-CFX 17.0 software. Given that the cavitation phenomenon in a pump is closely linked to the static pressure at the impeller inlet, the total pressure inlet and mass flow rate outlet were set as the boundary conditions of the inlet and outlet. The impeller subdomain was set as the rotational domain, the general connection between the stationary subdomains. The volume fraction of the cavity at the inlet was 10−15. The wall roughness was 0.02 mm. The results of the noncavitation conditions were set as the initial values of the corresponding steady numerical simulation, and then the initial values of the unsteady cavitation calculation were the corresponding steady noncavitation results. The numerical calculations in this article were based on the SST k-omega turbulence model, which considers the homogeneous model based on the Zwart equation [27], in which the growth process of the bubbles in the fluid is described as follows:
R B d 2 R B d t 2 + 3 2 ( d R B d t ) 2 + 2 σ ρ f R B = p v p ρ f
where RB means the radius of the bubble, pv means the pressure inside the bubble, p is the pressure of the fluid outside of the bubble, ρf is the fluid density, and σ is the surface tension of the interface between the fluid and bubble.

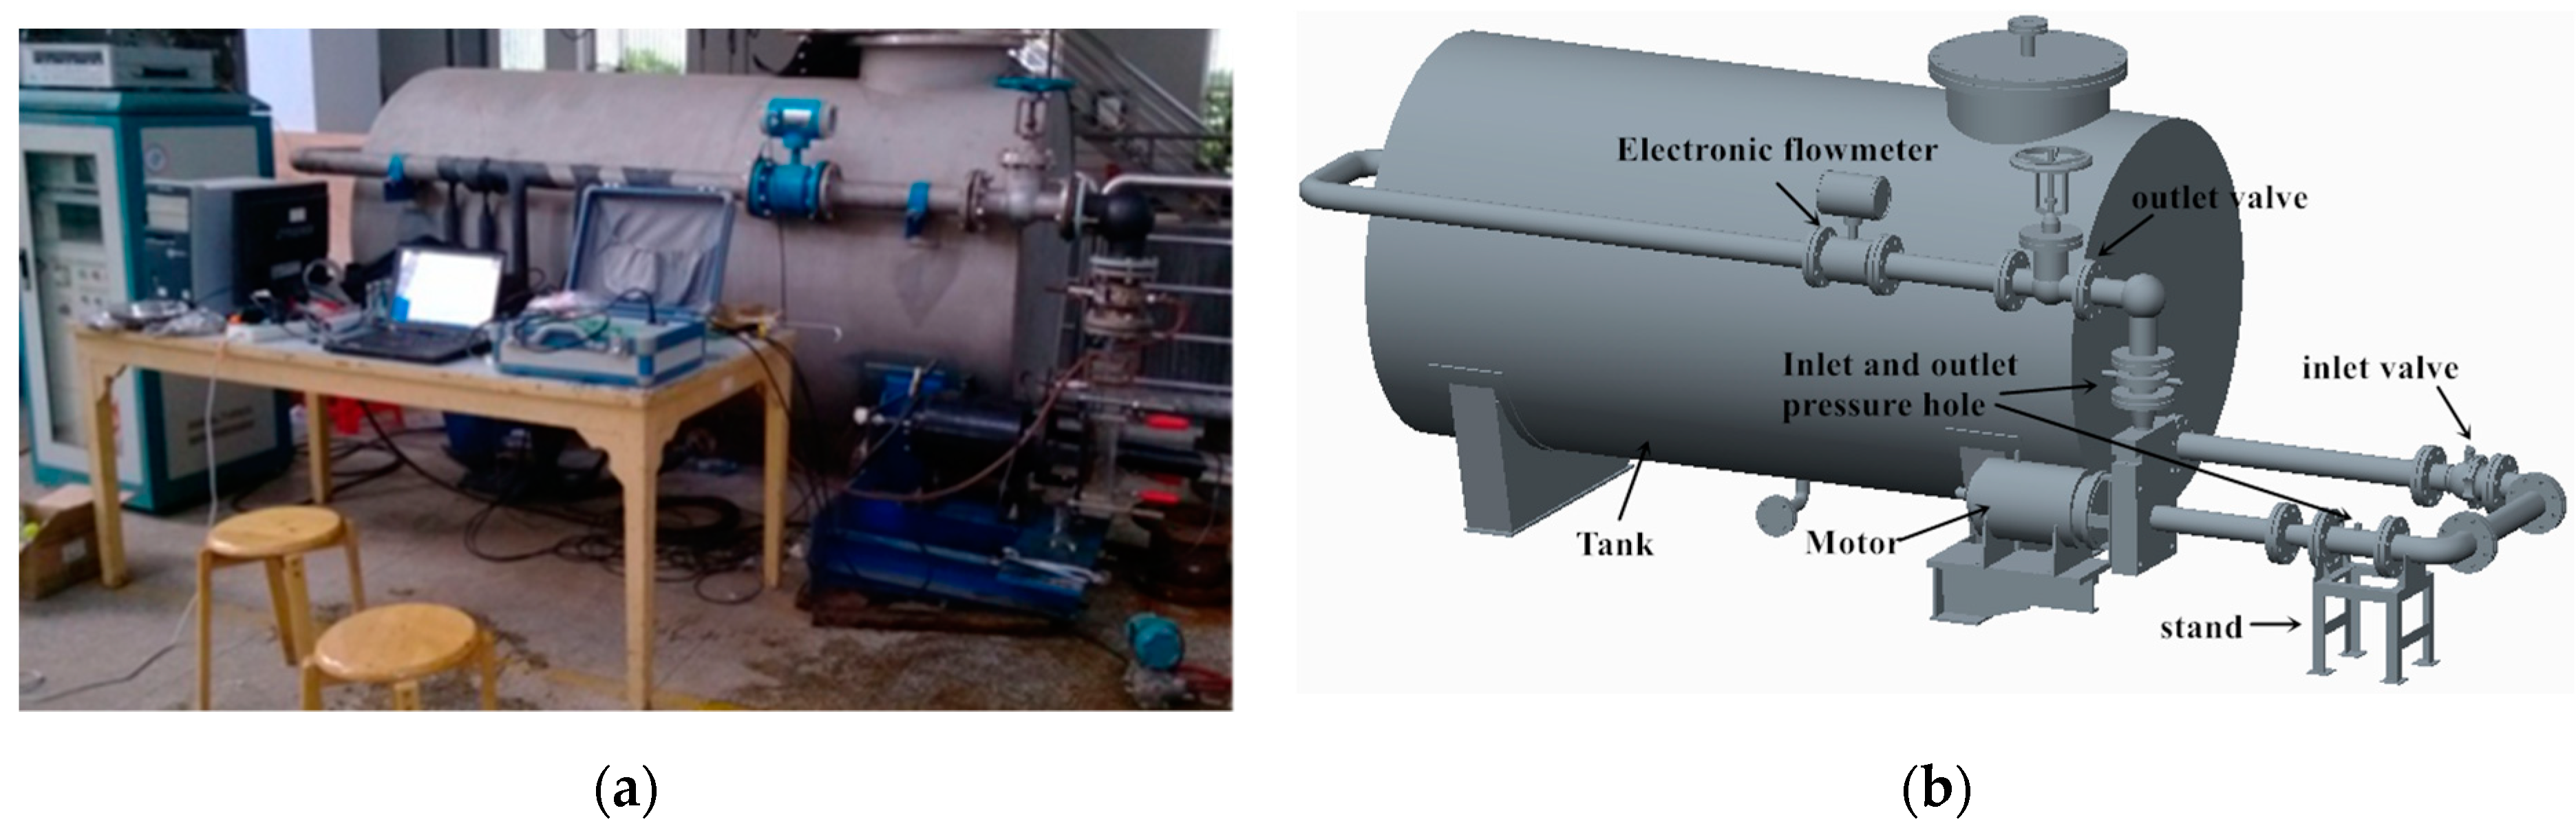
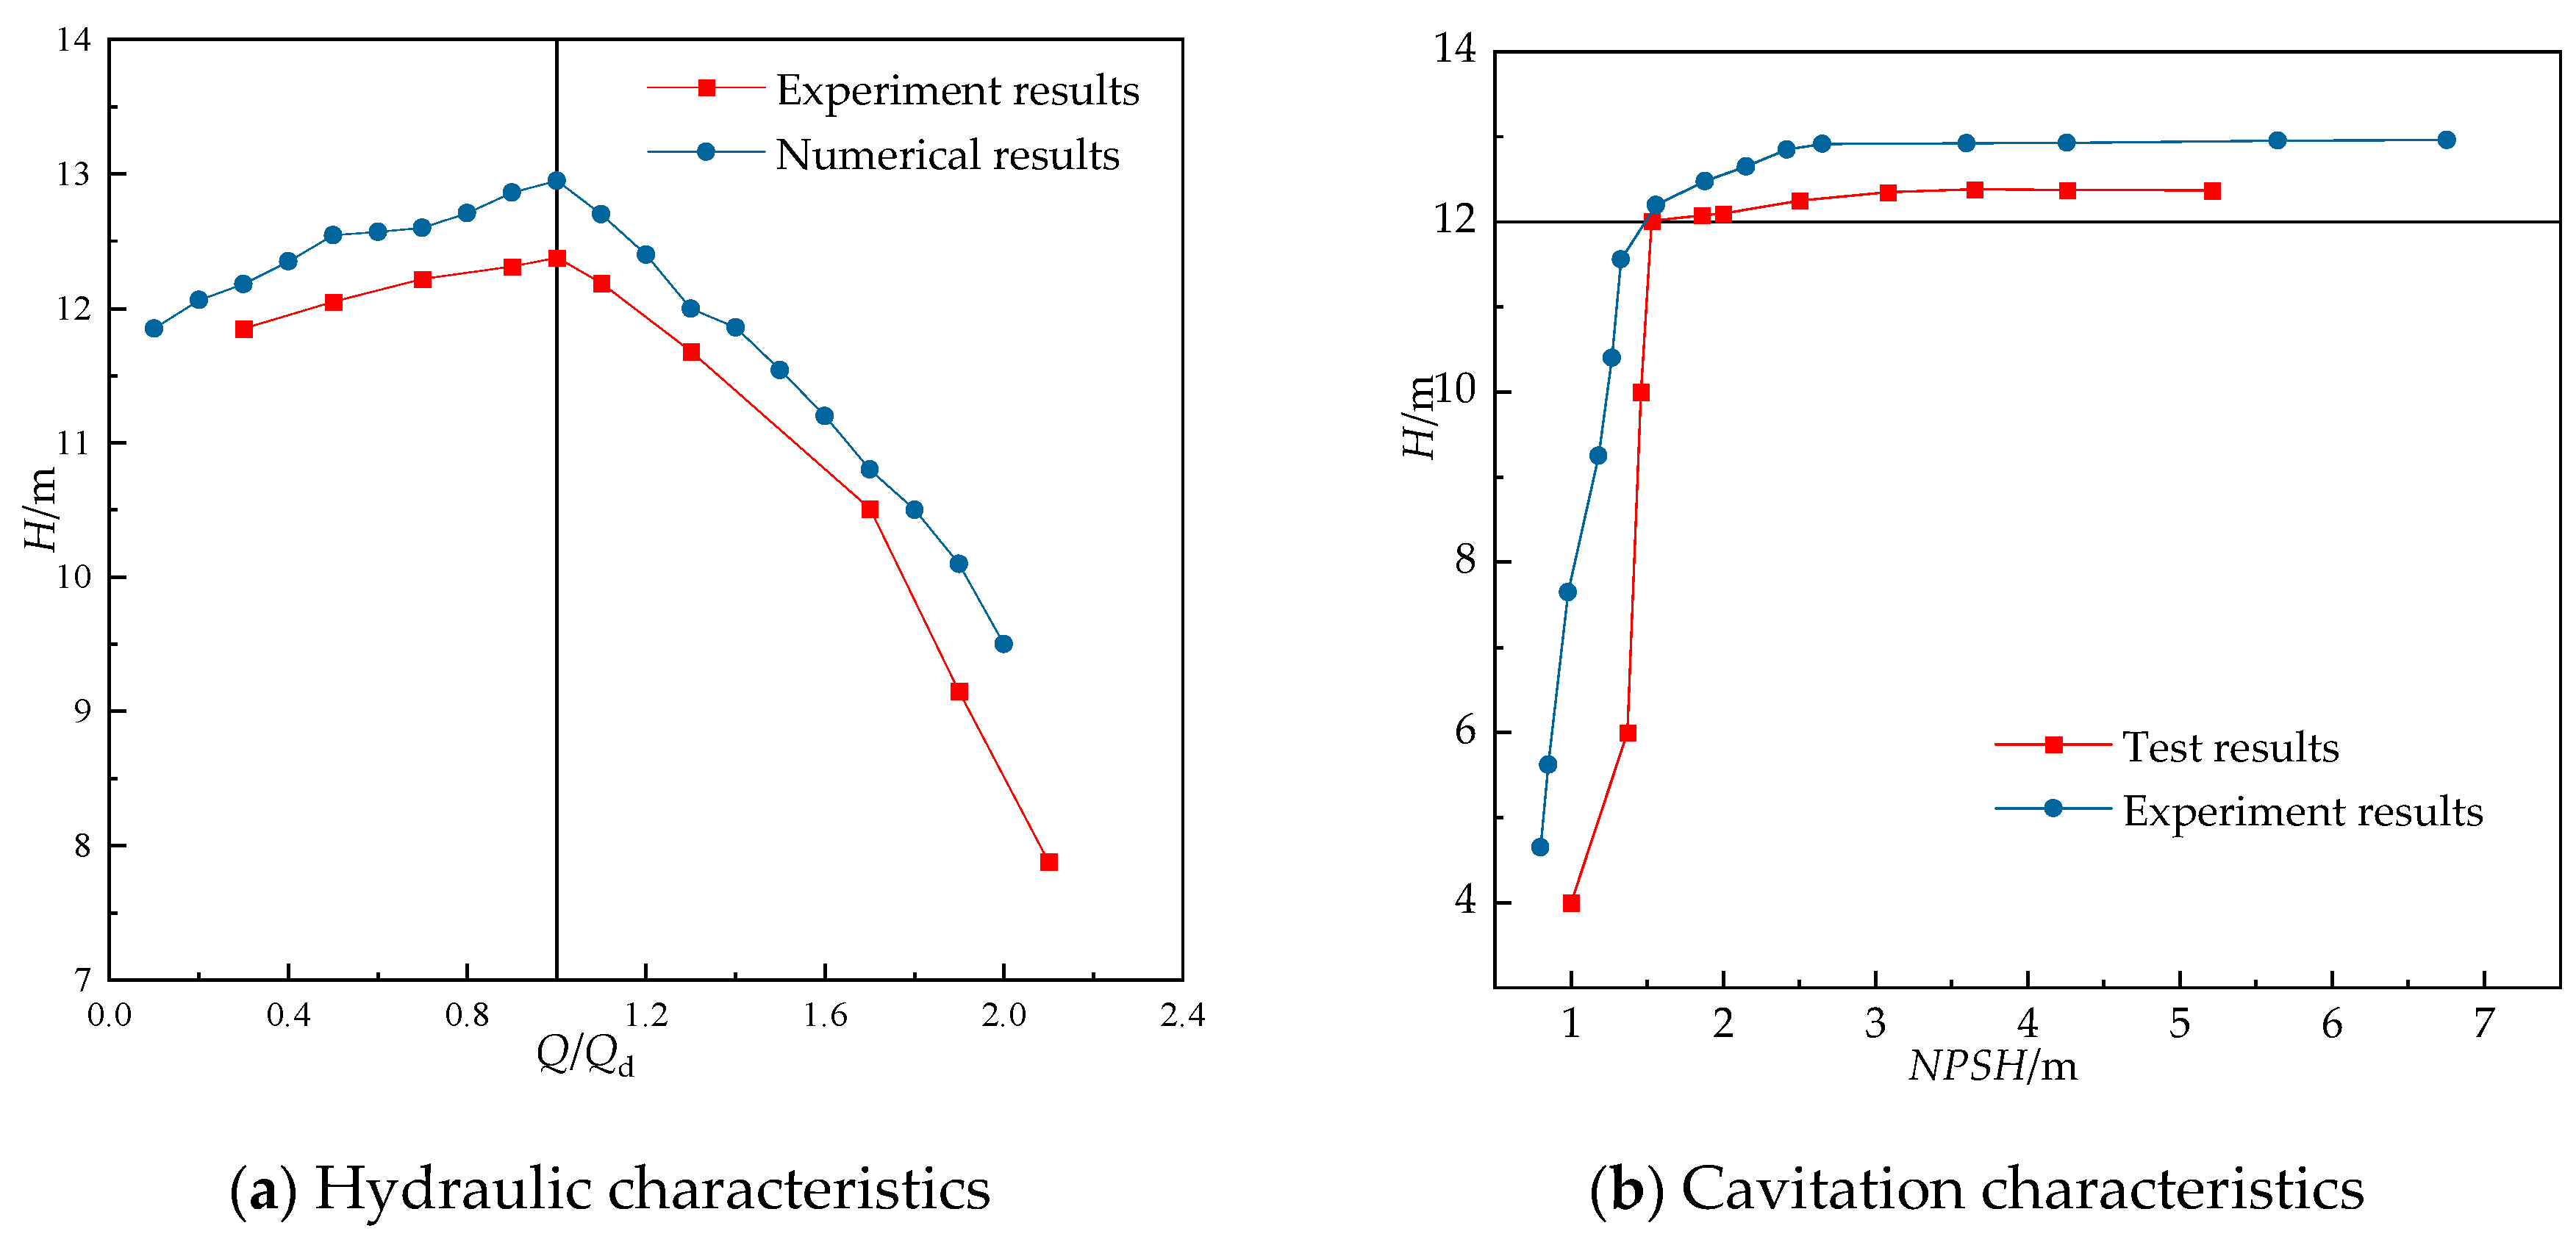
4. Hydraulic Tests of the Pump

Figure 4 illustrates the sketch of the closed stand. Besides measuring the external characteristics of the model pump at different flow conditions, some experiments about the pressure fluctuation downstream of the tongue and visualization of the cavitation could all be done at the test stand. The impeller and volute were made of PMMA. The test stand includes the following parts: (1) tank; (2) pipeline; (3) electronic flowmeter; (4) outlet valve; (5) outlet pressure hole; (6) inlet valve; (7) inlet pressure hole; (8) model pump; and (9) electric motor. An electronic flowmeter can obtain the flow rate of the pipeline, and with connecting pressure sensors to the inlet and outlet pressure holes, the pressure of the inlet and outlet fluid were measured to calculate the head of pump. The shaft power of the model pump was monitored through a specialized electrical control unit.
According to ISO9906, the uncertainties of Q, H were calculated by the square root of the sum of the uncertainties. e = e R 2 + e S 2 , where e is the overall uncertainty, eR is the stochastic uncertainty resulting from repeated measurement data; as each of the partial errors are calculated independently, with the law of a normal distribution, the true error is almost less than the uncertainty. eS is the system uncertainty in instruments or measure methods.
The overall uncertainty of the flow rate is Q, e ( Q ) = e R 2 ( Q ) + e S f 2 ( Q ) , where eSf (Q) is the system uncertainty of the flowmeter. The overall uncertainty of the head is H, e ( H ) = e R 2 ( H ) + e S p i n 2 ( H ) + e S p o u t 2 ( H ) , where e S p i n ( H ) is the system uncertainty of the range of pressure at the inlet of test pump. e S p o u t ( H ) is the system uncertainty of the range of pressure at the outlet of test pump. Table 2 shows the detailed calculation of the uncertainties when Q/Qd = 1.52.
The external characteristics of the overall results of the pump are shown in Figure 5. Figure 5a is the QH curve under noncavitation conditions, and Figure 5b demonstrated the NPSHH curve when Q/Qd = 1.52 and NPSH3% = 1.5 m. With the decline in NPSH, no obvious vapor emerged at the leading edge of the blades, while large attached cavitation rapidly formed at the tongue of the volute.
N P S H = p i n p v 0 ρ g + v i n 2 2 g
where pin means the static pressure of the inlet of the impeller, pv0 is the saturated vapor of the fluid, set as 3574 Pa, and vin, is the average absolute velocity at the inlet of the impeller.

5. Results Analysis and Discussion

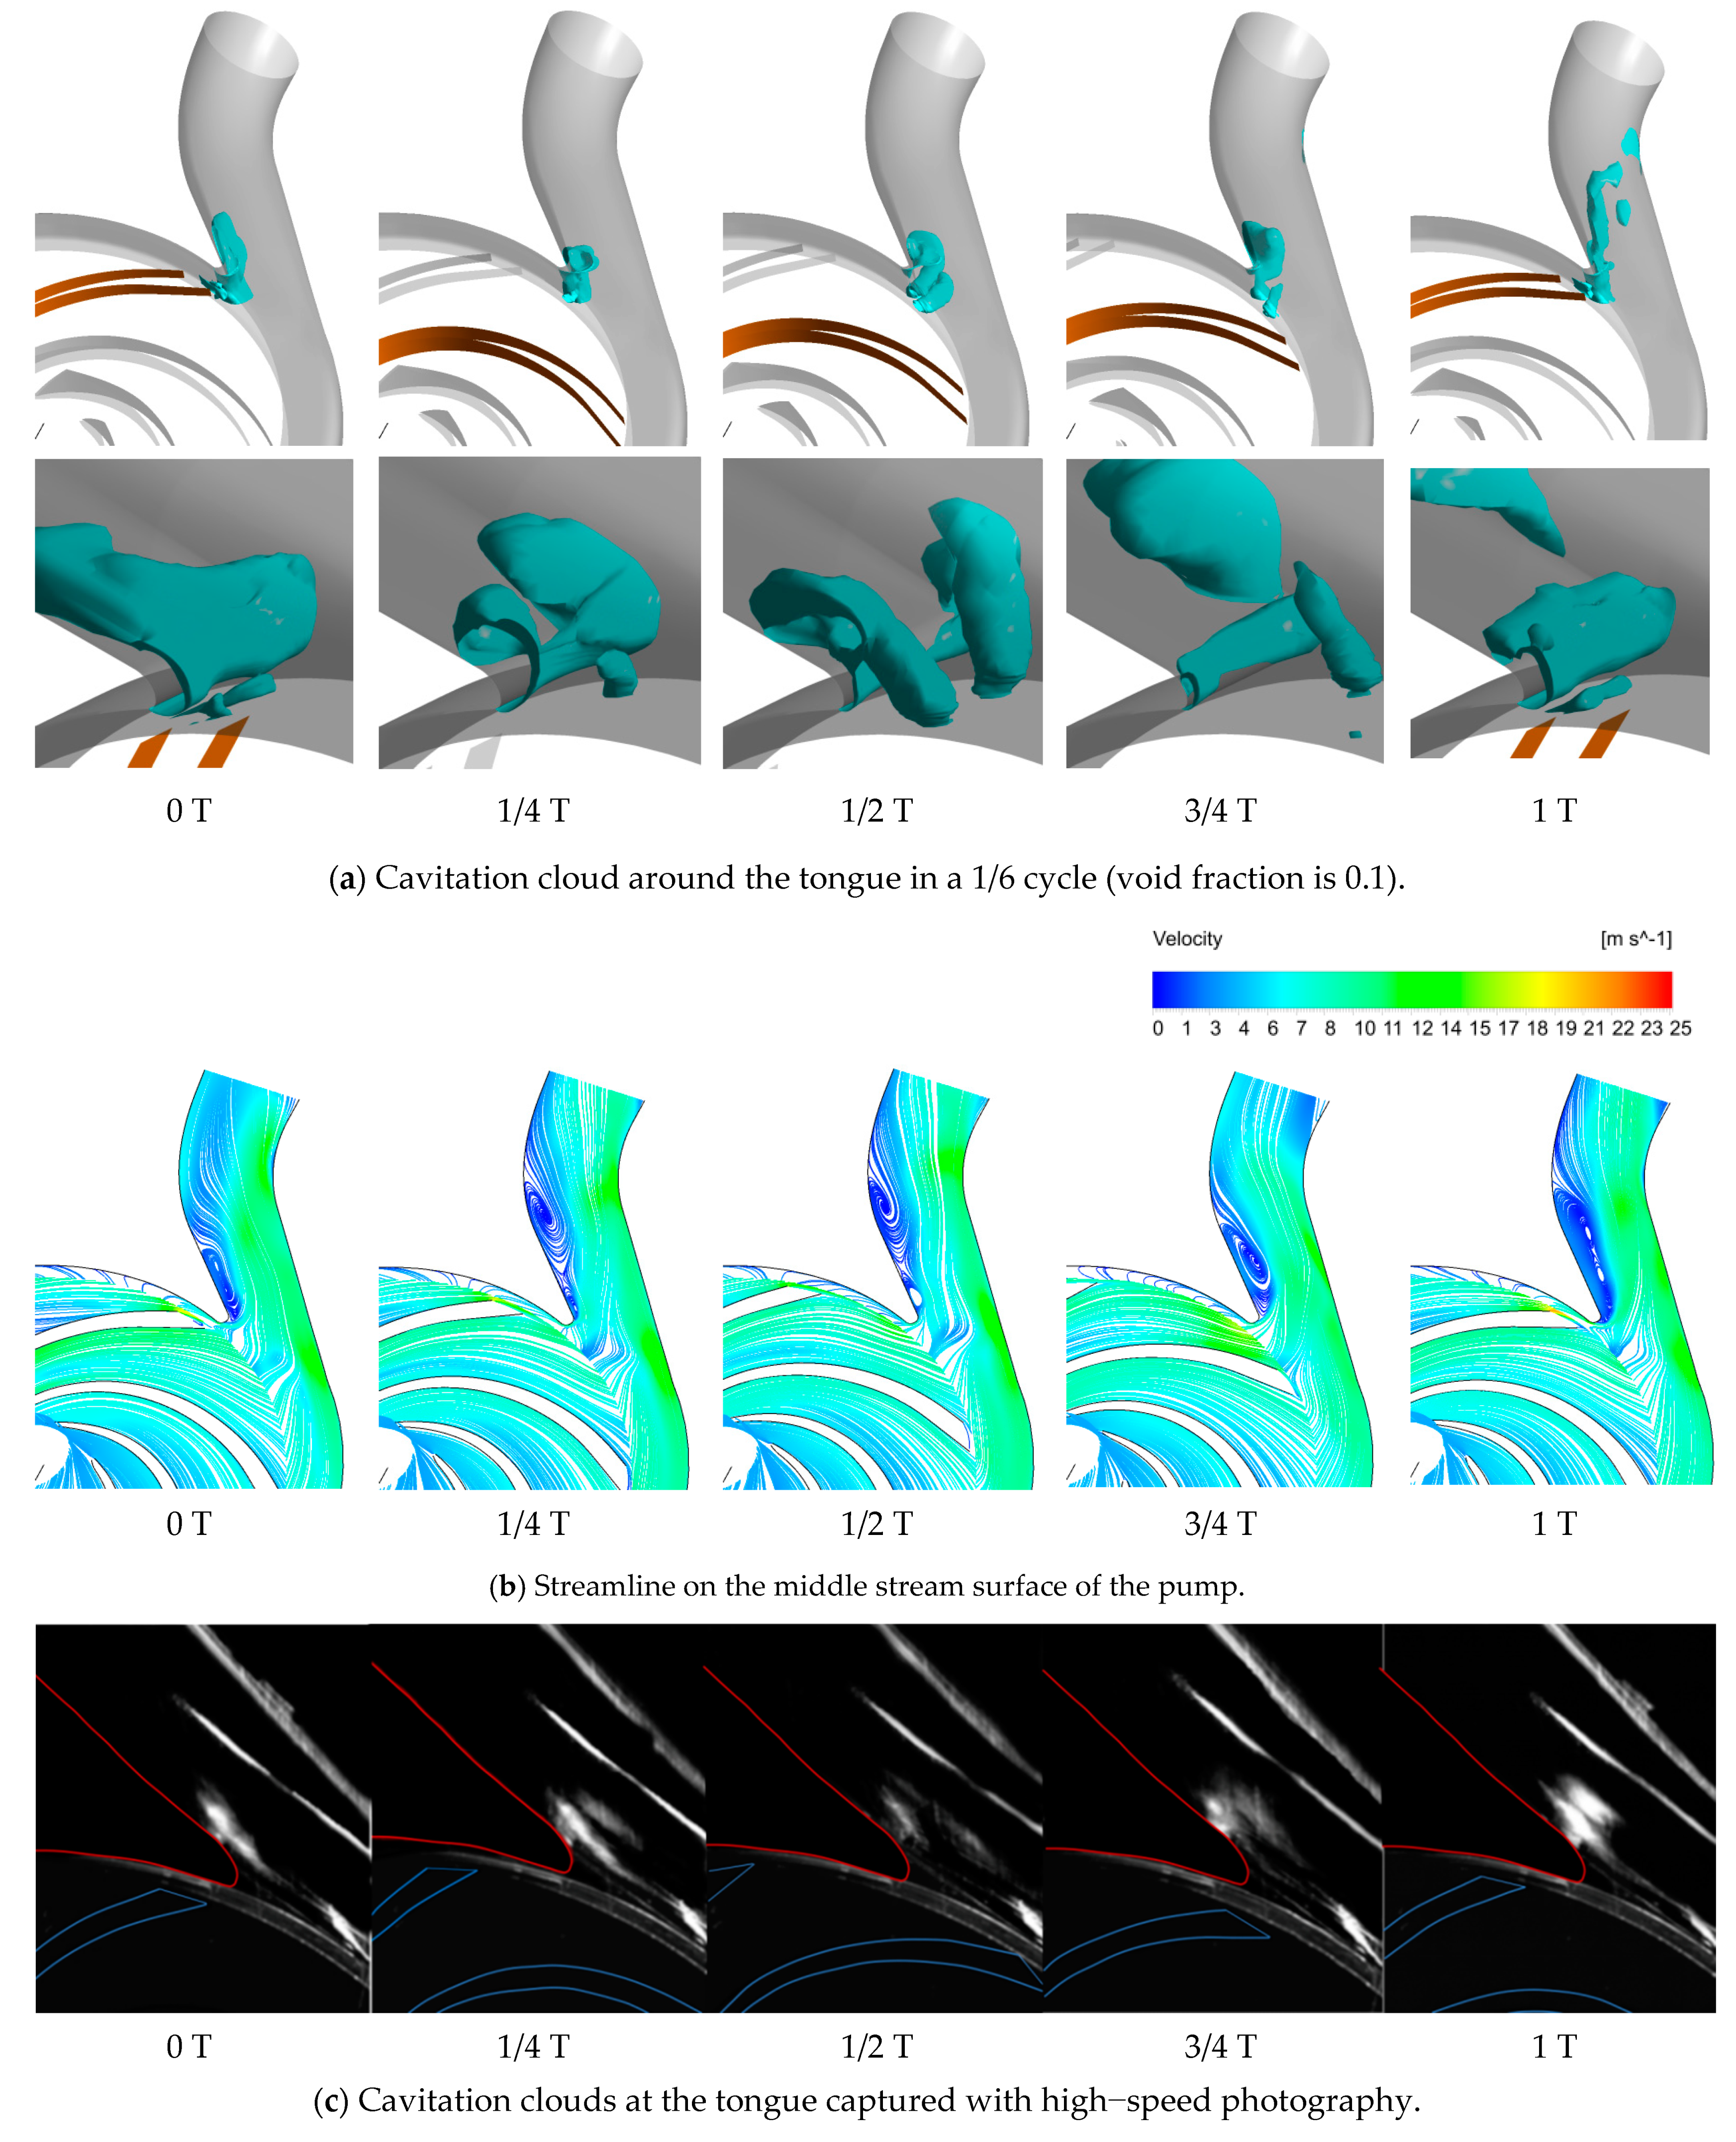
5.1. Cavitation Clouds at the Tongue

At operating points above the optimal value, high-speed separated flow at the tongue of the volute induces the vortex cavitation of shear turbulence. The unsteady process of shear layer instability and vortex shedding can be captured by numerical calculations. The strength of the separation vortex is effectively restrained as the tongue becomes shorter or the radius of the rounded corner becomes larger. At the conditions of a large flow rate, the similarity of the flow pattern of the adjacent passages is enhanced, and the isobaric surface of the static pressure is nearly circular. Hence, the flow distortion in the impeller is weakened, while the direct discharge of fluid from the impeller to the diffuser is obviously enhanced. The direction of the absolute velocity at the outlet of the impeller shifts to the side of the blade close to the tongue, and then to the incident flow; therefore, the leading edge of the tongue presents a negative attack angle for the incident flow. Under the influence of periodic strong shear flow, the local low pressure induces the cavitation, and the low-pressure area varies periodically with the rotation of the impeller.
Figure 6 shows the result of the tongue cavitation numerical simulation in the 1/6 cycle when Q/Qd = 1.52. The short tongue used in this article has great differences with the ordinary airfoils, but its structure of cavitation has great similarities with the attached cavitation on a single airfoil. The main factors affecting the cavitation evolution and shedding periodically around a single airfoil is the inlet velocity distribution and the Strouhal number; however, the cavitation evolution near the tongue in this case was influenced by the alternation of the pressure gradient as well as the jet wake vortices at the impeller outlet.
As can be seen from Figure 6a, at 0 T, as the monitoring blade started to leave the tongue, the cavitation clouds developed on the tongue again, upon which the blocking of the flow passage caused by the cavitation cloud structure downstream was the most obvious. Then, at 1/4 T, as the blade was leaving the tongue, an attached cavitation cloud was formed on the tongue, and somewhat dissociated into two asymmetrical parts. At 1/2 T, the tongue was in the middle of the passage outlet, and the cavitation clouds had appeared at the head of the tongue. At 3/4 T, as the trailing edge of the next blade approached the tongue gradually, the untouched cavitation cloud was similar to the U-type vortex on a single hydrofoil, which results from the re-entrant jet. At 1 T, the blade just passed the location of the tongue, and newly attached cavitation can be seen on the front edge, while the previous cavitation cloud collapsed rapidly or moved downstream. The intense turbulence caused by the cavitation greatly interfered with the exchange of energy at the wake region, and the low-pressure area expended. With the shedding of the cavitation cloud, the cross section near the tongue changed dramatically, which caused large energy loss in the volute. When the blade was close to the position of the tongue, vapor appeared on both sides of the tongue. Meanwhile, the cavitation cloud was asymmetrical: the cavitation was weaker on the side near the front shroud of the impeller, while the volume fraction of the vapor near the back shroud of the impeller was larger. When the tongue is in the middle of the trailing edge of two adjacent blades, the effect of rotor–stator interference on the cavitation cloud declined significantly. At this moment, the cavitation structure near the tongue was close to that on a single airfoil, and several typical cavitation patterns on the airfoil also emerged at the tongue.
Figure 6b shows the velocity distribution in the 1/6 cycle on the middle surface within the impeller. It can be seen that the velocity distribution is uniform in the impeller at overload conditions. Serious flow separation emerged around the tongue, which motivated the cavitation inception. At the off-design conditions, a detached, unsteady vortex appeared near the tongue, and the unsteady vortex was an important source of vibration and noise. At 0 T, a low-velocity secondary flow area occupied nearly 1/2 the channel at the downstream of the tongue. The cavitation clouds developed rapidly and squeezed the flow cross section, so the flow velocity outside the cavitation clouds increased at the tongue. At 1/4 T, as the cavitation cloud shed, the blocked passage was partially released and the low-velocity area shrunk, the vortex moved downstream, and the flow area was divided into the main flow and backflow region. At 1/2 T, the velocity distribution varied little, but the vortex intensity within the vapor increased. At 3/4 T, the center of the vortex moved further downstream. The previous cavitation clouds flowed downstream and formed the cavitation wake. At 1 T, a second vortex core appeared and activated the cavitation cloud with a relatively high volume fraction of vapor.
Figure 6c shows that, at 0 T, as the blade just left the range of observation, a large area of cavitation emerged in the front of the volute tongue. At 1/4 T, the next blade just appeared, and the cavitation cloud expanded rapidly and shed. At 1/2 T, the cavitation turned up at the leading edge as the blade approached the tongue. At 3/4 T, the blade was located just near the location of the tongue, and the cavitation cloud acted as attached cavities on the surface. At 1 T, as the blade just left the tongue and moved downstream, the blocking of the flow passage was caused by the cavitation cloud structure downstream. Compared with the simulation results, it seems that the cavitation clouds captured with high-speed photography did not attach to the wall surface, and the cavitation wake was not apparent in the shooting window. In the period of the 1/6 cycle, the cavitation structure changed little, and only when the trailing edge of the blade was closest to the tongue had the separated layer of the cavitation clouds formed.

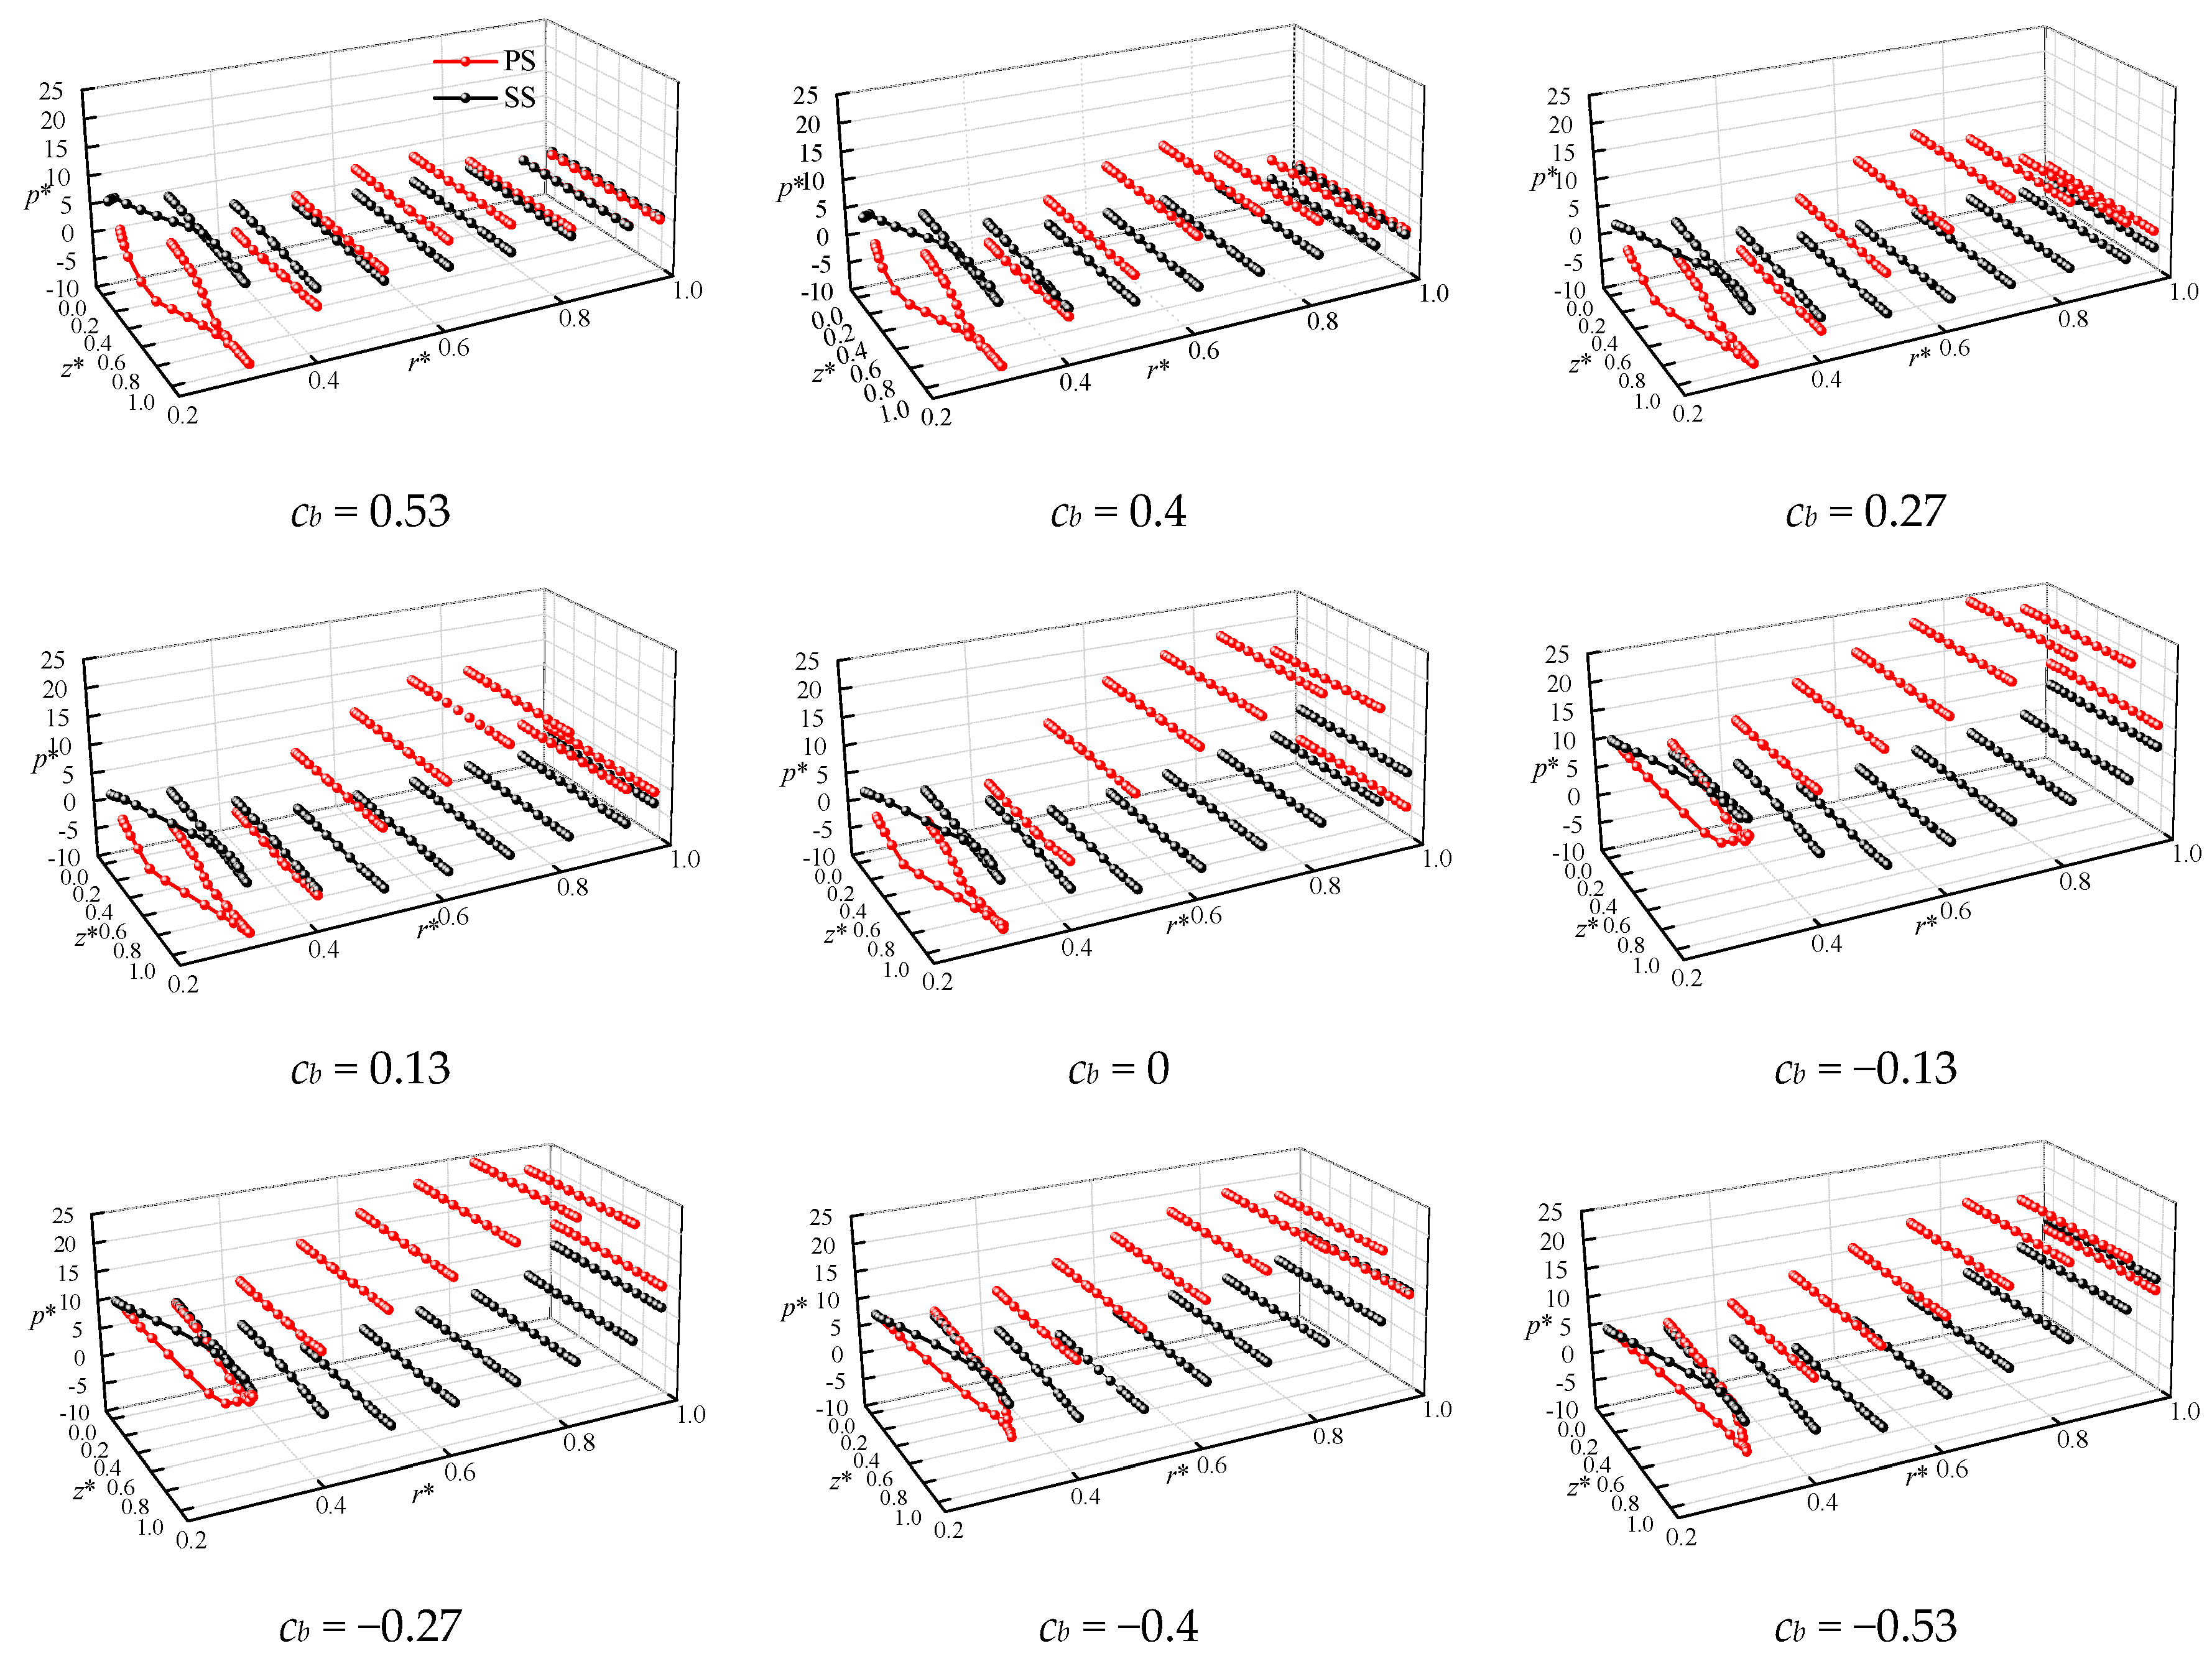
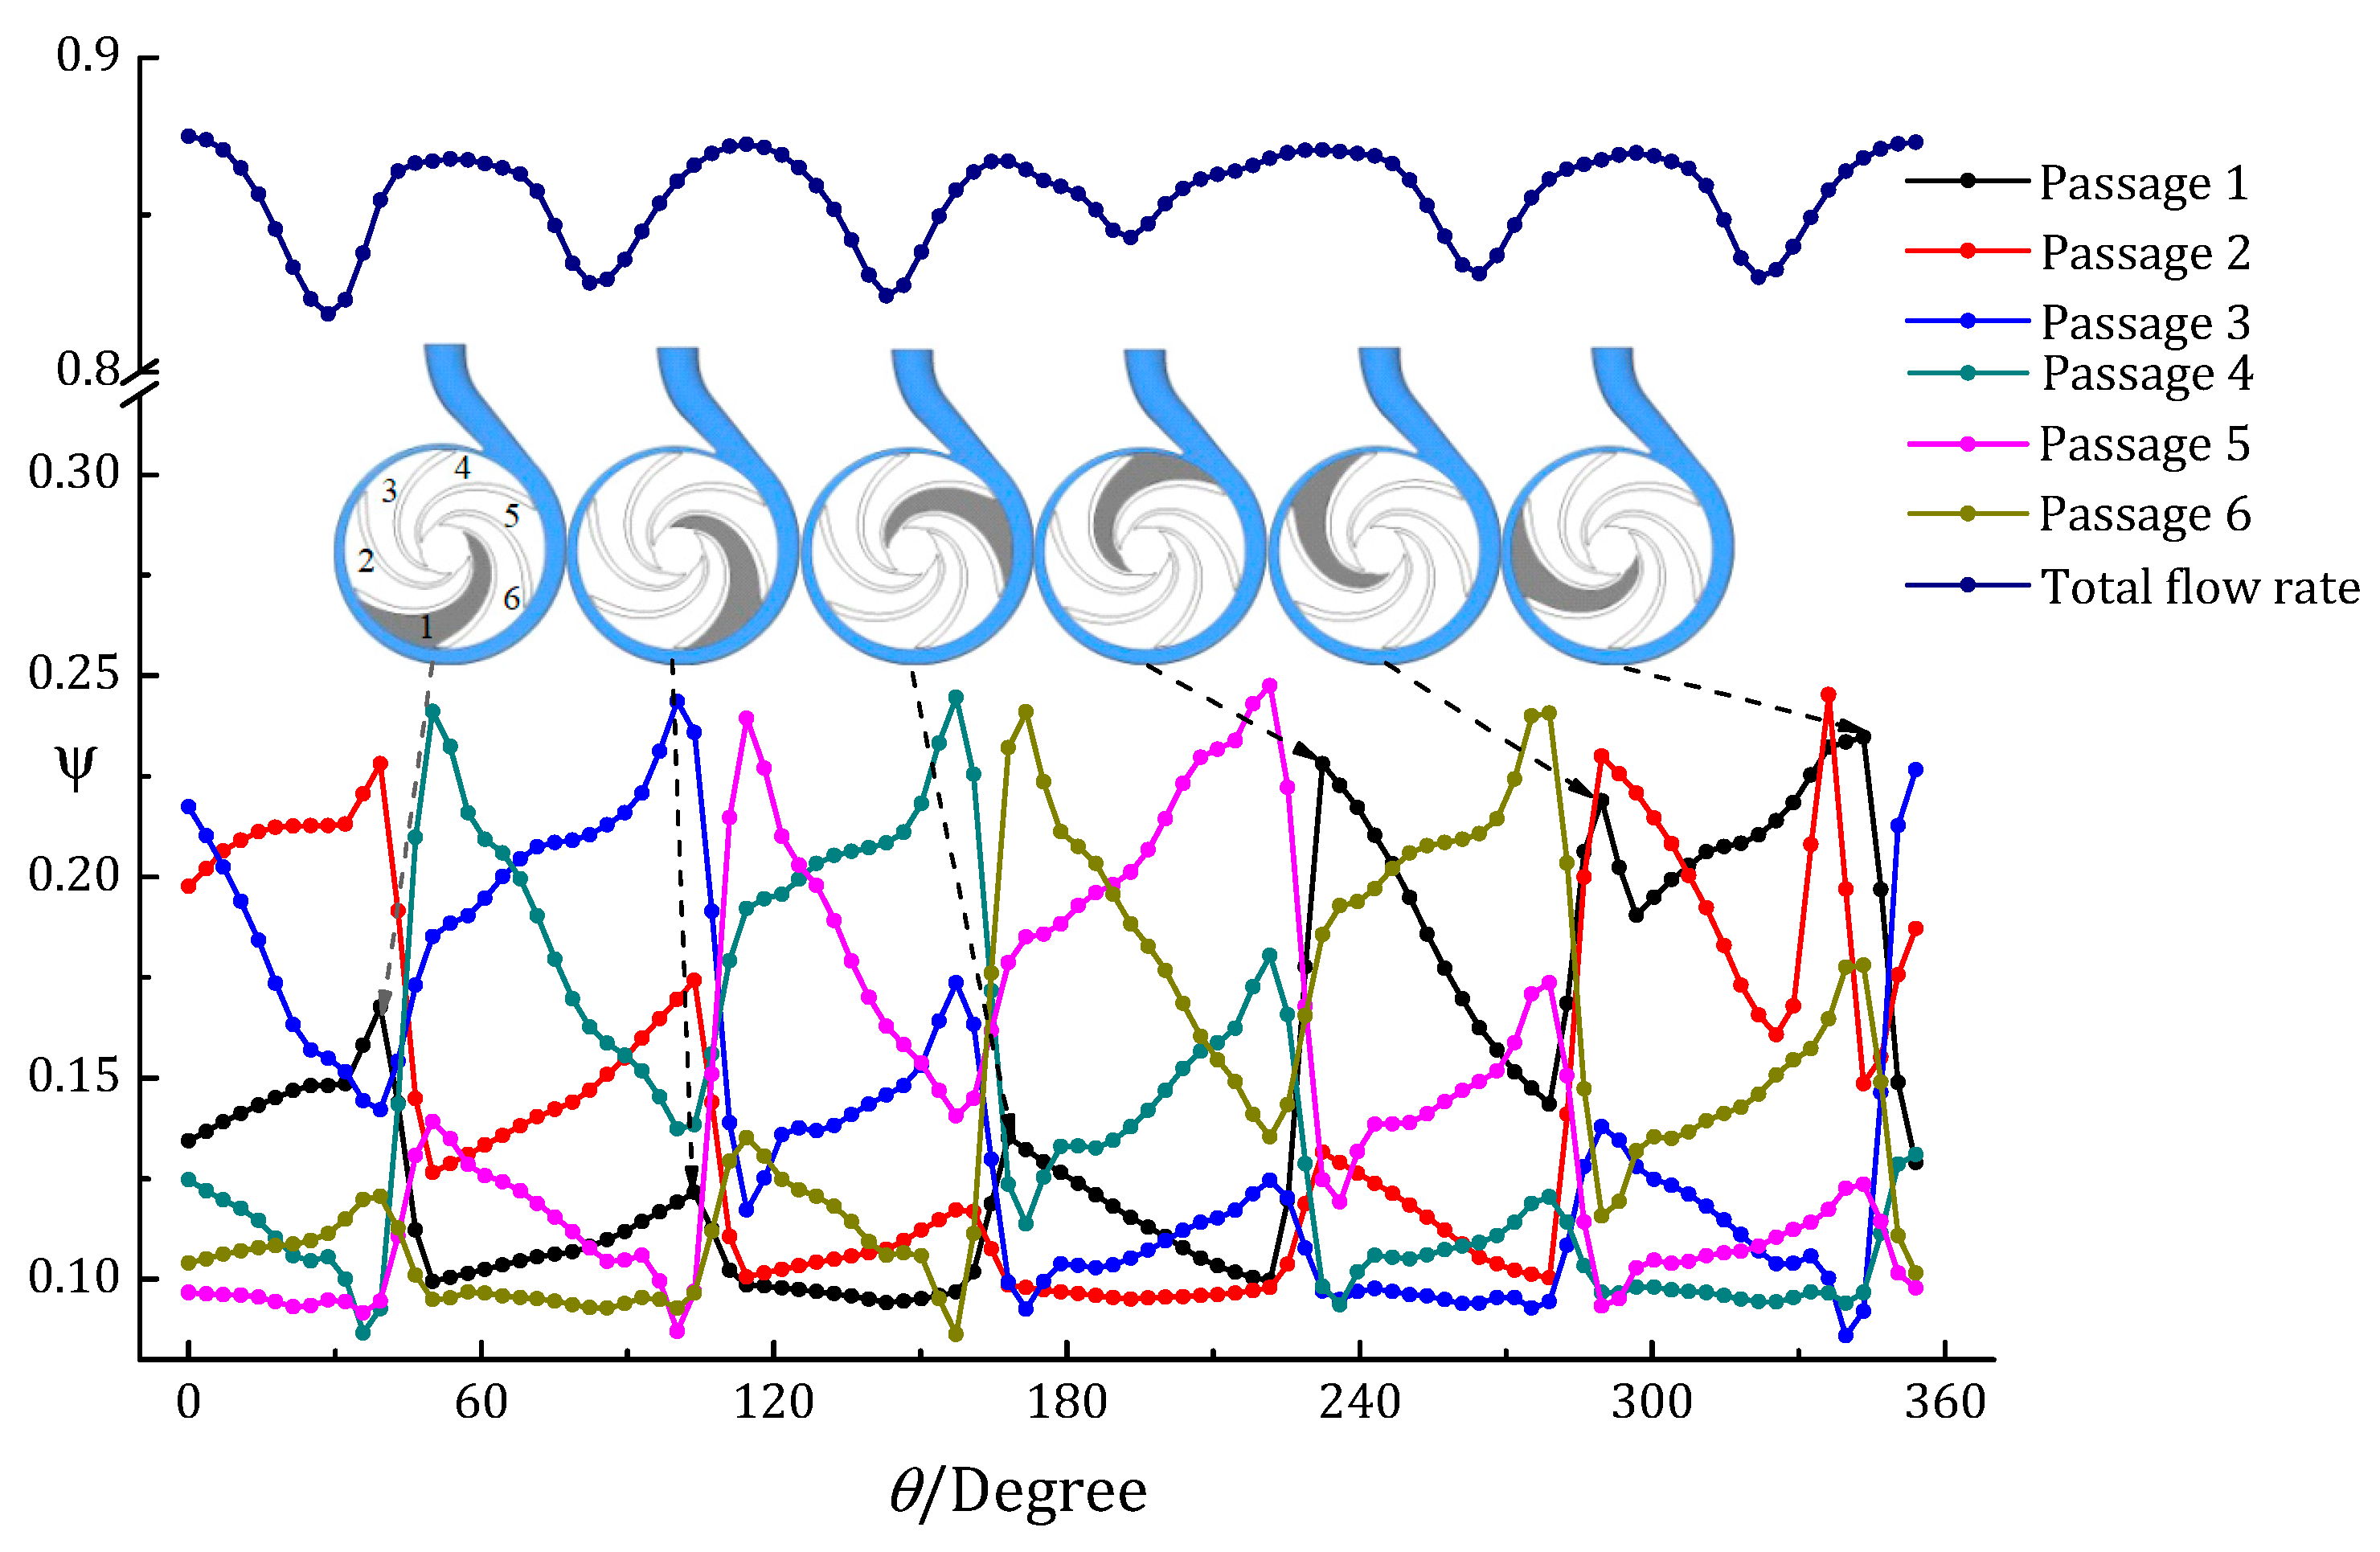
5.2. Blade-Loading Distribution

In this study, the unsteady force on the blade of a traditional centrifugal pump was used as a strong correlation coefficient, using the space between the upstream blade outlet and the tongue. This correlation coefficient was utilized to investigate the influences of cavitation at the tongue on blade loading under high-flow rates, especially the influences of dynamic and static interferences. The distance from the outlet of the blade pressure side and the tongue is defined as the interference distance of the separation tongue and is expressed as
c b = α * Z / 360
where α is the included angle between the outlet of the blade pressure side and the leading edge of the separation tongue, and Z is the number of blades.
The radial distance coefficient (r*), axial distance coefficient (z*), and blade-load coefficient (p*) are defined as follows:
r * = r i / R
z * = z i / Z i
p * = 2 ( p i p i n ) / ρ U 2
where ri is the distance from the monitoring point to the rotation shaft of the impeller, R is the outer diameter of the impeller, zi is the axial distance from the monitoring point to the back shroud, Zi is the axial distance from the force-bearing point to the back shroud, pi refers to the outlet static pressure at the force-bearing point, and U denotes the inlet velocity of the pump.
The blade loading close to the tongue is shown in Figure 7. The blade loading of the centrifugal pump is unsteady due to the asymmetry of the volute. The pressure difference between the pressure and suction side of the blades increased gradually as the upstream blade approached the tongue, whereas it decreased gradually when the blade left the volute and moved downward. The static pressure at the SS inlet of the upstream blade was higher than the corresponding PS (the blue arrow at cb = 0.53). This phenomenon disappeared when the flow passage left the tongue, indicating that a low-pressure zone was developed at the PS inlet of the flow passage in the tongue under Q/Qd = 1.52. Under a high-flow rate, the low-pressure zone in the centrifugal pump occurred at the leading edge of the SS. As shown in Figure 6, the cavitation at the tongue squeezed the flow area at the outlet of the corresponding flow passage of the tongue, thereby causing a huge growth in the flow rate of the fluid at the impeller outlet. Consequently, the flow rate at the impeller inlet increased, forming a local high-speed region near the PS outlet. The cavitation structure on the tongue quickly generated and collapsed as the blade passed the tongue, thereby decreasing the squeezing effect and the flow rates at the passage outlet and inlet. However, the pressure difference decreased significantly at cb = −0.13, which was mainly attributed to the transport inertia of the fluid.
The power capability of the rotating blades of the impeller is unsteady. The pressure difference first increases and then decreases when 0.3 < r* < 1, and the main power area of the blade was in the interval of 0.3 < r* < 0.9. At cb = 0.53, the blocking effect of the cavities at the tongue was evident and seriously disturbed the energy exchange at the impeller. The blade mostly lost its influences on the fluid. The working capability of the impeller increased gradually when the blade approaches the tongue. The maximum pressure difference between the pressure and suction side of the blades was achieved at cb = −0.13 and −0.27. The power capability of the blades declined gradually.
The relationship between the flow-field distribution at the leading edge of the tongue and the flow rate at the impeller outlet was studied, and the flow coefficient was defined as
ψ = q / Q
where q refers to the mass flow rate at the outlet of each impeller passage, and Q refers to the mass flow rate at the inlet of the pump model.
The changes in the outlet flow rate of the different passages in the impeller under Q/Qd = 1.52 at cavitation conditions are shown in Figure 8. The outlet flow rate distribution of the impeller is positively related to the blade-passing frequency. A regular distribution is found in the passage of the single cycle when the pump operates under the designed working conditions. Under an extremely large flow rate, the flow distributions vary significantly between the different passages although the total outlet flow rate of the impeller is highly correlated with the blade-passing frequency. At the moment of wave peak, the tongue is located at the middle of the two adjacent blades. At the moment of wave valley, the blade sweeps the tongue. Combining the peak value and the corresponding passage position shows a relatively high outlet flow rate of the impeller when the passage sweeps the tongue, and the valley of the outlet flow rate is found. Although the leakage losses at the impeller ring and front and back pump cavities are neglected, as secondary flow (e.g., inlet backflow, passage vortex, and axial vortex) exists in the impeller, the sum of the coefficients at the outlet of the impeller in the centrifugal pump are kept lower than 0.9.

6. Conclusions

This study was carried out to observe the cavitation evolution in the volute of a centrifugal pump at overload conditions based on computational calculations and experiments. Unsteady cavitation evolution was investigated to connect it with the blade-loading distribution and flow-rate variation of each passage. The following are several findings of this investigation:
(1) At large flow rates, the unsteady shedding of the separated vortex lowers the local static pressure around the tongue, which triggers the cavitation inception. The cyclical change of the flow states in the volute, as well as the periodic cavitation, are caused by the pressure difference between the suction and pressure surface and the wake at the impeller outlet.
(2) When unsteady cavitation appears near the tongue, the blade-loading distribution on each blade has different characteristics. As the frequency of the vapor cloud shedding is the same as the blade-passage frequency, the variation cycle of the blade loading corresponds to the blade passage frequency. The differential pressure between both sides of the blades increases gradually as the upstream blade approaches the tongue, whereas it decreases gradually when the blade leaves the volute and moves downward.
(3) Under an extremely large flow rate, the flow distributions vary significantly between different passages although the total outlet flow rate of the impeller is highly correlated with the blade-passing frequency. At the moment of wave peak, the tongue is in the middle of the passage. At the moment of wave valley, the blade sweeps the tongue.

Author Contributions

Conceptualization, H.Q. and S.W.; methodology, H.Q. and Y.Y.; software, C.W.; Y.Y.; formal analysis, H.Q.; writing—original draft preparation, H.Q.; writing—review and editing, Y.Y. and S.W.; supervision, S.W.; investigation (performing the experiments), S.Y. All authors have read and agreed to the published version of the manuscript.

Funding

This research received no external funding.

Institutional Review Board Statement

Not applicable.

Informed Consent Statement

Not applicable.

Data Availability Statement

Not applicable.

Acknowledgments

This work was supported by National Natural Science Foundation of China: Research on unsteady flow and energy characteristics of gas-liquid two-phase multi-stage pump (51979138); Water Conservancy Science and Technology Project of Jiangsu Province: Research on integration and optimization of new technology of agricultural irrigation pumping station system (2019038).

Conflicts of Interest

The authors declare no conflict of interest.

References

  1. Brennen, C.E. Hydrodynamics of Pumps; Concepts ETI and Oxford University Press: Oxford, UK, 2011. [Google Scholar]
  2. Hofmann, M.; Stoffel, B.; Friedrichs, J. Similarities and geometrical effects on rotating cavitation in two scaled centrifugal pump. In Proceedings of the Fourth International Symposium on Cavitation, Pasadena, CA, USA, 20–23 June 2001. [Google Scholar]
  3. Murayama, M.; Yoshida, Y.; Tsujimoto, Y. Unsteady Tip Leakage Vortex Cavitation Originating from the Tip Clearance of an Oscillating Hydrofoil. ASME J. Fluids Eng. 2006, 128, 421–429. [Google Scholar] [CrossRef]
  4. Zan-Ao, H.U.; Wang, J.X. Effect of Blade Perforation on Centrifugal Pump Cavitation Characteristics. J. Eng. Therm. Energy Power. 2018, 33, 10. [Google Scholar]
  5. Liu, H. Effects of Blade Number on Characteristics of Centrifugal Pumps. Chin. J. Mech. Eng. 2010, 6, 742–747. [Google Scholar] [CrossRef]
  6. Philippe, D.; Tomoyoshi, O. Cavitating Flow Calculations in Industry. Int. J. Rotating Mach. 2003, 9, 163–170. [Google Scholar]
  7. Hattori, S.; Kishimoto, M. Prediction of cavitation erosion on stainless steel components in centrifugal pumps. Wear 2007, 265, 1870–1874. [Google Scholar] [CrossRef]
  8. Zhang, D.S.; Shi, W.D. Numerical and experimental investigation of tip leakage vortex trajectory and dynamics in an axial flow pump. Comput. Fluids. 2015, 112, 61–71. [Google Scholar] [CrossRef]
  9. Kim, K.H.; Franc, J.P. Advanced Experimental and Numerical Techniques for Cavitation Erosion Prediction; Springer: Dordrecht, The Netherlands, 2014. [Google Scholar]
  10. Maklakov, D. Cavitation flow past an arbitrarily-shaped airfoi. Fluid Dyn. 1995, 30, 713–716. [Google Scholar] [CrossRef]
  11. Fu, Q.; Zhang, F.; Zhu, R.S. A systematic investigation on flow characteristics of impeller passage in a nuclear centrifugal pump under cavitation state. Ann. Nucl. Energy 2016, 97, 190–197. [Google Scholar] [CrossRef]
  12. Dumitrescu, H.; Cardos, V. Analysis of leading-edge separation bubbles on rotating blades. J. Aircr. 2010, 47, 1815–1819. [Google Scholar] [CrossRef]
  13. Rudolf, B.; Bernd, S.; Matevz, D. Unsteady cavitation at the tongue of the volute of a centrifugal pump. J. Fluids Eng. 2010, 132, 6. [Google Scholar]
  14. Al-Obaidi, A.R. Investigation of effect of pump rotational speed on performance and detection of cavitation within a centrifugal pump using vibration analysis. Heliyon 2019, 5, e01910. [Google Scholar] [CrossRef] [Green Version]
  15. Wang, C.; Zhang, Y.X.; Yuan, Z.Y. Development and application of the entropy production diagnostic model to the cavitation flow of a pump-turbine in pump mode. Renew. Energy 2020, 154, 774–785. [Google Scholar] [CrossRef]
  16. Dular, M.; Bachert, R.; Sirok, B. Transient simulation, visualization and PIV-LIF measurements of the cavitation on different hydrofoil configurations. Stroj. Vestn. 2005, 51, 13–27. [Google Scholar]
  17. Qiu, C.; Huang, Q.; Pan, G. Numerical simulation of hydrodynamic and cavitation performance of pumpjet propulsor with different tip clearances in oblique flow. Ocean. Eng. 2020, 209, 107285. [Google Scholar] [CrossRef]
  18. Xia, C.Z.; Cheng, L.; Shang, Y.N. Numerical simulation on the cavitation of waterjet propulsion pump. IOP Conf. Ser. Mater. Sci. Eng. 2016, 129, 012011. [Google Scholar] [CrossRef] [Green Version]
  19. Yang, Y.; Zhou, L.; Hang, J. Energy characteristics and optimal design of diffuser meridian in an electrical submersible pump. Renew. Energy 2021, 167, 718–727. [Google Scholar] [CrossRef]
  20. Yang, Y.; Zhou, L.; Shi, W. Interstage difference of pressure pulsation in a three-stage electrical submersible pump. J. Pet. Sci. Eng. 2020, 196, 107653. [Google Scholar] [CrossRef]
  21. Yang, Y.; Zhou, L.; Zhou, H. Optimal Design of Slit Impeller for Low Specific Speed Centrifugal Pump Based on Orthogonal Test. J. Mar. Sci. Eng. 2021, 9, 121. [Google Scholar] [CrossRef]
  22. Jiang, J.; Li, Y.H.; Pei, C.Y. Cavitation performance of high-speed centrifugal pump with annular jet and inducer at different temperatures and void fractions. J. Hydrodyn. 2019, 31, 93–101. [Google Scholar] [CrossRef]
  23. Jain, S.V. Experimental Investigations of Cavitation Characteristics of Pump Running in Turbine Mode. J. Energy Eng. 2017, 143, 1–12. [Google Scholar] [CrossRef]
  24. Wang, J.; Wang, Y.; Liu, H.; Huang, H. An improved turbulence model for predicting unsteady cavitating flows in centrifugal pump. Int. J. Numer. Methods Heat Fluid Flow 2015, 25, 1198–1213. [Google Scholar] [CrossRef]
  25. Liu, J.T.; Liu, S.H.; Wu, Y.L. Numerical investigation of the hump characteristic of a pump–turbine based on an improved cavitation model. Comput. Fluids 2012, 68, 105–111. [Google Scholar] [CrossRef]
  26. Hu, Q.; Yang, Y.; Cao, W. Computational analysis of cavitation at the tongue of the volute of a centrifugal pump at overload conditions. Adv. Prod. Eng. Manag. 2020, 15, 295–306. [Google Scholar] [CrossRef]
  27. Zwart, P.J.; Gerber, A.G.; Belamri, T. A two-phase flow model for predicting cavitation dynamics. In Proceedings of the Fifth International Conference on Multiphase Flow, Yokohama, Japan, 30 May–3 June 2004. [Google Scholar]
Figure 1. 2D hydraulic assembly sketch.
Jmse 09 00446 g001
Figure 2. Grid independence verification.
Jmse 09 00446 g002
Figure 3. Schematic of the mesh.
Jmse 09 00446 g003
Figure 4. Test bed: (a) the test stand; (b) the testing diagram.
Jmse 09 00446 g004
Figure 5. Test and experiment results of the model pump.
Jmse 09 00446 g005
Figure 6. Cavitation around the tongue.
Jmse 09 00446 g006
Figure 7. Blade−loading distribution.
Jmse 09 00446 g007
Figure 8. Flow rate variation of each passage.
Jmse 09 00446 g008
Table 1. Main parameters of the model pump.
Optimal Flow Rate Qd (m3/h)10
Designed Head H (m)11
Rated Revolution n (r/min)1450
Rated Power P (kW)3
Impeller Outer Diameter D2 (mm)192
Impeller Inlet Diameter D1 (mm)54
Impeller Hub Diameter dh (mm)20
Impeller Outlet Width b2 (mm)5
Blade Outlet Angle β227.5
Table 2. Calculation process of the uncertainties.
NotationNoteQ (m3/h)H (m)
Test number115.2810.75
215.2910.79
315.2310.86
415.2510.96
515.2710.97
615.1010.96
715.1411.00
815.1910.97
Random uncertaintyAverage value15.21910.908
Standard deviation0.06940.0947
eR (%)0.3790.723
System uncertaintyMeasurement accuracy (%)0.250.2
eS (%)0.1440.115
Overall uncertaintye (%)0.4050.741
Publisher’s Note: MDPI stays neutral with regard to jurisdictional claims in published maps and institutional affiliations.

