Abstract
Seamounts are ubiquitous topographic units in the global ocean, and their effects on local circulation have attracted great research attention in physical oceanography; however, fewer relevant efforts were made on geological timescales in previous studies. The Caiwei (Pako) Guyot in the Magellan Seamounts of the western Pacific is a typical seamount and oceanographic characteristics have been well documented. In this study, we investigate a sediment core by geochronological and geochemical studies to reveal a topography-induce surface-to-bottom linkage. The principal results are as follows: (1) Two magnetozones are recognized in core MABC–11, which can be correlated to the Brunhes and Matuyama chrons; (2) Elements Ca, Si, Cl, K, Mn, Ti, and Fe are seven elements with high intensities by geochemical scanning; (3) Ca intensity can be tuned to global ice volume to refine the age model on glacial-interglacial timescales; (4) The averaged sediment accumulation rate is ~0.73 mm/kyr, agreeing with the estimate of the excess 230Th data in the upper part. Based on these results, a proxy of element Mn is derived, whose variability can be correlated with changes in global ice volume and deep-water masses on glacial-interglacial timescales. This record is also characterized by an evident 23-kyr cycle, highlighting a direct influence of solar insolation on deep-sea sedimentary processes. Overall, sedimentary archives of the Caiwei Guyot not only record an intensified abyssal ventilation during interglaciations in the western Pacific, but also provide a unique window for investigating the topography-induced linkage between the upper and bottom ocean on orbital timescales.
1. Introduction
Seamounts on the ocean floor are the most abundant volcanoes on the Earth and their origination is geologically and geochemically similar to ocean island basalts [1]. Seamount evolution is directly associated with mantle dynamics [1,2]. Their existence can significantly shape abyssal topography and induce development of marine ferromanganese crusts and nodules [3,4,5], resulting in changing ocean currents, and likely playing an important role in global climate changes [6,7,8,9]. Hence, documenting details of sedimentary evolution of seamounts is critical to understand the topography-induced processes and the formation and mechanism of mineral resources on the ocean floor.
There are about 50,000 seamounts discovered in the Pacific Ocean, and more than 8000 are higher than 1000 m. As one of key seamounts, Magellan Seamounts, including the Caiwei (Pako), the Vlinder, and the Loah, are located in the western Pacific (Figure 1). Their spatial distribution is like a northwestward chain, which migrated from the southern Pacific (French Polynesia) to the present region [10,11].
Within the Magellan Seamounts, the Caiwei is a deep-sea guyot with the Caiqi in the southwest (Figure 1), and was formed by large-scale eruption of hot spots during 120–90 Ma [1,2,12]. The top water depth of the Caiwei Guyot is ~1500–1600 m, and the base is ~5500 m depth, with a slope of ~20°–30°. The sediments on the guyot are mainly cobalt-rich crusts, carbonate rocks, and/or calcareous pelagic deposits [13,14,15]. The Caiwei Guyot has been extensively surveyed in terms of mineral resources and megafaunal community [16,17] and microorganisms [18,19,20]. For example, cobalt-rich crusts on the guyot were found in the northeast [13]; furthermore, organic matters were supposed to be the main controlling factor in bioturbation around the guyot [19]. Moreover, since the Caiwei Guyot is located at the main path of the Antarctic bottom water (AABW) and the Lower Circumpolar Deep Water (LCDW) to the north Pacific [21,22], the oceanographic setting is clockwise, and flows around the seamount and a Taylor column phenomenon above the seamount produced by an anti-cyclonic eddy in mesoscale to submesoscales [23,24]. Because of these oceanographic settings, similar hydrochemical properties, such as salinity, pH value, and nitrate, are observed between the top and the base of the seamount [18].

Figure 1.
Schematic map showing the study area and oceanographic setting. The flow passing through the seamount and a Taylor column was observed based on the data obtained by the conductivity temperature and depth instrument (CTD) and mooring system [23,24]. Three sites were referenced in the study: site MAMC–07 (154.92° E, 16.08° N, 5,778 m water depth; 0.50 mm/kyr), and MABC–18 (154.79° E, 16.22° N, 5,644 m; 0.55 mm/kyr) [19], and site MABC–05 (155.40° E, 16.17° N, 5,840 m) [25]. All the flows were modified from previous studies [21,24,26]. The base map data was generated using the open and free software DIVA–GIS 7.5 (http://www.diva-gis.org/).
These published results extend our understanding of sedimentology and biology in this unique deep-sea environment. However, without geochronology, the evolution of various paleoenvironmental processes and the topography-induced effects are difficult to be testified on geological timescales. This case is evident not only in the Caiwei Guyot but also in other seamounts on the Earth. Therefore, palaeoceanographic and paleoclimatic studies are necessary to be conducted in seamounts to testify various hypotheses. In this work, integrated by paleomagnetic and geochemical measurements, we studied a sediment core collected from the base of the Caiwei Guyot. A geochronological framework was established by magnetostratigraphy and tuning calcium (Ca) intensity to changes in global ice volume, and a manganese (Mn)-based proxy of deep-sea ventilation in the study area was derived. Based on these records, the evolution and forcing mechanism of the deep-sea environment in such a typic seamount during the middle Pleistocene were discussed.
2. Materials and Methods
2.1. Core MABC–11
The studied core, MABC–11 (155.53° E, 15.22° N, 5840 m water depth), was collected from the eastern base of the Caiwei Seamount during the DY27 cruise of the R/V Haiyang Liu Hao in July, 2012, by using a box corer, with a core length of 59 cm. Based on changes in the excess 230Th of the sediments, it is estimated that the sediment accumulation rate (SAR) for 5–22 cm depth interval is ~0.63 mm/kyr, with an organic carbon content of 0.24% in core MABC–11 [19].
2.2. Magnetic Measurements
Paleomagnetic samples of core MABC–11 were collected using nonmagnetic plastic U-channels (2 cm × 2 cm × 150 cm). Since the upper part was collected for biological study on board [18] and sediment loss in cutting, 47 cm of sediment (11–58 cm in depth) of the core was sampled for paleomagnetic investigation in this study. All U-channel samples with a 1-cm measuring interval were subjected to stepwise alternating field (AF) demagnetization up to a peak field of 90 mT (13 steps). The natural remanent magnetization (NRM) was measured using a three-axis cryogenic magnetometer (2G Enterprise Model 755, USA) installed in a magnetically shielded room (residual fields < 300 nT) at the Key Laboratory of Muddy Coastal Geo-Environment of the Tianjin Center. Characteristic remanent magnetization (ChRM) directions were determined using a principal component analysis [27] implemented by the PuffinPlot package [28], with at least six consecutive demagnetization steps and with a maximum angular deviation (MAD) of less than 10°.
Rock magnetism measurements were conducted on four representative specimens to characterize magnetic minerals in the core. Hysteresis loop and first-order reversal curve (FORC) analyses were conducted using a Princeton Measurements Inc. MicroMag 3900 Vibrating Sample Magnetometer (VSM) at the Institute of Geology and Geophysics, Chinese Academy of Sciences. For hysteresis loops, a peak field of 0.5 T was used, and saturation magnetization (Ms), saturation remanence (Mrs), coercive force (Bc), and the coercivity of the remanence (Bcr) were determined from the hysteresis loops [29], after being corrected using the data between 0.4–0.5 T. Setting a peak field of 1.0 T and an interval of 3.2 mT, FORC diagrams (125 lines) were produced using FORCme software with a smoothing factor of 3.
2.3. Chemical Scanning
The X-ray fluorescence (XRF) scanning allows nondestructive and continuous element analyses of sediment cores [30], which has been used for high-resolution climatic reconstructions of various types of sediments and various timescales (e.g., [31,32,33,34]). To achieve paleoenvironmental information, the chemical scanning of core MABC–11 was carried out for a depth interval of 6.6–51.3 cm at 1 mm resolution using the Itrax XRF core scanner at the Second Institute of Oceanography, Ministry of Natural Resources of China, setting count times at 10 s, with 30 kV of X-ray voltage and an X-ray current of 45 mA. Elemental intensities are obtained and given in counts per second (cps), which can be used as estimates of relative concentration (ratio) by dividing the total cps value for each point.
3. Results and Analyses
3.1. Magnetic Properties and Magnetostratigraphy
Rock magnetic analysis shows that hysteresis loops are closed below 150 mT (Figure 2a–d), with Bc, Bcr, and Mrs/Ms of 14–16 mT, 30–40 mT, and ~0.28, respectively, reflecting that magnetic grains in the sediments are mainly in a pseudo-single domain (PSD) range or close to the single domain (SD) range [35]. The specimens may consist of a mixture of different magnetic minerals with variable grain sizes and contents, and thereby, the methods of partitioning hysteresis loops can be used to investigate the coercivity distributions [29]. After mathematical unmixing magnetic components by using the normal function [36,37], a three-humped distribution was observed, and their coercivities are 6–7 mT, 31–35 mT, and 84–98 mT, respectively (Figure 2e–h). FORC diagrams exhibit little vertical spread of the contours (Figure 2i–l), which indicates that magnetostatic interactions are negligible, and the bulk of the coercivity distribution lies in the 10–50 mT range, with peaks at ~20 mT. Integrating all these evidences, it is inferred that the dominant magnetic mineral is low-coercivity magnetite, which is consistent with analyses of magnetic minerals of core MABC–05 [25].
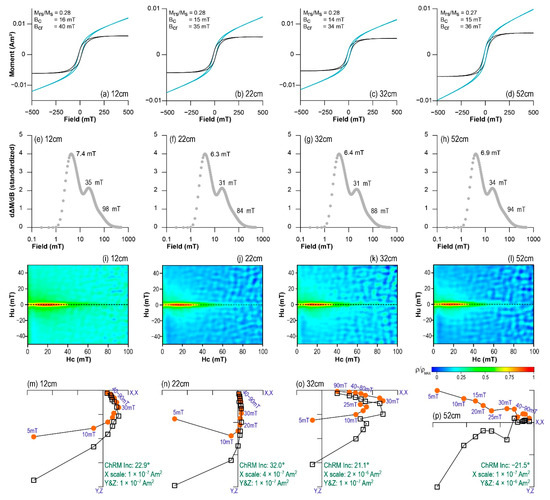
Figure 2.
Magnetic properties of core MABC–11. (a–d) Hysteresis loops (blue line, uncorrected curve; black line, corrected curve); (e–h) Unmixing of the second derivate of hysteresis loop data to show coercivity components; (i–l) First-order reversal curve (FORC) diagrams; (m–p) Orthogonal diagrams of the stepwise alternating field (AF) demagnetization. Due to the 5–10 times higher relative to AF at RM5mT, the natural remanent magnetization (NRM) points are not shown. Solid (open) circles (squares) represent the vertical (horizontal) plans.
The remanent magnetization (RM) of these samples gradually decreases subject to AF demagnetization. Relative to the RM that subject to 5 mT demagnetization (RM5mT), at ~25 mT, ~50% of RM5mT was removed, and up to a peak field of 80 mT, 90–95% of RM5mT was removed. The stepwise AF behaviors of representative samples are displayed in the form of orthogonal diagrams (Figure 2m–p). The stable ChRM component can be isolated between 20 and 50–90 mT. All specimens produced reliable ChRM directions with the criterion of six continuous AF steps and MAD ≤ 10° (Figure 3c,d).
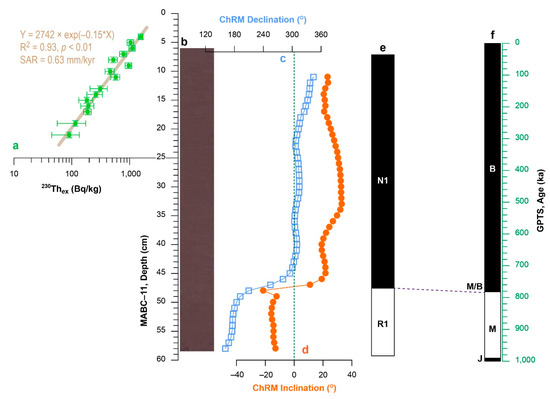
Figure 3.
Magnetostratigraphy of core MABC–11. (a) The excess 230Th data and the estimated sediment accumulation rate (SAR) for the upper part [19]; (b) photo of the core; (c,d) ChRM declination and inclination, respectively; (e) the polarity of core MABC–11 with two identified magnetozones; (f) The geological polarity timescale (GPTS) [38]. B, Brunhes chron; M, Matuyama chron; J, Jaramillo subchron; M/B, the Matuyama/Brunhes boundary (0.781 ka).
Based on these 47 ChRMs, two magnetozones are recognized in core MABC–11 (Figure 3e): one of reversed polarity (R1, 48–58 cm) and one of normal polarity (N1, 11–48 cm). According to the SAR (0.63 ± 0.05 mm/kyr) estimated by the excess 230Th data [19], which is similar with cores MABC–18 and MAMC–07 (Figure 1), the duration of the 11–58-cm intervals of core MABC–11 is about 760 kyr. Taking this estimate as a reference, we correlate the two magnetozones to the geomagnetic polarity timescale (GPTS) [38], namely magnetozone N1 correlating to the Brunhes chron and magnetozone R1 correlating to the Matuyama chron (Figure 3). The Matuyama/Brunhes boundary (781 ka) is then set at 48 cm of core MABC–11, which is close to the extrapolation of the excess 230Th data from the upper part, confirming the reliability of magnetostratigraphy.
3.2. Geochemical Properties and Refining the Age Model
There are seven elements, namely Ca, Si, Cl, K, Mn, Ti, and Fe, identified by XRF scanning, whose intensities are high (Figure 4). Correlation coefficients can be applied to assess inter-element relations. As shown in Table 1, elements K and Si are closely associated, likely inferring terrigenous contribution; element Cl is correlated with Mn, Ti, and Fe, probably indicating sea-water properties (e.g., [32,34]), and element Ca is relatively unrelated with others and may reflect biogenic phases (e.g., [39]). Integrating the above observations, the relative independence of Ca variability is confirmed, and element ratios divided by Ca intensity show a similar inter-element relation (Table 1). Considering previous studies in the western Pacific [34,40,41], it is inferred that aeolian inputs or local erosions, bottom-water masses, and biogenic contribution are the major factors controlling geochemical properties of the sediments on the Caiwei Guyot.
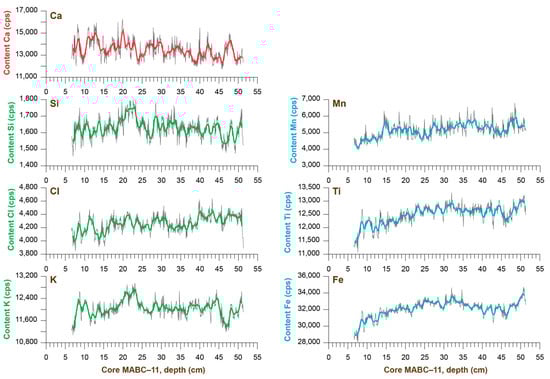
Figure 4.
Changes in seven elements of core MABC–11 with nine-point average curves.

Table 1.
Correlation coefficients between chemical elements.
Carbonate/calcium content in deep-sea sediments is a traditional proxy reflecting biogenic activity and can be employed to refine geochronological models [42,43,44,45,46]. Tuning carbonate/calcium content in the sediments to the global ice volume inferred by the deep-sea benthic δ18O record is based on a clear and consistent relationship between them, which could be locality-specific [47] or somehow inconsistent [48]. For example, many deep-sea carbonate records in the Pacific show that carbonate preservation in the sediments is higher during glacial intervals (‘Pacific style’), while in the Atlantic (‘Atlantic style’), carbonate abundance tends to be higher during interglacial intervals ([47,49] and references therein).
For core MABC–11, the cyclic variability of Ca intensity is evident (Figure 4), and constrained by the paleomagnetic results (Figure 3), these cyclic changes can be generally correlated to the glacial-interglacial variability of the stacked benthic δ18O record of deep-sea sediments (LR04, Figure 5a). This correlation reflects an increase of carbonate preservation during interglacial intervals, which shows a opposite trend to the ‘Pacific style’ but agrees well with the ‘Atlantic style.’ For example, at the Matuyama/Brunhes boundary (0.781 ka), the Ca intensity of core MABC–11 was high, when an interglacial period was identified in the LR04 record. The ‘Pacific style’ of carbonate preservation in deep-sea sediments likely originated from ~1.1 Ma [49], and was possibly resulted from changes in sea-water chemistry but not marine productivity [48]. However, different from other Pacific sites on continental shelves or in oceanic basins usually above the carbonate compensation depth (CCD), typically >3500–4000 m water depth, a seamount system from a modern perspective can be characterized by a close link between ocean surface and bottom [18,24]. The unique locality of the Caiwei Guyot may have enough nutrient and induce productivity during interglaciations. In this case, the influence of marine productivity could not be ignored, and it is reasonable that carbonate preservation became higher during interglacial intervals.
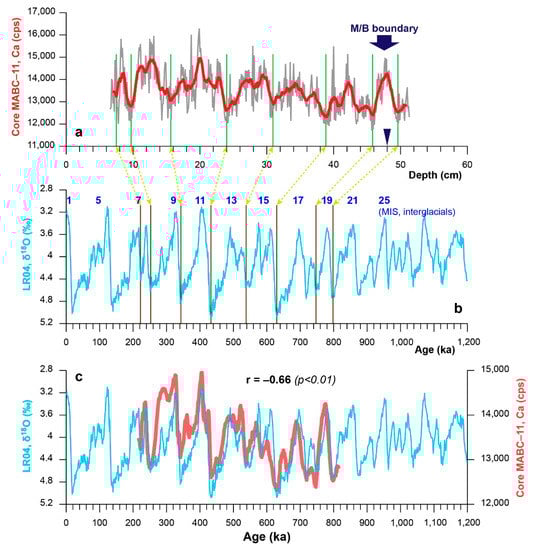
Figure 5.
Tuning Ca intensity of core MABC–11 to LR04 δ18O record. (a) Ca record with the nine-point moving average of core MABC–11. (b) Benthic δ18O stack LR04 [50]; (c) Comparison between Ca and LR04 records on glacial-interglacial timescales.
Hence, Ca intensity in core MABC–11 is employed to refine the age model for palaeoceanographic inferences, taking the Matuyama/Brunhes boundary (781 ka) at 48 cm depth as the tie point (Figure 5c). As a result, low-frequency changes in Ca intensity are well correlated to the LR04 record (r = −0.66, p < 0.01), inferring a consistent glacial-interglacial pattern in the middle Pleistocene. This correlation further provides several age points and yields SARs of 0.4–2.0 mm/kyr during the depositional interval. The average SAR of core MABC–11 is then estimated as ~0.73 mm/kyr in the middle Pleistocene, which is close to the estimate based on the excess 230Th data in the upper part of the core.
4. Discussion
The deep ocean beyond 4000 m water depth, usually below the CCD, is a key point in global circulation in terms of heat, water, and nutrients [22,51]; however, due to technical limitations of monitoring and studying, their roles in regulating Earth’s climate have not been well documented yet. The redox (reduction–oxidation) condition is one of the most important processes, reflecting changes in the deep-ocean environment in oceanology and sedimentology. Element Mn is an effective indicator of marine environment and oceanic water masses [52,53,54], which migrates from reducing to oxidizing environments.
To reduce the influence of element mobility and terrigenous detrital [33], the element ratio of Mn, which divides Mn content by elements such as Si, Cl, K, Ca, Fe, or Ti, are usually used for palaeoceanographic inferences [34]. As shown, all these element ratios covary in a similar manner during the middle Pleistocene (Figure 6), suggesting an inter-elemental agreement. A principal component analysis (PCA) was subsequently performed on these six element ratios to extract the common variance to reflect the redox condition recorded in core MABC–11 (Table 2). As a result, the first principal component (Mn–f1) accounts for 83.76% of the total variance, confirming the consistency between the six elemental ratios. The derived Mn-f1 record exhibits glacial-interglacial variabilities and is also characterized by higher-frequency changes (Figure 6). Thus, this redox record was employed to discuss paleoenvironmental changes in the Caiwei Guyot during the middle Pleistocene.
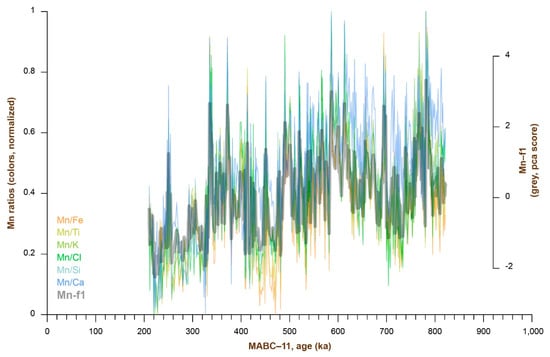
Figure 6.
Element ratios and the first principal component (Mn–f1) of core MABC–11. All ratios were standardized into [0,1] to enable them to be plotted on the same scale (also see Table 2).
Table 2.
Results of the principal component analysis of the element ratios of core MABC–11.
In general, the Mn–f1 record of core MABC–11 can be well correlated with changes in global ice volume, as reflected by the LR04 record [50], as well as the Ca intensity of core MABC–11 (Figure 7). The correlation between elements Mn and Ca of core MABC–11 can reduce uncertainties in the tuned age model, and confirms that the oxidation of bottom-water in the Caiwei Guyot enhanced during interglaciations and weakened during glacial intervals. The good deep-sea ventilation during interglacial intervals is comparable in the western Pacific. For example, in the Mariana Trench, sedimentary Mn intensity of core A25 is higher in a warm state during the mid-Pleistocene climate transition [34], and in the center of the Philippian Sea, sedimentary dynamics of core XT06 are generally strengthened during interglaciations [41].
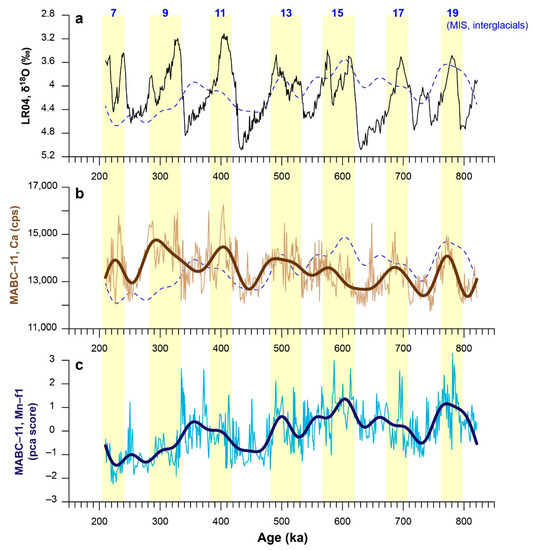
Figure 7.
Abyssal ventilation on glacial-interglacial timescales. (a) Benthic δ18O stack LR04 [50]; (b) MABC–11 Ca record with low-frequency variation (FFT filter, >50 ka); (c) MABC–11 Mn–f1 record with low-frequency variation (FFT filter, >50 ka), see also the dashed lines in (a,b).
Moreover, the inter-basinal gradient of benthic δ13C between the North Atlantic, South Atlantic, and Equatorial Pacific can be employed to largely reflect changes in deep-sea ventilation related to Circumpolar Deep Water (CDW) and North Atlantic Deep Water (NADW) [55,56]. For these benthic δ13C gradients, a similar relationship between deep-sea ventilation and glacial-interglacial alternations can be observed during the Plio-Pleistocene Epochs [55,56]. Therefore, it is inferred that there is a common pattern of deep-to-bottom water evolution between the Atlantic and the western Pacific in the Quaternary, namely, intensified abyssal ventilation during interglaciations and poor ventilation during glacial periods. The anti-phase relationship between deep-ocean ventilation and global ice volume may be linked to a glacial decrease in the deep/bottom-water export [57], which may be the result of the weakened deep-water production and/or enhanced oceanic stratification during glacial periods [55,58,59,60].
In addition, the influence of changes in marine productivity on deep-sea oxidation should be assessed, and due to the very low SAR of core MABC–11 and carbonate dissolution below the CCD level, it is impossible to obtain planktonic δ13C records as usual. Hence, we further compared changes in records of Ca intensity and Mn–f1 and found that the correlation coefficient between them is low (r = −0.18, p < 0.01), confirming that it is appropriate to infer redox conditions at the base of the Caiwei Guyot using the Mn–f1 record of core MABC–11, which could be correlated to the influences of AABW/LCDW in the study area.
Besides the glacial-interglacial variability, the Mn–f1 record of core MABC–11 is also characterized by precessional cycles (Figure 8), while there is no evident 23-kyr cycle in AABW/LCDW proxies, as previously reported during the middle Pleistocene. For example, the inter-basinal gradients of benthic δ13C indicaes changes in NADW/CDW are all dominated by 100-kyr cycles [55,56], with little influence of 40-kyr and 23-kyr cycles (Figure 8d), which is similar in the modeled Antarctic ice volume (Figure 8b). Records of cores XT06 and A25 reflecting changes in AABW/LCDW in the western Pacific [34,41] were dominated by the 100-kyr cycles (Figure 8f). Aeolian inputs are the other factor may influence the sedimentary processes in the western Pacific [61,62], but the dominant cycle is 100-kyr in the Chinese Loess Plateau (Figure 8c), which is the main source of aeolian deposits. Another possible source of precessional variabilities in the Mn–f1 record of core MABC–11 is marine productivity. The planktonic δ13C record of ODP Site 806B in the Equatorial Pacific can be employed to indicate regional marine productivity in general [63], and the 100-kyr cycle is the dominant one (Figure 8c). Moreover, there is little similarity between the Ca intensity and the Mn–f1 record of core MABC–11 in precessional bands (r = 0.14, p < 0.01). Thus, changes in AABW/LCDW, global/Antarctic ice volume, aeolian inputs, and marine productivity are not the source of such an evident 23-kyr cycle in the Mn–f1 record of core MABC–11.
However, changes in Asian monsoon intensity and solar insolation exhibit a similar 23-kyr cycle in dominance (Figure 8e). The SARs of core MABC–11 are too low to compare their variabilities on orbital timescales, because a 1–2 cm hiatus means that a precessional cycle was missed. Even so, the highlighted 23-kyr cycle with an evident half-precessional cycle (~11 kyr; Figure 8b), which is a unique cycle in tropical records [64,65], demonstrates that there should be a close linkage between the upper oceanic changes and the deep-sea ventilation in the Caiwei Guyot.
According to studies of physical oceanography, seamounts can significantly change mixing processes between the upper and lower oceanic layers, by inducing mesoscale vortices and their propagation to the deep ocean [6,66,67,68,69], and thus, they have a great impact on the path and intensity of ocean currents. When ocean currents flow across a seamount, a series of complex responses are generated to modulate local and large-scale circulation [70,71], and the anticyclonic cap is one of the most significant ones [72]. After three years of monitoring, a deep anticyclonic cap over the Caiwei Guyot was found from its bottom up close to the ocean surface [24]. This deep anticyclonic cap may generate a close linkage and yield similar hydrochemical properties between the top and the base of the Caiwei Guyot [18,23].
With reference to this mechanism on daily to monthly timescales, we speculated that on orbital timescales, when solar insolation was high in precessional bands, the upper ocean and air-sea interaction in tropical oceans may be more active, not only strengthening the Asian monsoon intensity [73], but also intensifying tropical cyclone genesis [74]. An active upper ocean could induce anti-cyclonic eddies in mesoscale to submesoscale over the Caiwei Guyot and carry more dissolute oxygen from the upper to the bottom, thus introducing precessional variabilities into sedimentary records. Therefore, we proposed that although mesoscale to submesoscale eddies are phenomena on daily to monthly timescales, by linking the upper and bottom oceanic layers, sedimentary processes in the deep ocean can be significantly influenced on geological timescales. The resultant oxygen-rich deep ocean may change CO2 storage and redistribution of materials and nutrients, which is worthy of further investigation in the future.

Figure 8.
Spectral analyses of various environmental proxies in the middle Pleistocene (210–820 ka). (a) Ca record of core MABC–11 (this study) versus the benthic δ18O stack LR04 [50]; (b) Mn–f1 record of core MABC–11 (dashed and red bold lines, this study), versus the modeled Antarctic ice volume (AIS) [75]; (c) Stack grain size (MGS) and magnetic susceptibility (MS) of the Chinese Loess Plateau [76]; (d) North Atlantic deep water (NADW) inferred from the gradient of δ13C record of ODP Sites 1088 and 1090 [56], versus the planktonic δ13C of western Pacific ODP Site 806 [63], indicating productivity changes; (e) Stalagmite δ18O series [73], indicating Asian monsoon intensity (0–640 ka), versus the 21 July insolation at 65° N [77]; (f) Grain size of core XT06 in the center of the Philippian Sea [41], indicating bottom-water circulation intensity (Figure 1), versus the Mn record of core A25 in the Mariana Trench [34], indicating changes in Antarctic bottom water (AABW, 640–1240 ka). Three rhythms of orbital forcing were labeled on top. All spectrums were conducted using the ARAND software [78] with a lag of 100, and their values were standardized into an interval of [0,1].
5. Conclusions
By integrating magnetostratigraphy and geochemical scanning of the sediments on the Caiwei Guyot, Magellan Seamounts of the Western Pacific, we have established a reliable chronology for a sedimentary sequence and produced a record of deep-sea ventilation during the middle Pleistocene. This sedimentary record reveals a close linkage between the upper and bottom ocean, which we evaluate with reference to several global climate signals. Our main findings are summarized as follows: (1) By stepwise demagnetization, two magnetozones are recognized in core MABC–11, which can be correlated to the Brunhes and Matuyama chrons in the geomagnetic polarity timescale; (2) There are seven elements with high intensities identified by XRF scanning, and aeolian inputs or local erosions, bottom-water masses, and biogenic contribution are the three major factors; (3) By taking the paleomagnetic constraint and tuning the Ca intensity to the global ice volume, the age-depth model of core MABC–11 can be refined, and the averaged sediment accumulation rate is about 0.73 mm/kyr, which agrees well with the estimate of the excess 230Th data in the upper part of the core. Based on these results, a proxy of element Mn is derived, which indicates changes in bottom-water ventilation in the Caiwei Guyot. This record is consistent with changes in global ice volume, the Lower Circumpolar Deep Water, and the North Atlantic Deep Water on glacial-interglacial timescales. It is also characterized by an evident 23-kyr cycle, highlighting a direct and topography-induced influence of solar insolation. Therefore, we conclude that sedimentary archives of the Caiwei Guyot not only record a common pattern of deep-to-bottom water evolution between the Atlantic and the western Pacific during the middle Pleistocene, namely intensified abyssal ventilation during interglacial periods, but also provide a unique window to observe the surface-to-deep linkage and the effects of eddies on daily to monthly timescales accumulative into sedimentary processes on geological timescales.
Author Contributions
Conceptualization and methodology, L.Y.; sample collection, X.D. and H.W.; formal analysis, L.Y., H.Y. (Haifan Yuan), D.X., and H.Y. (Huiqiang Yao); original draft preparation, L.Y. and H.W. All authors have read and agreed to the published version of the manuscript.
Funding
This work was supported by the natural science foundation of Shanghai, grant number 19ZR1459800, the Key special project for introduced talents team of southern marine science and engineering Guangdong laboratory (Guangzhou), grant number GML2019ZD0106, the national programme on global change and air-sea interaction, grant number GASI-04-HYDZ-02, the National Natural Science foundation of China, grant number 41702096, and the COMRA project from China ocean mineral resources R&D association, grant number DY135-N1-1-01.
Institutional Review Board Statement
Not applicable.
Informed Consent Statement
Not applicable.
Data Availability Statement
Data are available on request from the corresponding author (yiliang@tongji.edu.cn).
Acknowledgments
We thank Fu Wang, Lizhu Tian, and Xingyu Jiang in Tianjin Centre, China Geological Survey for their help in magnetic measurements, as well as all onboard crews for collecting samples.
Conflicts of Interest
The authors declare no conflict of interest.
References
- Wessel, P. Sizes and ages of seamounts using remote sensing: Implications for intraplate volcanism. Science 1997, 277, 802–805. [Google Scholar] [CrossRef]
- Wessel, P.; Lyons, S. Distribution of large Pacific seamounts from Geosat/ERS-1: Implications for the history of intraplate volcanism. J. Geophys. Res. Solid Earth 1997, 102, 22459–22475. [Google Scholar] [CrossRef]
- Halbach, P.E.; Jahn, A.; Cherkashov, G. Marine co-rich ferromanganese crust deposits: Description and formation, occurrences and distribution, estimated world-wide resources. In Deep-Sea Mining: Resource Potential, Technical and Environmental Considerations; Sharma, R., Ed.; Springer International Publishing: Cham, Switzerland, 2017; Volume 46, pp. 65–141. [Google Scholar]
- Hein, J.R.; Mizell, K.; Koschinsky, A.; Conrad, T.A. Deep-ocean mineral deposits as a source of critical metals for high- and green-technology applications: Comparison with land-based resources. Ore Geol. Rev. 2013, 51, 1–14. [Google Scholar] [CrossRef]
- Hein, J.R.; Spinardi, F.; Okamoto, N.; Mizell, K.; Thorburn, D.; Tawake, A. Critical metals in manganese nodules from the Cook Islands EEZ, abundances and distributions. Ore Geol. Rev. 2015, 68, 97–116. [Google Scholar] [CrossRef]
- Bograd, S.J.; Rabinovich, A.B.; Leblond, P.H.; Shore, J.A. Observations of seamount-attached eddies in the North Pacific. J. Geophys. Res. Ocean. 1997, 102, 12441–12456. [Google Scholar] [CrossRef]
- Cenedese, C. Laboratory experiments on mesoscale vortices colliding with a seamount. J. Geophys. Res. Space Phys. 2002, 107, 6-1–6-14. [Google Scholar] [CrossRef]
- Herbette, S.; Morel, Y.; Arhan, M. Erosion of a surface vortex by a seamount. J. Phys. Oceanogr. 2003, 33, 1664–1679. [Google Scholar] [CrossRef]
- Herbette, S.; Morel, Y.; Arhan, M. Erosion of a surface vortex by a seamount on the β plane. J. Phys. Oceanogr. 2005, 35, 2012–2030. [Google Scholar] [CrossRef]
- Smith, W.H.F.; Staudigel, H.; Watts, A.B.; Pringle, M.S. The Magellan Seamounts: Early Cretaceous record of the South Pacific isotopic and thermal anomaly. J. Geophys. Res. Solid Earth 1989, 94, 10501–10523. [Google Scholar] [CrossRef]
- Mel’Nikov, M.E.; Pletnev, S.P.; Anokhin, V.M.; Sedysheva, T.E.; Ivanov, V.V. Volcanic edifices on Guyots of the Magellan Seamounts (Pacific Ocean). Russ. J. Pac. Geol. 2016, 10, 435–442. [Google Scholar] [CrossRef]
- Stepashko, A.A. Spreading cycles in the Pacific Ocean. Oceanology 2008, 48, 401–408. [Google Scholar] [CrossRef]
- Zhao, B.; Wei, Z.; Yang, Y.; He, G.; Zhang, H.; Ma, W. Sedimentary characteristics and the implications of cobalt-rich crusts resources at Caiwei Guyot in the Western Pacific Ocean. Mar. Georesour. Geotechnol. 2019, 38, 1037–1045. [Google Scholar] [CrossRef]
- He, G.; Zhao, Z.; Zhu, K. Cobalt-Rich Crust Resources in the Western Pacific; Geological Publishing House: Beijing, China, 2001; p. 92. [Google Scholar]
- Wei, Z.; Deng, X.; Zhu, K.; Yao, H.; Yang, Y.; Ren, J. Characteristic of substrate rocks of Caiwei Seamount in the west Pacific Ocean. Mar. Geol. Front. 2017, 33, 1–6. [Google Scholar]
- Wang, Y.; Zhang, H.; Liu, J.; Zhang, X.; Zhu, B. Abundances and spatial distributions of associated useful elements in co-rich crusts from Caiwei Seamount in Magellan Seamounts. Mar. Geol. Quat. Geol. 2016, 36, 65–74. [Google Scholar]
- Xu, P.; Liu, F.; Ding, Z.; Wang, C. A new species of the thorid genus Paralebbeus Bruce & Chace, 1986 (Crustacea: Decapoda: Caridea) from the deep sea of the Northwestern Pacific Ocean. Zootaxa 2016, 4085, 119–126. [Google Scholar] [CrossRef] [PubMed]
- Liu, Q.; Huo, Y.; Wu, Y.; Bai, Y.; Yuan, Y.; Chen, M.; Xu, D.; Wang, J.; Wang, C.; Xu, X. Bacterial community on a Guyot in the Northwest Pacific Ocean influenced by physical dynamics and environmental variables. J. Geophys. Res. Biogeosci. 2019, 124, 2883–2897. [Google Scholar] [CrossRef]
- Yang, Z.; Qian, Q.; Chen, M.; Zhang, R.; Yang, W.; Zheng, M.; Qiu, Y. Enhanced but highly variable bioturbation around seamounts in the northwest Pacific. Deep. Sea Res. Part I Oceanogr. Res. Pap. 2020, 156, 103190. [Google Scholar] [CrossRef]
- Sun, Q.; Song, J.; Li, X.; Yuan, H.; Ma, J.; Wang, Q. Bacterial vertical and horizontal variability around a deep seamount in the tropical western Pacific Ocean. Mar. Pollut. Bull. 2020, 158, 111419. [Google Scholar] [CrossRef]
- Kawabe, M.; Fujio, S. Pacific Ocean circulation based on observation. J. Oceanogr. 2010, 66, 389–403. [Google Scholar] [CrossRef]
- Talley, L.D. Freshwater transport estimates and the global overturning circulation: Shallow, deep and throughflow components. Prog. Oceanogr. 2008, 78, 257–303. [Google Scholar] [CrossRef]
- Jiang, X. Numerical Study of Flow Passing a Deep Water Seamounts: The Caiwei Seamount in the Northwest Pacific Ocean. Master’s Thesis, Nanjing University of Information Science & Technology, Nanjing, China, 2017. [Google Scholar]
- Guo, B.; Wang, W.; Shu, Y.; He, G.; Zhang, D.; Deng, X.; Liang, Q.; Yang, Y.; Xie, Q.; Wang, H.; et al. Observed deep anticyclonic cap over Caiwei Guyot. J. Geophys. Res. Ocean. 2020, 125. [Google Scholar] [CrossRef]
- Lin, Z.; Yi, L.; Wang, H.; Deng, X.; Yang, J.; Fu, T.; Yu, H.; Xie, Q.; Deng, C. Rock magnetism of deep-sea sediments at Caiwei Guyot, Magellan seamounts of Northwest Pacific and its significance to abyssal environmental changes. Chin. J. Geophys. 2019, 62, 3067–3077. [Google Scholar] [CrossRef]
- Zhai, F.; Gu, Y. Abyssal circulation in the Philippine Sea. J. Ocean Univ. China 2020, 19, 249–262. [Google Scholar] [CrossRef]
- Kirschvink, J.L. The least-squares line and plane and the analysis of palaeomagnetic data. Geophys. J. R. Astron. Soc. 1980, 62, 699–718. [Google Scholar] [CrossRef]
- Lurcock, P.C.; Wilson, G.S. PuffinPlot: A versatile, user-friendly program for paleomagnetic analysis. Geochem. Geophys. Geosyst. 2012, 13. [Google Scholar] [CrossRef]
- Tauxe, L. Essentials of Paleomagnetism; University of California Press: Berkeley, CA, USA, 2010. [Google Scholar]
- Calvert, S.E.; Pedersen, T.F. Chapter fourteen elemental proxies for palaeoclimatic and palaeoceanographic variability in marine sediments: Interpretation and application. In Developments in Marine Geology; Hillaire–Marcel, C., De Vernal, A., Eds.; Elsevier: Amsterdam, The Netherlands, 2007; Volume 1, pp. 567–644. [Google Scholar]
- Haug, G.H.; Hughen, K.A.; Sigman, D.M.; Peterson, L.C.; Röhl, U. Southward migration of the Intertropical Convergence Zone through the Holocene. Science 2001, 293, 1304–1308. [Google Scholar] [CrossRef]
- Yao, Z.; Liu, Y.; Shi, X.; Suk, B.-C. Paleoenvironmental changes in the East/Japan Sea during the last 48 ka: Indications from high-resolution X-ray fluorescence core scanning. J. Quat. Sci. 2012, 27, 932–940. [Google Scholar] [CrossRef]
- Croudace, I.W.; Rothwell, R.G. Micro-XRF Studies of Sediment Cores: Applications of a Non-Destructive Tool for the Environmental Sciences; Springer: Dordrecht, The Netherlands, 2015; Volume 17, p. 668. [Google Scholar]
- Yi, L.; Xu, D.; Jiang, X.; Ma, X.; Ge, Q.; Deng, X.; Wang, H.; Deng, C. Magnetostratigraphy and Authigenic 10Be/9Be dating of Plio-Pleistocene abyssal surficial sediments on the southern slope of Mariana Trench and sedimentary processes during the Mid-Pleistocene transition. J. Geophys. Res. Ocean. 2020, 125. [Google Scholar] [CrossRef]
- Roberts, A.P.; Tauxe, L.; Heslop, D.; Zhao, X.; Jiang, Z. A critical appraisal of the “Day” diagram. J. Geophys. Res. Solid Earth 2018, 123, 2618–2644. [Google Scholar] [CrossRef]
- Heslop, D. Numerical strategies for magnetic mineral unmixing. Earth Sci. Rev. 2015, 150, 256–284. [Google Scholar] [CrossRef]
- Heslop, D.; Roberts, A.P. Unmixing magnetic hysteresis loops. J. Geophys. Res. Atmos. 2012, 117, 3758. [Google Scholar] [CrossRef]
- Hilgen, F.J.; Lourens, L.J.; Van Dam, J.A.; Beu, A.G.; Boyes, A.F.; Cooper, R.A.; Krijgsman, W.; Ogg, J.G.; Piller, W.E.; Wilson, D.S. Chapter 29—The Neogene period. In The Geologic Time Scale; Gradstein, F.M., Ogg, J.G., Schmitz, M.D., Ogg, G.M., Eds.; Elsevier: Boston, MA, USA, 2012; pp. 923–978. [Google Scholar] [CrossRef]
- Murray, R.W.; Leinen, M. Chemical transport to the seafloor of the equatorial Pacific Ocean across a latitudinal transect at 135°W: Tracking sedimentary major, trace, and rare earth element fluxes at the Equator and the Intertropical Convergence Zone. Geochim. Cosmochim. Acta 1993, 57, 4141–4163. [Google Scholar] [CrossRef]
- Yao, H.; Wang, F.; Wang, H.; Yu, M.; Ren, J.; He, G.; Chen, W.; Yi, L. Pleistocene magnetostratigraphy of four cores in the West Philippian Basin and regional sedimentary shift during the Mid-Pleistocene transition. Geol. J. 2021. [Google Scholar] [CrossRef]
- Hu, B.; Yi, L.; Zhao, J.; Guo, W.; Ding, X.; Wang, F.; Chen, W. Magnetostratigraphy of core XT06 and Quaternary sedimentary dynamics of the deep-sea deposits in the West Philippian Basin. Mar. Geol. Quat. Geol. 2021, 41, 1–14. [Google Scholar] [CrossRef]
- Lalicata, J.J.; Lea, D.W. Pleistocene carbonate dissolution fluctuations in the eastern equatorial Pacific on glacial timescales: Evidence from ODP Hole 1241. Mar. Micropaleontol. 2011, 79, 41–51. [Google Scholar] [CrossRef]
- Jakob, K.A.; Pross, J.; Scholz, C.; Fiebig, J.; Friedrich, O. Thermocline state change in the eastern equatorial Pacific during the late Pliocene/early Pleistocene intensification of Northern Hemisphere glaciation. Clim. Past 2018, 14, 1079–1095. [Google Scholar] [CrossRef]
- Fritz, S.C.; Baker, P.A.; Seltzer, G.O.; Ballantyne, A.; Tapia, P.; Cheng, H.; Edwards, R.L. Quaternary glaciation and hydrologic variation in the South American tropics as reconstructed from the Lake Titicaca drilling project. Quat. Res. 2007, 68, 410–420. [Google Scholar] [CrossRef]
- Farrell, J.W.; Prell, W.L. Climatic change and CaCO3 preservation: An 800,000 year bathymetric reconstruction from the central equatorial Pacific Ocean. Paleoceanography 1989, 4, 447–466. [Google Scholar] [CrossRef]
- Bickert, T.; Henrich, R. Chapter 12—Climate records of deep-sea sediments: Towards the Cenozoic ice house. In Developments in Sedimentology; HüNeke, H., Mulder, T., Eds.; Elsevier: Amsterdam, The Netherlands, 2011; Volume 63, pp. 793–823. [Google Scholar]
- Qin, B.; Li, T.; Xiong, Z.; Algeo, T.J.; Jia, Q. Deep-water carbonate ion concentrations in the western tropical Pacific since the Mid-Pleistocene: A major perturbation during the Mid-Brunhes. J. Geophys. Res. Ocean. 2018, 123, 6876–6892. [Google Scholar] [CrossRef]
- Anderson, R.; Fleisher, M.; Lao, Y.; Winckler, G. Modern CaCO3 preservation in equatorial Pacific sediments in the context of late-Pleistocene glacial cycles. Mar. Chem. 2008, 111, 30–46. [Google Scholar] [CrossRef]
- Sexton, P.F.; Barker, S. Onset of ‘Pacific-style’ deep-sea sedimentary carbonate cycles at the mid-Pleistocene transition. Earth Planet. Sci. Lett. 2012, 321–322, 81–94. [Google Scholar] [CrossRef]
- Lisiecki, L.E.; Raymo, M.E. A Pliocene-Pleistocene stack of 57 globally distributed benthic δ18O records. Paleoceanography 2005, 20, 1003. [Google Scholar] [CrossRef]
- Brook, E.J.; Buizert, C. Antarctic and global climate history viewed from ice cores. Nature 2018, 558, 200–208. [Google Scholar] [CrossRef]
- Costa, K.M.; Anderson, R.F.; McManus, J.F.; Winckler, G.; Middleton, J.L.; Langmuir, C.H. Trace element (Mn, Zn, Ni, V) and authigenic uranium (aU) geochemistry reveal sedimentary redox history on the Juan de Fuca Ridge, North Pacific Ocean. Geochim. Cosmochim. Acta 2018, 236, 79–98. [Google Scholar] [CrossRef]
- Lowemark, L.; Marz, C.; Oregan, M.; Gyllencreutz, R. Arctic Ocean Mn-stratigraphy: Genesis, synthesis and inter-basin correlation. Quat. Sci. Rev. 2014, 92, 97–111. [Google Scholar] [CrossRef]
- Slemons, L.; Paul, B.; Resing, J.; Murray, J.W. Particulate iron, aluminum, and manganese in the Pacific equatorial undercurrent and low latitude western boundary current sources. Mar. Chem. 2012, 142–144, 54–67. [Google Scholar] [CrossRef]
- Hodell, D.A.; Venz, K.A.; Charles, C.D.; Ninnemann, U.S. Pleistocene vertical carbon isotope and carbonate gradients in the South Atlantic sector of the Southern Ocean. Geochem. Geophys. Geosyst. 2003, 4, 1–19. [Google Scholar] [CrossRef]
- Hodell, D.A.; Venz-Curtis, K.A. Late Neogene history of deepwater ventilation in the Southern Ocean. Geochem. Geophys. Geosyst. 2006, 7. [Google Scholar] [CrossRef]
- Elderfield, H.; Ferretti, P.; Greaves, M.; Crowhurst, S.J.; McCave, I.N.; Hodell, D.A.; Piotrowski, A.M. Evolution of ocean temperature and ice volume through the Mid-Pleistocene climate transition. Science 2012, 337, 704–709. [Google Scholar] [CrossRef]
- Howe, J.N.W.; Piotrowski, A.M.; Noble, T.L.; Mulitza, S.; Chiessi, C.M.; Bayon, G. North Atlantic deep water production during the last glacial maximum. Nat. Commun. 2016, 7, 11765. [Google Scholar] [CrossRef]
- Jaccard, S.L.; Galbraith, E.D.; Martínez-García, A.; Anderson, R.F. Covariation of deep Southern Ocean oxygenation and atmospheric CO2 through the last ice age. Nature 2016, 530, 207–210. [Google Scholar] [CrossRef] [PubMed]
- Sigman, D.M.; Hain, M.P.; Haug, G.H. The polar ocean and glacial cycles in atmospheric CO2 concentration. Nature 2010, 466, 47–55. [Google Scholar] [CrossRef] [PubMed]
- Rea, D.K. The paleoclimatic record provided by eolian deposition in the deep sea: The geologic history of wind. Rev. Geophys. 1994, 32, 159–195. [Google Scholar] [CrossRef]
- Rea, D.K.; Hovan, S.A. Grain size distribution and depositional processes of the mineral component of abyssal sediments: Lessons from the North Pacific. Paleoceanography 1995, 10, 251–258. [Google Scholar] [CrossRef]
- Schmidt, H.; Berger, W.; Bickert, T.; Wefer, G. Quaternary carbon isotope record of pelagic foraminifers: Site 806, Ontong Java Plateau. In Proceedings of the Ocean Drilling Program, Scientific Results; Berger, W., Kroenke, L., Janecek, T., Backman, J., Bassinot, F., Corfield, R., Eds.; Ocean Drilling Program: College Station, TX, USA, 1993; Volume 130, pp. 397–409. [Google Scholar]
- Berger, A. Intertropical latitudes and precessional and half-precessional cycles. Science 1997, 278, 1476–1478. [Google Scholar] [CrossRef]
- Verschuren, D.; Sinninghe Damste, J.S.; Moernaut, J.; Kristen, I.; Blaauw, M.; Fagot, M.; Haug, G.H. Half-precessional dynamics of monsoon rainfall near the East African Equator. Nature 2009, 462, 637–641. [Google Scholar] [CrossRef]
- Zhang, X.; Boyer, D.L. Current deflections in the vicinity of multiple seamounts. J. Phys. Oceanogr. 1991, 21, 1122–1138. [Google Scholar] [CrossRef]
- Zhang, X.; Boyer, D.L. Laboratory study of rotating, stratified, oscillatory flow over a seamount. J. Phys. Oceanogr. 1993, 23, 1122–1141. [Google Scholar] [CrossRef][Green Version]
- Chen, G.; Wang, D.; Dong, C.; Zu, T.; Xue, H.; Shu, Y.; Chu, X.; Qi, Y.; Chen, H. Observed deep energetic eddies by seamount wake. Sci. Rep. 2015, 5, 17416. [Google Scholar] [CrossRef]
- Yang, S.; Xing, J.; Chen, D.; Chen, S. A modelling study of eddy-splitting by an island/seamount. Ocean Sci. 2017, 13, 837–849. [Google Scholar] [CrossRef]
- Perfect, B.; Kumar, N.; Riley, J.J. Vortex structures in the wake of an idealized seamount in rotating, stratified flow. Geophys. Res. Lett. 2018, 45, 9098–9105. [Google Scholar] [CrossRef]
- Robertson, R.; Dong, J.; Hartlipp, P. Diurnal critical latitude and the latitude dependence of internal tides, internal waves, and mixing based on Barcoo Seamount. J. Geophys. Res. Ocean. 2017, 122, 7838–7866. [Google Scholar] [CrossRef]
- Lavelle, J.W.; Mohn, C. Motion, commotion, and biophysical connections at deep ocean seamounts. Oceanography 2010, 23, 90–103. [Google Scholar] [CrossRef]
- Cheng, H.; Edwards, R.L.; Sinha, A.; Spötl, C.; Yi, L.; Chen, S.; Kelly, M.; Kathayat, G.; Wang, X.; Li, X.; et al. The Asian monsoon over the past 640,000 years and ice age terminations. Nature 2016, 534, 640–646. [Google Scholar] [CrossRef] [PubMed]
- Yi, L.; Shi, Z.; Tan, L.; Deng, C. Orbital-scale nonlinear response of East Asian summer monsoon to its potential driving forces in the late Quaternary. Clim. Dyn. 2018, 50, 2183–2197. [Google Scholar] [CrossRef]
- Pollard, D.; DeConto, R.M. Modelling West Antarctic ice sheet growth and collapse through the past five million years. Nat. Cell Biol. 2009, 458, 329–332. [Google Scholar] [CrossRef] [PubMed]
- Sun, Y.; Clemens, S.C.; An, Z.; Yu, Z. Astronomical timescale and palaeoclimatic implication of stacked 3.6-Myr monsoon records from the Chinese Loess Plateau. Quat. Sci. Rev. 2006, 25, 33–48. [Google Scholar] [CrossRef]
- Berger, A.; Loutre, M.-F. Insolation values for the climate of the last 10 million years. Quat. Sci. Rev. 1991, 10, 297–317. [Google Scholar] [CrossRef]
- Howell, P.; Pisias, N.; Ballance, J.; Baughman, J.; Ochs, L. ARAND Time-Series Analysis Software; Brown University: Providence, RI, USA, 2006. [Google Scholar]
Publisher’s Note: MDPI stays neutral with regard to jurisdictional claims in published maps and institutional affiliations. |
© 2021 by the authors. Licensee MDPI, Basel, Switzerland. This article is an open access article distributed under the terms and conditions of the Creative Commons Attribution (CC BY) license (http://creativecommons.org/licenses/by/4.0/).