1. Introduction
Large volumes of sand are transported along the coast (littoral drift) due to natural actions of waves, currents, and winds. Littoral morphology is dependent of the dynamic relationship between the wave climate, considered the main factor responsible for the sediments transport capacity, and the characteristics and availability of existing sediments [
1]. If the quantity of sediments leaving a coastal stretch is balanced by the same quantity of sediments coming in, the system is in a dynamic equilibrium, not resulting in erosion or accretion. But if the sediment balance is not maintained, erosion or accretion occurs, representing, respectively, the retreat or advance of the shoreline position [
2,
3].
Due to the need to protect coastal areas from erosion problems, it is common to perform coastal defense interventions. Artificial sediment nourishment is an intervention strategy that has been adopted by several countries all over the world [
4,
5]. The nourishment refers to the process of adding sediments to the littoral drift, beach, and/or dune system in order to strengthen the cross-shore profiles of the coastal stretch [
6]. In general, the most important benefits of artificial nourishments are the mitigation of coastal erosion, preventing flooding, and enabling the maintenance of wide beaches that also serve recreational purposes [
7,
8,
9]. However, artificial nourishments interfere with the natural sediment dynamics and are not a permanent solution. The removal of sediments that occur naturally from the deposition site require re-nourishment over time, to maintain their design function [
10]. Periodic re-nourishment intervals range on average from 2 to 10 years and depend on several factors related to initial design, wave climate, sand used, and the number and type of storms [
11,
12,
13]. Therefore, although artificial nourishments are widely applied in different sites as a soft coastal intervention, questions related to the fill material fate, lifetime, and long-term impacts (to downdrift areas) still need to be answered with more confidence.
The main objective of this study was to present contributions to anticipate how sediments are spatially and temporally distributed after artificial nourishment interventions. The adopted approach was intended to be generic and supported by simple numerical theories/models, which could be useful for preliminary site-specific evaluations. The nourishment performance depends on multiple variables related to the sediment’s dynamics and the artificial sand nourishment process itself. Thus, the nourishment impact was evaluated for different types of beaches (defined in the numerical model by different boundary conditions) and wave climates (wave heights and directions). Additionally, the longshore transport patterns of the nourished sediments were evaluated, aiming to anticipate their permanence at the deposition site and the frequency required for new nourishments.
2. Nourished Sediments Transport Processes
The concept of artificial nourishment is based on an attempt to replicate natural processes: Sand is deposited in coastal systems (beaches, dunes, or littoral drift) and nature, with the actions of waves, currents, and winds taking care of its distribution [
8,
14].
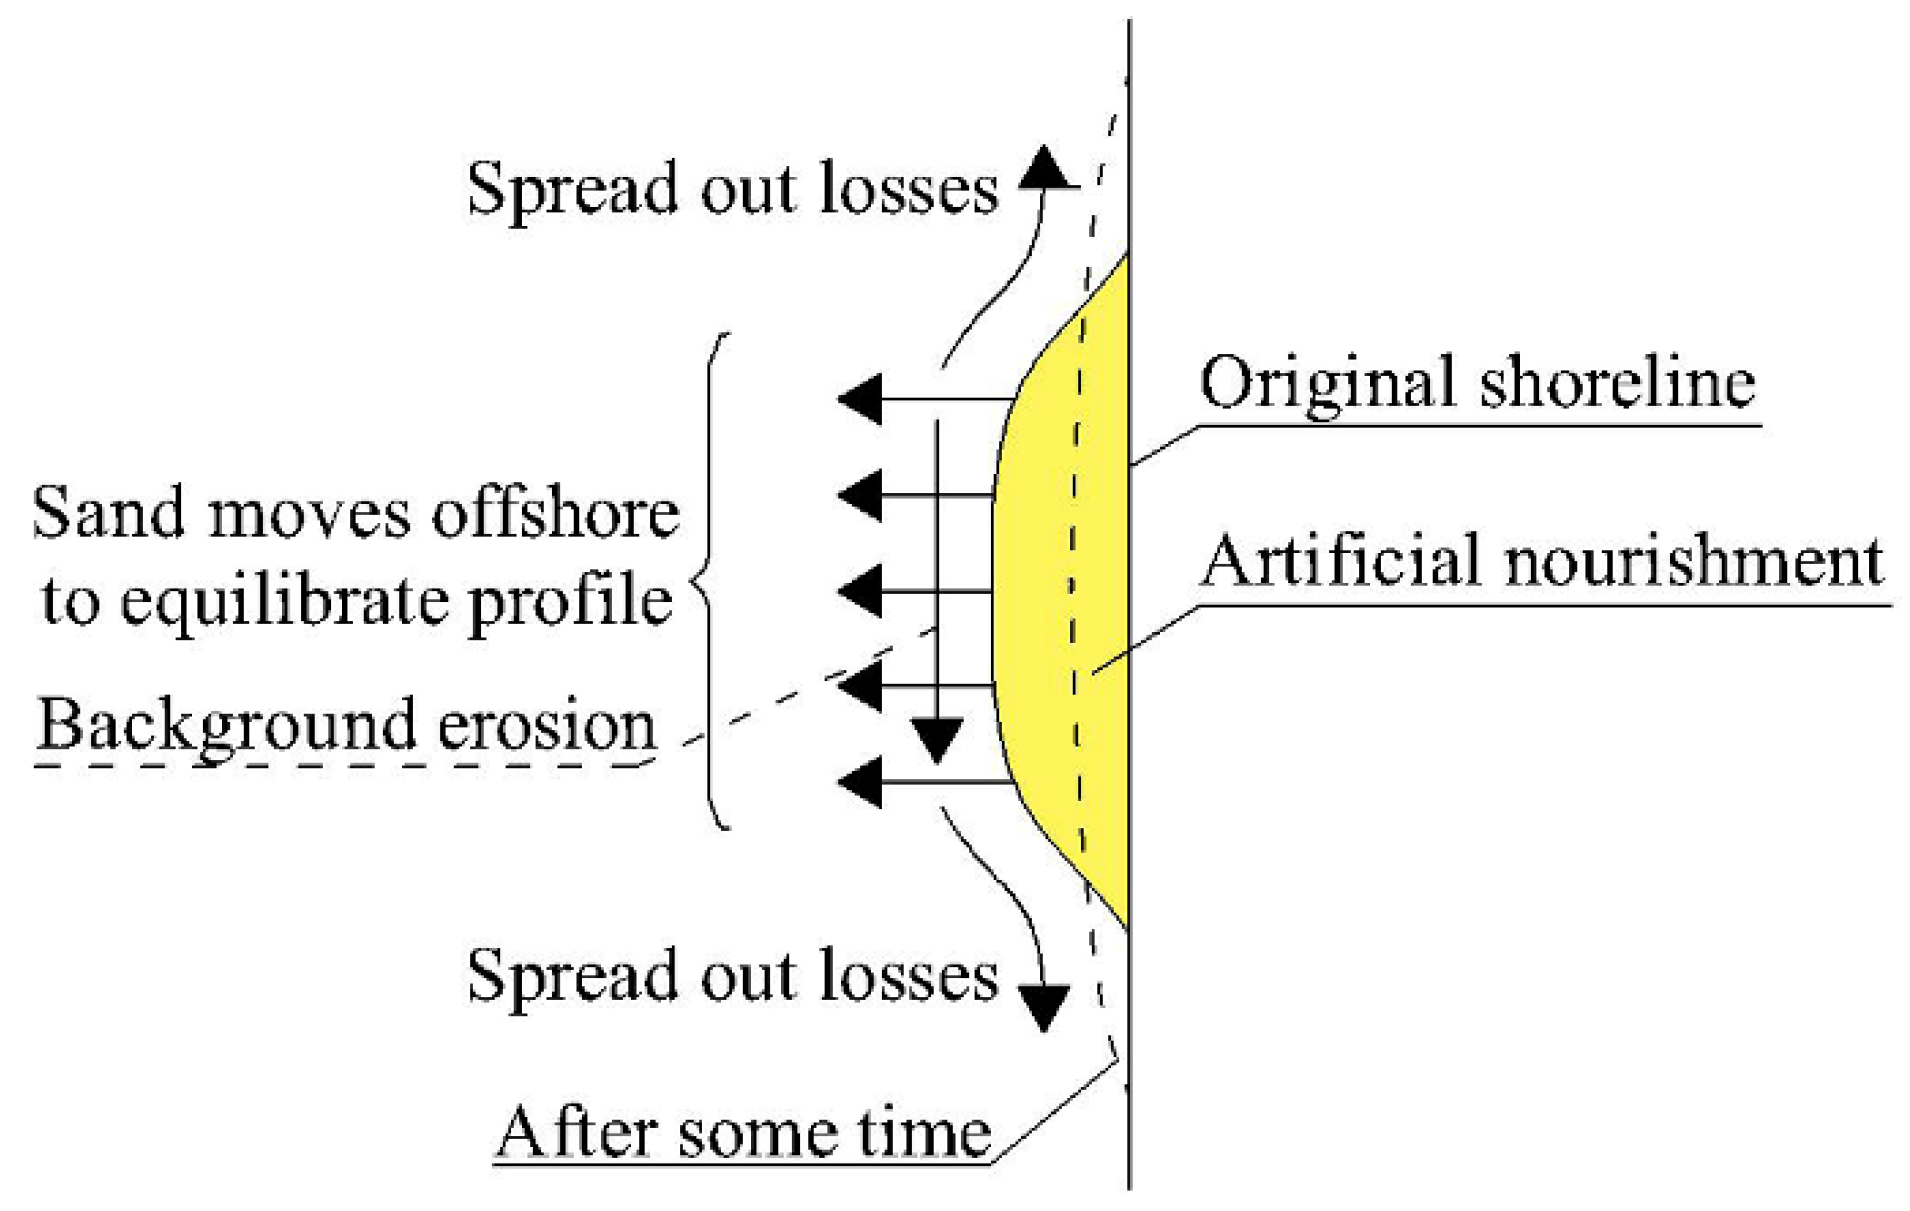
The artificially filled material is usually distributed in a limited length along the coastline and defines a cross-shore profile that is different from the stable profile at the deposition site. After sand deposition, the sediments spread out and tend toward a straight or slowly curving shoreline (
Figure 1). In the direction perpendicular to the shoreline, the nourishment develops a stable configuration, in equilibrium with the relationship between the sediments’ grain size and the incident wave climate. In the longshore direction, the center of the mass of the nourished sediments moves in the direction of the net sediment transport [
14].
The sediments from artificial nourishment mix with native sediments and are distributed transversally and alongshore by wave actions and currents. The mixture of sediments occur by sediment transport processes related with local sediment dynamics together with losses that have occurred during the nourishment operations [
15]. Depending on local conditions and intervention characteristics, an artificially nourished beach profile may take months or years to reach an equilibrium condition [
16].
Due to the complexity of the coastal processes and taking into account the incompatibility of their time scales of interest, it is common to divide the assessment of the littoral sediments transport in two components [
17,
18]: Longitudinal transport, where sediments are transported in a direction parallel to the coastline; and cross-shore transport, where sediments are transported in a direction perpendicular to the coastline [
19]. The cross-shore sediment transport reflects the short-term morphological evolution (storm to seasonal behavior) and the longshore sediment transport is associated with long-term shoreline changes, related to years or decades [
3,
14,
19].
2.1. Theorical Approach
Several formulas to estimate longshore sediment transport rates are available in the literature. For example, Shaeri et al. [
20], in their literature review about longshore sediment transport rate calculation, list the following equations: CERC (Coastal Engineering Research Center) [
19], Kamphuis [
21], Bayram et al. [
22], van Rijn [
23], and Tomasicchio et al. [
24]. However, due to the coastal processes’ complexity, longshore sediment transport evaluation is still challenging. Despite CERC formulation being introduced several decades ago, the CERC formula [
19] is still widely used in both practice and fundamental research [
20]. This formula [
19] allows the longshore sediment transport to be computed based essentiality on the parameters related to waves at breaking: Significant wave breaking height and wave angle at breaking (Equation (1)). When offshore wave characteristics are known, breaking wave characteristics can be predicted, considering wave propagation phenomena, namely shoaling and refraction. Assuming a linear theory of wave propagation and that bottom contours are parallel to the shoreline, the wave angle at breaking (θ) depends on shoreline orientation. If waves reach the shore obliquely, breaking wave energy suspends and transports sediments alongshore [
25].
Since sand deposition during an artificial nourishment intervention changes the local bathymetry, refraction effects can be particularly important in a nourishment intervention with consequences on alongshore sediment flux (
Figure 2).
Murray and Asthon [
26] evaluated the alongshore sediment flux for different wave angles and concluded that coastline segments with different orientations experience different alongshore sediment fluxes. The wave angle that leads to the highest value of sediment transport is not necessarily the most oblique wave in shallow water. Their results were produced based on a semi-empirical equation for alongshore sediment flux as a function of breaking-wave quantities, transforming it into a relationship involving offshore wave characteristics [
25,
26].
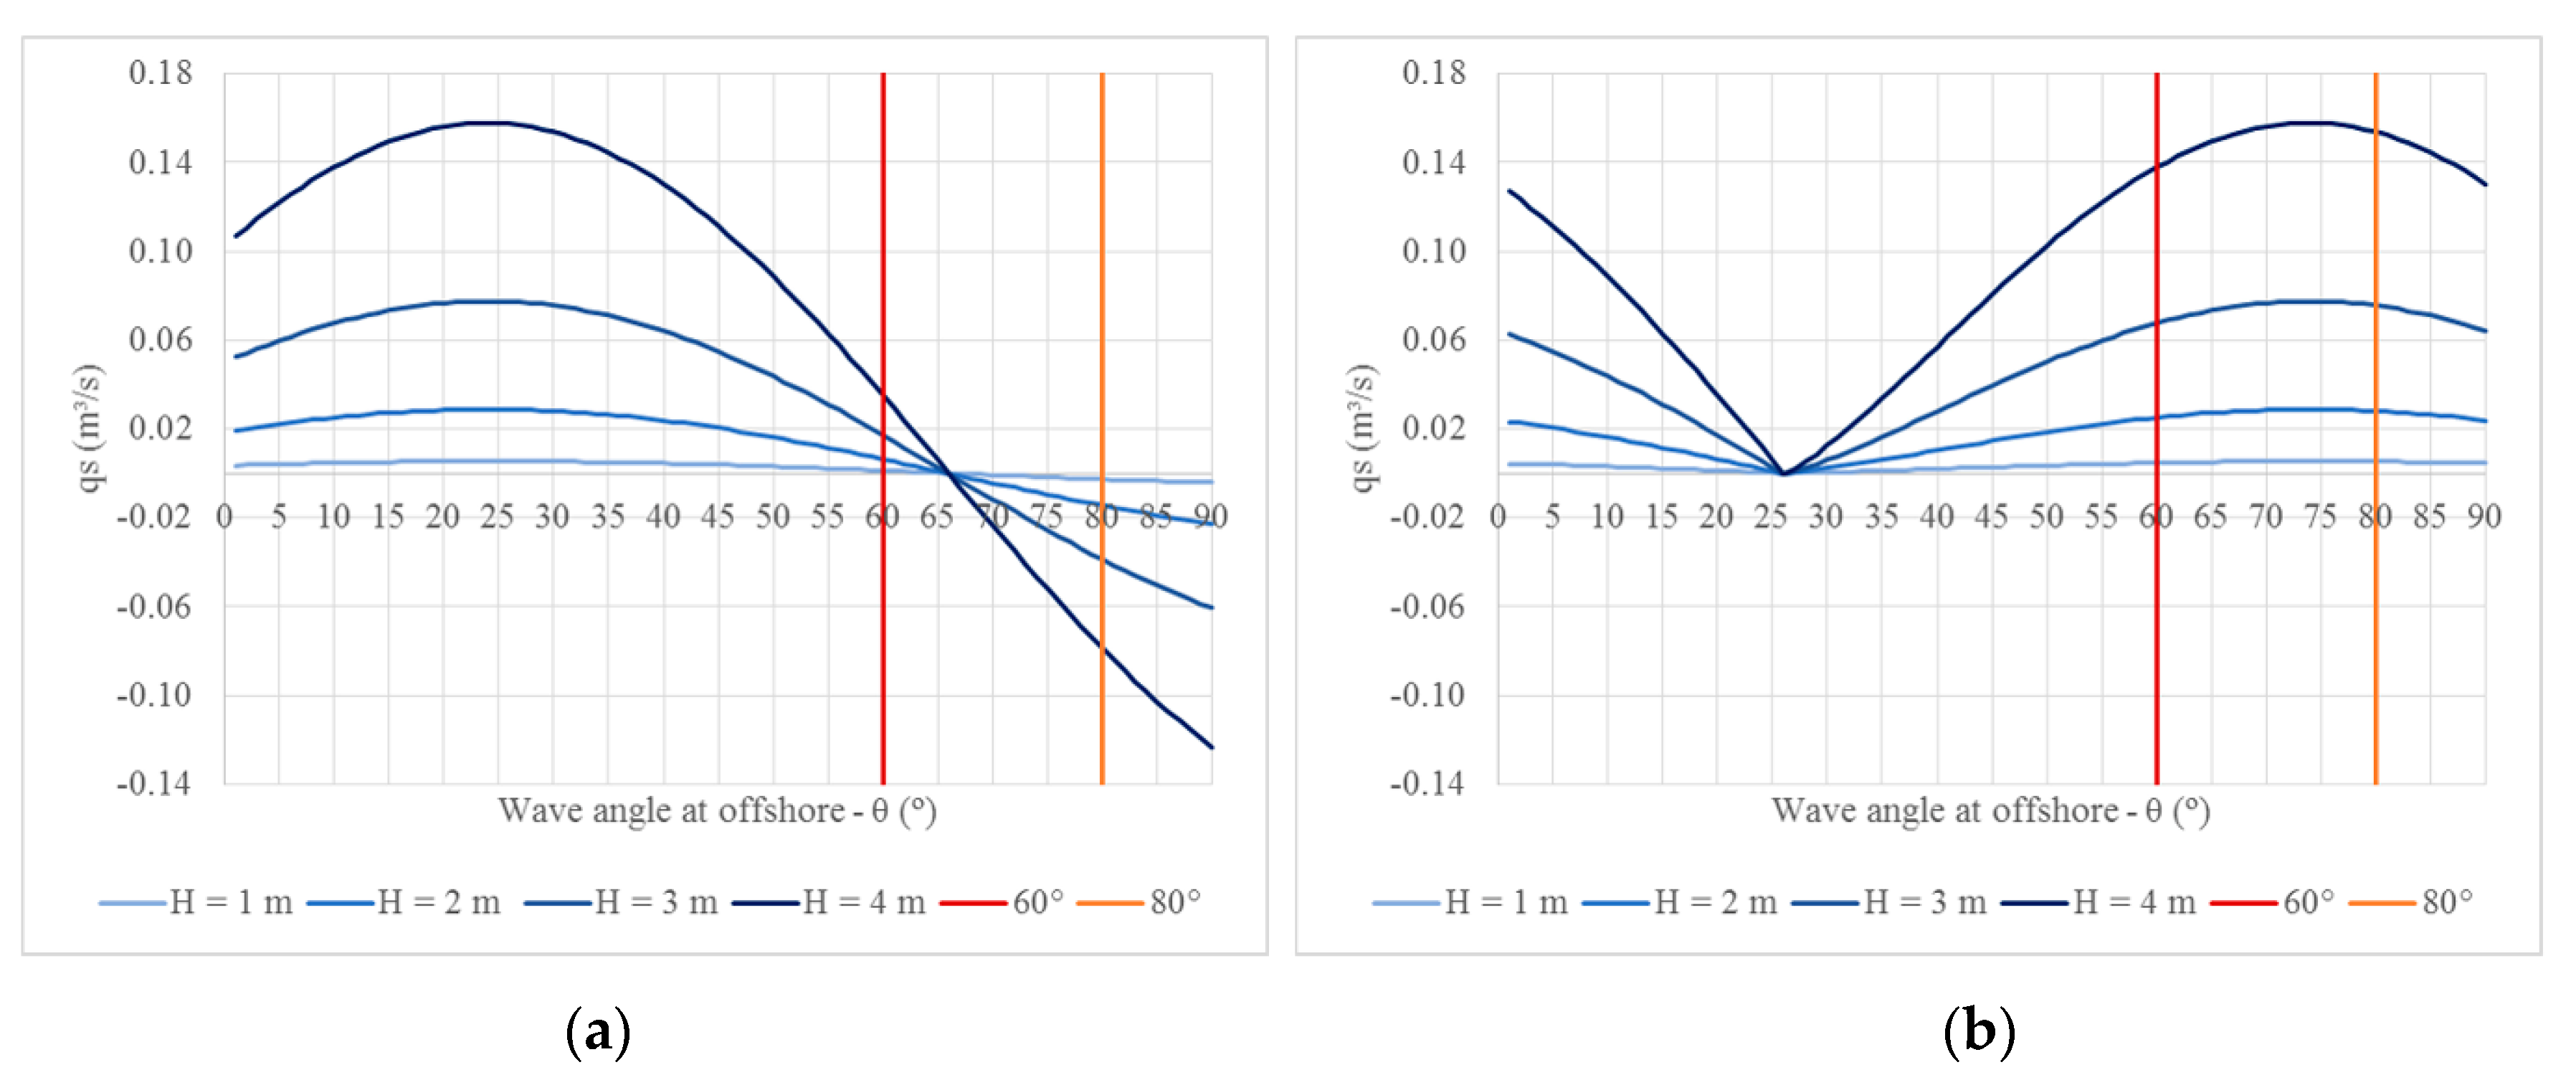
Considering the CERC formula and manipulating the equation in order to involve offshore wave characteristics, considering the linear wave theory, it is concluded that the longshore sediment transport rate increases with wave height and reaches the maximum for an offshore wave direction (θ) of around 48° (
Figure 3a). However, if the nourishment changes the shoreline and wave breaking depth contours and, consequently, the wave breaking orientation, the maximum longshore sediment transport rates occur for different wave angles offshore (
Figure 3b).
For example, considering wave angles at offshore (θ) of 60° and 80°, it is possible to observe two main results for the longshore sediment transport rate at the nourishment updrift and downdrift boundaries, considering a shoreline rotation (∆θ) of 25° due to the intervention: (i) There is a change in the longshore sediment transport direction at updrift, for the wave with θ = 80°. This wave also presents higher sediment transport capacity to updrift than the 60° wave to downdrift (
Figure 4a); (ii) the less oblique wave at offshore (80°) presents higher sediment transport capacity at the downdrift limit of the nourishment than the 60° wave, which reverses the behavior observed before the nourishment (
Figure 4b).
2.2. Numerical Modeling Approach
Numerical models can be very important and useful tools to anticipate the performance of nourishment operations [
17,
27]. However, due to the complexity of the physical processes involved and the high computational effort required, each model focuses on a limited range of processes, acting over a certain scale, and usually not merging cross-shore and longshore processes at the same time [
28,
29,
30].
In nourishment modeling applications, where both short- and long-term effects must be simulated, 3D models that simultaneously include cross-shore and longshore processes are still lacking to a large degree. At present, the profile change and contour line models are the ones that are regularly employed in engineering projects for forecasting coastal evolution. Modeling coastal evolution in a long-term perspective is also linked to the study of the sand nourishments, although some probabilistic studies related to modeling of both longshore and cross-shore processes in a medium-term perspective can be referred, e.g., Dong and Chen [
31], Wang and Reeve [
32], Callaghan et al. [
33], and Reeve et al. [
34].
Burcharth et al. [
35] present some examples of coastal zone evolution studies through 3D models. However, because fully 3D beach change models are used in attempt to simulate local characteristics of waves, currents, and sediment transport, they require extensive verification and sensitivity analyses. Thus, these models are time demanding, due to both field data collection and computational time [
35,
36]. According to Burcharth et al. [
35], 3D models are most suitable for medium-term morphological investigation over a limited coastal area with dimensions of about 10 km in the alongshore direction and 2 km in the offshore direction. Larson et al. [
30] highlight the need for long-term morphological modeling, emphasizing the importance of reducing the computational time required, the model reliability and robustness being key properties to achieve useful simulation results.
3. Numerical Modeling
The alongshore distribution of the sediment volumes added by the artificial nourishments was evaluated by numerical modeling. For this purpose, the numerical long-term configuration (LTC) model was applied, which combines a simple classical one-line model with a rule-based model for erosion/accretion volume distribution along the beach profile [
37,
38,
39]. The model was applied to a generic study area with regular and parallel bathymetry (modeled domain), allowing us to evaluate the effects of the wave climate and the domain boundary conditions in the nourishment performance.
3.1. LTC Numerical Model
The numerical LTC model, developed by Coelho [
3], was specifically designed for sandy beaches, where the main cause of medium-term shoreline evolution is the longshore sediment transport gradients. The latter mainly depends on the wave climate and the domain boundary conditions. The model inputs are the water level and the bathymetry/topography of the modeled area, which is modified during the simulation [
3,
29,
38].
The LTC numerical model assumes that each wave acts individually during a certain period of time, the computational time step. For each wave, the computational structure of the model performs three main steps: (1) Wave propagation; (2) calculation of the longshore sediment transport volume; and (3) update beach morphology, depending on longshore sediment transport gradients.
The model considers the refraction and shoaling phenomena during wave propagation and diffraction, close to coastal structures. The wave breaking occurs for the depth Hb ≈ 0.78 Hb (Hb is the wave height at breaking and hb is the local depth at breaking).
The LTC numerical model is based on a one-line theory and simulates medium- to long-term coastal configuration evolution, considering the sediment continuity equation (Equation (2)), where
V corresponds to the volume of sediments in a section of infinitesimal width
,
Q is the longitudinal sediments transport rate,
are any external supplies of sediments (artificial nourishments, for instance) per unit of the beach width, and
t is the time [
3].
According to Coelho [
3], the discretization of Equation (2) in time intervals equal to
and the analysis along the shoreline for stretches of length
allows the volume variation in each stretch with the variation in time of the longshore sediment transport to be related:
The longshore sediment transport variation in the length
results from the difference between the incoming (
) and leaving (
) sediment volumes in the stretch of
length, for each time interval
. The longshore sediment transport volumes are computed for each coastal stretch
, estimated considering the angle of the shoreline to oncoming breaking waves [
19,
21], the wave breaking height, beach slope, and sediment grain size [
21,
36].
The model considers that
=
, corresponding to the volume variation of sediments (
) in the length
, is uniformly distributed over the active cross-shore profile, representing a variation Δ
z in the elevation (Equation (4)), in every time step, as shown in
Figure 5 [
3]. The active profile is adjusted with the adjacent zones; therefore, the shoreline position, besides depending on Δ
z, also depends on the bathymetry and topography associated with each cross-shore profile (
Figure 5). Thus, LTC computes a new shape of the cross-shore profile in each time step [
3,
40].
Through LTC, it is possible to evaluate the shoreline evolution considering different coastal defense interventions, namely artificial nourishments. The user needs to define the parameters related to the total nourishment volume, the area covered by the intervention, and the time duration to perform the nourishment (starting and ending instants of the intervention). Since the model computes the wave-breaking characteristics, the location of the artificial nourishment should include the breaking depth in order to be adequately modeled and distributed in the cross-shore profile.
3.2. Modeled Scenarios
The artificial nourishment performance (sediment distribution along time and space) was evaluated for a generic situation, to better control the response to different scenarios of wave height and direction, plus the boundary conditions of the modeled domain, representing three different types of coasts: (i) Open coast; (ii) confined beach; and (iii) beach with a fixed position at the updrift side.
The domain area is 5000 × 20,000 m
2, with regular and parallel bathymetry, represented by a grid of points spaced 20 m in the cross-shore direction and 50 m in the longshore direction. The longshore direction was divided into 10 coastal stretches of 2 km in length (
Figure 6). In each stretch, a representative cross-shore profile was selected for results control, located in the middle of the stretch length.
Figure 6 also shows the initial cross-shore profile geometry of the entire modeled area.
The nourishment location was defined near the updrift end of the modeled grid, Stretch 9, filling the entire active width of the beach profile, which makes up an area of 1640 × 2000 m2 covered by the nourishment. The nourishment is performed a single time at the beginning of the simulation, with a volume of 5 × 10⁶ m3, taking ten months (7200 h) to deposit the sediments.
Twenty-four wave climate scenarios were generated, considering constant throughout the five years simulation period. These scenarios combined four values of wave heights (H = 1, 2, 3, and 4 m) with 6 different wave directions (θ = 60°, 65°, 70°, 75°, 80°, and 85°).
Additionally, aiming to understand the influence of beach exposure and sedimentary balance inputs in the coastal cell, three different situations were considered for the modeled domain boundary conditions. If there were no sedimentary exchanges with the adjacent cell, such as fluvial sources or updrift inputs on coastal balance, the cell was considered with the boundaries closed. Otherwise, it was considered that the domain may receive sediments from the exterior. The first boundary scenario considered no sediments going in or out, at both boundaries of the domain. This scenario was named Clo/Clo (representative of an embedded beach-closed area). The second boundary scenario extrapolates similar longshore sediments transport conditions in the neighboring areas of both boundaries of the domain, giving continuity to the longshore sediment transport rates along the coast, typical of open coasts or when fluvial sources are present just updrift the domain (Ext/Ext scenario). In the third scenario, no sediments were considered at updrift and extrapolation of neighboring conditions were adopted at downdrift (Clo/Ext). Combining each wave climate scenario (24) with the described boundary conditions (3) made up 72 different scenarios. Each scenario was modeled twice to evaluate the performance with and without the artificial nourishment.
In all the scenarios, a constant cross-shore active profile was considered, with a closure depth and runup limit of −15 (CD) and +5 m (CD), respectively. The CERC formula was adopted to estimate the longshore sediment transport. The parameters related to the water level, sediment’s characteristics and cross-shore profiles evolution were considered the same in all the tested scenarios.
3.3. Methodology
The numerical modeling tests were carried out for a total period of 5 years (43,800 h of simulation), obtaining annual graphical outputs to analyze the nourished sediments distribution along the coast. The nourishment impact was assessed in each coastal stretch, by quantifying the sediments volume induced by the nourishment and the gain or loss of area due to the shoreline evolution (accretion or erosion). This was achieved by subtracting the results of the scenarios without nourishment to the ones in which the artificial nourishment was considered.
4. Results
The results of artificial nourishment impacts, evaluated in terms of the sediment volume distribution in each coastal stretch and related gains or losses of territory due to shoreline evolution, are presented in this section. The results were analyzed under the numerical model assumptions that shoreline position evolution depends on longshore sediments transport rate and neglects the coastal processes related to cross-shore sediment transport. Comparisons for different wave height and wave direction scenarios, in combination with the different type of beach exposures, are presented.
4.1. Wave Height
The nourished sediments’ distribution along the coast shows that for the same wave direction and independently of the boundary conditions, the higher the wave, the earlier the downdrift stretches presented benefits from the nourishment operation. These benefits were observed in an increase of the robustness of the cross-shore profiles (increasing of volumes in the coastal stretches) and gain of territory (both accretion area and/or non-eroded area in comparison with the equivalent non-nourished scenario). As the wave height increased, the dispersion of the sediments became greater along the coast, causing the benefits to diminish in some coastal stretches close to the intervention site, where the beneficial effects of the nourishment tended to disappear after 5 years of simulation (
Figure 7).
4.2. Wave Direction
The wave direction results indicated that the stretches located downdrift began to show benefits of nourishment sooner in time and in greater magnitude, the closer to perpendicular to the shoreline the wave direction was (
Figure 8). These results are in agreement with the three types of boundary conditions tested. Although this result may seem counterintuitive, since it could be expected than the most oblique wave presents more longshore sediment transport capacity, the behavior can be attributed to wave refraction effects in the boundaries of the nourishment area, as previously discussed (see
Section 2.1). Sediment deposition changed the local bathymetry and the resulting longshore sediment flux, which is dependent on the new bathymetry at each time step.
4.3. Domain Boundary Conditions
Artificial nourishment effects are conditioned by the type of beach, which is here represented by the boundary conditions of the modeled domain. Two types of main effects were observed. In the scenarios represented by extrapolation of nearby sediment transport capacity at the updrift boundary, the impact of the artificial nourishment, although not reflected so significantly in the gained area, contributed to an increase of the robustness of the cross-shore profiles. When the scenarios corresponded to the closed updrift boundary condition (no sediments going in), the nourishment represented an important gain of territory, also causing an increase of sediment volume in the cross-shore profile. Both effects were greater in coastal stretches located nearby the fill placement (
Figure 9 and
Figure 10).
Considering the boundary conditions, the difference of area gained observed at the updrift stretches was related to the absence of sediments going in, when the boundary was closed. In these scenarios, the shoreline presented a high retreat trend, in opposition to the extrapolation boundary, when the shoreline presented a stable configuration (
Figure 11). The artificial nourishment effects decreased with the distance to the fill placement and the magnitude of the results at the most downdrift coastal stretches were similar for the three boundary scenarios tested.
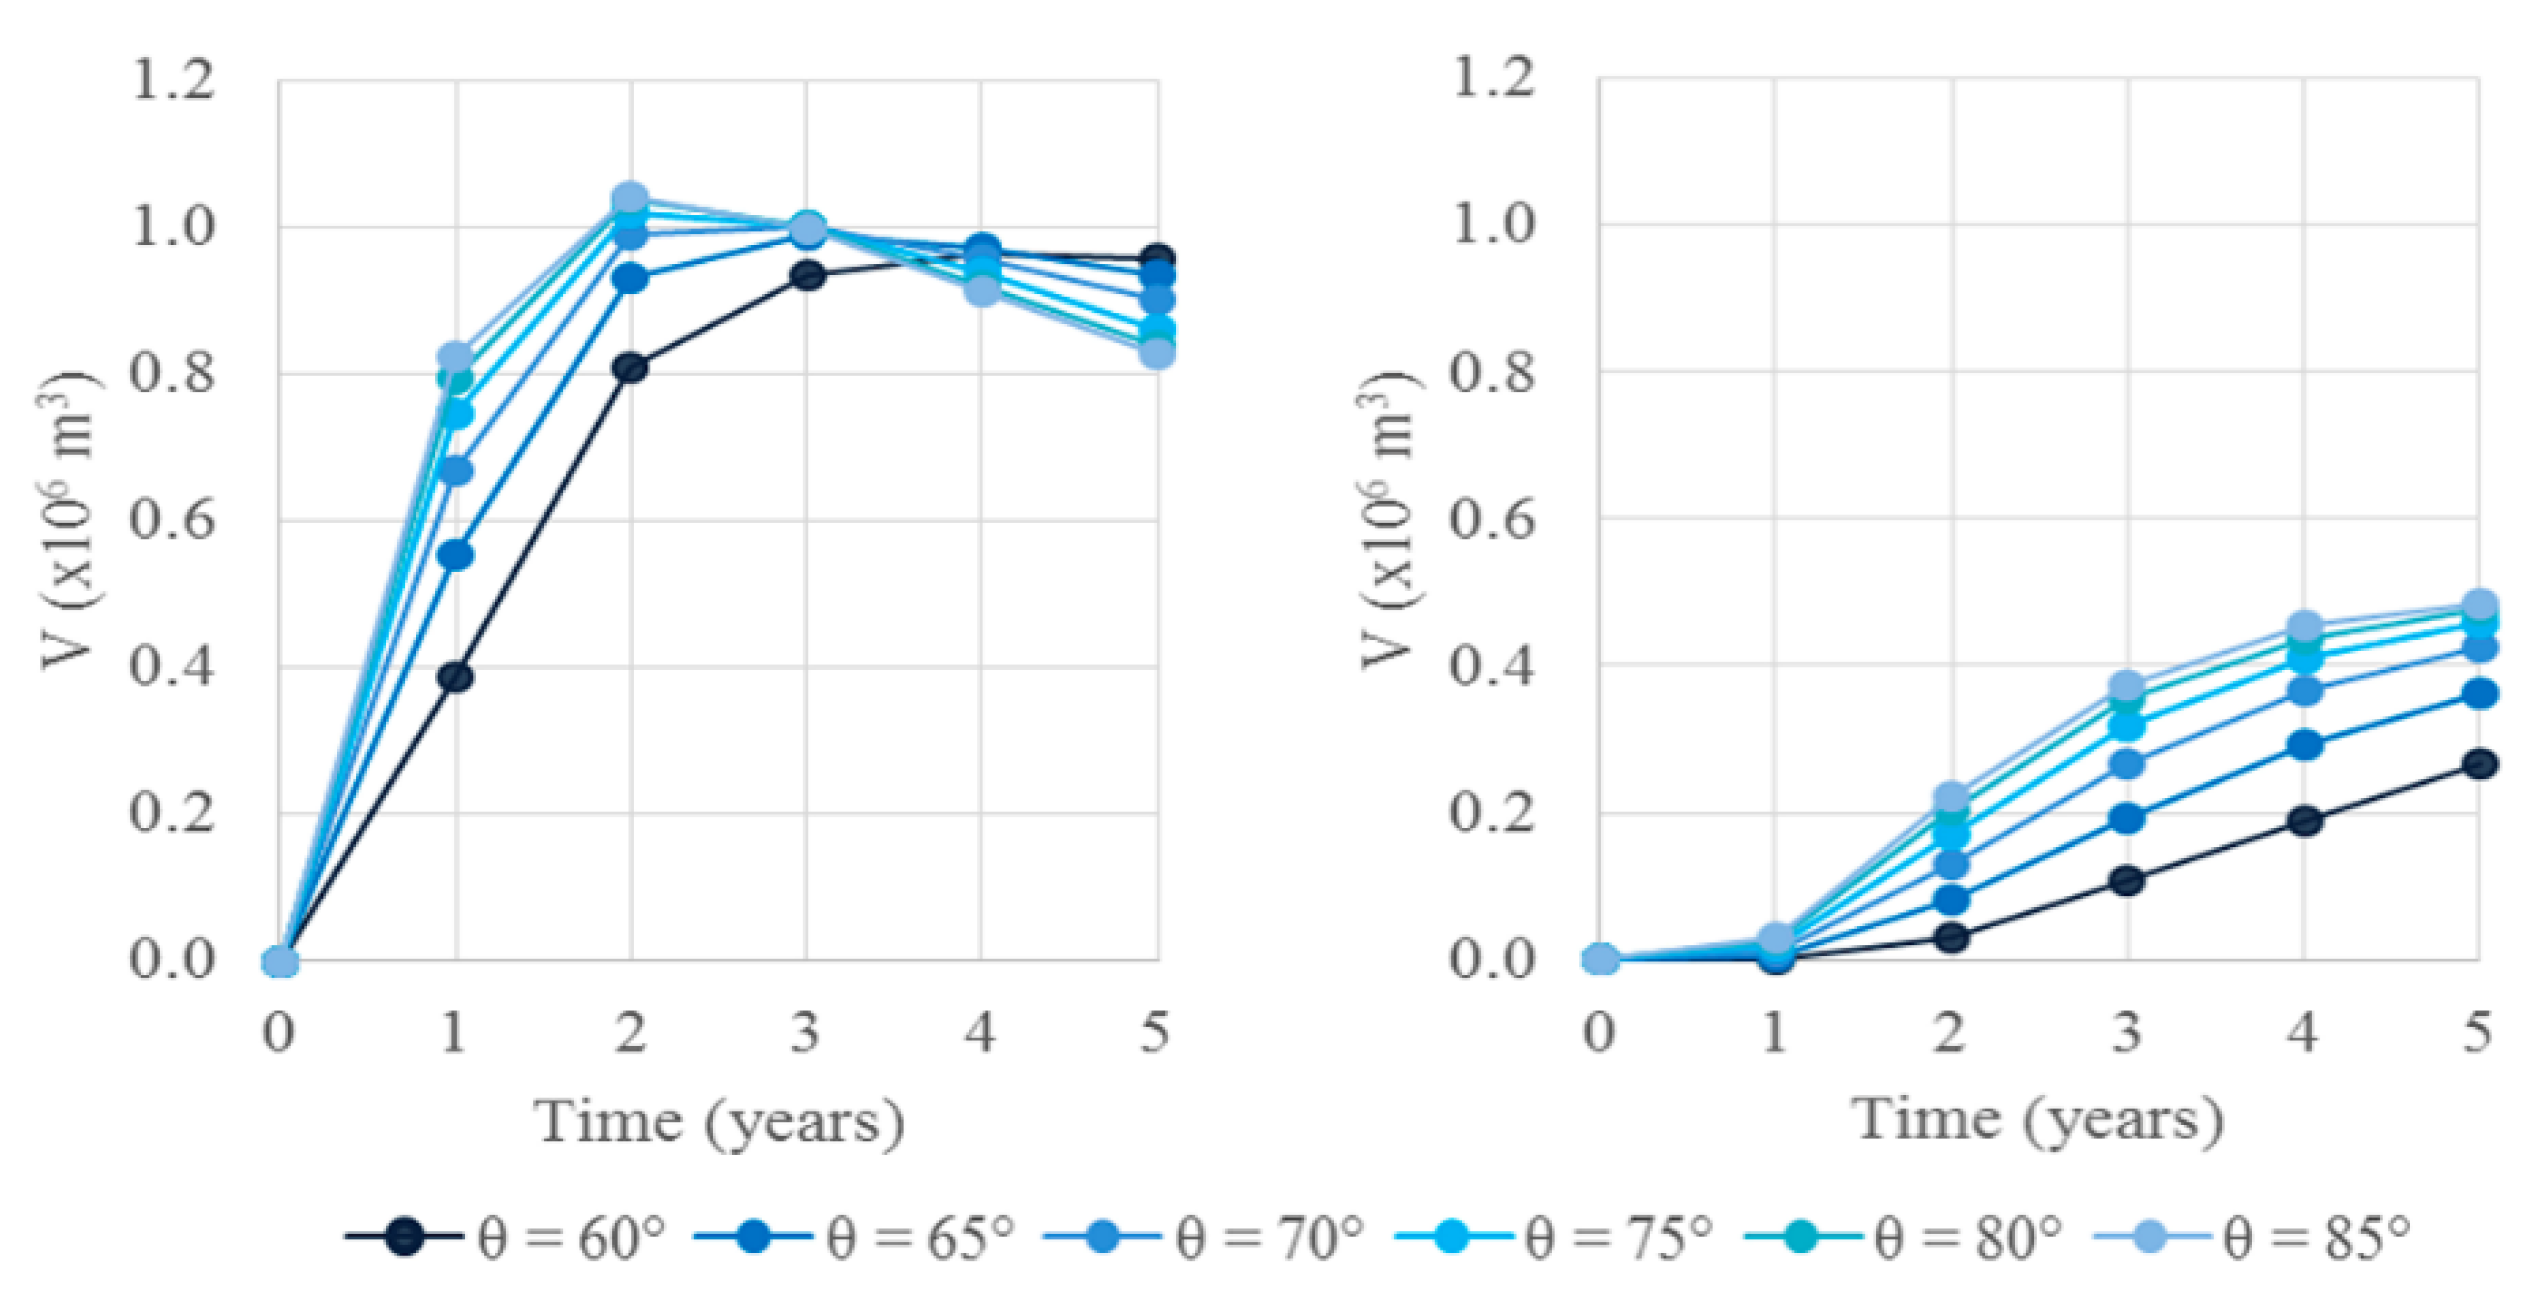
4.4. Evolution along Time
Two types of behavior were mainly observed in time. On the one hand, there were coastal stretches that successively increased the benefits of nourishment in the 5-year simulation period. On the other hand, some stretches reached a maximum benefit and then they registered a diminishing trend of the benefits over time. In general, the stretches located further downdrift successively increased the beneficial effect over the 5 years of simulation. The loss of benefit behavior of the nourishment at the end of some time occurred in the most updrift stretches and was mainly observed for the more energetic wave climates (
Figure 12).
5. Discussion
The evaluation of the longshore transport of the nourished sediments in 72 scenarios aimed to contribute to the understanding of sediments distribution in the coastal zone. In general, the artificial nourishment had a beneficial impact, both in terms of area gained and cross-shore profile robustness, represented by the gain in sediment volume. The nourishments presented significantly lower impacts at the most downdrift stretches, when compared to the stretches located closer to the intervention site. Sediments were mainly transported to the downdrift direction, but there were also some benefits at the region located updrift of the nourishment (Stretch 10). This conclusion was aligned with the results obtained by Beachler et al. [
43] through monitoring studies in the City of Delray Beach (Florida) from 1973 to 1994. During the monitoring period in Delray Beach, about 3.5 million cubic meters of sediments were placed, and, according to Beachler et al. [
43], in this same period a loss of sediments at the deposition site was observed, but those sediments were located on adjacent beaches, 3 km to the north and south of the fill area. Another example of where the updrift benefits of the nourishment are referred to is in the work of Slott et al. [
44].
The position of the artificial nourishment volumes was mainly located close to the intervention site, near the updrift end of the study area (stretches 8 and 9), along the 5 years of simulation. As the wave height increased, the sediments were distributed to more downdrift locations. Some transport of the nourished sediments to updrift could be observed in the scenarios with smaller θ angles, due to sediment transport processes related with wave refraction effects (
Section 2.1). Benedet et al. [
45] highlighted that the changes in the shoreline orientation and morphology induced by nourishment interventions play an important role in the hydrodynamics of the nourished area and consequently, on the sediment transport processes.
The longshore nourished sediments’ transport was a function of the wave climate and the boundary conditions of the modeled domain. It was difficult to predict the behavior trends of the nourished sediments. For the highest wave heights, higher nourished longshore sediments transport rates occurred. However, by setting a wave height, the trends due to wave direction were not completely clear and standard behaviors in the longshore transport of the nourished sediments were not identified. The boundary conditions of the modeled domain also affected the way the sediments were distributed, with impacts on the nourished longshore sediments transport rates. Campbell et al. [
46] presented an overview of the most significant nourishment programs across the U.S., concluding that the nourishment magnitudes across the country varies, decreasing from north to south on the Atlantic Coast, and from the Atlantic to the Gulf Coast. This variation detaches the influence of beach morphology and wave climate in the evolution of beach nourishment interventions.
6. Conclusions
The present study allowed us to identify the impact of the artificial nourishments on coastal morphology through the numerical LTC model. Knowledge about the morphology evolution of the coastal zones after artificial nourishments is fundamental, making it possible to evaluate the intervention performance and to support the decision process in the choice of the most adequate solution. The performance and longevity of artificial nourishments were dependent on several factors related to the design of the intervention, as well the physical sediment transport processes that occurred at the deposition site. The sediments were distributed by the wave action, currents, and winds. However, the characteristics of the incident wave action were considered the main modeling agent and the most important in evaluating sediment transport capacity.
From the present study, it was concluded that nourishment interventions present a positive impact on morphology evolution, reducing negative effects of shoreline retreat against the existing sediment deficit, as well as increasing the volume of sediments in the cross-shore profile, the performance and longevity of the intervention being a function of the wave climate and the boundary conditions of the modeled area.
Generally, it was verified that the sediments’ dispersion along the coastal zone was higher for the higher waves, which presented greater longshore sediment transport capacity. Regarding wave direction, it was observed that sediment distribution from updrift to downdrift was higher for waves propagating from directions close to perpendicular to the shoreline. This result can be attributed to refraction effects in the nearby boundaries of the nourished area, since the sediment deposition changed the local bathymetry and different coastline orientations led to different longshore sediment fluxes. The simulation of artificial nourishments in different types of beach, distinguished in this study by the boundary conditions of the modeled area, showed that the existence of sedimentary inputs on the coastal cell led to different impacts of the artificial nourishment. In the updrift area, when there was no sediment coming in (closed boundary), the artificial nourishment produced important benefits, verifying that the accomplishment of the artificial nourishment contradicts the retreat of the shoreline and increases the robustness of the cross-shore profile. In open beaches, assuming that erosion was not occurring, the artificial nourishment mainly increased the robustness of the cross-shore profiles.
In the present study, the artificial nourishment was evaluated for only one possible solution, with a specific filling volume, on a specific deposition location, and considering just one time interval for the intervention. However, a first step was achieved, giving important insights on modeling artificial nourishment behaviors and sediments’ permanence time in downdrift locations alongshore. Only higher waves justified the need for new nourishment after the 5-year simulated scenarios, due to the decrease of the nourishment effects on the intervention site.
The globally obtained results were in line with the monitoring works referred. Thus, in a very simple approach, the performed work allowed us to generically anticipate how sediments are spatially and temporally distributed after artificial nourishments interventions, depending on the type of beach and wave climate (wave heights and directions). Currently, LTC is being applied to real nourishment scenarios (over more complex and realistic beach configurations), in order to study the performance and longevity of artificial nourishments. For that, real bathymetry and topography, a recorded series of wave climate and existing coastal works on the study site, as groins and longitudinal revetments, are being considered. Simplifications are required to represent the real conditions in the model, but it is considered that a step forward on understanding artificial nourishments’ performance along time and along the shoreline has beem given by the model results presented in this study.
Author Contributions
Conceptualization, C.C.; methodology, C.C.; software, A.M.F.; validation, A.M.F. and C.C.; formal analysis, A.M.F.; investigation, A.M.F.; resources, C.C.; data curation, A.M.F. and C.C.; writing—original draft preparation, A.M.F.; writing—review and editing, C.C.; visualization, A.M.F.; supervision, C.C.; project administration, C.C.; funding acquisition, C.C. Both authors have read and agreed to the published version of the manuscript.
Funding
This research received no external funding.
Institutional Review Board Statement
Not applicable.
Informed Consent Statement
Not applicable.
Data Availability Statement
Acknowledgments
This work was financially supported by the project “Sandtrack-Beach nourishment: An integrated methodology for coastal management support”, POCI-01-0145-FEDER-031779, funded by FEDER, through COMPETE2020-POCI, and by national funds (OE), through FCT/MCTES.
Conflicts of Interest
The authors declare no conflict of interest.
References
- Antunes-Carmo, J. Processos Físicos e Modelos Computacionais em Engenharia Costeira; Imprensa da Universidade de Coimbra: Coimbra, Portugal, 2016; 452p, ISBN 978-989-26-1152-5. (In Portuguese) [Google Scholar]
- Housley, J. Justification for beach nourishment. In Proceedings of the 25th International Conference on Coastal Engineering, Orlando, FL, USA, 29 January 1996; 7p. [Google Scholar]
- Coelho, C. Riscos de Exposição de Frentes Urbanas para Diferentes Intervenções de Defesa Costeira. Ph.D. Thesis, University of Aveiro, Aveiro, Portugal, 2005; 404p. (In Portuguese). [Google Scholar]
- Hanson, H.; Brampton, A.; Capobianco, M.; Dette, H.H.; Hamm, L.; Laustrup, C.; Lechuga, A.; Spanhoff, R. Beach nourishment projects, practices, and objectives—A European overview. Coast. Eng. 2002, 47, 81–111. [Google Scholar] [CrossRef]
- Coelho, C.; Silva, R.; Veloso Gomes, F.; Rodrigues, L. Artificial nourishment and sand by-passing in the Aveiro inlet, PortugalNumerical Studies. In Proceedings of the 32nd International Conference on Coastal Engineering, Shangai, China, 21 January 2010; 12p. [Google Scholar]
- Van Heuvel, T. Climate of Coastal Cooperation, Part III—3-3-2: Sand Nourishment: A Flexible and Resilient, Adaptive Coastal Defense Measure; Coastal & Marine Union: Leiden, The Netherlands, 2011; pp. 164–166. [Google Scholar]
- Verhagen, H. Method for artificial beach nourishment. In Proceedings of the 23rd International Conference on Coastal Engineering, Venice, Italy, 29 January 1992; 12p. [Google Scholar]
- Tondello, M.; Ruol, P.; Sclavo, M.; Capobianco, M. Model tests for evaluating beach nourishment performance. In Proceedings of the 26th International Conference on Coastal Engineering, Copenhagen, Denmark, 29 January 1998; 14p. [Google Scholar]
- Marinho, B.; Coelho, C.; Larson, M.; Hanson, H. Short- and Long-Term Responses of Nourishments: Barra-Vagueira Coastal Stretch, Portugal. J. Coast. Conserv. 2018, 22, 475–489. [Google Scholar] [CrossRef]
- Clark, J. Coastal Zone Management Handbook, 1st ed.; Lewis Publishers: Boca Raton, FL, USA, 1995; 720p, ISBN 1-56670-092-2. [Google Scholar]
- NRC. Beach Nourishment and Protection; Nacional Research Council; The National Academies Press: Washington, DC, USA, 1995; 352p, ISBN 978-0-309-05290-0. [Google Scholar]
- ASBPA. Shore Protection Assessment: How Beach Nourishment Projects Work; Shore and Beach Preservation Association, US Army Corps of Engineers: Vicksburg, MS, USA, 2007. [Google Scholar]
- Schipper, M.; Vries, S.; Ruessink, G.; Zeeuw, R.; Rutten, J.; Gelder-Maas, G.; Stieve, M. Initial Spreading of a Mega Feeder Nourishment: Observations of the Sand Engine Pilot Project. J. Coast. Eng. 2016, 111, 23–28. [Google Scholar] [CrossRef]
- Kamphuis, J.W. Introduction to Coastal Engineering and Management; Advanced Series on Ocean Engineering; World Scientific: Singapore, 2000; Volume 16, 437p. [Google Scholar]
- Bodegon, M.J. Beach Nourishment: An Evaluation of Equilibration Design Methods. Cancún Beach Rehabilitation Project. Master’s Thesis, Delft University of Technology, Delft, The Netherlands, 2004; 149p. [Google Scholar]
- Hearon, G.; Ledersdorf, C.; Gadd, P. California Beach Restoration Study, Part II: Beach Nourishment; Department of Boating and Waterways and State Coastal Conservancy: Sacramento, CA, USA, 2002; 7p. [Google Scholar]
- Galofré, J.; Montoya, F.; Medina, R. Study of the Evolution of a Beach Nourishment Based on Computer Models. Trans. Built Environ. 1995, 9, 250–253. [Google Scholar]
- Dean, R. Beach Nourishment Theory and Practice; Advanced Series on Ocean Engineering; World Scientific: Singapore, 2002; Volume 18, 403p. [Google Scholar]
- CERC. Shore Protection Manual; U.S. Army Corps of Engineers, Coastal Engineering and Research Center, U.S. Government Printing Office: Washington, DC, USA, 1984; Volume 1. [Google Scholar]
- Shaeri, S.; Etemad-Shahidi, A.; Tomlinson, R. Revisiting longshore sediments transport formulas. J. Waterw. Port Coast. Ocean Eng. 2020, 146, 04020009. [Google Scholar] [CrossRef]
- Kamphuis, W. Alongshore sediment transport rate. J. Waterw. Port Coast. Ocean Eng. 1991, 117, 624–640. [Google Scholar] [CrossRef]
- Bayram, A.; Larson, M.; Hanson, H. A new formula for the total longshore sediment transport rate. Coast. Eng. 2007, 54, 700–710. [Google Scholar] [CrossRef]
- van Rijn, L.C. A simple general expression for longshore transport of sand, gravel and shingle. Coast. Eng. 2014, 90, 23–29. [Google Scholar] [CrossRef]
- Tomasicchio, G.R.; D’Alessandro, F.; Barbaro, G.; Musci, E.; De Giosa, T.M. Longshore transport at shingle beaches: An independent verification of the general model. Coast. Eng. 2015, 104, 69–75. [Google Scholar] [CrossRef]
- Murray, A. Reducing model complexity for explanation and prediction. Geomorphology 2007, 90, 178–191. [Google Scholar] [CrossRef]
- Murray, A.; Asthon, A. Instability and finite-amplitude self-organization of large-scale coastline shapes. Phil. Trans. R. Soc. A 2013, 371, 20120363. [Google Scholar] [CrossRef]
- Lima, M. Ferramenta Numérica de Análise do Impacto de Intervenções de Defesa Costeira na Evolução da Linha de Costa: Custos e Benefícios. Ph.D. Thesis, University of Aveiro, Aveiro, Portugal, 2018; 294p. (In Portuguese). [Google Scholar]
- Hanson, H.; Aarninkhof, S.; Capobianco, M.; Jiménez, J.; Larson, M.; Nicholls, R.; Plant, N.; Steetzel, H.; Stive, M.; Vriend, H. Modelling of coastal evolution on early to decadal time scales. J. Coast. Res. 2003, 19, 790–811. [Google Scholar]
- Coelho, C.; Silva, R.; Veloso-Gomes, F.; Taveira-Pinto, F. Potential impacts of climate change on NW Portuguese coastal zones. ICES J. Mar. Sci. 2009, 66, 1497–1507. [Google Scholar] [CrossRef]
- Larson, M.; Palalane, J.; Fredriksson, C.; Hanson, H. Simulating cross-shore material exchange at decadal scale. Theory and model component validation. Coast. Eng. 2016, 116, 57–66. [Google Scholar] [CrossRef]
- Dong, P.; Chen, H. A probability method for predicting the time-dependent long term beach erosion. Coast. Eng. 1999, 36, 243–261. [Google Scholar] [CrossRef]
- Wang, B.; Reeve, D.E. Probabilistic modelling of long-term beach evolution near segmented shore-parallel breakwaters. Coast. Eng. 2010, 57, 732–744. [Google Scholar] [CrossRef]
- Callaghan, D.P.; Ranasinghe, R.; Roelvink, D. Probabilistic estimation of storm erosion using analytical, semi-empirical, and process based storm erosion models. Coast. Eng. 2013, 82, 64–75. [Google Scholar] [CrossRef]
- Reeve, D.; Karunarathna, H.; Pan, S.; Horrilo-Caraballo, J.; Różyński, G.; Ranasinghe, R. Data-driven and hybrid coastal morphological preditiction methods for mesoscale forecasting. Geomorphology 2016, 256, 49–67. [Google Scholar] [CrossRef]
- Burcharth, H.; Hawkins, S.; Zanuttigh, B.; Lamberti, E. Environmental Design Guidelines for Low Crested Coastal Structures; Elsevier Science: Oxford, UK, 2007; 448p. [Google Scholar]
- Hanson, H.; Kraus, N.C. GENESIS: Generalized Model for Simulating Shoreline Chang—Report 1 Technical Reference, Technical Report CERC-89-19; Coastal Engineering Research Center, US Army Engineer Waterways Experiment Station: Vicksburg, MS, USA, 1989; 247p. [Google Scholar]
- Coelho, C.; Veloso-Gomes, F.; Silva, R. Shoreline coastal evolution model: Two Portuguese case studies. In Proceedings of the 30th International Conference, San Diego, CA, USA, 19 November 2006; pp. 3430–3771. [Google Scholar]
- Coelho, C.; Lima, M.; Veloso-Gomes, F. Relationship between cross-shore active profile and one-line shoreline evolution models performance. J. Coast. Res. 2013, 65, 2107–2112. [Google Scholar] [CrossRef]
- Coelho, C.; Narra, P.; Marinho, B.; Lima, M. Coastal management software to support the decision-makers to mitigate coastal erosion. J. Mar. Sci. Eng. 2020, 8, 37. [Google Scholar] [CrossRef]
- Silva, R. Avaliação Experimental e Numérica de Parâmetros Associados a Modelos de Evolução da Linha de Costa. Ph.D. Thesis, Faculdade de Engenharia da Universidade do Porto, Porto, Portugal, 2010; 488p. (In Portuguese). [Google Scholar]
- Ferreira, A.M. Evolução Morfológica do Litoral Após Alimentações Artificiais de Sedimentos. Master’s Thesis, University of Aveiro, Aveiro, Portugal, 2016; 126p. (In Portuguese). [Google Scholar]
- Coelho, C.; Ferreira, M.; Marinho, B. Numerical modelling of artificial sediment nourishment impacts. J. Coast. Res. 2020, 95, 209–213. [Google Scholar] [CrossRef]
- Beachler, P.; Mann, D. Long range positive effects of the Delray beach nourishment program. Coast. Eng. 1993, 359, 4613–4620. [Google Scholar]
- Slott, J.; Smith, M.; Murray, B. Synergies between adjacent beach-nourishing communities in a morpho-economic coupled coastline model. Coast. Manag. 2008, 36, 374–391. [Google Scholar] [CrossRef]
- Benedet, L.; Finkl, C.; Hartog, W. Processes controlling development of erosional hot spots on a beach nourishment project. J. Coast. Res. 2007, 23, 33–48. [Google Scholar] [CrossRef]
- Campbell, T.; Benedet, L. Beach nourishment magnitudes and trends in the U.S. J. Coast. Res. 2006, 39, 57–64. [Google Scholar]
| Publisher’s Note: MDPI stays neutral with regard to jurisdictional claims in published maps and institutional affiliations. |
© 2021 by the authors. Licensee MDPI, Basel, Switzerland. This article is an open access article distributed under the terms and conditions of the Creative Commons Attribution (CC BY) license (http://creativecommons.org/licenses/by/4.0/).


