Article

Evolution Trend Research of Global Ocean Power Generation Based on a 45-Year Scientometric Analysis

1
College of Ocean Science and Engineering, Shanghai Maritime University, Shanghai 201306, China
2
College of Safety Science and Engineering, Liaoning Technical University, Fuxin 125000, China
3
College of Transport & Communications, Shanghai Maritime University, Shanghai 201306, China
4
Logistics Engineering College, Shanghai Maritime University, Shanghai 201306, China
*
Author to whom correspondence should be addressed.
J. Mar. Sci. Eng. 2021, 9(2), 218; https://doi.org/10.3390/jmse9020218
Submission received: 6 January 2021 / Revised: 14 February 2021 / Accepted: 16 February 2021 / Published: 19 February 2021
(This article belongs to the Section Ocean Engineering)

Abstract

:
Since 1973, studies have explored ocean power generation from different perspectives. However, in the past 45 years, few studies have attempted to comprehensively review the existing studies on ocean power generation using wave energy, tidal current energy, ocean thermal energy, salinity gradient energy, bio-mass energy, and gas hydrates. In this study, we collected 5262 studies published from 1973 to 2018 for scientometric visualization analysis and drew a knowledge map of the ocean power generation field. The results show that the most important contributions to the research of ocean power generation mainly came from the United States, China, Britain, Italy, Spain, Japan, Norway, Germany, France, and Denmark. Ocean power generation research is mainly divided into two stages. From 1973 to 2007, there were relatively few studies and no obvious hot topics. From 2008 to 2018, the knowledge fields mainly focused on ocean biomass power generation, the exploitation of natural gas hydrates, the utilization of wave energy and tidal energy, the research and optimization of energy generators, the storage and management of ocean energy, and numerical simulations of marine climates. In addition, the joint utilization of wind energy and wave energy is also a current research topic of interest, including joint assessment of the two energy potentials, the research and development of equipment, and numerical simulations of joint power generation projects.

1. Introduction

Urban expansion and the development of industry have brought a lot of problems [1,2]. One of them is the environmental, economic, and cost issues caused by the current dependence on fossil energy. Therefore, the exploitation and utilization of clean energy has gradually become the current development trend. At present, onshore wind energy and solar energy have been successfully applied on land. Compared with land, the ocean has more available resources, including organisms living in seawater; chemical elements and fresh water dissolved in seawater; energy generated by seawater movement, such as waves, tides, and tidal currents; heat stored in seawater; resources contained in deep seabeds, particularly various solid minerals, such as gas hydrates; pressure differences formed in deep seawater and the salinity difference between seawater and fresh water. How to obtain clean energy from the ocean, which covers more than 70% of the Earth, has become a focus of the energy industry. The clean natural energy in the ocean mainly includes wave energy, tidal current energy, ocean thermal energy, salinity gradient energy, bio-mass energy, and gas hydrates. According to measurements and calculations, the theoretical tidal energy potential (including both tidal stream and tidal range) was calculated as 26,000 (TW·h)·a−1. The theoretical wave energy potential is about 32,000 (TW·h)·a−1. The global resource potential of ocean thermal energy conversion is huge, with a theoretical potential of about 44,000 (TW·h)·a−1. Ocean salinity gradients have an estimated technical potential of about 1650 (TW·h)·a−1 (a−1 indicates the annual average). These has great potential for development [3]. Ocean energy is not only clean, but also has the advantage of predictability. For instance, tides caused by changes of lunar gravity can be predicted in advance, and the operation plans of power generation system can be made in advance according to the tide forecast. The ocean current map can be obtained by satellites in real time to ensure the stable operation of the current power generation system. The waves are constantly fluctuating up and down and surging in an indefinite direction, and the water level also is not fixed. Although these conditions make wave energy seem to be a kind of disordered, scattered, discontinuous, low-speed, unstable and uncontrollable energy. In fact, it has a certain inherent law. By monitoring and predicting environmental factors and selecting appropriate technology, wave energy can be obtained and utilized stably [4,5,6]. This predictability is helpful to prevent the occurrence of large-scale blackouts.
Due to the importance of ocean energy, the exploitation and utilization of ocean clean energy has aroused the extensive attention of governments, international organizations, and research institutions. Therefore, a great deal of research articles about ocean power generation (OPG) have been published [7,8]. Some of them are published in the form of a review. These review articles typically focus on a topic or a knowledge unit in the field and provide a knowledge base for the research of OPG. However, a limited article review cannot clearly show the network, structure, interaction, crossover, evolution, and other implicit relationships among the knowledge units in OPG research. These complex relationships breed new knowledge, which has an important guiding value for the mining of research hot topics and frontiers in the OPG field. In addition, the dynamic attributes of the huge knowledge scope and its knowledge units bring challenges to researchers’ information mining work. For global OPG research, how have the research themes (knowledge groups) evolved in the past 40 years? How are the themes related? Which studies have played a key turning point or milestone roles? What are the latest frontiers of research? These problems are difficult to accurately identify and explore. However, to grasp the research field systematically and improve the efficiency of scientific research is important.
Scientometrics originated in the early 20th century and has developed into a visualization analysis method based on collaboration and co-citation networks [9,10]. As an analysis method of contents, scientometric analysis can liberate researchers from the interpretation of massive articles bodies through scientific identification, comprehensive statistics, and systematic unscrambling, which has become increasingly popular among researchers worldwide in recent years [11,12,13,14,15,16,17,18,19,20]. By analyzing the articles information, the existing studies have made great achievements in many fields. However, these studies mainly focused on the mining of research hot topics and did not fully consider the distribution characteristics of research hot topics in time.
Based on previous research results, on the one hand, we considered making a comprehensive field analysis from more aspects, such as the articles, journals, authors, institutions, countries (region), collaboration, citations, evolution; on the other hand, research hot topics were separately analyzed from two periods according to the characteristics of time distribution, which can more scientifically and truly reflect the evolution trend of the field research.
In this research, 46 years of OPG research documents were selected from the Web of Science database. With the help of visual scientometric analysis tools (CiteSpace and VosViewer), we quantitatively analyzed the influence of the articles, authors, journals, institutions, and other factors of knowledge body on the development of OPG research. At the same time, we drew knowledge maps, clarified the relationship between the knowledge base and themes, and mined the overall trends, frontiers, and hot spots of OPG. This is a new attempt to study the international OPG framework. Our scientometric analysis contributes to the OPG research in several ways: (1) to overview the OPG researches published from 1973 to 2018; (2) to analyze the overall research status of OPG from countries (regions), institutes, journals, authors, and documents; (3) to acquire the main topics of OPG research and their evolution process in time; (4) to recognize frontiers and future directions in OPG research; and (5) to propose new and comprehensive knowledge maps of OPG research. In short, for scholars and institutions in the OPG field, our research can grasp the direction of technological development, identify technological innovation opportunities, and help make further outstanding achievements. For enterprises, it is helpful to evaluate and predict business prospects and take the lead in future applications. For countries, this study will help governments to find the appropriate energy technology for the locale, and then determine a future energy development strategy.

2. Data and Materials

In this study, all data were taken from the Web of Science (WOS) article index database, which is the largest comprehensive platform for integrating academic information in the world and covers the most disciplines. Its core collection is an internationally recognized database reflecting the level of scientific research. The WOS core collection contains several important Index types, including the Science Citation Index Expanded (SCIE), Social Science Citation Index (SSCI), Arts & Humanities Citation Index (A&HCI), Conference Proceedings Citation Index-Science (CPCI-S), Conference Proceedings Citation Index-Social Science & Humanities (CPCI-SSH), Index Chemicus (IC), and Current Chemical Reactions (CCR). In the scientometric analysis of other fields, the main data sources are SCIE and SSCI; however, considering that there are many valuable articles of OPG research published in conference articles, in this research, SCIE, SSCI, CPCI-S, and CPCI-SSH were chosen as our sources of data collection.
To make a systematic analysis of the OPG field, all relevant and reliable publications are necessary. Publications from 1973 to 2018 indexed by SCIE, SSCI, CPCI-S, and CPCI-SSH were selected to set up the database for processing, and the types included Articles, Proceedings, Articles, and Reviews. Referring to the settings of traditional scientometric analysis, the language type of publications was also set to be in English. In addition, the topic words search was conducted with these constraint terms: “ocean or marine or sea or oceanic” and “power generation or electricity or energy or power”, and the research domains were set to energy fuels (or green sustainable science technology). The full search criterions were as follows: TS = ((ocean OR marine OR sea OR oceanic) AND (power generation OR electricity OR energy OR power)) AND LANGUAGE: (English) AND DOCUMENT TYPES: (Article OR Proceedings Article OR Review) AND RESEARCH DOMAINS: ENERGY FUELS OR GREEN SUSTAINABLE SCIENCE TECHNOLOGY AND Timespan: 1973–2018 AND Indexes: SCI-EXPANDED, SSCI, CPCI-S, CPCI-SSH. As a result, a total of 5262 publications were obtained and used in this study. The search date was finished at 16 June 2019.

3. Methodology and Software

The method applied in this research was scientometric analysis [10,21], which is a visual technique that can quantitatively display the structure factors and dynamic evolution of a knowledge domain [22]. The analysis tools used in this study were CiteSpace and VOSviewer, which are the scientific visualization software based in Java. CiteSpace was developed by Chaomei Chen at Drexel University and VOSviewer was developed by Nees Jan van Eck and Ludo Waltman at Leiden University [10,23]. Aiming to analyze the OPG research from various aspects, including basic indicators, countries (institutions, journals, and authors) collaborations, core research groups, high output and high-impact authors, key research topics, and future directions, the following methods were applied.

3.1. Statistical Analysis of Basic Characteristics

Everything has various characteristics to express its essential attributes. The article mainly includes external characteristics, such as the Author, Author’s Institution, Journal, Country, and Publication Time, as well as internal characteristics, such as the Title, Keywords, Disciplines, etc. Statistical analysis can explain the overall development and evolution of the discipline field from the perspective of time and space through quantitative statistics and analysis of these article characteristics.

3.2. Term Frequency Analysis

Term frequency analysis is the statistics and analysis of the number of important words appearing in the title, abstract, and body. Typically, important words whose frequency exceeds a given threshold are called high-frequency words. As high-frequency words appear repeatedly in the article of the discipline, the research topics embodied by these words are likely to become a research hot topic in this field. Therefore, to a great extent, high-frequency words reflect the research foci and reveal the research hot topics in the field. In addition, statistical analysis of the distribution characteristics of high-frequency words in time series, including the differences of high-frequency words in each year, the frequency changes, and occurrence ranking changes in each year, can reveal the temporal changes and development trends of research topics.

3.3. Cluster Analysis

Cluster analysis is a method of classifying things according to the characteristics of the thing itself, which is to achieve “birds of a feather flock together”. Based on the premise that there is more or less similarity among the research objects, cluster analysis first analyzes each variable index of the research objects, to determine specific statistical parameters and uses these statistical parameters to calculate the similarity degree between each variable index. According to the calculation results, the similarly large variables were aggregated into one class. The results of cluster analysis can reflect the potential differences and connections in massive data.

3.4. Analysis of Citation Relations

If two (or more) studies are cited by one or more published study at the same time, it is said that the two studies (or more) constitute a co-citation relationship. The number of studies that cited two (or more) studies at the same time is called the co-citation intensity. These articles with a higher co-citation intensity indicate that they are closely related and have similar content. Based on this, clustering analysis can be used to mine the common topics of similar studies. The co-citation relationship of studies will change with time. Through the study of the co-citation network, we can explore the development and evolution of a discipline [24,25].

3.5. Social Network Analysis

“Social network” is a collection of social actors and their relationships, which is mainly used to measure and describe the relationships between social actors (people or organizations, etc.) [26]. In the scientific visualization analysis, the points in social network represent the research subjects (author, article, journal, keywords, etc.), and “network” indicate the collection of the relationship between nodes. Each point in the network is not completely independent and has different degrees of relationship with other points. By establishing models that can express these relationships, quantitative research of network relationships can be achieved, so as to draw a network knowledge map. The map can show the characteristics of network structure (the collaboration between authors is close or far), important nodes (important authors, journals, and articles), and distribution of sub-networks (research groups), etc. The main measurement indicators include density, centrality, ties strength, position, and content. Centrality is a quantitative index to measure the “power” of nodes in the network (i.e., how centrally a node is in the network) [27]. Between Centrality indicates the times of a node act as a bridge on the shortest path of the other two nodes. The higher the between centrality of a node, this node is more important. Without it, the interconnection between many nodes may increase many difficulties.

4. Results and Discussion

4.1. Temporal Distribution Analysis of Global OPG Research

A total of 5262 articles researching on the OPG field from 1973 to 2018 were collected from the WOS core database. The number of annual publication and the total of cited times are shown in Figure 1. As can be seen from the figure, only a small number of studies were published from 1973 to 1990, and the research topics are also mainly discussions of existing OPG stations, and the future potential and prospects of OPG [28,29,30,31]. From 1991 to 2006, the number of studies showed a slow upward trend from 22 (0.42%) to 69 (1.31%). During this period, the research mainly focused on the utilization of wave energy, wind energy and marine current energy, and the potentiality of marine biomass energy [32,33,34,35,36,37,38,39,40,41,42]. The article of OPG research broke through 100 (n = 136, 2.58%) for the first time in 2007, and the cited times also exceeded 500 times (n = 619). In the following 10 years, the number of studies and times cited demonstrated a rapid growth trend. In 2018, the number of articles and cited times reached 706 (13.42%) and 17,150, respectively. We propose the reason is that the world has arrived at a consensus that the excessive carbon dioxide emissions and the sharp consumption of non-clean energy, such as oil, may bring great harm and potential threat to human survival. Therefore, various countries have begun to seek clean energy and have formulated and promulgated corresponding regulations and policies to promote the development of clean energy. For instance, in February 2005, the “Kyoto Protocol” signed by 84 countries came into effect, becoming one of the new driving forces for the development of clean energy in various countries, particularly in Europe [43]. In August 2005, the United States issued the U.S. energy policy act, which was the first comprehensive energy policy since 1992. The act clearly states that it is necessary to encourage the research, development, and use of clean energy [44]. By September 2005, 34 developed countries and 14 developing countries in the world had introduced different policies to promote the development of clean energy. A total of 32 of them had implemented a feed-in tariff, that is, to purchase clean energy power at a price higher than that of conventional fossil energy generation. At the same time, 35 developed countries and 100 developing countries set national clean energy development goals [45]. There are huge clean energy resources in the ocean, which have the characteristics of ultra-low carbon emissions. Therefore, the research on ocean energy has attracted more researchers from different countries. Due to the delay of policy effects, and the time required for manuscript review and publication, the number of studies in the OPG field has also shown a rapid growth since 2007. In addition, in October 2003, the “Berlin Declaration on Open Access to Knowledge in the Sciences and Humanities” launched by the Max Planck Society extended the object of open access to research article. In this way, many OA articles were added in the WOS database for readers to read and cite. We propose that this was one of the driving factors for the increase of citations.
To know more about the changes in different countries’ attention to OPG over time, we conducted further statistical analysis on the top three countries with the number of studies, and the results are shown in Figure 2. OPG research was first carried out in the United States, where Anderson published an article on solar energy to discuss the utilization of offshore solar energy [46]. Only a few related studies were published before 1990 (n = 21). From 1991 to 2006, the number of publications showed a slow growth trend. During this period, a total of 143 studies were published. However, since 2007, the research articles published by the United States have been growing rapidly, with a total of 755 studies published by 2018. The United Kingdom began to publish OPG studies in 1977, but only a small number were published until 2006—a total of 88. Since 2007, the situation changed, and the publications showed a steady growth trend. By 2018, 503 studies had been published in 12 years. In China, the research on OPG started relatively late. From 1994 to 2006, only 35 studies were published. However, since 2007, the number of studies began increasing rapidly. In 2009, the number of annual publications exceeded the United Kingdom, and also exceeded the United States in 2015. Since 2017, China has ranked first in the world in the number of articles published each year. In addition, by 2018, the total of studies published by China ranked second in the world, which may result from the government encouragement and financial support for scientific research.

4.2. Global Spatial Distribution of OPG Research and National Collaboration

According to the statistical analysis, from 1973 to 2018, a total of 114 countries (or regions) published 6545 articles in the OPG field. As some of them were jointly published by several countries, we calculated the article once in each country. The results showed that a small number of countries/regions published most of the studies in the field, and the top 30 countries (or regions) published 5805 studies, accounting for about 88.69% of the total. Figure 3 shows the global spatial distribution of OPG research. The color from light yellow to dark brown indicates that the number of studies is from less to more, and the red node represents the specific number in the country. The OPG research was mainly concentrated in North America, Europe, East Asia, West Asia, and Australia. Except for the United States, Brazil, Canada, China, and Australia, most of the other countries (or regions) are located in Europe, such as Britain, Italy, Spain, Norway, Germany, France, Denmark, Sweden, etc. These countries have long sea lines and highly developed industries, and they attach great importance to environmental protection.
The United States has the largest number of publications in the OPG field among all countries (n = 919), and it is also the largest node in the spatial distribution map. As can be seen from Table 1, the studies from the United States also had the highest citations. China published 730 studies, ranking second. Next was the United Kingdom. If only the island of England is counted, about 424 studies were published. However, due to the high number of studies published by Wales, Scotland, and Northern Ireland, which belong to the UK, the United Kingdom ranked third in the total (n = 591). These were followed by Italy, Spain, Japan, Norway, Germany, France, Denmark, and the other countries (regions). If we look at European countries as a whole, the number of articles published accounts for almost half of the world total, ranking first in the world.
The research influence of a country (or region) usually needs to be considered from two aspects, one is the number of studies and the other is the citations. Generally, a country (or region) that published more studies has more citations. However, the number of studies and the total citations are not completely positively correlated, and the total number of citations cannot truly reflect a country’s influence in the field. Therefore, the average citation of studies was analyzed. Table 1 shows the citations and average citations in the top 10 countries with publications. In the field of OPG, the United States had the most publications (n = 919), and the total citations (19,189) were also the most; however, the average citations ranked fourth (20.88). Many researchers in the United States are engaged in the research of different OPG technologies. Some of the technologies are very advanced, and have published many high-level articles, which are highly cited. In those areas, the technology is relatively weak, and the level of articles was relatively low, which affects the average impact factor. China ranked second in the number of publications (n = 730), third in the total number of citations (6230), and ninth in the average citations (12.58). This shows that there are many scholars engaged in OPG research in China; however, because it started late, the high-level articles published are relatively few, and the influence is weak. The number of British publications ranked third (n = 593), and the total and average citations (14575, 24.58) ranked second. Compared with the United States, the UK has fewer researchers in the field of OPG, but due to its early start and advanced technology, it has published more high-level articles and gained higher influence. There are a total of 10 countries with an average citation of more than 15, which are all European countries except the US. This shows that European countries have paid more attention to clean energy. After a long period of research, the level ranked in the forefront of the world, and the research results have a high impact. The number of articles published in Japan ranked sixth; however, most of its articles are published in academic conferences, and so the average citation is relatively low. We made a further analysis of the journals including articles from these 10 countries. The screening of the journals met two conditions. First, the number of articles published in this journal in each country was greater than or equal to 5, which indicates that the journal was the main published journal. Second, the impact factor of the journal was greater than or equal to 5. The analysis results are shown in Table 2. The countries that published more than 100 high-level articles were the United Kingdom, the United States, China, and Spain, which to an extent reflects their international influence in the OPG field. This is consistent with the results of our previous citation analysis.
To study the activeness of different countries in the OPG field, we introduced centrality to express the central degree of a node in the whole network. As shown in Table 1, the OPG research in the United States and the United Kingdom had a high between centrality, which means that the two countries play the important roles in the OPG field. As a bridge, they usually relate to the information exchange and interactions between different countries. China ranked second in the number of studies, but it had a lower between centrality compared with the two countries, which means that China may only play a role in connecting certain countries.
Through the analysis of country/region distribution, the distribution of global research forces in this field can be mastered, which provides a reference to conduct scientific research investigation and collaboration. After analyzing the number of national publications, we conducted a network analysis of the cooperative relations between different countries with more than 10 publications, which can reflect the exchange and communication of the subject to a certain extent. Figure 4 shows the collaboration network between different countries with more than 10 publications. Here, the size of nodes represents the number of studies, and the links between them reflect the strength of collaboration.
Figure 4a shows the global collaboration relationships in the field of OPG. In the global scope, three countries (the United States, China, and the United Kingdom) play the bond roles, connecting other countries (regions) to establish a global collaboration network of OPG research. Figure 4b shows the international collaboration relationships of the United States. The United States had collaborations with almost all countries (regions) in the world, and the United Kingdom and China had the strongest collaborations. Figure 4c shows China’s international collaboration relationship. China’s main collaborators, except for Australia, the United States, Canada, and the United Kingdom, are mainly gathered in Asia, such as Japan, South Korea, Singapore, India, Malaysia, and other countries (regions), which indicates that China plays a local bond role in the global collaboration network. Figure 4d shows the UK’s international collaboration relationships. The UK has strong collaboration relations with Australia, the United States, Canada and China. In addition, the UK has more collaborators gathered in Europe, such as Germany, France, Spain, the Netherlands, Italy, Denmark, Switzerland, Norway, etc., which mean that the UK plays an important local bond role in Europe. These results show that, as a global central bond, the United State links the two local core bonds (the United Kingdom and China), constructing a global collaboration network of the OPG field. In addition, the study also found that countries (regions) with larger international collaboration are also more productive. For instance, in the global collaboration network, the three countries with the largest strength of collaboration were the United Kingdom (342), China (235) and the United States (327), and their numbers of publications were also the top three in the world.
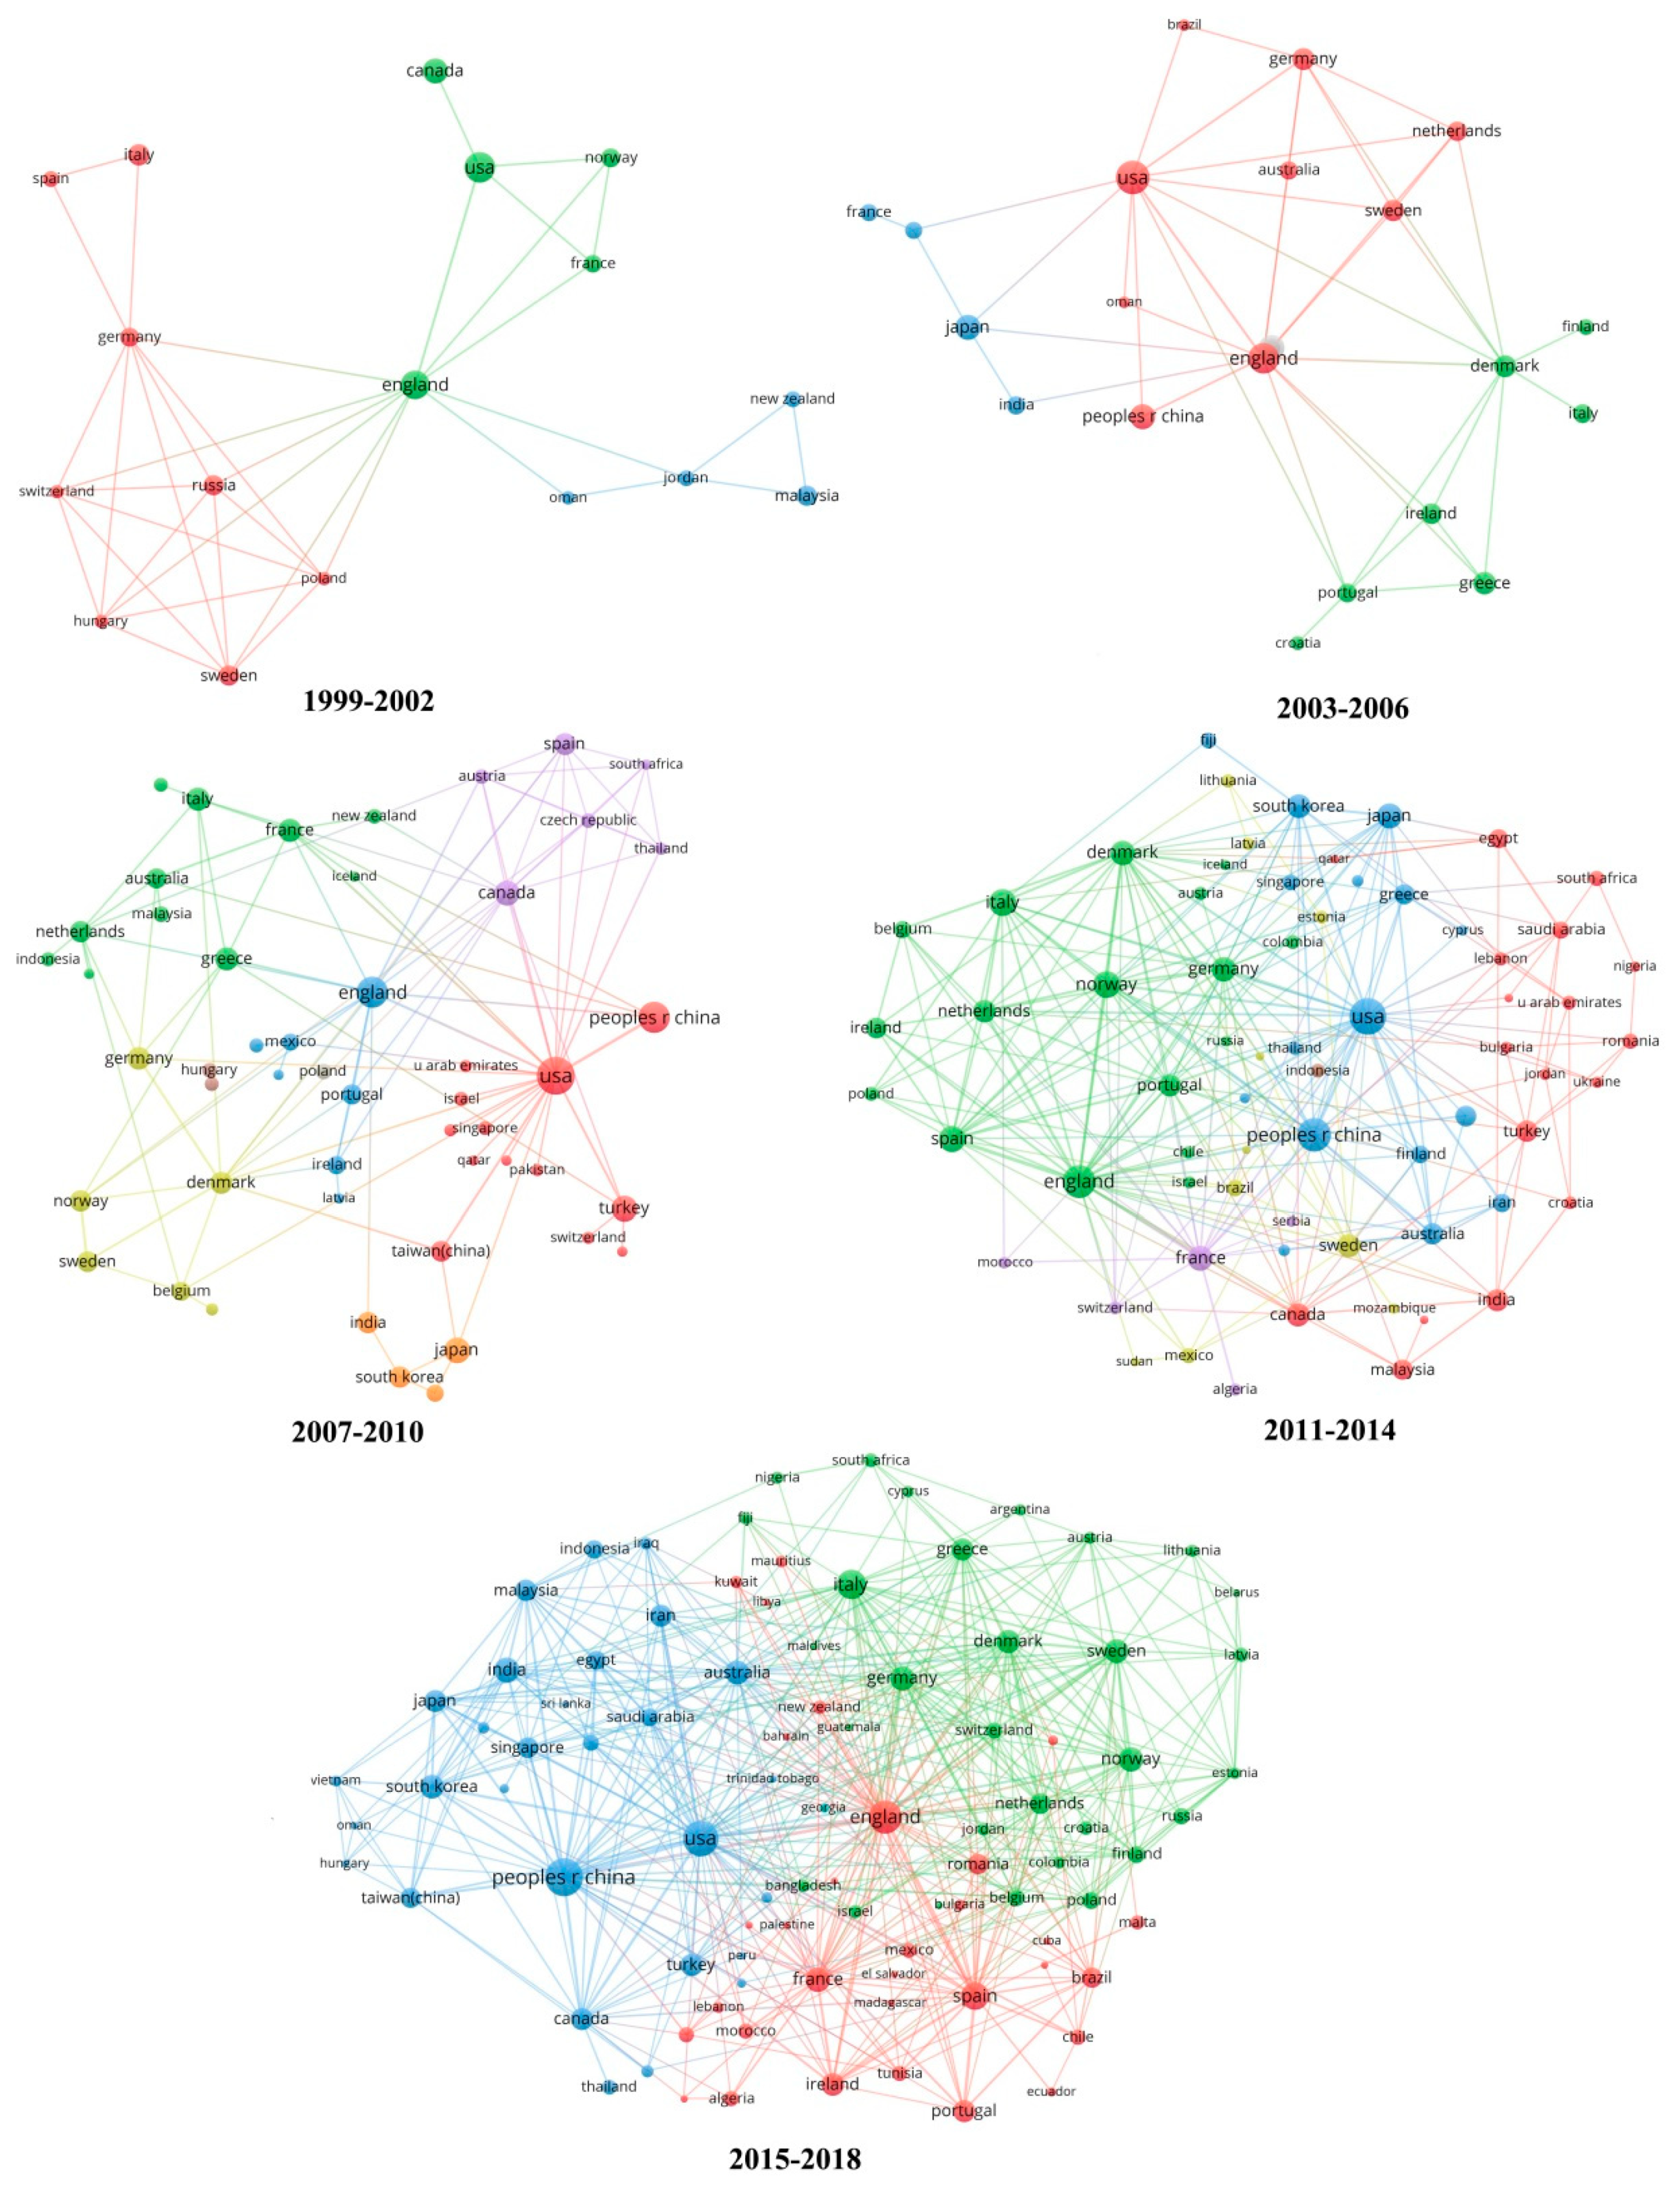
To further explore the cooperation relationships between countries, we analyzed the dynamic evolution of the global cooperation network. The results are shown in Figure 5. As only a small number of relevant studies were published from 1973 to 1998, the cooperation between countries can be ignored. Starting with 1999, we made an analysis of the national cooperation network at intervals of four years. It can be seen from the figure that from 1999 to 2010, the UK was at the center of the national cooperation network. There were many cores in 2011–2014. In 2015–2018, the United States began to become a bridge between Britain and China. This shows that European countries have a long history in OPG research and more developed technologies. Therefore, they were in the central position of the cooperation network for a long time. China and the United States started relatively late but developed rapidly due to the greater support from the government.

4.3. Analysis of Hot Topics and Evolution Trends in the OPG Field

The title, abstract, and key words of scientific and technological article are often the core content used to explain or express the article. By analyzing the association and combination of the core words extracted from them, we can determine the microstructure and internal correlations of the research field. First of all, by calculating the frequency of the core words in the article, as well as the time distribution and change trends of these words, we can determine the research and development trends of this field. In addition, by analyzing the frequency of two core words appearing in the same article, we can form a co-word network composed of these word pairs. Through clustering analysis of these words of the co-word network, we can mine the changes of the topic structure represented by these words and identify the research hot topics and frontiers. We used the co-word analysis method to analyze the occurrence and co-occurrence frequencies of core words extracted from the titles, abstracts, and keywords of the OPG article, and we constructed the core words co-occurrence map with the visualization method, which clearly shows the frequency and clustering relationships of the core words. As shown in Figure 5, each node represents a core word, and the size of the nodes represents the frequency of their occurrence.
If two nodes (core words) appear in the same article, the connection between them is established, and the links between them represent the strength of co-occurrence. The thicker the line is, the higher the frequency of co-occurrence of the core words is. As can be seen from the above, the development of OPG can be divided into two stages: the stable period (1973–2007) and the rapid rise period (2008–2018). In the stable period, only a small number of studies were published, while in the rapid rising period, the number of studies increased year by year. We believe that the attention and content of two periods of OPG research are different; thus, the co-word analysis was carried out for the two periods separately. Figure 6 and Figure 7 show the co-occurrence network of core words with more than five occurrences in the two periods. As shown in Figure 6, during 1973–2007, there were not many high-frequency core words in the studies, and the number and frequency of co-occurrence word pairs were not high. This indicates that the OPG research had relatively low attention, and there was no obvious focused topic. We note that, during this period, under the background of global warming, OPG research mainly sought new energy sources with low carbon emissions from the ocean. The research mainly focused on the utilization of wave energy and the development, optimization, and simulation of various ocean energy turbines. At the same time, they also began to pay attention to the potential of wind and solar energy.
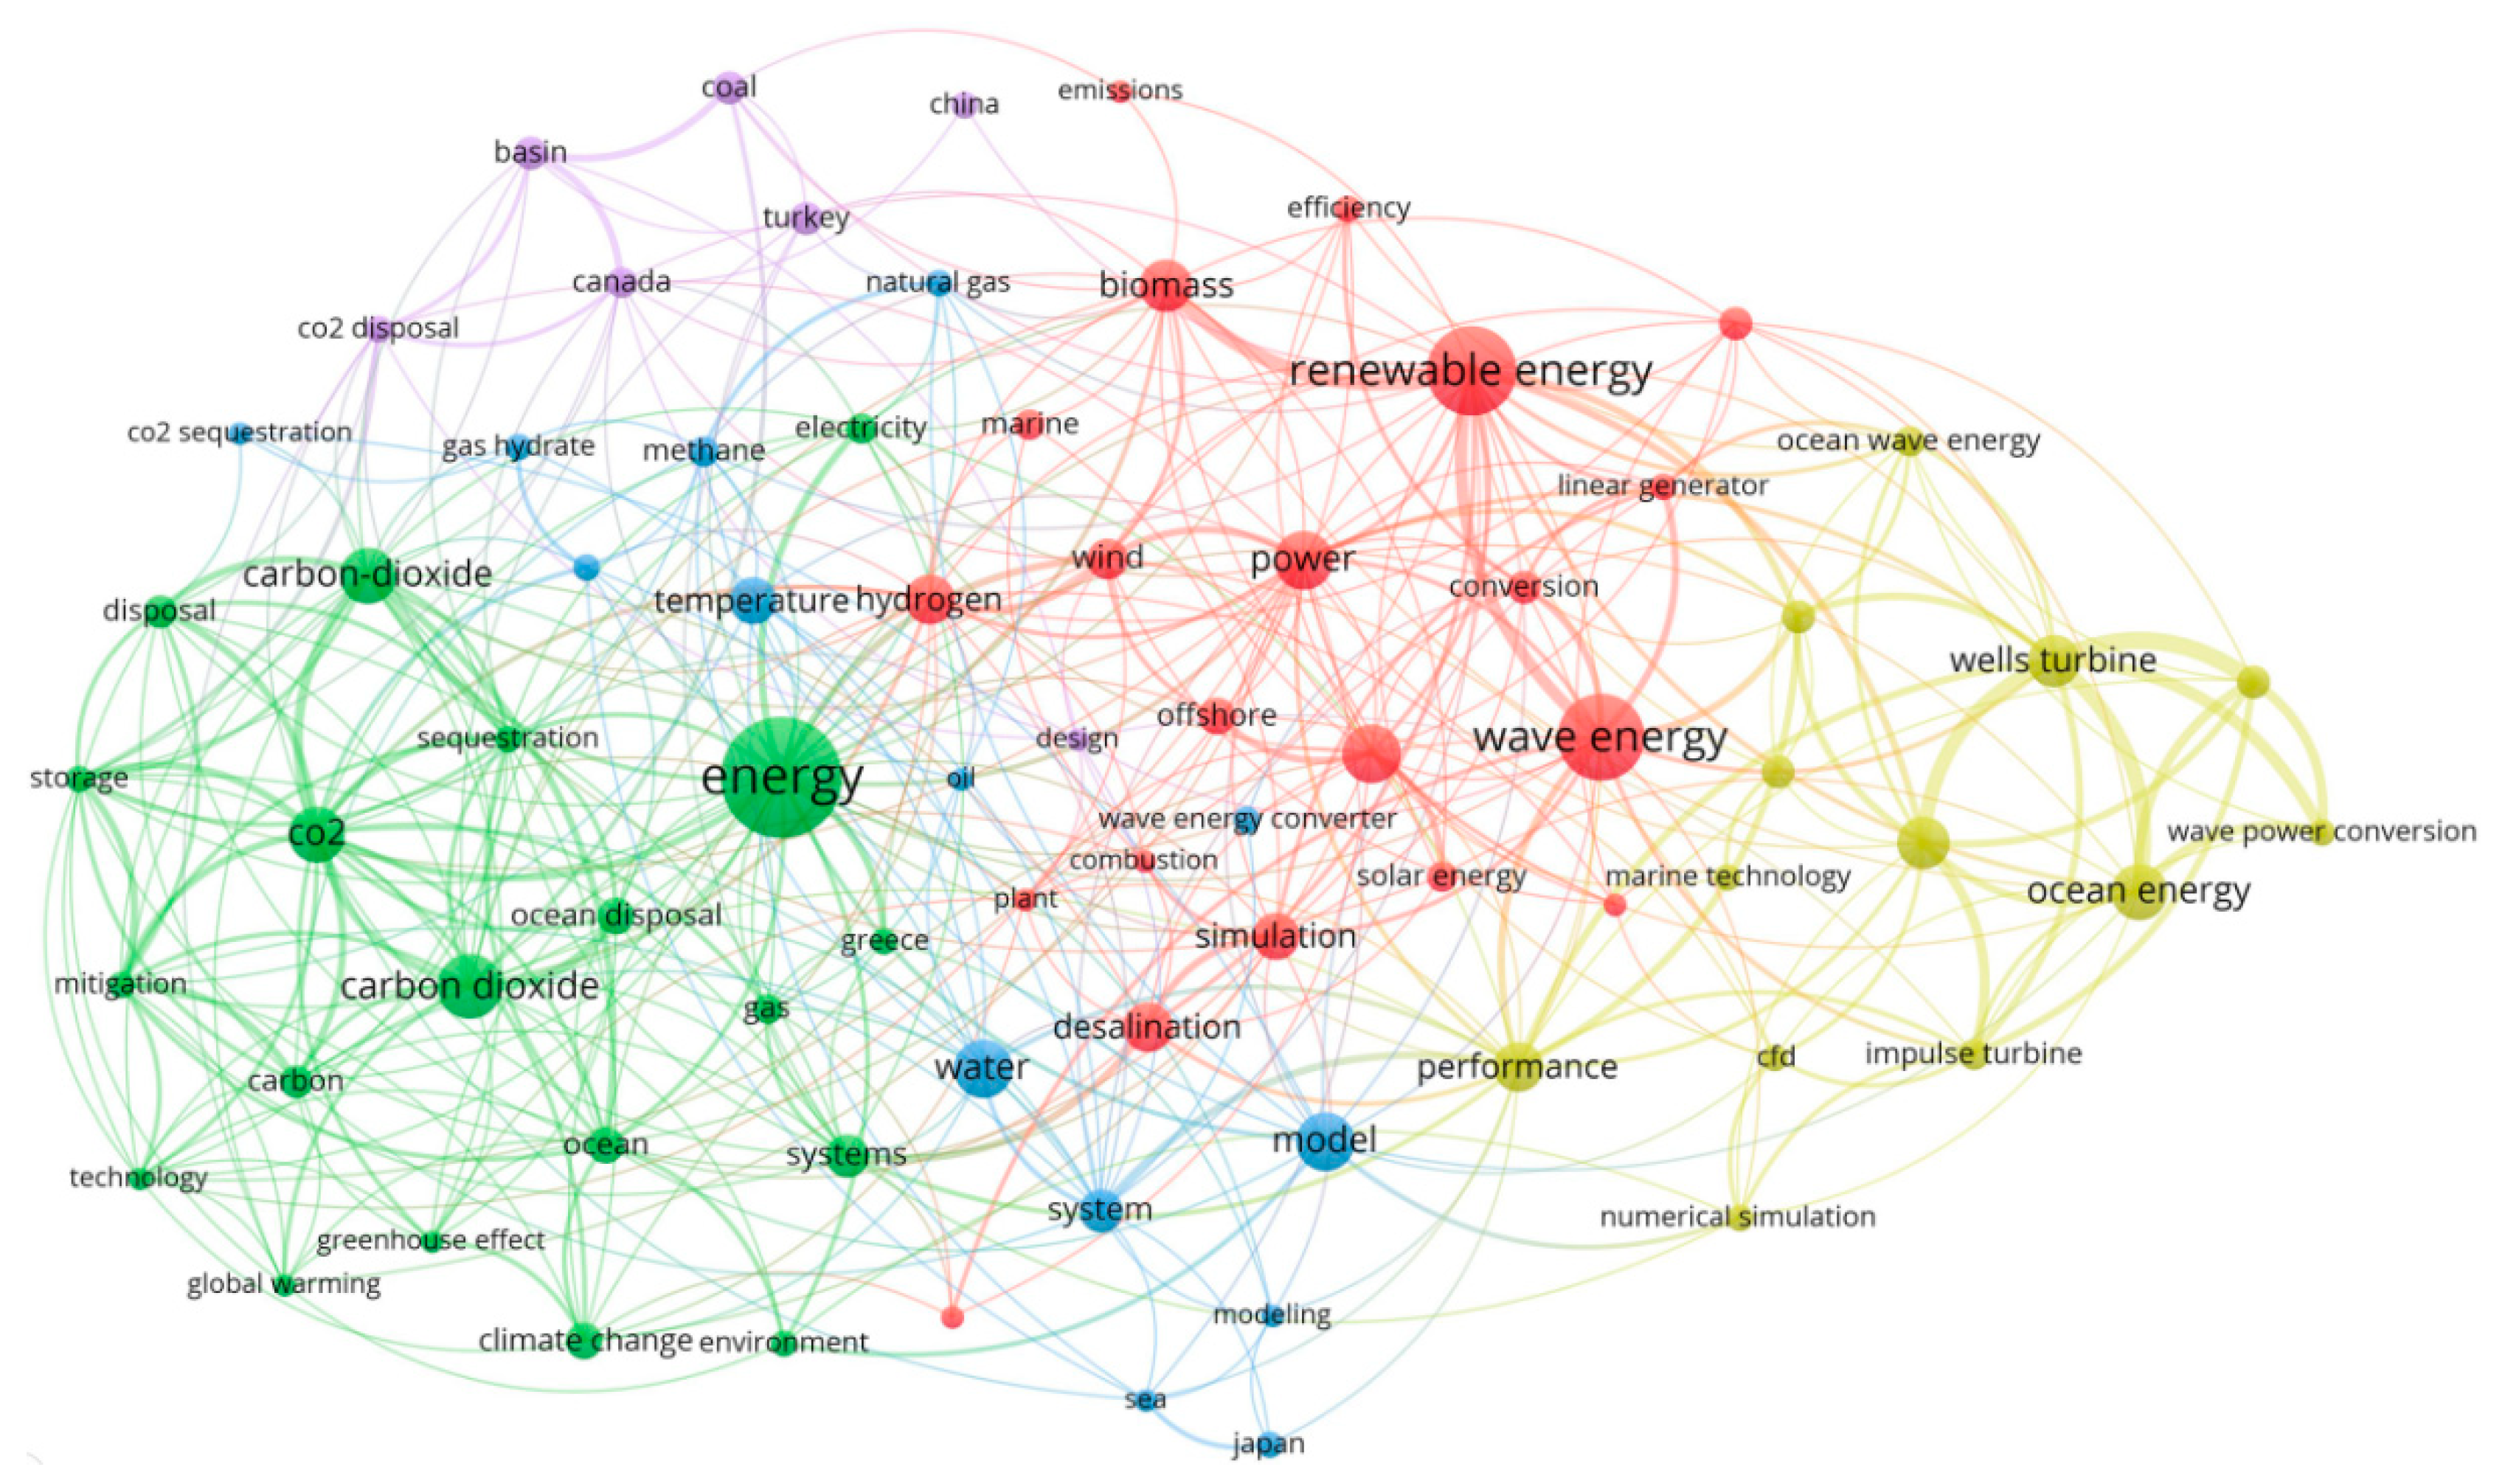
Figure 7 shows the co-occurrence relationship of core words from 2008 to 2018. It is very intuitive that the number and occurrence frequency of core words and the co-occurrence frequency of word pairs from 2008 to 2018 were much greater than those from 1973 to 2007. Compared with 1973–2007, there were more topics of OPG research in 2008–2018, and the focus was clearer. During this period, the OPG research was mainly divided into five parts: (1) We noticed that certain core words, like “sustainability”, “sustainable development”, “impact”, and “environmental impact”, appeared in the blue cluster of Figure 6, and they had a relatively large weight in network. These core words rarely appeared in the co-occurrence network (1973–2007). This shows that, in the past 10 years, while it was also in the context of low-carbon energy demand, compared with the previous studies, researchers began to care about the sustainability of energy and the pollution of the marine environment, which was not focused on in previous studies. (2) More attention was paid to marine bioenergy, such as using algae to produce biofuels, including hydrogen, ethanol, biodiesel, etc. (3) Different from 1973–2007, the research on gas hydrates in recent 10 years have been paid more and more attention. With the high storage, high calorific value, and low pollution, gas hydrates have great utilization potential, but the technical requirements for its exploitation are also high. Therefore, only a few countries can mine gas hydrates from the seabed at present. China’s gas hydrate mining technology is in the leading position in the world. In May 2017, China achieved continuous and stable gas production for the first time in the world (for more than one week) in the Shenhu sea area of the South China Sea. (4) In terms of energy types, previous studies focused on wave energy, and the utilization of tidal energy became a hot spot. In addition, the research, development, and optimization of turbines for wave and tidal energy in recent years were also the hot spots. (5) Compared with Figure 6, many core words, like “energy storage”, “storage”, “energy management”, and “policy”, appear in Figure 7. We propose the reason is that while more ocean energy can be developed and utilized, how to store, manage, and use these energies is also a key problem in OPG research.
Co-citation analysis can find out the relationship of studies and find the research hot topics and frontiers. The nodes in Figure 8 were used to distinguish studies, which are marked with the first author and the publication year. The size of the nodes reflects the citation times, the lines indicates the co-citation relationship, and the thickness of the lines reflects the co-citation strength. In addition, different colors represent the clusters, each cluster has a label to summarize the research direction or topic, and the nodes within the same color belong to the same cluster.
According to the co-citation and cooperation relationship, a total of eight clusters were formed. The topics of cluster 1 and 2 both wave energy resource assessment, but they are divided into two categories because of their different cooperation networks. The other six topics are co-located wind, wave energy converter array, joint evaluation, water-column wave energy converter, numerical calculation, and numerical weather prediction model. The results show that, although many marine resources have been used for power generation, more attention has been paid to wave energy due to its great potential, especially in European countries. Britain’s wave energy technology is at the leading level in the world (clusters 1 and 2). Wind and wave energy can be obtained at the same place in the ocean, and both industries are considering how to reduce energy costs. At present, the wind power technology is relatively mature, and the offshore floating wind and wave energy converter technology is also developing rapidly. Therefore, how to combine a variety of technologies to produce co-located developments for obtaining wind and wave energy at the same location at the same time is one of the hot topics going forward (cluster 3). In the energy sources, the research no longer only considered the potential of one kind of energy, but also began to estimate the joint storage and application potential of wind and wave energy through numerical calculations. In terms of equipment, the acquisition and conversion mechanisms of wind and wave energy are different. Under the premise of joint acquisition and utilization of the two energies, the development of equipment for efficient use and collaborative operation is a key point (cluster 5). At the same time, due to the difficulty of ocean engineering and the extreme waves and gales condition, the durability of equipment is also particularly important in the construction process of wave energy engineering. At present, oscillating water columns have received more attention (clusters 4 and 6). In the process of using ocean energy, the weather conditions are also an important factor. Accurate and timely weather prediction is crucial for the stable and efficient operation of energy conversion devices. The existing land numerical weather prediction models cannot be fully used for ocean weather prediction. Thus, it is also an important direction of OPG research to establish a suitable numerical weather prediction model to predict the ocean weather (clusters 7 and 8).
As shown in Figure 9, after cluster analysis, we presented a timeline view of the clustering structure, which displays the time distribution of studies of different research topics. The advantage of this analysis is to better reveal the development trajectory and evolution process of the knowledge structure of OPG over time [47].
Among the eight clustering topics, the evaluation of wave energy resources is relatively early. Among all the ocean energy, wave energy has the advantages of high energy density and wide distribution, which has great potential and has always been the focus of attention. As shown in Figure 9, since 2002 many scholars have started the research on wave energy resource assessment. With the development of science and technology, researchers of wave energy begin to pay attention to the joint exploitation of wind energy and wave energy at the co-location around 2007, to improve the energy utilization efficiency and reduce the cost of using complex structures. This also is the third cluster in Figure 9. With the prospect of wave energy becoming more and more clear, the development of wave energy power generation equipment has become a research hot topic since 2009 (cluster 4 and 6).
From 2010, the assessment of energy storage changed from single wave energy to the joint evaluation of wave energy and wind energy (cluster 5). In addition, the utilization of ocean energy has the problems of complex marine environments and high engineering costs. It is difficult to verify novel equipment or technology in a real environment. The research on wave energy using numerical simulation technology can help with this problem when the experiment cannot be carried out in the real environment or the engineering cost is too high, which became a hot topic from 2011. When using wave energy to generate electricity, the equipment is at high risk of damage under extreme waves and gale conditions. In addition, for the development of wave energy, not all wave heights can be used. Waves that are too small will not drive the power generation device, and waves that are too large will cause damage. Therefore, timely adjustment of the operation status of the equipment according to the weather conditions is conducive to the stable and efficient acquisition of wave energy. To a certain extent, weather prediction is helpful to reduce the damage of abnormal weather to equipment and improve the utilization efficiency of wave energy (cluster 8).

5. Conclusions

In this study, we used visual scientometric analysis to explore the overall trend of OPG research, draw the knowledge map of OPG research, clarify the relationship between topics, and mine the frontier and hot topics. This study is helpful for scholars and institutions to grasp the direction of technological development, understand the current situation of global OPG research, identify technological innovation opportunities and make more outstanding achievements. For enterprises, it is helpful to evaluate the existing OPG technologies, predict the business prospects, and seize the initiative in future applications. For countries, this study can help the governments to find the appropriate energy technology and then determine the energy development strategy, which plays a guiding role in future developments.
For OPG research, the speed of technology development is first related to the national policy support and a large amount of financial investment. In addition, most of the countries with advanced OPG technology are developed countries, such as the United States, Italy, Spain, Japan, Norway, Germany, France and Denmark, or countries with a strong economy, such as China. This shows that countries with better economies pay more attention to green energy. While paying attention to the economy, environmental problems are also raised to a high requirement. Third, most of the countries with advanced OPG technology are concentrated in Europe. We believe that from the perspective of historical development, these countries have a small land area but a long coastline; therefore, they have traditionally paid attention to the development and utilization of ocean energy.
Through cluster analysis, we determined that the current research in the OPG field was mainly focused on: (1) marine bioenergy, such as the production of biofuels by algae fermentation, including hydrogen, ethanol, biodiesel; (2) the exploitation of gas hydrates; (3) the utilization of wave energy and tidal energy; (4) the research and optimization of turbines; and (5) the storage and management of ocean energy. In the future, the joint utilization of wind energy and wave energy will continue to be a research hot topic of OPG, including joint assessment of the two energy potentials, research and development of equipment, and numerical simulations of joint engineering and the ocean climate.

Author Contributions

Conceptualization, L.C. and J.L.; methodology, W.L.; software, J.L. and Q.F.; validation, L.C. and Q.F.; formal analysis, L.C. and W.L.; data curation, L.C.; writing—original draft preparation, W.L.; writing—review and editing, T.W.; project administration, T.W.; funding acquisition, L.C. All authors have read and agreed to the published version of the manuscript.

Funding

This work was supported by the National Natural Science Foundation of China, grant number 31801255.

Informed Consent Statement

Not applicable.

Data Availability Statement

All data included in this study are available upon request by contact with the corresponding author.

Conflicts of Interest

The authors declare no conflict of interest.

References

  1. Zhu, E.; Deng, J.; Zhou, M.; Gan, M.; Jiang, R.; Wang, K.; Shahtahmassebi, A. Carbon emissions induced by land-use and land-cover change from 1970 to 2010 in Zhejiang, China. Sci. Total Environ. 2019, 646, 930–939. [Google Scholar] [CrossRef]
  2. Chen, L.; Wei, Q.; Fu, Q.; Feng, D. Spatiotemporal Evolution Analysis of Habitat Quality under High-Speed Urbanization: A Case Study of Urban Core Area of China Lin-Gang Free Trade Zone (2002–2019). Land 2021, 10, 167. [Google Scholar] [CrossRef]
  3. Borthwick, A.G. Marine Renewable Energy Seascape. Engineering 2016, 2, 69–78. [Google Scholar] [CrossRef] [Green Version]
  4. Mahmoodi, K.; Ghassemi, H.; Razminia, A. Temporal and spatial characteristics of wave energy in the Persian Gulf based on the ERA5 reanalysis dataset. Energy 2019, 187, 115991. [Google Scholar] [CrossRef]
  5. Bento, A.R.; Salvação, N.; Soares, G.C. Validation of a wave forecast system for Galway Bay. J. Oper. Oceanogr. 2018, 11, 1–13. [Google Scholar] [CrossRef]
  6. Reikard, G.; Pinson, P.; Bidlot, J.-R. Forecasting ocean wave energy: The ECMWF wave model and time series methods. Ocean Eng. 2011, 38, 1089–1099. [Google Scholar] [CrossRef]
  7. Zhang, J.; Xu, C.; Song, Z.; Huang, Y.; Wu, Y. Decision framework for ocean thermal energy plant site selection from a sustainability perspective: The case of China. J. Clean. Prod. 2019, 225, 771–784. [Google Scholar] [CrossRef]
  8. Ertem, F.C.; Neubauer, P.; Junne, S. Environmental life cycle assessment of biogas production from marine macroalgal feedstock for the substitution of energy crops. J. Clean. Prod. 2017, 140, 977–985. [Google Scholar] [CrossRef]
  9. Chen, C.M.; Ibekwe-SanJuan, F.; Hou, J.H. The Structure and Dynamics of Co-Citation Clusters: A Multiple-Perspective Co-Citation Analysis. J Am. Soc. Inf. Sci. Tec. 2010, 7, 1386–1409. [Google Scholar] [CrossRef] [Green Version]
  10. Chen, C. CiteSpace II: Detecting and Visualizing Emerging Trends. J. Am. Soc. Inf. Sci. Technol. 2006, 3, 359–377. [Google Scholar] [CrossRef] [Green Version]
  11. Rojas-Sola, J.I.; Jordá-Albiñana, B.; Criado-Herrero, E. Bibliometric analysis of Latin American, Spanish and Portuguese Scientific Publications in the subject materials science, ceramics in JCR (SCI) database (1997–2008). Bol. Soc. Esp. Ceram. Vidr. 2009, 48, 297–310. [Google Scholar]
  12. Rojas-Sola, J.I.; Aguilera-García, Á.I. Global Bibliometric Analysis of the ‘Mining & Mineral Processing’ Subject Category from the Web of Science (1997–2012). Miner. Process. Extr. Met. Rev. 2015, 36, 349–369. [Google Scholar] [CrossRef]
  13. Yu, D.; Xu, Z.; Šaparauskas, J. The evolution of “technological and economic development of economy”: A bibliometric analysis. Technol. Econ. Dev. Econ. 2019, 25, 369–385. [Google Scholar] [CrossRef]
  14. Yu, D.; Xu, Z.; Wang, W. A bibliometric analysis of Fuzzy Optimization and Decision Making (2002–2017). Fuzzy Optim. Decis. Mak. 2019, 18, 371–397. [Google Scholar] [CrossRef]
  15. Manjula, M. Tools and techniques of Scientometric Analysis in the Field of Library and Information Science Research Introduction. Int. J. Libr. Inf. Stud. 2017, 7, 233–237. [Google Scholar]
  16. Tancoigne, E.; Barbier, M.; Cointet, J.-P.; Richard, G. The place of agricultural sciences in the literature on ecosystem services. Ecosyst. Serv. 2014, 10, 35–48. [Google Scholar] [CrossRef]
  17. Si, H.; Shi, J.-G.; Wu, G.; Chen, J.; Zhao, X. Mapping the bike sharing research published from 2010 to 2018: A scientometric review. J. Clean. Prod. 2019, 213, 415–427. [Google Scholar] [CrossRef]
  18. Cui, Y.; Xu, D.; Liu, Z.; Ross, D. Global Research and Trends in Renewable Energy: Ocean Waves, Tidal Energy and Offshore Wind. J. Coast. Res. 2020, 95, 1485–1489. [Google Scholar] [CrossRef]
  19. Shen, N.; Deng, R.; Liao, H.; Shevchuk, O. Mapping renewable energy subsidy policy research published from 1997 to 2018: A scientometric review. Util. Policy 2020, 64, 101055. [Google Scholar] [CrossRef]
  20. Zhu, E.; Qi, Q.; Sha, M. Identify the effects of urbanization on carbon emissions (EUCE): A global scientometric visualization analysis from 1992 to 2018. Environ. Sci. Pollut. Res. 2021. [Google Scholar] [CrossRef]
  21. Cobo, M.J.; López-Herrera, A.G.; Herrera-Viedma, E.; Herrera, F. Science mapping software tools: Review, analysis, and cooperative study among tools. J. Am. Soc. Inf. Sci. Technol. 2011, 62, 1382–1402. [Google Scholar] [CrossRef]
  22. Börner, K.; Chen, C.; Boyack, K.W. Visualizing knowledge domains. Annu. Rev. Inf. Sci. Technol. 2005, 37, 179–255. [Google Scholar] [CrossRef]
  23. Van Eck, N.J.; Waltman, L. VOSviewer: A computer program for bibliometric mapping. Scientometrics 2010, 84, 886–897. [Google Scholar] [CrossRef] [PubMed] [Green Version]
  24. Boyack, K.W.; Klavans, R. Co-citation analysis, bibliographic coupling, and direct citation: Which citation approach represents the research front most accurately? J. Am. Soc. Inf. Sci. Technol. 2010, 61, 2389–2404. [Google Scholar] [CrossRef]
  25. Surwase, G.; Sagar, A.; Kademani, B.S.; Bhanumurthy, K. Co-citation Analysis: An Overview. In Proceedings of the Bombay Science Librarians’ Association National Conference, Mumbia, India, 5 September 2011. [Google Scholar]
  26. Streeter, C.L.; Gillespie, D.F. Social Network Analysis; Cambridge University Press: Cambridge, UK, 1993; Volume 16. [Google Scholar]
  27. Freeman, L.C. Centrality in social networks conceptual clarification. Soc. Netw. 1978, 1, 215–239. [Google Scholar] [CrossRef] [Green Version]
  28. Abdel-Aal, H.; Khan, M.; John, V.; Amin, M. Sea Thermal Power: A Survey Study for the Arab Coastal Waters. Energy Sources 1990, 12, 393–405. [Google Scholar] [CrossRef]
  29. Brown, D.G.; Jones, D.; Guenther, D.A. Power Extraction from Ocean Surfaces Waves. J. Energy Resour. Technol. 1979, 101, 141–144. [Google Scholar] [CrossRef]
  30. Glendenning, I. Ocean wave power. Appl. Energy 1977, 3, 197–222. [Google Scholar] [CrossRef]
  31. Banal, M.; Bichon, A. Tidal energy in France. The Rance tidal power station. Some results after 15 years of operation. J. Inst. Energy 1981, 55, 86–91. [Google Scholar]
  32. Henderson, R. Design, simulation, and testing of a novel hydraulic power take-off system for the Pelamis wave energy converter. Renew. Energy 2006, 31, 271–283. [Google Scholar] [CrossRef]
  33. Setoguchi, T.; Santhakumar, S.; Maeda, H.; Takao, M.; Kaneko, K. A review of impulse turbines for wave energy conversion. Renew. Energy 2001, 23, 261–292. [Google Scholar] [CrossRef]
  34. Demirbas, A. Potential applications of renewable energy sources, biomass combustion problems in boiler power systems and combustion related environmental issues. Prog. Energy Combust. Sci. 2005, 31, 171–192. [Google Scholar] [CrossRef]
  35. Bahaj, A.; Myers, L. Fundamentals applicable to the utilisation of marine current turbines for energy production. Renew. Energy 2003, 28, 2205–2211. [Google Scholar] [CrossRef]
  36. Myers, L.; Bahaj, A. Simulated electrical power potential harnessed by marine current turbine arrays in the Alderney Race. Renew. Energy 2005, 30, 1713–1731. [Google Scholar] [CrossRef]
  37. Leijon, M.; Danielsson, O.; Eriksson, M.; Thorburn, K.; Bernhoff, H.; Isberg, J.; Sundberg, J.; Ivanova, I.; Sjostedt, E.; Agren, O.; et al. An electrical approach to wave energy conversion. Renew. Energy 2006, 9, 1309–1319. [Google Scholar] [CrossRef]
  38. Charlier, R.H. A “sleeper” awakes: Tidal current power. Renew. Sustain. Energy Rev. 2003, 7, 515–529. [Google Scholar] [CrossRef]
  39. Mayhoub, A.; Azzam, A. A survey on the assessment of wind energy potential in Egypt. Renew. Energy 1997, 11, 235–247. [Google Scholar] [CrossRef]
  40. Lun, I.Y.; Lam, J.C. A study of Weibull parameters using long-term wind observations. Renew. Energy 2000, 20, 145–153. [Google Scholar] [CrossRef]
  41. Shata, A.A.; Hanitsch, R. Evaluation of wind energy potential and electricity generation on the coast of Mediterranean Sea in Egypt. Renew. Energy 2006, 31, 1183–1202. [Google Scholar] [CrossRef]
  42. Aresta, M.; DiBenedetto, A.; Barberio, G. Utilization of macro-algae for enhanced CO2 fixation and biofuels production: Development of a computing software for an LCA study. Fuel Process. Technol. 2005, 86, 1679–1693. [Google Scholar] [CrossRef]
  43. Van Vuuren, D.; Cofala, J.; Eerens, H.; Oostenrijk, R.; Heyes, C.; Klimont, Z.; Elzen, M.D.; Amann, M.; Van Vuuren, D. Exploring the ancillary benefits of the Kyoto Protocol for air pollution in Europe. Energy Policy 2006, 34, 444–460. [Google Scholar] [CrossRef] [Green Version]
  44. Hornstein, M.D.; Stoermer, J.S. The energy policy act of 2005: PURPA reform, the amendments and their implications. Energy Law J. 2006, 27, 25–38. [Google Scholar]
  45. REN21. Renewables Global Status Report (2005–2018); REN21: Paris, France, 2018. [Google Scholar]
  46. Anderson, J. Sea plant-source of power, water and food without pollution. Sol. Energy 1973, 14, 287–300. [Google Scholar] [CrossRef]
  47. Yu, D.; Xu, Z.; Pedrycz, W.; Wang, W. Information sciences 1968–2016: A retrospective analysis with text mining and bibliometric. Inf. Sci. 2017, 619–634. [Google Scholar] [CrossRef]
Figure 1. Trend in the annual records of publications and citations from 1973 to 2018.
Jmse 09 00218 g001
Figure 2. Chronological changes in the number of studies published by the USA, the UK, and China.
Jmse 09 00218 g002
Figure 3. The global spatial distribution of ocean power generation (OPG) research studies.
Jmse 09 00218 g003
Figure 4. Global collaboration networks of countries (regions).
Jmse 09 00218 g004
Figure 5. The global collaboration networks of countries (regions) over time.
Jmse 09 00218 g005
Figure 6. Co-occurrence network of core words in the OPG field (1973–2007).
Jmse 09 00218 g006
Figure 7. Co-occurrence network of core words in the OPG field (2008–2018).
Jmse 09 00218 g007
Figure 8. Cluster analysis of the co-citation of studies in the OPG field.
Jmse 09 00218 g008
Figure 9. Temporal evolution of the co-citation clustering analysis.
Jmse 09 00218 g009
Table 1. The citations and centrality of major countries/regions in the field of OPG.
Country/RegionPublications NumberTotal CitationsAverage CitationCentrality
United States91919,18920.880.32
China730918612.580.15
United Kingdom59314,57524.580.24
Italy285493917.330.08
Spain245554422.630.14
Japan210251211.960.09
Norway201286014.230.02
Germany189326917.300.09
France177337119.050.16
Denmark163422025.890.06
Note: Underscores indicate countries with an average citation greater than 15.
Table 2. The main journals including articles from these 10 countries.
JournalImpact FactorCountry
USChinaUKItalySpainJapanNorwayGermanyFranceDenmark
RENEWABLE SUSTAINABLE ENERGY REVIEWS10.556404332-17-78145
APPLIED ENERGY8.426343424222098667
IEEE TRANSACTIONS ON SUSTAINABLE ENERGY7.65--------8-
JOURNAL OF POWER SOURCES7.46723---------
ENERGY CONVERSION AND MANAGEMENT7.1812822338171610---
BIORESOURCE TECHNOLOGY6.669----5--66-
JOURNAL OF CLEANER PRODUCTION6.395--121216--5-7
ENERGY5.5373343421025857518
RENEWABLE ENERGY5.439773912632331413143213
Total publications235181269841334743467150
Publisher’s Note: MDPI stays neutral with regard to jurisdictional claims in published maps and institutional affiliations.

