Abstract
There is a greater probability of more frequent and/or larger oil spills in the Arctic region due to increased maritime shipping and natural resource development. Accordingly, there is an increasing need for effective spilled-oil computer modeling to help emergency oil spill response decision makers, especially in waters where sea ice is present. The National Oceanic & Atmospheric Administration (NOAA) Office of Response & Restoration (OR&R) provides scientific support to the U.S. Coast Guard Federal On-Scene Coordinator (FOSC) during oil spill response. OR&R’s modeling products must provide adequate spill trajectory predictions so that response efforts minimize economic, cultural, and ecologic impacts, including those to species, habitats, and food supplies. The Coastal Response Research Center is conducting a project entitled Oil Spill Modeling for Improved Response to Arctic Maritime Spills: The Path Forward, in conjunction with modelers, responders, and researchers. A goal of the project is to prioritize new investments in model and tool development to improve response effectiveness in the Arctic. The project delineated FOSC needs during Arctic maritime spill response and provided a solution communicating sources of uncertainty in model outputs using a Confidence Estimates of Oil Model Inputs and Outputs (CEOMIO) table. The table shows the level of confidence (high, medium, low) in a model’s trajectory prediction over scenario-specific time intervals and the contribution of different component inputs (e.g., temperature, wind, ice) to that result.
1. Introduction
Shipping activity, especially in the transboundary region between Alaska (U.S.) and Russia in the Bering Strait, and natural resource development are increasing in the Arctic [1,2]. This increase is facilitated by the decrease in sea ice extent as the Arctic warms, and the associated openings of the Northwest Passage and Northern Sea Route [3]. Between 2013 and 2019, there has been a reported 25% increase in ships entering the Arctic region [4]. Thus, the probability of more frequent and/or larger oil spills in Arctic waters is also increasing [2]. Oil in the Arctic environment may originate from vessel spills (e.g., cargo ships, tankers) or natural resource development (e.g., pipelines, drilling). Types of oil may include crude, distillates (e.g., marine gas oil, marine diesel oil), or liquified natural gas [5]. Spilled oil in the Arctic environment can have negative economic, cultural, and ecological impacts, including disturbances to sensitive species, damage to sensitive coastal and marine habitats, and it can impose stressors on coastal communities, by threatening their subsistence-based food supplies and culture. These impacts may be long lasting because oil is more persistent in extremely cold environments due to the decreased rate of natural weathering (e.g., evaporation, biodegradation) [6]. Some components of spilled oil, such as polycyclic aromatic hydrocarbons, may also contribute to persistent pollution that negatively impacts marine organisms [7]. Furthermore, the Arctic environment is experiencing climate change at rates higher than lower latitudes, which threatens the survival of ecosystems and wildlife populations (e.g., polar bears, ice seals, seabirds, bowhead whales) [8].
Effective response strategies are crucial to mitigate oil spill impacts, but in the Arctic, responses are hindered by limited equipment, long travel times, minimal observational data, and the inherent challenges of operating in the Arctic (e.g., remoteness, storms, long periods of darkness). The Arctic Ocean is approximately 14 million square kilometers, with over 45 thousand kilometers of coastline. It is covered in ice for 8–9 months per year (Figure 1) and receives little to no sunlight for nearly 3 months. Even in warmer summer weather, the Arctic Ocean experiences freezing temperatures, fog, and sea ice [9]. In addition, the remoteness of the Arctic provides challenges to deploy and support oil spill response equipment and personnel, as there is limited access to resources, including housing and food. Additionally, people and equipment must often travel 1000 miles or more to respond to a spill, which can impose extremely slow vessel response times, and the availability of the U.S.’s small, aging icebreaker fleet is not guaranteed [10]. Limited response infrastructure can also impose challenges for the storage, transport, and disposal of the oily waste collected. Additionally, the geographic and atmospheric conditions in the Arctic can disrupt high frequency radio signals and make communication among responders very difficult [11]. Thus, response efforts must be carefully executed to ensure the safety of responders, while minimizing spill impacts to the sensitive Arctic environment.
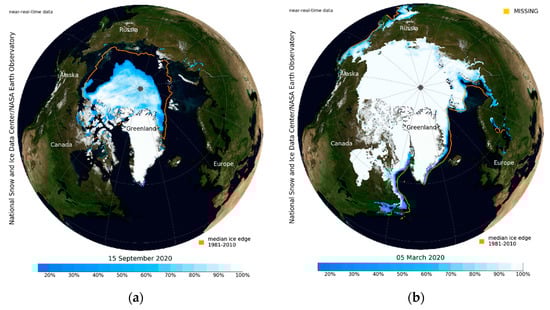
Figure 1.
(a) 2020 minimum sea ice extent, 15 September 2020. This marks the second lowest sea ice extent in the satellite record. (b) 2020 maximum sea ice extent, 5 March 2020. The NASA Blue Marble image is published via the Sea Ice Index by the National Snow and Ice Data Center, University of Colorado Boulder/NASA Earth Observatory [12].
The Clean Water Act calls for the federal government to provide response oversight to discharges of oil into the U.S. coastal zone [13]. As directed in the Clean Water Act, and guidance from the National Contingency Plan, the U.S. Coast Guard (USCG) is charged with the responsibility to provide the USCG Federal On-Scene Coordinator (FOSC) authority for the coastal zone of the U.S., and the Environmental Protection Agency (EPA) for the inland zone [14]. The FOSC coordinates response efforts with and consults other relevant federal, state, local, tribal, and private response organizations [15]. As dictated by the Oil Pollution Act of 1990, relevant parties in a Unified Command (UC) usually include a FOSC, State On-Scene Coordinator, and the Responsible Party [14].
There are many international resources available as well. Support from other nations can be offered or requested according to the International Maritime Organization’s International Convention on Oil Pollution Preparedness, Response, and Co-operation 1990 [16]. The Emergency Prevention, Preparedness, and Response Working Group of the Arctic Council has highlighted the importance for collaboration across its members (i.e., Canada, Denmark, Finland, Iceland, Norway, Sweden, Russia, and the U.S.) to improve prevention, preparedness, and response actions for maritime spills under a legally binding agreement (i.e., Cooperation on Marine Oil Pollution Preparedness and Response) [17]. There are also several bilateral contingency planning agreements to better coordinate resources and knowledge for maritime spills in specific Arctic regions (e.g., Canada/U.S. Joint Marine Pollution Contingency Plan, Russia/U.S. Joint Marine Pollution Contingency Plan) [18].
The National Oceanic and Atmospheric Administration (NOAA) Office of Response and Restoration (OR&R) provides scientific support to the USCG during spill response, including decision support models that predict the transport and fate of spilled oil (e.g., trajectory, oil concentration/thickness, shoreline oiling locations, weathering), identifying habitats and species at risk, and analyzing the potential performance of clean-up alternatives. Model outputs are typically communicated to responders using OR&R’s Environmental Response Management Application (ERMA), a geographic information system-based platform. In the resource-constrained Arctic, it is especially important for oil spill modelers to provide the information that decision makers need to optimize response and effectively deploy their resources. OR&R uses the General NOAA Operational Modeling Environment (GNOME) to predict the trajectory of an oil spill from the available inputs (e.g., oil type, wind, and ocean currents data) [19]. In the Arctic environment, the presence and type of sea ice is a complicating factor requiring inputs from sea ice models (e.g., CICE, neXtSIM-F) to predict ice concentration, thickness, and velocity vectors [20,21]. While OR&R has access to environmental inputs for use in the GNOME model during Arctic oil spill events, they face many challenges such as compatibility of ice data formats and scarcity of environmental monitoring stations in the region. The accuracy of the model depends on the accuracy of input data. Thus, the model heavily relies on monitoring stations and operations to collect environmental data. Ideally, the predicted trajectory is validated with observational data of the spill (collected on-scene), after which the model can be reinitialized to improve subsequent predictions. Observational data of ice and other environmental conditions (e.g., hydrodynamic data from buoys or satellites) and oil (e.g., synthetic aperture radar [22]) can improve subsequent oil spill trajectories. However, observational data can be difficult to obtain in the Arctic due to operational challenges.
This project entitled Oil Spill Modeling for Improved Response to Arctic Maritime Spills: The Path Forward (AMSM) is being conducted by the Coastal Response Research Center (CRRC) with funding provided by the Arctic Domain Awareness Center (ADAC), a U.S. Department of Homeland Security Center of Excellence. The goal of the project is to identify the current state of the art models, and new model components that should be developed and validated for use in the Arctic. In addition, the project will prioritize proposed investments in model and tool development to improve response effectiveness. By improving the oil spill response model trajectory predictions, FOSCs will be able to make better decisions on where to deploy available assets and minimize impacts to natural economic, cultural, and ecological resources. Due to the complexities associated with Arctic conditions, the specific needs and questions FOSCs have must be fully understood by the modelers. FOSCs must also be made aware of the uncertainty associated with model predictions (i.e., the amount of confidence that FOSCs should have in the model outputs). The AMSM project assessed the state of the art of oil spill models used by the private sector, the U.S. and Canadian governments, and other international agencies. In addition to the GNOME model used by the U.S. government, some of these models include the Canadian Oil Spill Modelling Suite, Marine Environmental Modeling Workbench, and OILMAP and SIMAP [23,24,25]. The project identified ice-related gaps in existing oil spill models (e.g., under ice oil storage capacity and spreading, melting, and pooling of oil on ice) that might address them. An important component of the AMSM project was to gather expert advice to determine and address FOSC core needs during planning and response operations for Arctic maritime spills. This paper focuses on a subset of the overall project: how to best characterize, visualize, and communicate uncertainty in the inputs and outputs of complex, spatiotemporal oil spill trajectory models to address decision-maker and spill responder needs.
2. Materials and Methods
The approach to the project was divided into four phases (Figure 2):
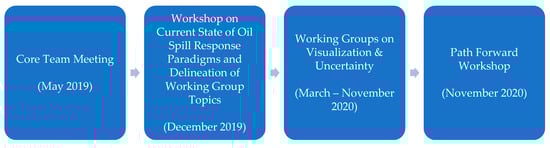
Figure 2.
Four project phases.
Initially, a Core Team was created including representatives from U.S. Arctic response agencies (i.e., USCG, Alaska Department of Environmental Conservation (AK DEC)) and OR&R scientists (Table 1). The Core Team met at the University of Alaska Anchorage in May 2019 to produce a list of needs and questions that an FOSC would want addressed during an Arctic maritime spill response. This list was used to guide the AMSM project. The Core Team completed this list of needs and questions in July 2019 after incorporating inputs from FOSCs.

Table 1.
May 2019 AMSM * meeting: agencies represented.
The workshop was held on 3–5 December 2019 at the University of Alaska Anchorage. There were 49 government, private sector, and NGO participants, including U.S. and international sea ice modelers, oil spill modelers, responders, and researchers (Appendix D has a list of all entities represented). The goals of the workshop were to: (1) establish the current state of the art methods with respect to oil spill models and their usefulness to response modeling, including the role of ice models as inputs; (2) identify gaps in Arctic maritime oil spill modeling; and (3) determine Working Group topics to be discussed following the completion of the workshop. Major oil spill models were discussed, including OR&R’s GNOME and RPS Group’s OILMAP. A number of sea ice models were also presented as well as the NOAA National Weather Service (NWS) sea ice forecasting systems (See Appendix A for complete list of oil response models reviewed, and Appendix B for the sea ice models and forecasting systems considered as part of AMSM). During the workshop, three breakout groups addressed specific spill scenarios that could occur in the U.S. Arctic maritime environment. These scenarios included: an offshore well blowout under ice, pipeline spill under landfast ice, and oil discharge from a large vessel spill containing combinations of various types of oil in the shoulder season as ice is developing. Based on stakeholder feedback, terrestrial oil spills that may influence the marine environment were not considered. A final plenary session of the workshop focused on delineating topics that required in-depth discussion by four Working Groups. The four Working Group topics were: New and Existing Technologies for Observing Ice and Informing Models, Oil and Ice Interactions at the Kilometer and Greater Scale, Oil and Ice Interactions at the Meter/Sub-Grid Scale, and Visualization and Uncertainty. These Working Groups met every three weeks from March 2020 to November 2020.
This paper focuses on the Visualization and Uncertainty Working Group’s efforts (see Appendix E for the list of this Working Group’s members) and questions addressed during their deliberations (Table 2).
Table 2.
AMSM Visualization and Uncertainty Working Group Questions.
The results and recommendations for these questions were presented at the three-hour AMSM Virtual Workshop held on 16 November 2020 to obtain feedback from a wider audience. More focused, stakeholder-centered discussions were held on the 23rd and 30th of November, which addressed research needs and identification of key findings. A knowledge product on the path forward will be submitted to ADAC along with peer-reviewed publications on other aspects of the project.
3. Results
During the May 2019 AMSM Meeting, the Core Team discussed concerns with existing oil spill response models when they are used in the Arctic, and desired capabilities for model adaptation to waters where sea ice is present. For example, existing models do not account for some important ice-related environmental factors (e.g., currents under ice, ridges and keels, water density as a function of melting), and they are only as accurate as their inputs, which in the Arctic may be very limited due to a lack of environmental instrumentation. Environmental data collection in the Arctic is hindered by extreme temperature and weather conditions, operator safety, data communications, and limited access to remote Arctic locations.
The Core Team stressed the need to improve understanding of confidence levels, uncertainty, and how models are validated. During these discussions, it became very apparent that several common terms used by responders and modelers have different meanings depending on the end user. For example, confidence levels may refer to statistical confidence intervals (e.g., associated with a particle trajectory), vs. the degree to which a responder should have confidence (or trust) in the model predictions.
At the conclusion of this meeting, the Core Team produced a list of questions and needs that the USCG FOSC want addressed during an Arctic maritime spill (Table 3 and Table 4). Following this meeting, the NOAA Scientific Support Coordinator (SSC) conducted interviews with FOSCs to critique this list. Of these topics, the response community/FOSCs were most concerned with responder-specific topics, such as implications of model results for response tactics and topics related to modeling confidence level and communication (e.g., how to improve communication of results to specific audiences such as the public).
Table 3.
Core Team Meeting questions and needs from the Responder/FOSC * perspective.
Table 4.
Core Team Meeting questions and needs on confidence level & communication.
The list of questions and needs guided the discussions during the December 2019 workshop. During the evaluation of the spill scenarios and the final plenary session, discussions reaffirmed the importance of the model results on response and understanding of confidence/uncertainty. This emphasis resulted in the formation of a Working Group entitled “Visualization and Uncertainty”. This group included responders and modelers and focused on improving model visualization, uncertainty estimation, and communication between responders and modelers. The group concluded that understanding model confidence and uncertainty is crucial because: (1) uncertainties in the Arctic are often very large; (2) resources, personnel, and time are limited, making accurate deployment more important; and (3) risks are high for species, habitats, and communities already threatened by climate change. The group concluded that understanding the sources of uncertainty in Arctic spill modeling and how to resolve them will improve the ability of decision makers to respond as best as possible under very challenging conditions.
3.1. Question 1: How Is Uncertainty Shown and to What Extent Is It Demonstrated in Existing Oil Forecasts?
Uncertainties associated with oil spill models may be the result of data gaps (e.g., if the model needs five inputs and three are missing). In addition, there may be issues with: (1) data sources (i.e., observational data are more reliable than modeled data, different sources each have their unique confidence levels), (2) the age of the data (i.e., data collected on the same day it is used are more reliable than data that are several days old), (3) data quality, and (4) spill-specific shifts in the inputs of greatest importance to the model (e.g., in a spill with strong winds and minimal tidal changes, the quality of wind data may be more important).
Oil spill model trajectory estimates typically display a line around the predicted spill area to illustrate the uncertainty boundary (Figure 3). Most oil spill models use an ensemble approach, where a single model is run multiple times, using different data for input variables in each model run. The outputs from all individual model runs are then condensed into a single output, along with an uncertainty estimate based upon deviations in outputs from the individual model runs. The model predicts the outermost extent of the oil slick. Notes may be included with the forecast to explain the level of uncertainty.
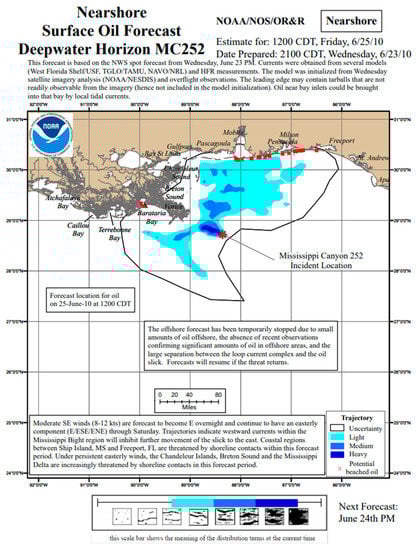
Figure 3.
Example NOAA model trajectory estimate for Deepwater Horizon Oil Spill with uncertainty bound (shown as black line around spill area) published by NOAA, 2010 [26].
3.2. Question 2: What Do Responders Want with Respect to Visualization?
Accurate fate and trajectory modeling are crucial for personnel and equipment resource planning and deployment, creation of aerial overflight search patterns, direction of spill response operations, and data collection efforts. Although they are often from a variety of backgrounds and experience, FOSCs usually want to know the most likely and worst-case trajectory and fate predictions. Operating in the Arctic environment increases the importance of including uncertainty in outputs, as personnel, equipment, and available data are limited. Responders often rely on a series of “best guesses” to guide spill response operations. Hence, for FOSCs, a qualitative confidence level at a pre-defined low, medium, or high level is sufficient for most decision-making. The acceptable amount of uncertainty varies for each response scenario. For example, decision makers may need more detailed and accurate predictions near sensitive habitats. The highest level of detail in modeling outputs is not always necessary to make response decisions (e.g., setting command priorities and objectives), nor will a perfect trajectory necessarily mitigate impacts.
3.3. Question 3: What Would Responders Like to See/Know that They Are Not Getting Now (Especially Specific to Oil in Ice/Arctic)?
Responders need clear confidence bounds in trajectory products (i.e., areas of high and low confidence) and descriptions to ensure information is properly understood. Responders also need information on oil thickness. There is a desire for trajectory analysis maps to depict areas of high and low concentrations of oil (e.g., with colored contours for different thicknesses) (N.B., Oil thickness is not usually uniform and is often patchy over a given area). There is a need to determine what oil is recoverable/actionable (i.e., to improve encounter rates) and best available information on thickness as a probability estimate. More fine-grained information for explicit oil thickness probability estimates is especially needed near critical habitats and sensitive resources.
Modeling involves multi-dimensional space (cardinal directions, probability, concentrations), so graphics are never a complete description of results. Conversely, showing multiple trajectory paths in one figure may be difficult to understand, especially when adding supplementary uncertainty information. OR&R modelers recommend visualizations that include: (1) color coded, general, qualitative confidence levels; (2) a summary of the model results, including information about what data could increase confidence; and (3) a verbal narrative to accompany data/graphics to discuss inputs and issues, especially when there is a shortage of available information (no data to feed model = no graphics).
3.4. Confidence Estimates of Oil Model Inputs and Outputs (CEOMIO) Table
After answering the three primary questions, the Working Group decided to create a template for a summary table that would inform an FOSC and UC of the confidence associated with a model estimate. The resulting sample of a Confidence Estimates of Oil Model Inputs and Outputs (CEOMIO) table (Table 5) includes model inputs and outputs listed by data source and their relative importance. These inputs and outputs would be assigned a spill-specific qualitative confidence level (i.e., high, medium, low, none, or not applicable). A detailed list of notes and instructions on how to use the table is included (Table 6). While the Working Group focused on Arctic spills due to the increased importance of understanding uncertainty, a similar table could be developed for response in other regions.
Table 5.
Example of a Confidence Estimates of Model Inputs and Outputs (CEOMIO) table.
Table 6.
Notes and instructions for Confidence Estimates of Model Inputs and Outputs (CEOMIO) table.
NOAA NWS Social and Behavioral Scientists, with expertise in visualization optimization, reviewed the proposed table format. The NWS team offered suggestions to improve readability and comprehension. Their suggestions included making the table colorblind-friendly (e.g., using gradients instead of red/yellow/green) and photocopier-friendly to address challenges with downloading graphics. They also emphasized that the end user’s eye is drawn to darker and more vivid colors, so this should represent information with the highest associated confidence. Finally, they suggested that qualitative confidence levels be tested with different end users to help user perceptions match the modeler’s intended meaning.
CEOMIO was discussed in detail during the November 2020 AMSM Virtual Workshop and Stakeholder Working Sessions. USCG and NOAA representatives provided perspectives on how to introduce the table to the response community as well as how to determine the qualitative confidence levels. Modelers generally have a sense of the relative importance of different parameters for a given oil spill and could designate a high/medium/low spill-specific confidence level based on the model uncertainty and their experience. The workshop participants concluded that a quantitative confidence or range (e.g., low = 0–30% confidence associated with a particular model input) would be difficult to assign as many input parameters (e.g., hydrodynamic model outputs), do not have numerical confidence estimates, and the relative importance of the inputs varies by scenario. Trajectory forecasts are multi-dimensional, and percentages alone would not have meaning because importance is only relevant to a scale or quantity (e.g., 30% uncertainty in wind data may not be equivalent to 30% uncertainty in current data). In many cases, especially when there are limited data available (e.g., at the beginning of a response), inputs are best guesses by experienced modelers.
4. Discussion
The unique approach used by CRRC for the AMSM project reached a wide audience of responders, modelers, and agencies, soliciting a range of expert perspectives on how best to inform FOSCs about the uncertainty associated with oil spill modeling. The approach resulted in a dialog in which modelers were provided responder needs for model output (including uncertainty) and responders were provided model data needs and limitations. The project Core Team codified the initial set of questions and needs that FOSCs have during Arctic maritime spills. These were augmented during the December 2019 workshop and Visualization and Uncertainty Working Group meetings. The set of questions and needs were, repeatedly, reaffirmed and refined during every step of the process. The Working Group approach allowed a long-term dialog to develop and mature over many months between the response community and modelers, so that the former could articulate their concerns and the latter could explain the factors influencing their trajectory analyses. The Working Group’s small size allowed each participant to share thoughts and solutions to the challenges. The group was able to devise CEOMIO and develop it over the course of several meetings. The current version of the table (Table 5) was refined during the November 2020 Virtual Workshop and Stakeholder Working Sessions, where it received support from a number of practitioners.
The table provides responders with a qualitative confidence to inform decision-making. The modelers noted that most uncertainty in a prediction’s trajectory is due to issues with data inputs (e.g., gaps, source, age). The amount of information conveyed by a typical trajectory analysis map (Figure 3), while adequate, is limited with respect to uncertainty. The verbal descriptions that are added by a NOAA SSC are very useful, but also may not capture all of the information that FOSCs need for response decision-making and do not provide a record that can be referenced repeatedly. Inclusion of the proposed CEOMIO table along with existing trajectory products may increase end user comprehension and retention of the factors and data that influence model output. The table provides a comparison among data types, and the confidence of input data vis-a-vis the confidence of output predictions. The table would be created by OR&R modelers and be conveyed to a FOSC by a NOAA SSC. It will serve as a communication tool to advance decision-making in areas with heightened uncertainty such as the Arctic. CEOMIO will highlight existing data gaps that could be addressed via reconnaissance technologies (e.g., drones, buoys, satellites) or more refined modeling efforts during response.
CEOMIO will require more refinement from potential end users before putting into practice. CRRC has partnered with OR&R in a similar process to refine the Environmental Response Management Application when it was originally developed in 2007. Next steps will include a sub-group of oil spill modelers and SSCs using model output and data from previous incidents to create a set of draft CEOMIO tables. This will help the modelers determine how easily they can create the tables from actual data and allow them to experiment with SSCs to create the high, medium, and low rankings and identify areas of concern when using the table. Once the modelers and SSCs have tables they believe are ready for vetting by FOSCs and the UC, the sub-group will expand to include these responders.
Several iterations may be required before tables are ready to be introduced at exercises for broader use and input during a time-critical event. It may be best to have a seminar with modelers and responders before the exercise to socialize the new tool. Using the table as a component during an Arctic exercise will also require collaboration between oil spill modelers and ice observation systems (e.g., U.S. National Ice Center, NWS Alaska Sea Ice Desk) to discuss data types, formats, and communication. Modelers for the Responsible Party would also need to be involved along with state and other members of the UC. There is potential that this table would be integrated into an exercise or drill, instead of being the sole focus.
CEOMIO would be presented to other relevant groups for further input (e.g., Arctic and Western Alaska Area Committees, Alaska Regional Response Team Science and Technology Committee). Their combined feedback should result in a product that modelers are able to produce without major increases in their workload during a response.
5. Conclusions
The CRRC’s Oil Spill Modeling for Improved Response to Arctic Maritime Spills: The Path Forward (AMSM) project identified questions and needs of USCG FOSCs and NOAA OR&R modelers. Working directly with the project Core Team, key stakeholders from USCG and NOAA, and industry and international experts produced findings that are relevant and useful in the event of an oil spill in the Arctic. As identified during the project’s two workshops, the inputs and outputs of oil spill models may have considerable uncertainty associated with them, and it is likely that this will not improve in the next several years. As a result, one priority for the project became a near-term assessment of practical approaches to improving communication of the relative level of confidence in model predictions, visualization of results, and future research needs.
Improving understanding of the sources of uncertainty that exist and their impact on spilled oil trajectories will benefit response in all environments/regions. However, the impact will be greater in the Arctic where there are limited data and more unknowns. Unlike spills in areas such as the Gulf of Mexico where large amounts of equipment and personnel can be deployed rapidly, there are very limited resources available in the Arctic and most have longer timescales for deployment. As a result, personnel placement and resource allocation must be as efficient as possible because of their decreased availability and the challenging operating conditions. CEOMIO is one possible solution to help address this problem. More work is needed to augment this tool so that it may improve the dialog between modelers, SSCs, and FOSCs. Table improvements must remain responder-focused, streamlined, and simple so as not to unduly burden modelers during a spill. The group concluded the table may also be useful for non-Arctic spills.
There are many unknowns of how, where, and when an Arctic spill event will occur. A plan for a path forward will help address potential scenarios before they happen and improve preparedness of response assets and personnel in the Arctic. AMSM plans to continue discussions focusing on remaining topics from the November 2020 Virtual Workshop. Release of a knowledge product outlining the project’s findings is planned for 2021 and will serve as a roadmap for continuing efforts. The process employed by the CRRC during the AMSM project will continue in the form of a partnership with USCG, NOAA, and other stakeholders. This partnership will continue to address responder and modeler needs and will more fully develop and integrate CEOMIO (or something similar) into Arctic spill response.
Author Contributions
Conceptualization, C.B. (Christopher Barker), C.B. (Catherine Berg), M.D., M.E., N.K., J.M., A.M. and M.V.; methodology, N.K., J.M. and M.V.; software, N/A; validation, N/A; formal analysis, N/A; investigation, C.B. (Christopher Barker), C.B. (Catherine Berg), M.D., M.E., N.K., J.M., A.M., J.R. and M.V.; resources, N/A; data curation, N/A; writing—original draft preparation, N.K., J.M. and M.V.; writing—review and editing, C.B. (Christopher Barker), C.B. (Catherine Berg), M.D., M.E., C.G., N.K., J.M., A.M., J.R. and M.V.; visualization, M.D., J.M. and M.V.; supervision, N.K.; project administration, N.K.; funding acquisition, N.K. All authors have read and agreed to the published version of the manuscript.
Funding
This research was funded by the Arctic Domain Awareness Center (ADAC), grant number 2014-ST-ML002-03.
Institutional Review Board Statement
Not applicable.
Informed Consent Statement
Not applicable.
Acknowledgments
Working Group Members (see Appendix E), Project Core Team (see Appendix C), Kirsten Trego (ADAC Project Champion), Kathy Mandsager (CRRC UNH), Elizabeth Matthews (ADAC), Randy Kee (ADAC), Jen Sprague (NOAA NWS), Gina Eosco (NOAA Weather Program Office), Castle Williams (Cherokee Nation), Scott Lundgren (NOAA OR&R), Theophilos Gemelas (Department of Homeland Security Science & Technology Office of University Programs, ADAC Program Officer). The authors would like to thank the Arctic Domain Awareness Center (ADAC) and the University of Alaska Anchorage for collaboration and expertise. This material is partly based on work supported by the U.S. Department of Homeland Security under Grant Award Number 2014-ST-ML002-03; the Center for Maritime Research (ADAC).
Conflicts of Interest
The authors declare no conflict of interest. The views and conclusions contained in this document are those of the authors and should not be interpreted as necessarily representing the official policies, either expressed or implied, of the U.S. Department of Homeland Security. The scientific results and conclusions, as well as any views or opinions expressed herein, are those of the authors and do not necessarily reflect the views of NOAA or the Department of Commerce. The views expressed herein are those of the authors and are not to be construed as official or reflecting the views of the Commandant or of the U.S. Coast Guard.
Appendix A
Table A1 displays oil response models reviewed:
Table A1.
Oil spill response models reviewed.
Table A1.
Oil spill response models reviewed.
| Name of Model | Developer of Model |
|---|---|
| Blowout and Spill Occurrence Model | DOE National Energy Technology Laboratory (NETL) |
| Canadian Oil Spill Modelling Suite | Canadian Centre for Meteorological and Environmental Prediction |
| GNOME | NOAA OR&R |
| Marine Environmental Modeling Workbench | SINTEF Ocean |
| MIKE 21/3 Oil Spill | DHI A/S |
| National Research Council Canada (NRCC) Model | NRCC |
| OILMAP and SIMAP | RPS Group |
| OpenDrift/OpenOil | MET Norway |
| SPILLCALC | TetraTech |
| SPILLMOD | N.N. Zubov State Oceanographic Institute (GOIN) |
(For more information on the oil spill models considered: https://crrc.unh.edu/AMSM_Arctic_Modeling (accessed on 10 February 2021)).
Appendix B
Table A2 displays sea ice models and forecasting systems reviewed:
Table A2.
Ice models reviewed.
Table A2.
Ice models reviewed.
| Name of Model | Developer of Model |
|---|---|
| CICE | Los Alamos National Laboratory (LANL) |
| Discrete Element Model for Sea Ice | LANL |
| High Resolution Ice-Ocean Modeling and Assimilation System | ADAC |
| ICEPACK | LANL |
| neXtSIM-F | Nansen Environmental and Remote Sensing Center (NERSC) |
| TOPAZ4 | NERSC |
| Sea-Ice Simulator, version 2 | NOAA Geophysical Fluid Dynamics Laboratory |
| Regional Ocean Modeling System | University of Alaska, Fairbanks (UAF) |
| Arctic Ice Analysis Products | U.S. National Ice Center |
| Alaska Sea Ice Program | NOAA NWS |
(For more information on the ice models considered: https://crrc.unh.edu/AMSM_Arctic_Modeling (accessed on 10 February 2021). For more information on Arctic Ice Analysis Products: https://usicecenter.gov/Products/ArcticHome (accessed on 10 February 2021). For more information on Alaska Sea Ice Program: https://www.weather.gov/afc/ice (accessed on 10 February 2021)).
Appendix C
The following were members of the Project Core Team:
- Sarah Allan (NOAA OR&R)
- Chris Barker (NOAA OR&R)
- Gary Barnum (USCG, Pacific Area)
- CJ Beegle-Krause (SINTEF Ocean)
- Catherine Berg (NOAA OR&R)
- Omar Borges (USCG, Office of Marine Environmental Response Policy Research and Development Center)
- Rick Bernhardt (AK DEC) **
- Lisa DiPinto (NOAA OR&R) *
- Michael Donnellan (AK DEC) *
- Mark Everett (USCG, 17th District)
- Clifton Graham (USCG Headquarters (HQ)) *
- Kate Hedstrom (UAF) *
- Randy Kee (ADAC)
- Amy MacFadyen (NOAA OR&R)
- Guillaume Marcotte (Environment and Climate Change Canada (ECCC))*
- Phillip McGillivary (USCG, Pacific Area)
- Karin Messenger (USCG HQ) ***
- Kirsten Trego (USCG HQ)
- *
- January 2020–January 2021
- **
- May 2019–January 2020
- ***
- May 2019–April 2020
Appendix D
The following are entities that were represented in the AMSM Workshop (December 2019):
- ADAC
- AK DEC
- Alaska Clean Seas
- CRRC UNH
- Dalhousie University
- DHI A/S
- ECCC
- ExxonMobil Biomedical Sciences, Inc.
- LANL
- Massachusetts Institute of Technology
- Naval Postgraduate School
- N.N. Zubov State Oceanographic Institute (GOIN)
- NOAA Geophysical Fluid Dynamics Laboratory
- NOAA OR&R
- NRCC
- RPS Group
- SINTEF Ocean
- TetraTech
- Texas A&M University
- UAF
- University of Washington
- USCG, 17th District
- USCG HQ
- USCG, Pacific Area
- USCG, Sector Anchorage
- U.S. Department of the Interior, Bureau of Ocean Energy Management
- U.S. DOE NETL
Appendix E
The following were active members of the Visualization and Uncertainty Working Group:
- Chris Barker (NOAA OR&R)
- Gary Barnum (USCG, Pacific Area)
- CJ Beegle-Krause (SINTEF)
- Catherine Berg (NOAA OR&R)
- Laurent Bertino (NERSC)
- Michael Donnellan (AK DEC)
- Rodrigo Fernandes (Bentley Systems)
- Ben Fieldhouse (ECCC)
- Jessica Garron (UAF)
- Bruce Hollebone (ECCC)
- Bryan Klostermeyer (USCG)
- Patrick Lambert (ECCC)
- Zhen Li (Bureau of Ocean Energy Management)
- Amy MacFadyen (NOAA OR&R)
- Mads Nistrup Madsen (DHI A/S)
- Gabrielle McGrath (RPS)
- Dylan Righi (NOAA OR&R)
- Jason Roe (ADAC)
- Kelly Rose (US DOE NETL)
- James Yao (ECCC)
References
- Expansion of Maritime Activity in the Bering Strait Region: Mitigating Existing and Future Risks. Available online: https://www.wilsoncenter.org/event/expansion-maritime-activity-bering-strait-region-mitigating-existing-and-future-risks (accessed on 29 December 2020).
- Emergency Prevention, Preparedness and Response Working Group. Arctic Emergencies: Current and Future Risks, Mitigation, and Response Cooperation; Arctic Council: Tromsø, Norway, 2011; pp. 1–6. [Google Scholar]
- Boylan, B.M.; Elsberry, D.T. Increased Maritime Traffic in the Arctic: Implications for International Cooperation and Security; University of Alaska Fairbanks: Fairbanks, AK, USA, 2019; pp. 1–17. [Google Scholar]
- Protection of the Arctic Marine Environment (PAME). Arctic Shipping Report #1: The Increase in Arctic Shipping 2013–2019. ASSR 2020, 1, 1–25. [Google Scholar]
- Protection of the Arctic Marine Environment (PAME). Arctic Shipping Report #2: Heavy Fuel Oil (HFO) Use by Ships in the Arctic 2019. ASSR 2019, 2, 1–35. [Google Scholar]
- Helle, I.; Mäkinen, J.; Nevalainen, M.; Afenyo, M.; Vanhatalo, J. Impacts of Oil Spills on Arctic Marine Ecosystems: A Quantitative and Probabilistic Risk Assessment Perspective. NCBI 2020. [Google Scholar] [CrossRef] [PubMed]
- National Oceanic and Atmospheric Administration Office of Response and Restoration, The Toxicity of Oil: What’s the Big Deal? Available online: https://response.restoration.noaa.gov/about/media/toxicity-oil-whats-big-deal.html (accessed on 1 February 2021).
- Wolf, S. Extinction: It’s Not Just for Polar Bears; Center for Biological Diversity: Tucson, AZ, USA, 2010; pp. 10–26. [Google Scholar]
- Daniel, R.; Ganey, S.; Heiman, M.; Huffines, E.; Humphries, E.; Huntington, H.; Nipper, L.; Prior-Parks, M. Arctic Standards: Recommendations on Oil Spill Prevention, Response, and Safety; Pew Charitable Trusts: Philadelphia, PA, USA, 2013. [Google Scholar]
- Hsu, J.U.S. Icebreaker Fleet is Overdue for an Upgrade. Sci. Am. 2017. [Google Scholar] [CrossRef]
- Eidson, B. Navigating the Arctic’s Communications Challenges; MITRE: Bedford, MA, USA, 2019. [Google Scholar]
- National Snow and Ice Data Center, Sea Ice Index. Available online: https://nsidc.org/data/seaice_index (accessed on 1 February 2021).
- U.S. Code § 1321—Oil and Hazardous Substance Liability. Available online: https://www.law.cornell.edu/uscode/text/33/1321 (accessed on 14 February 2021).
- CFR Part 300—National Oil and Hazardous Substances Pollution Contingency Plan. Available online: https://www.law.cornell.edu/cfr/text/40/part-300. (accessed on 14 February 2021).
- AK DEC. North Slope Subarea Contingency Plan: Response Section; Department of Environmental Conservation: Juneau, AK, USA, 2012. [Google Scholar]
- Pollution Preparedness and Response. Available online: https://www.imo.org/en/OurWork/Environment/Pages/Pollution-Response.aspx (accessed on 15 January 2021).
- Arctic Council. Agreement on Cooperation on Marine Oil Pollution Preparedness and Response in the Arctic. Int. Oil Spill Conf. Proc. 2014, 1485–1496. [Google Scholar] [CrossRef][Green Version]
- USDOI, Bureau of Ocean Energy Management. Oil Spill Preparedness, Prevention, and Response on the Alaska OCS. BOEM 2019, 6, 1–42. [Google Scholar]
- GNOME. Available online: https://response.restoration.noaa.gov/oil-and-chemical-spills/oil-spills/response-tools/gnome.html (accessed on 15 January 2021).
- Barker, C. Answering the Challenge of Arctic Conditions to Oil Spill Incidents; NOAA: Washington, DC, USA, 2016; pp. 1–58. [Google Scholar]
- French-McCay, D.P.; Tajalli-Bakhsh, T.; Jayko, K.; Spaulding, M.L.; Li, Z. Validation of Oil Spill Transport and Fate Modeling in Arctic Ice. Arct. Sci. 2018, 4, 71–97. [Google Scholar] [CrossRef]
- Caruso, M.J.; Migliaccio, M.; Hargrove, J.T.; Garcia-Pineda, O.; Graber, H.C. Oil Spills and Slicks Imaged by Synthetic Aperture Radar. Oceanography 2013, 26, 112–122. [Google Scholar] [CrossRef]
- Barker, C.H.; Kourafalou, V.H.; Beegle-Krause, C.; Boufadel, M.; Bourassa, M.A.; Buschang, S.G.; Androulidakis, Y.; Chassignet, E.P.; Dagestad, K.; Danmeier, D.G.; et al. Progress in Operational Modeling in Support of Oil Spill Response. JMSE 2020, 8, 668. [Google Scholar] [CrossRef]
- Beegle-Krause, C. Marine Environmental Modeling Workbench. In Proceedings of the ADAC Arctic Spill Modeling Workshop, Anchorage, AK, USA, 3 December 2019. [Google Scholar]
- OILMAP. Available online: https://www.rpsgroup.com/services/oceans-and-coastal/modelling/products/oilmap (accessed on 3 February 2021).
- Deepwater Horizon Trajectory Maps: By Date. Available online: https://response.restoration.noaa.gov/oil-and-chemical-spills/oil-spills/response-tools/deepwater-horizon-trajectory-maps-dates.html (accessed on 29 December 2020).
Publisher’s Note: MDPI stays neutral with regard to jurisdictional claims in published maps and institutional affiliations. |
© 2021 by the authors. Licensee MDPI, Basel, Switzerland. This article is an open access article distributed under the terms and conditions of the Creative Commons Attribution (CC BY) license (http://creativecommons.org/licenses/by/4.0/).