
Numerical Investigation on Hydrodynamic Characteristics of Immersed Buoyant Platform


Abstract
1. Introduction
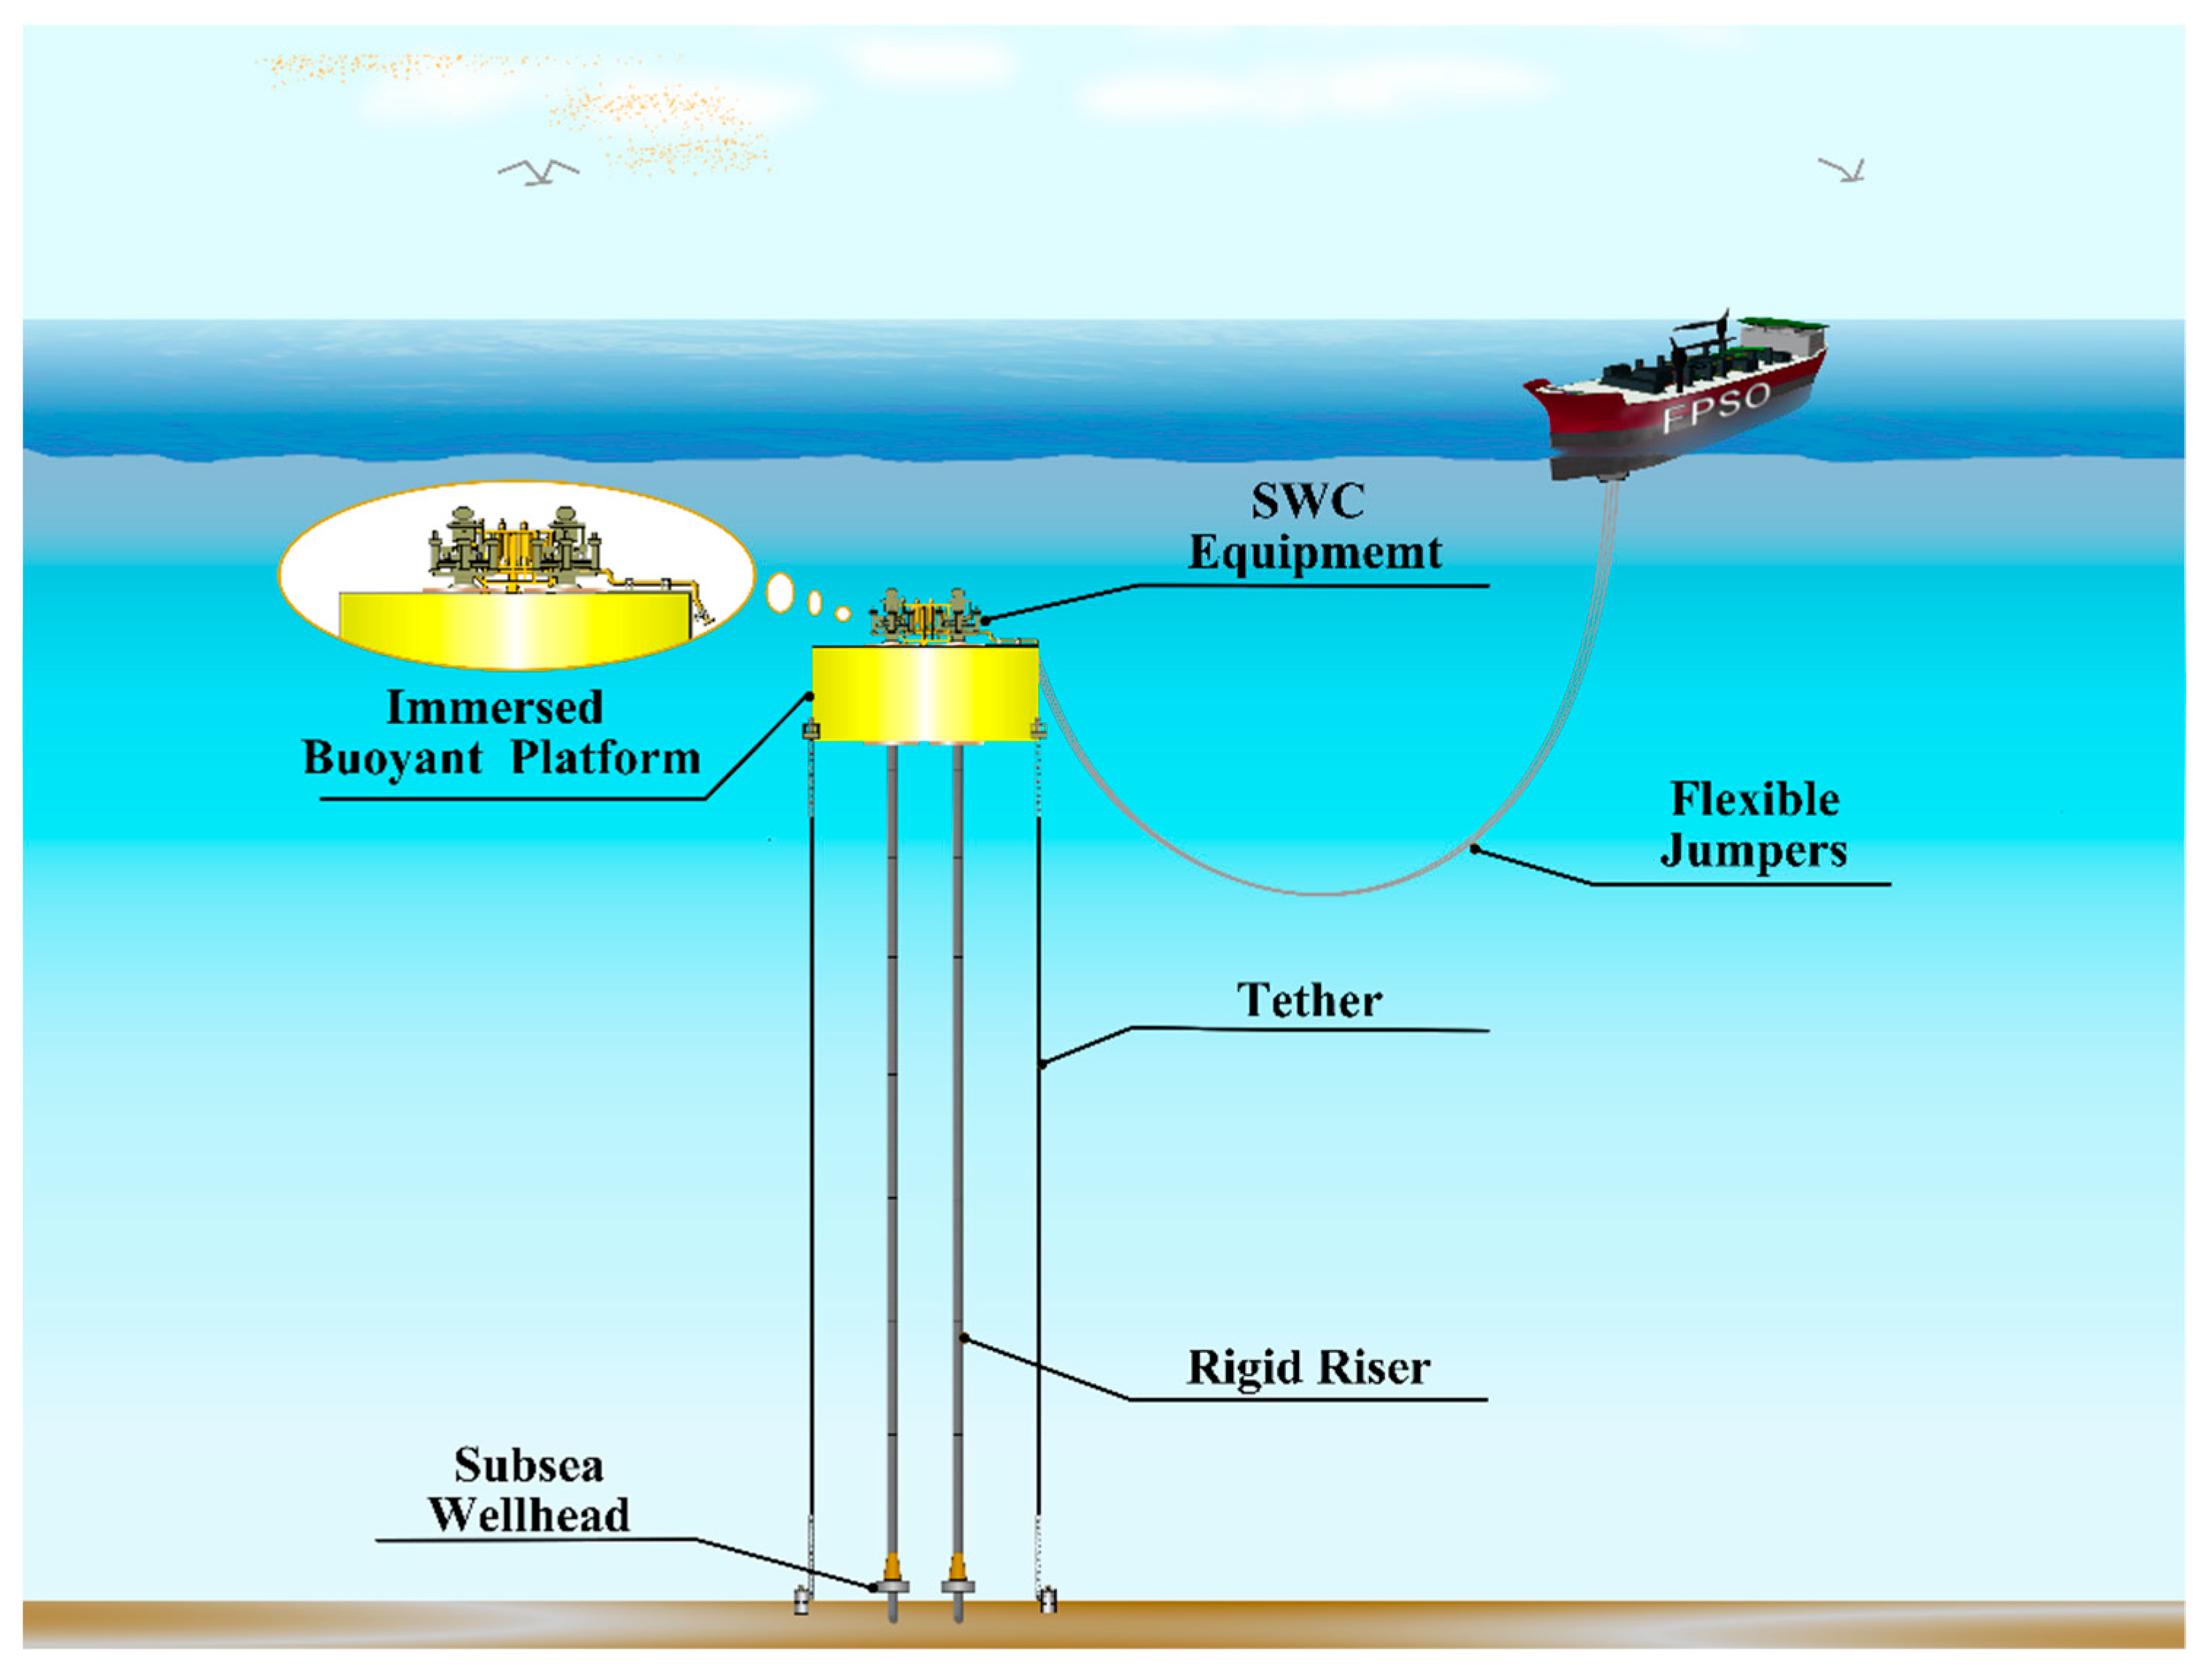
1.1. Background
1.2. Relevant Research Works and Objective
1.3. Arrangement of Paper
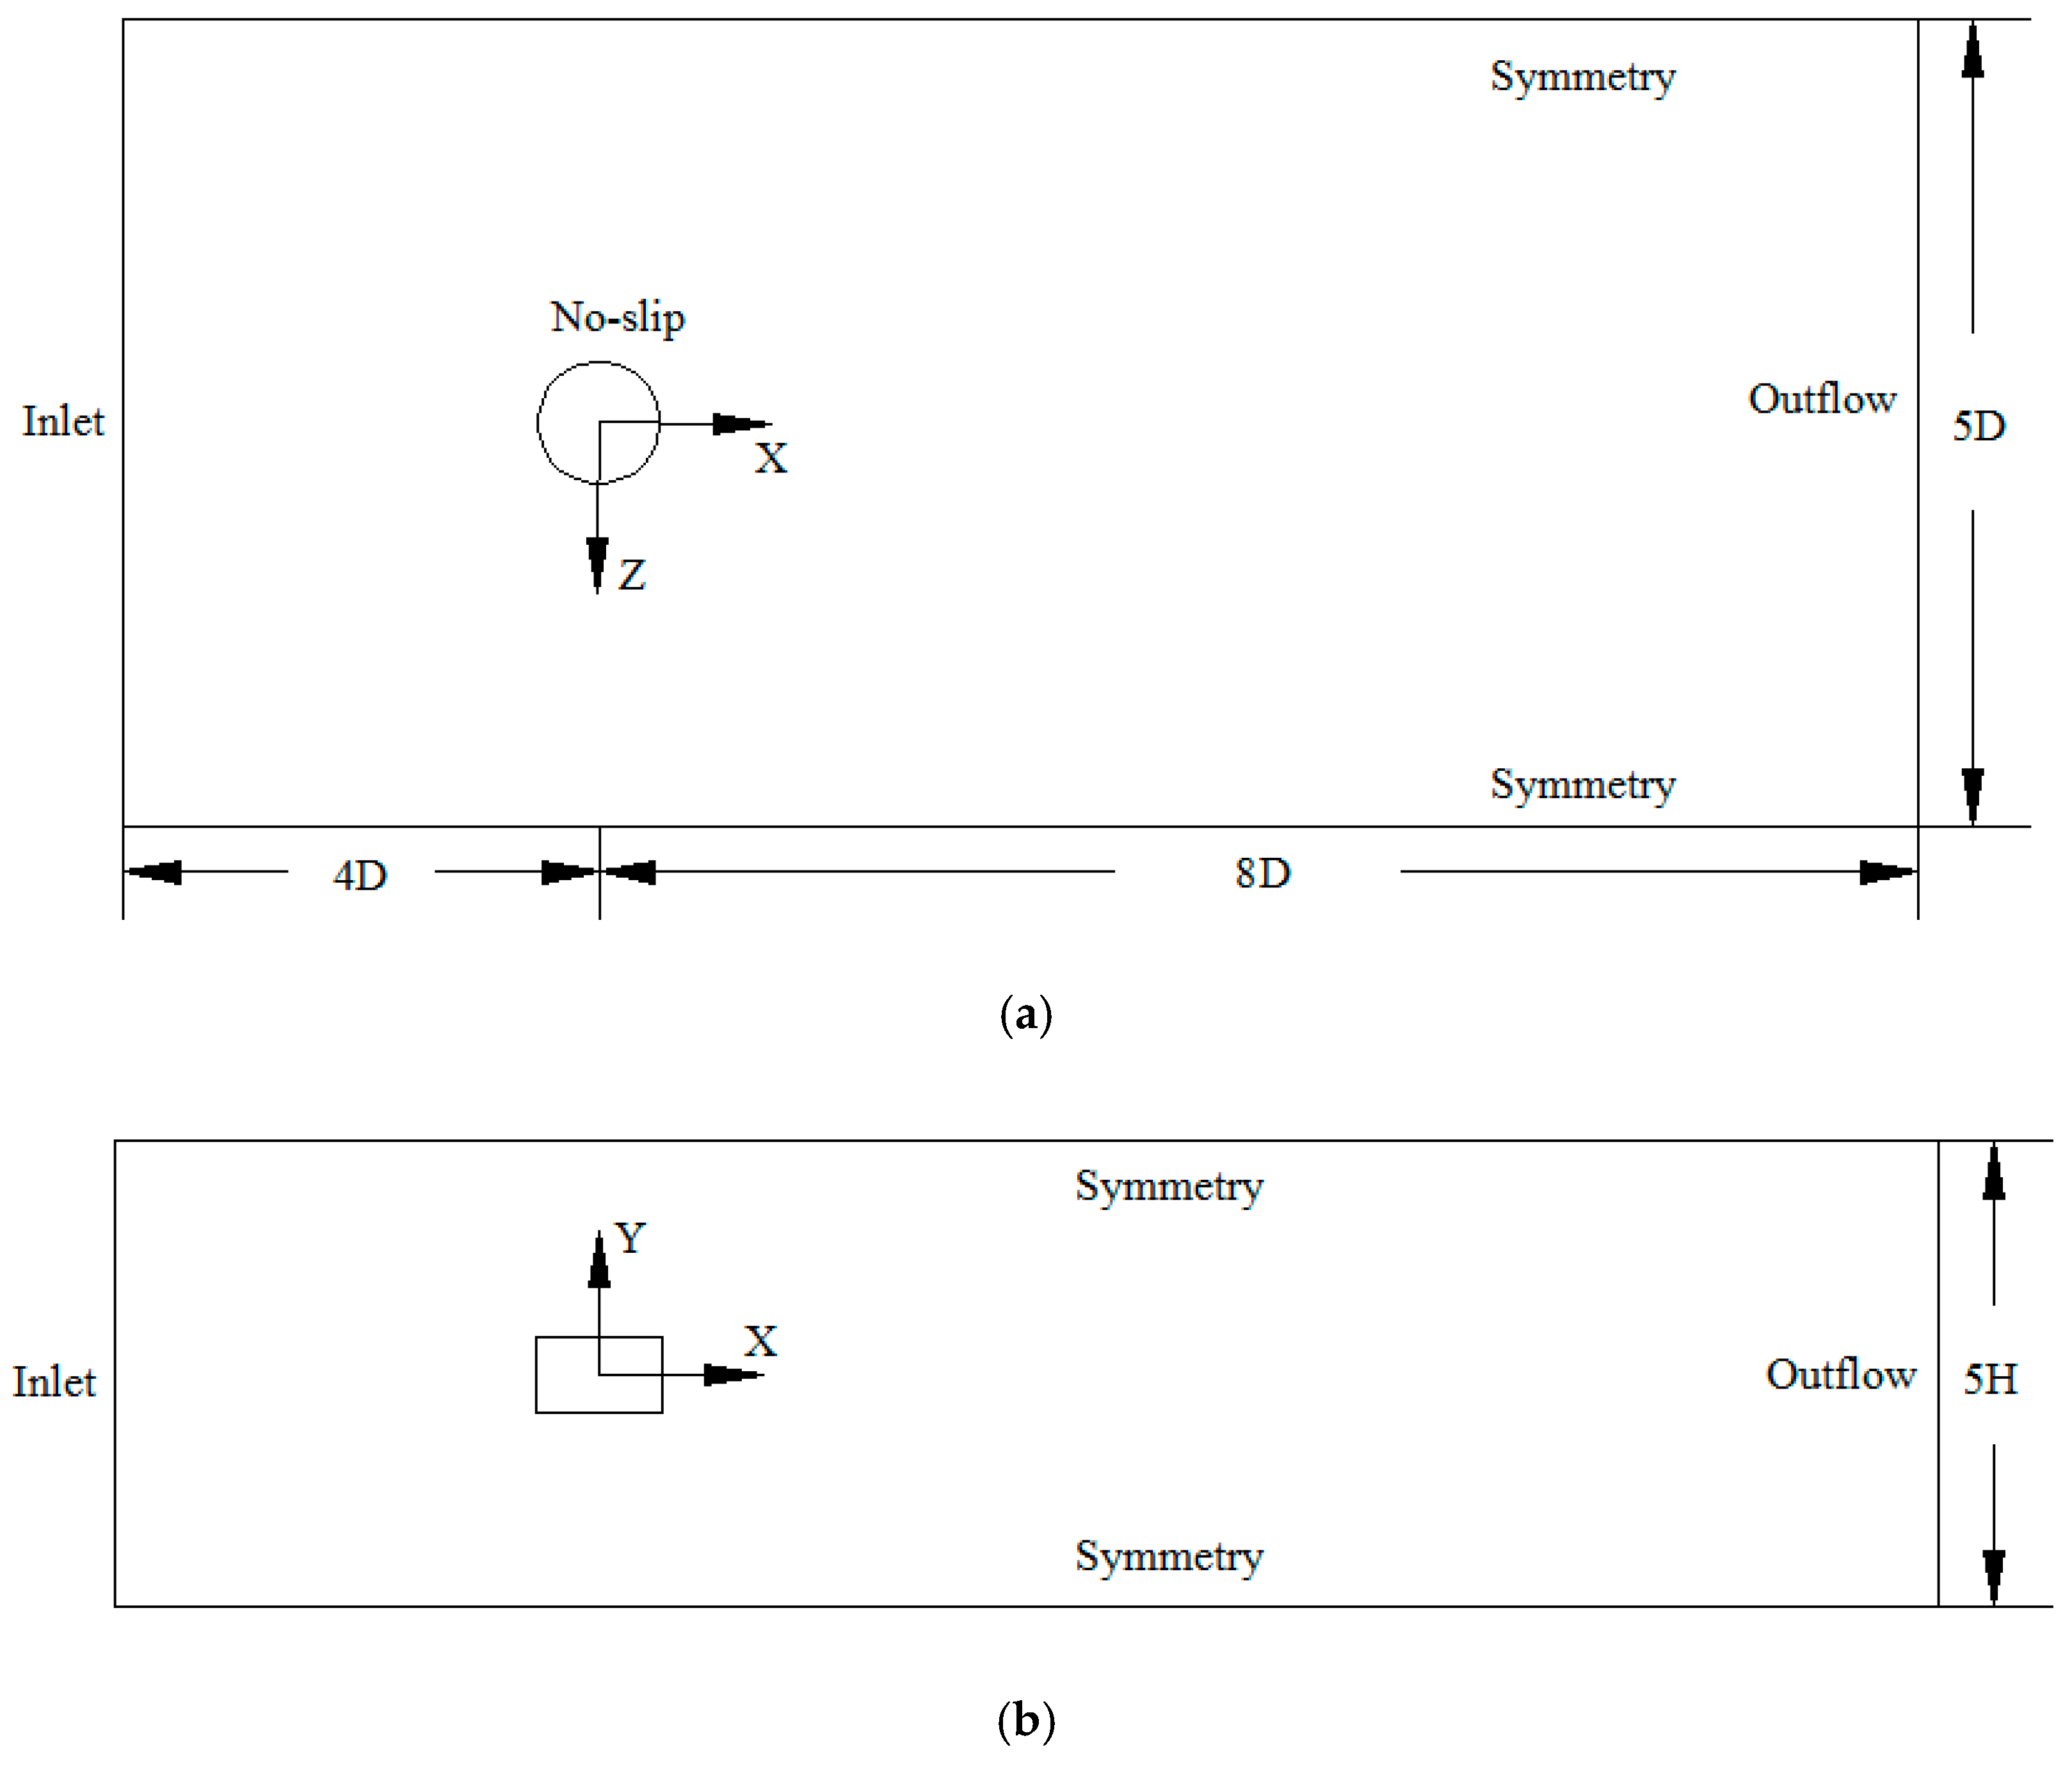
2. Numerical Model and Method
2.1. Governing Equations
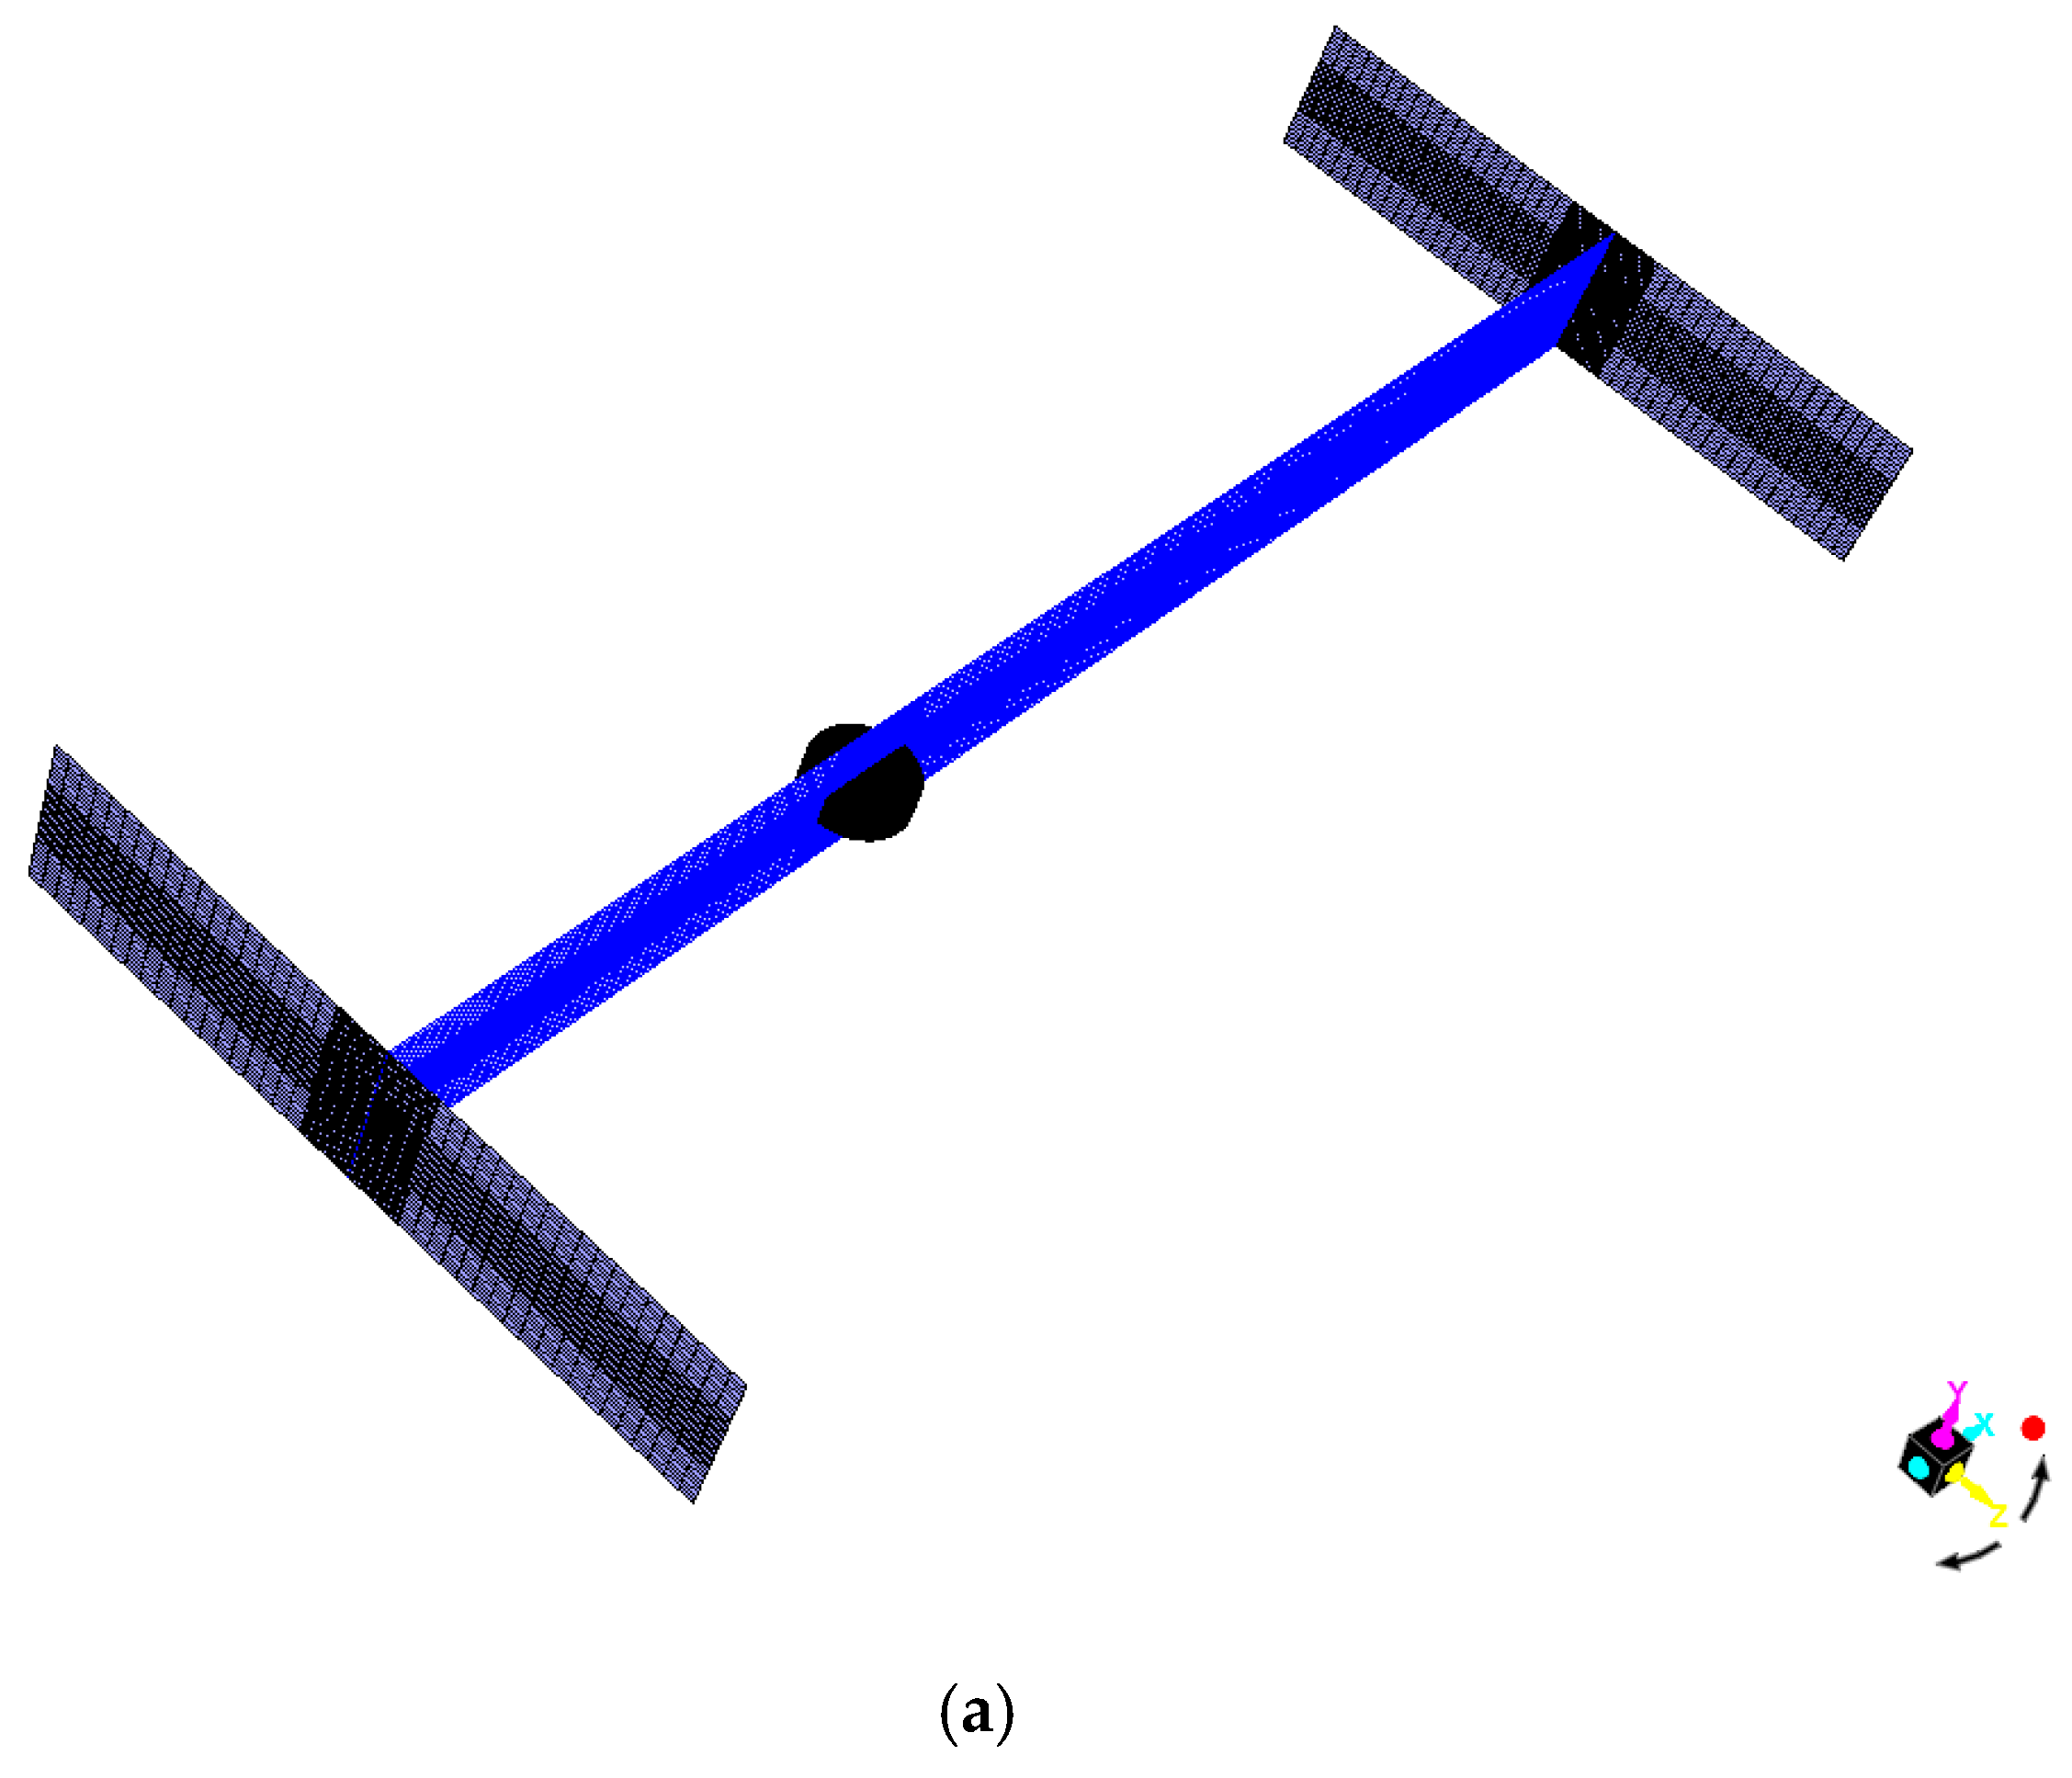
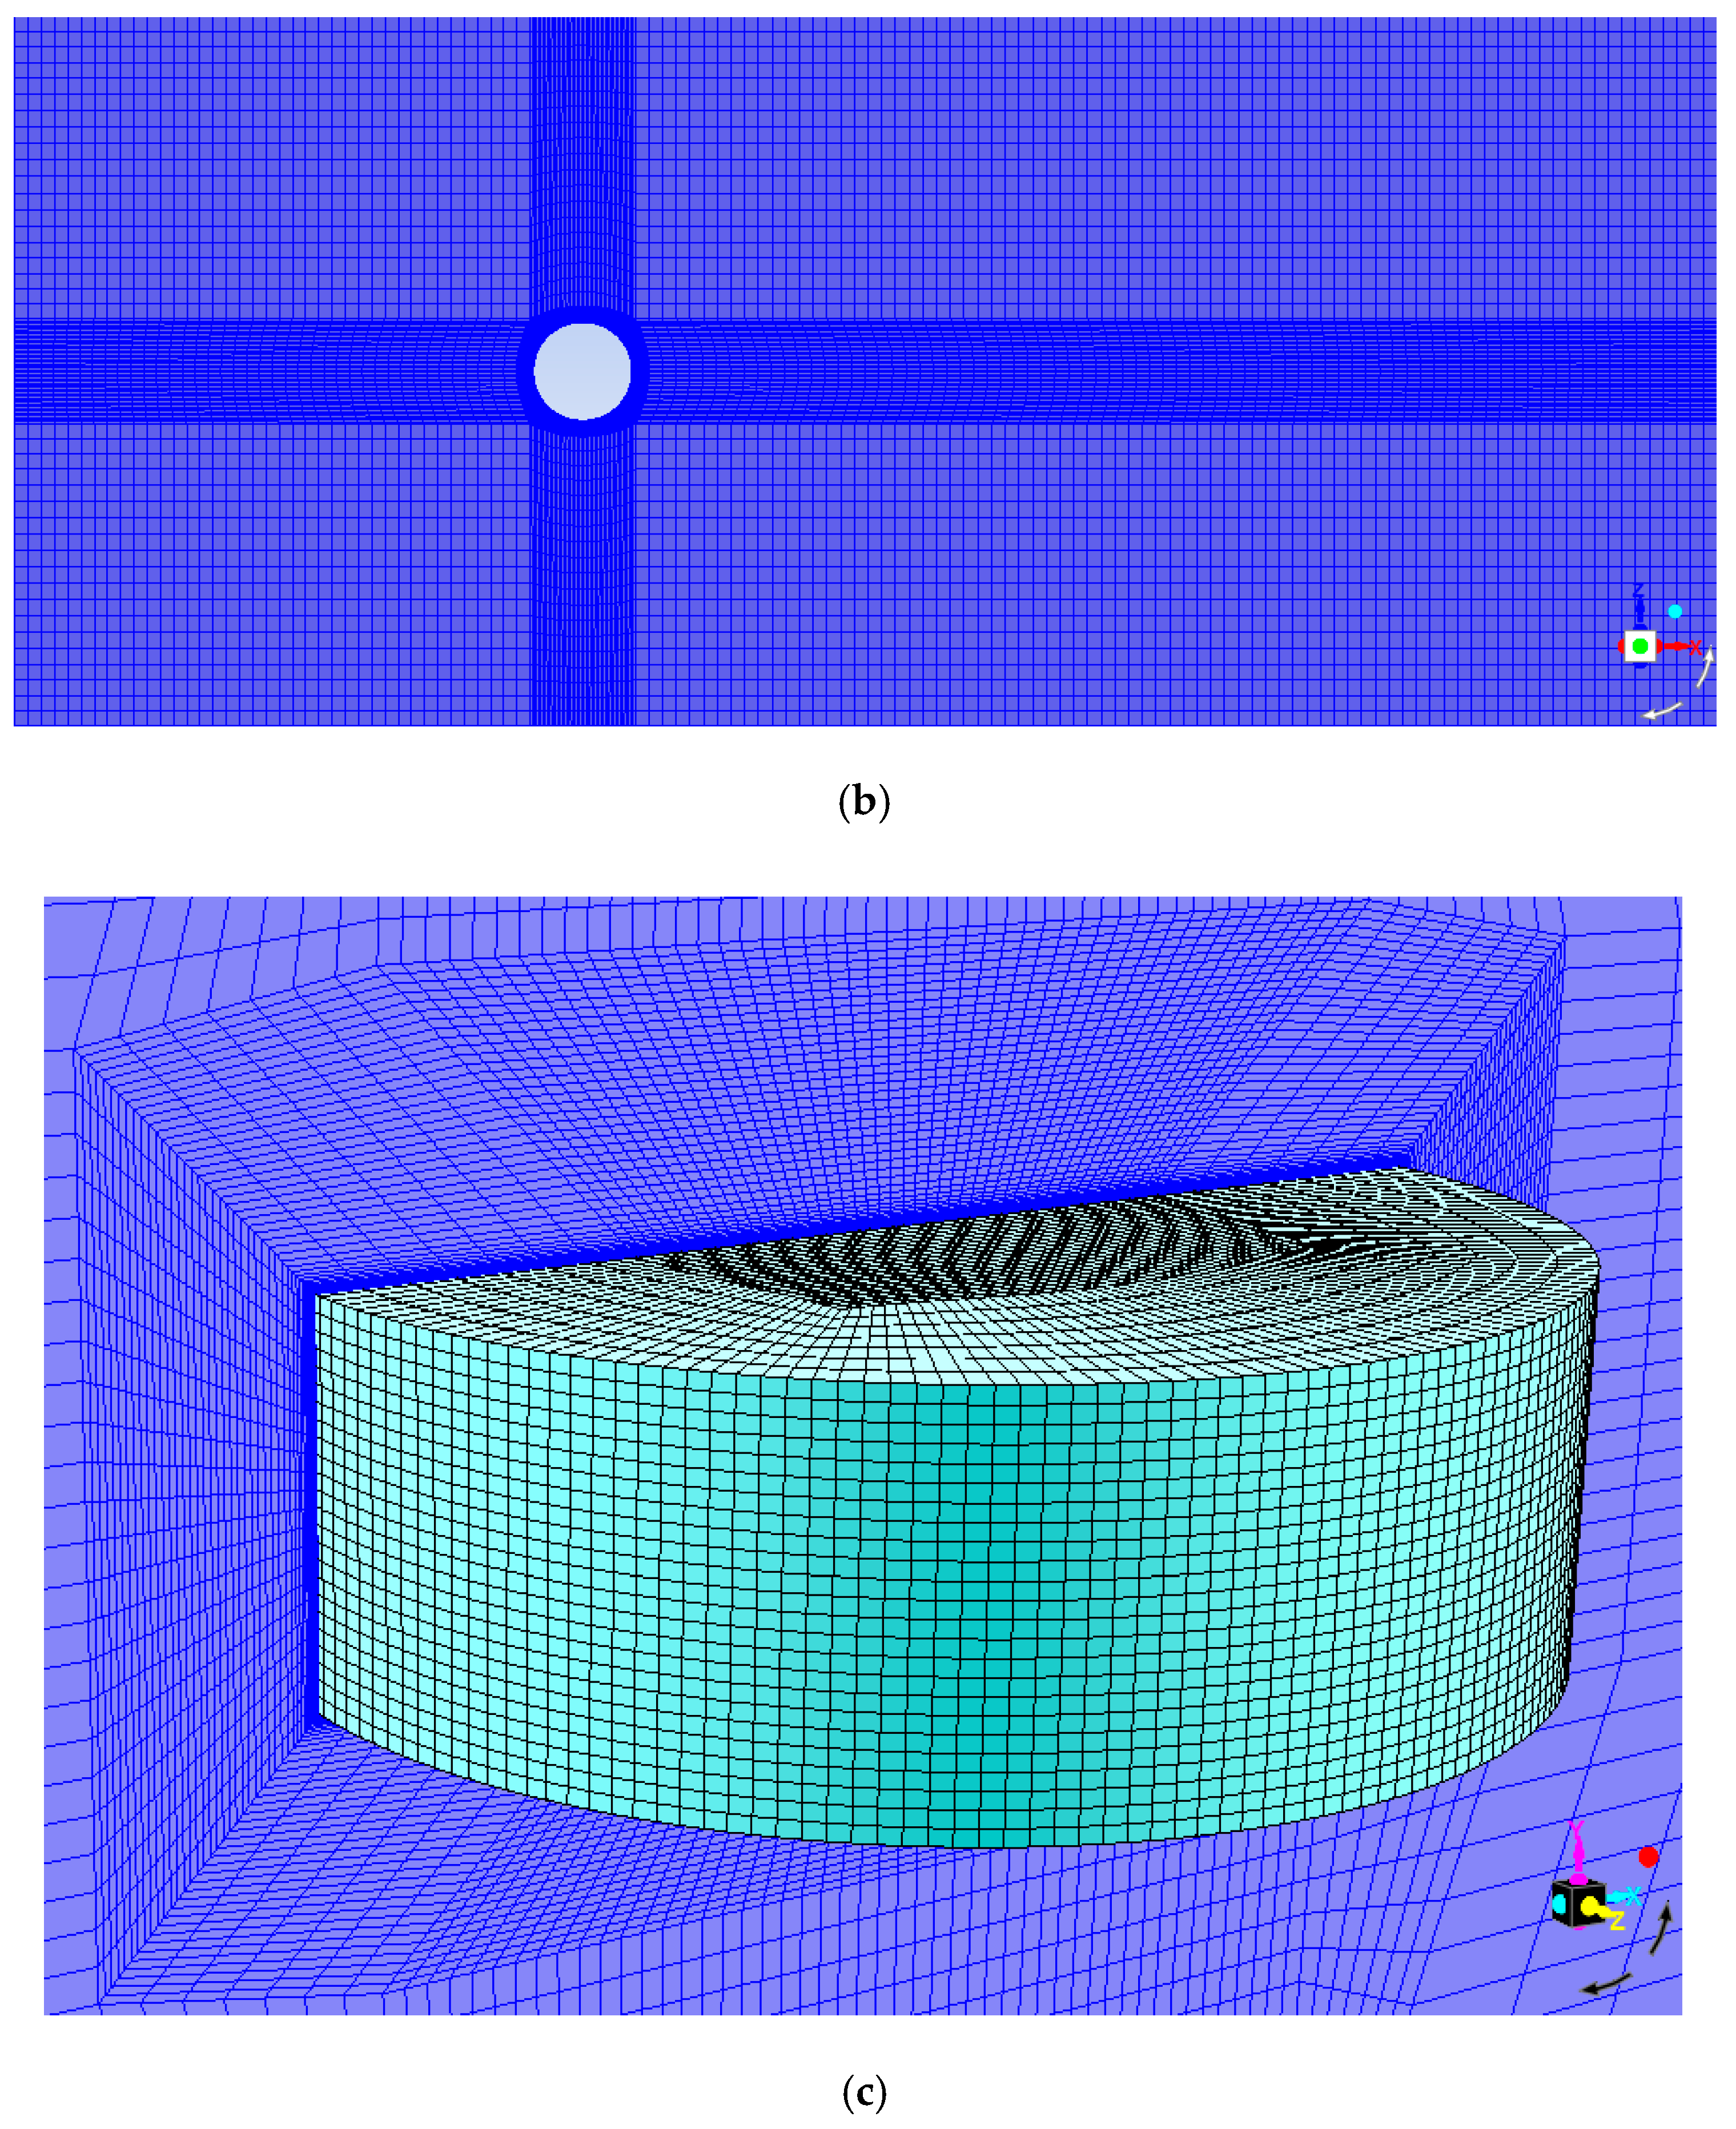
2.2. Numerical Scheme
3. Mesh Independence and Validation
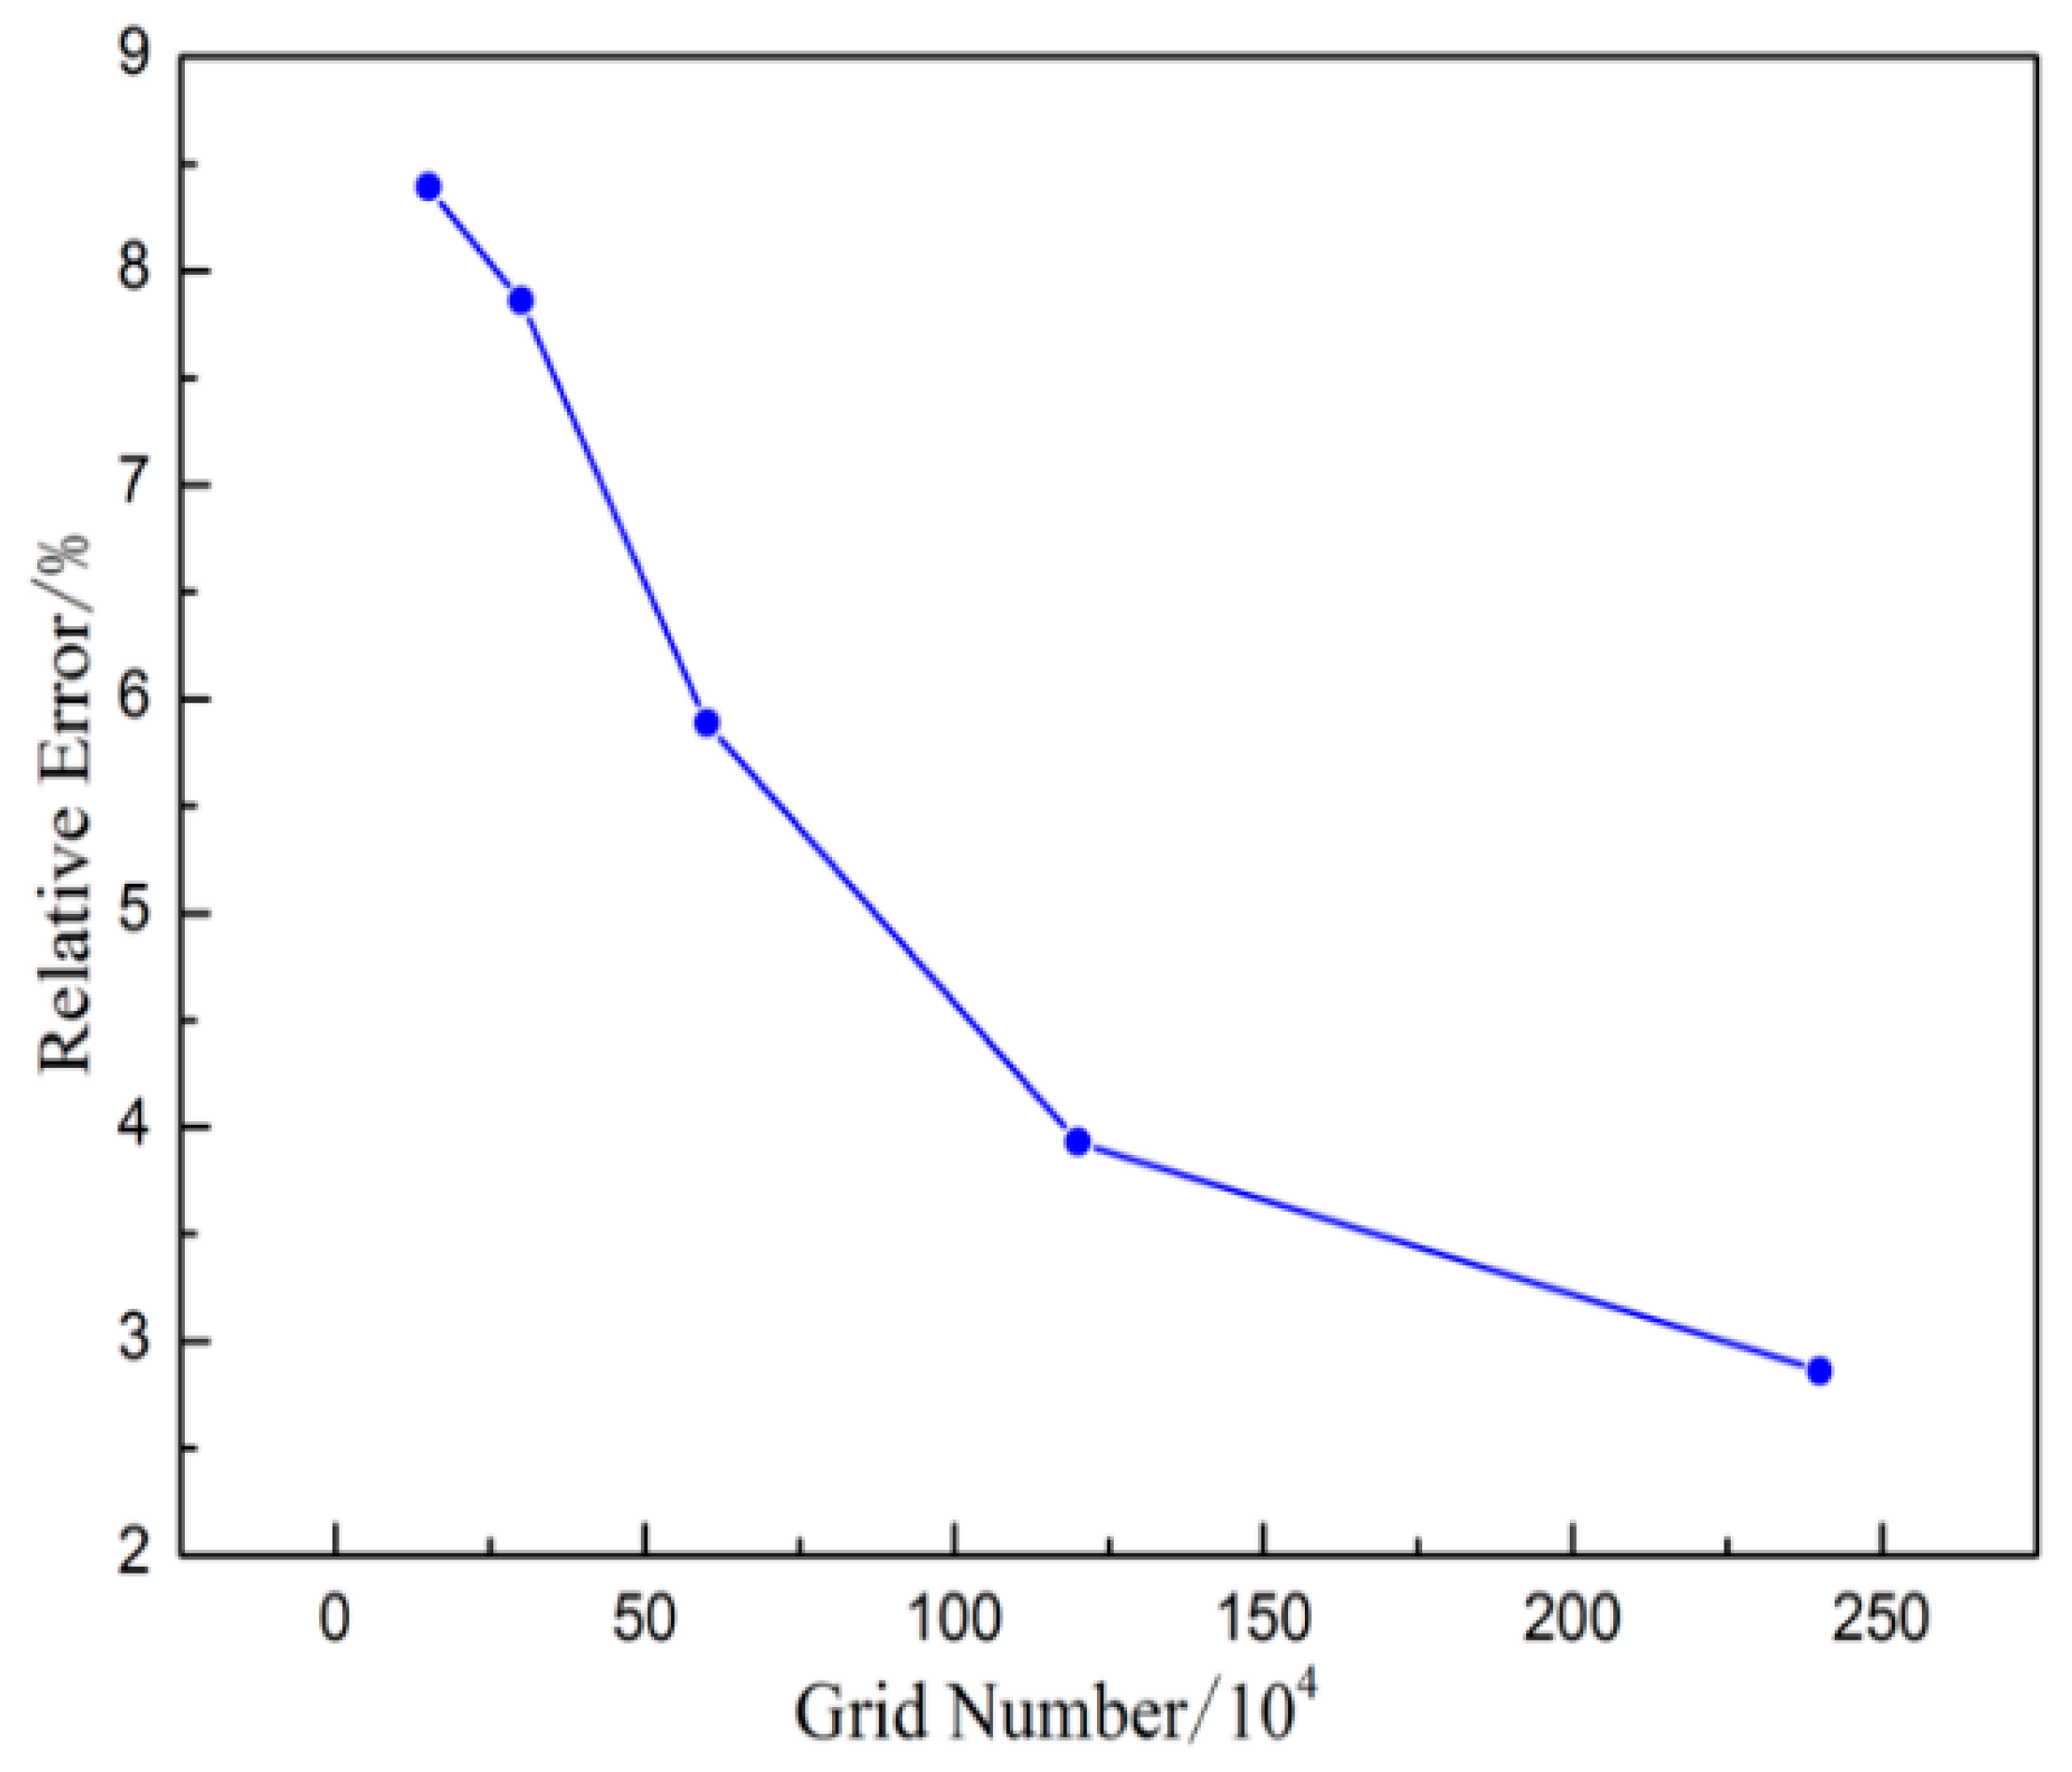
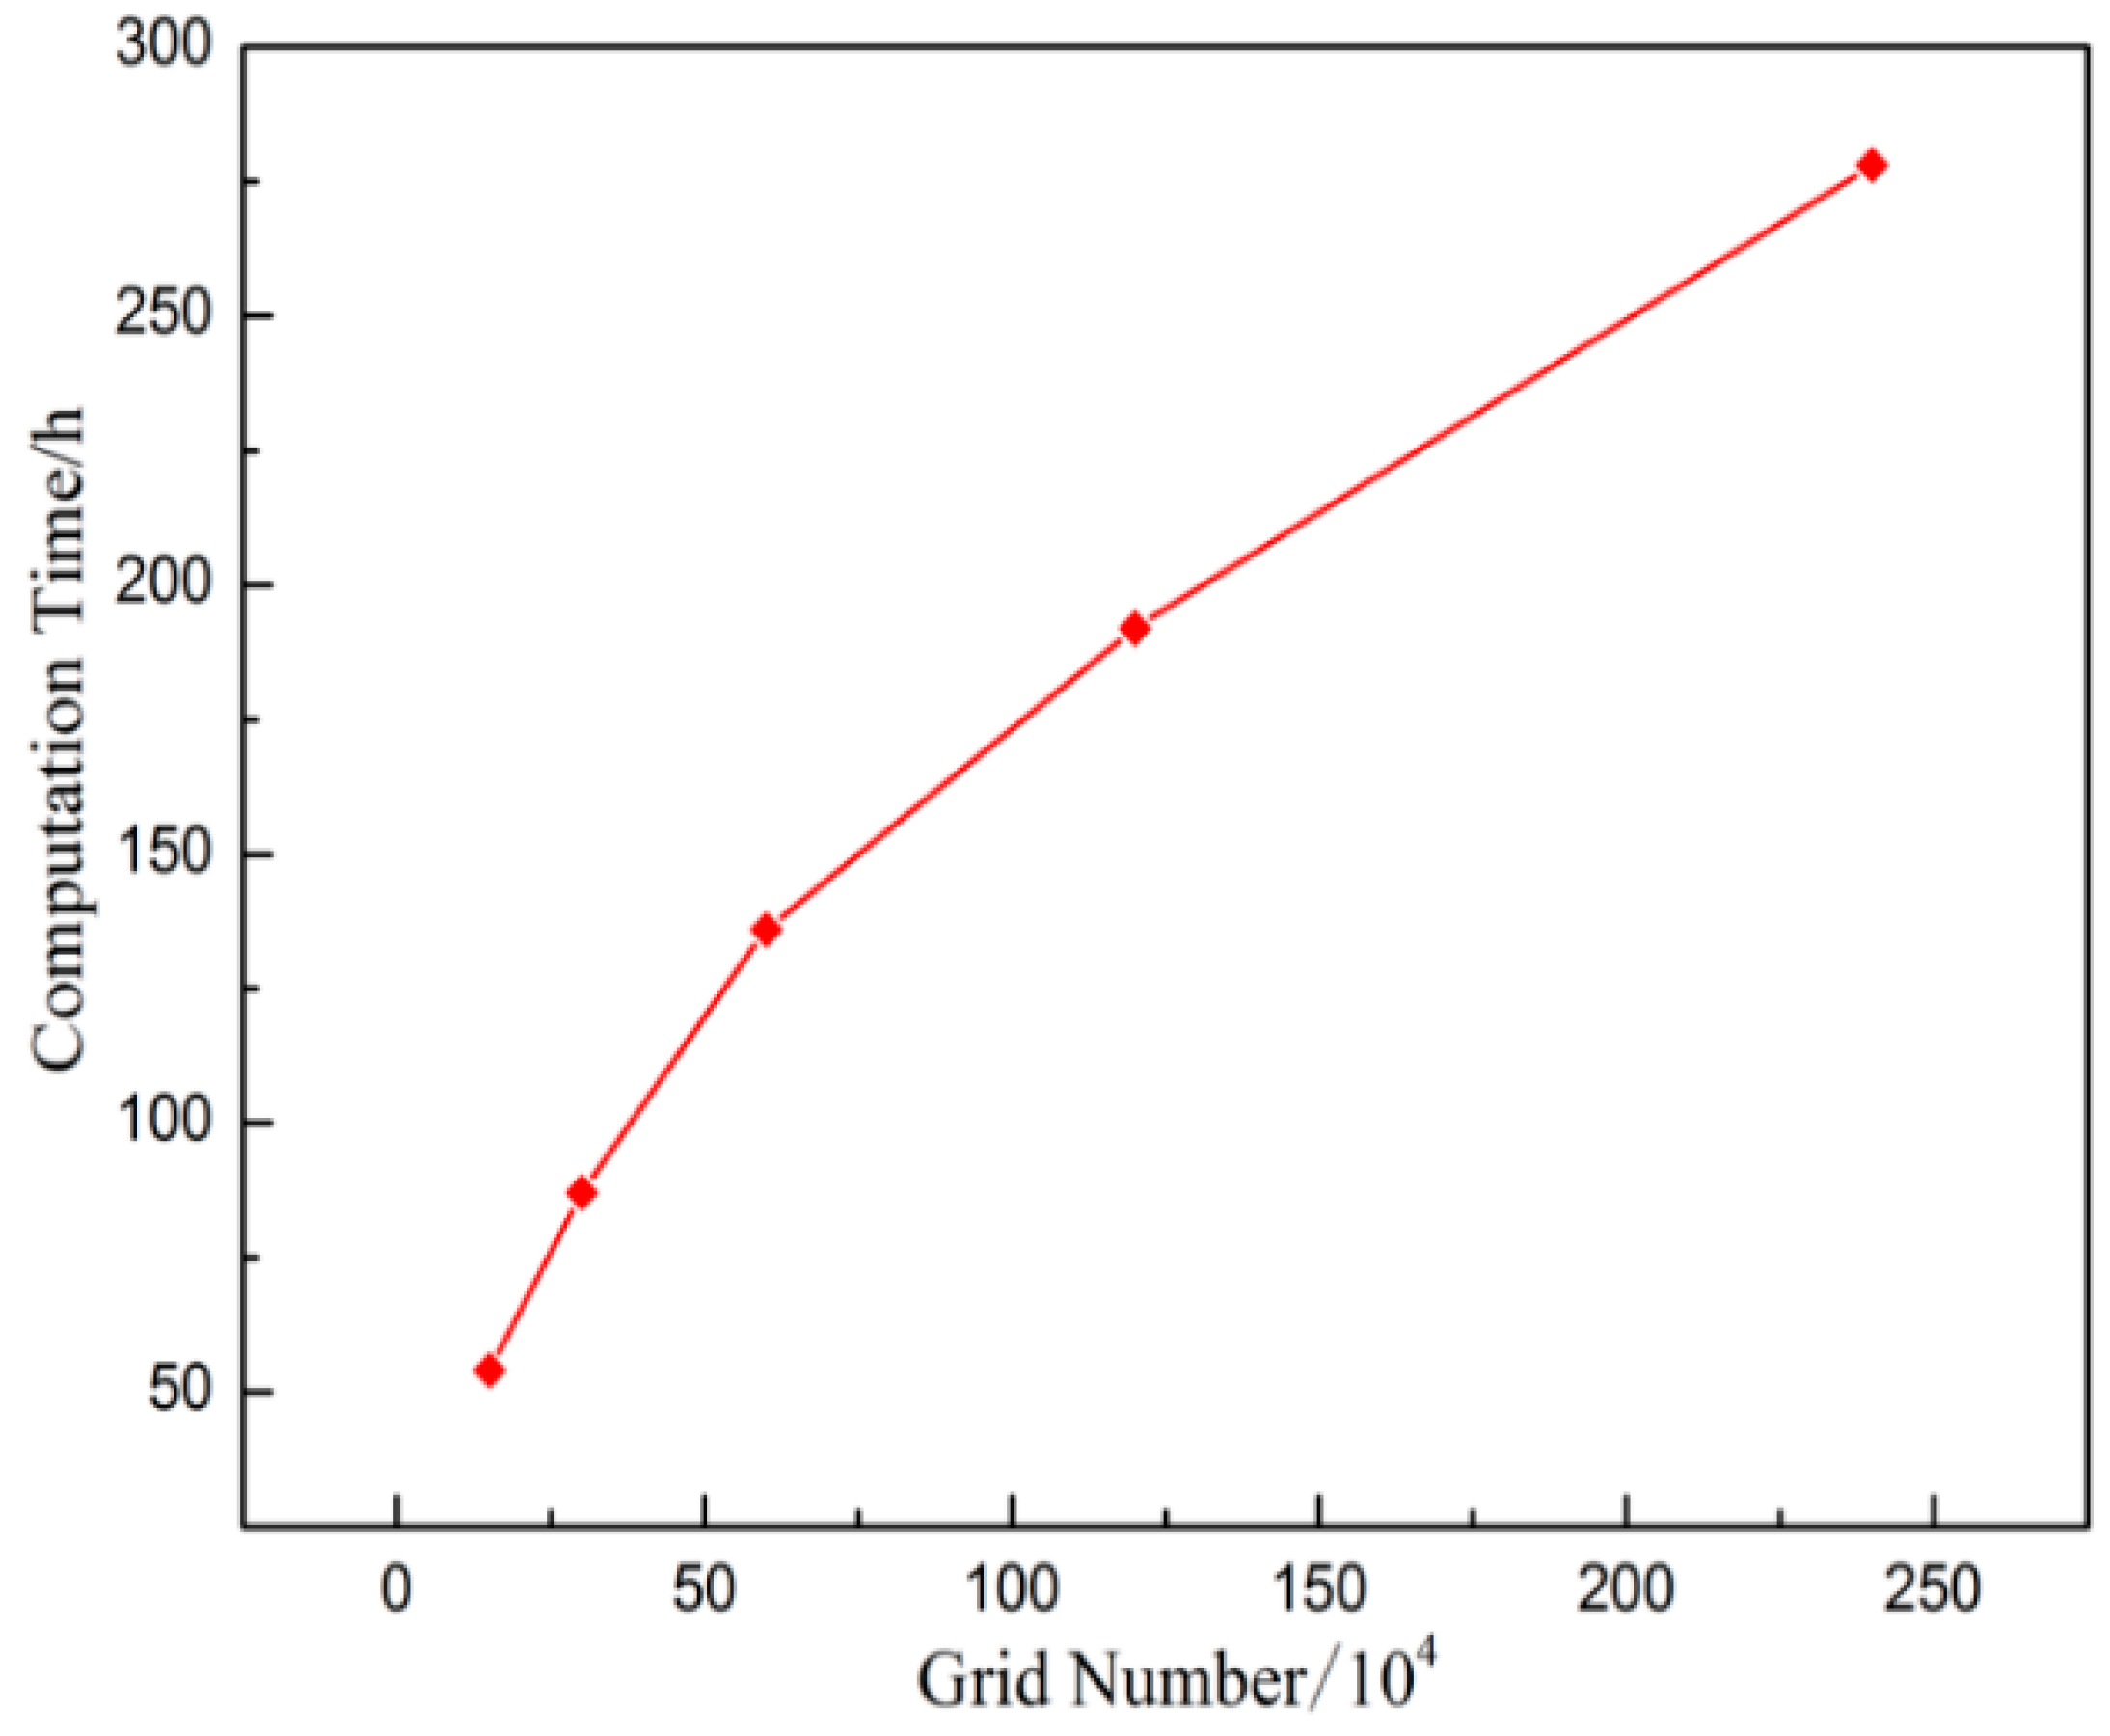
3.1. Mesh Independence
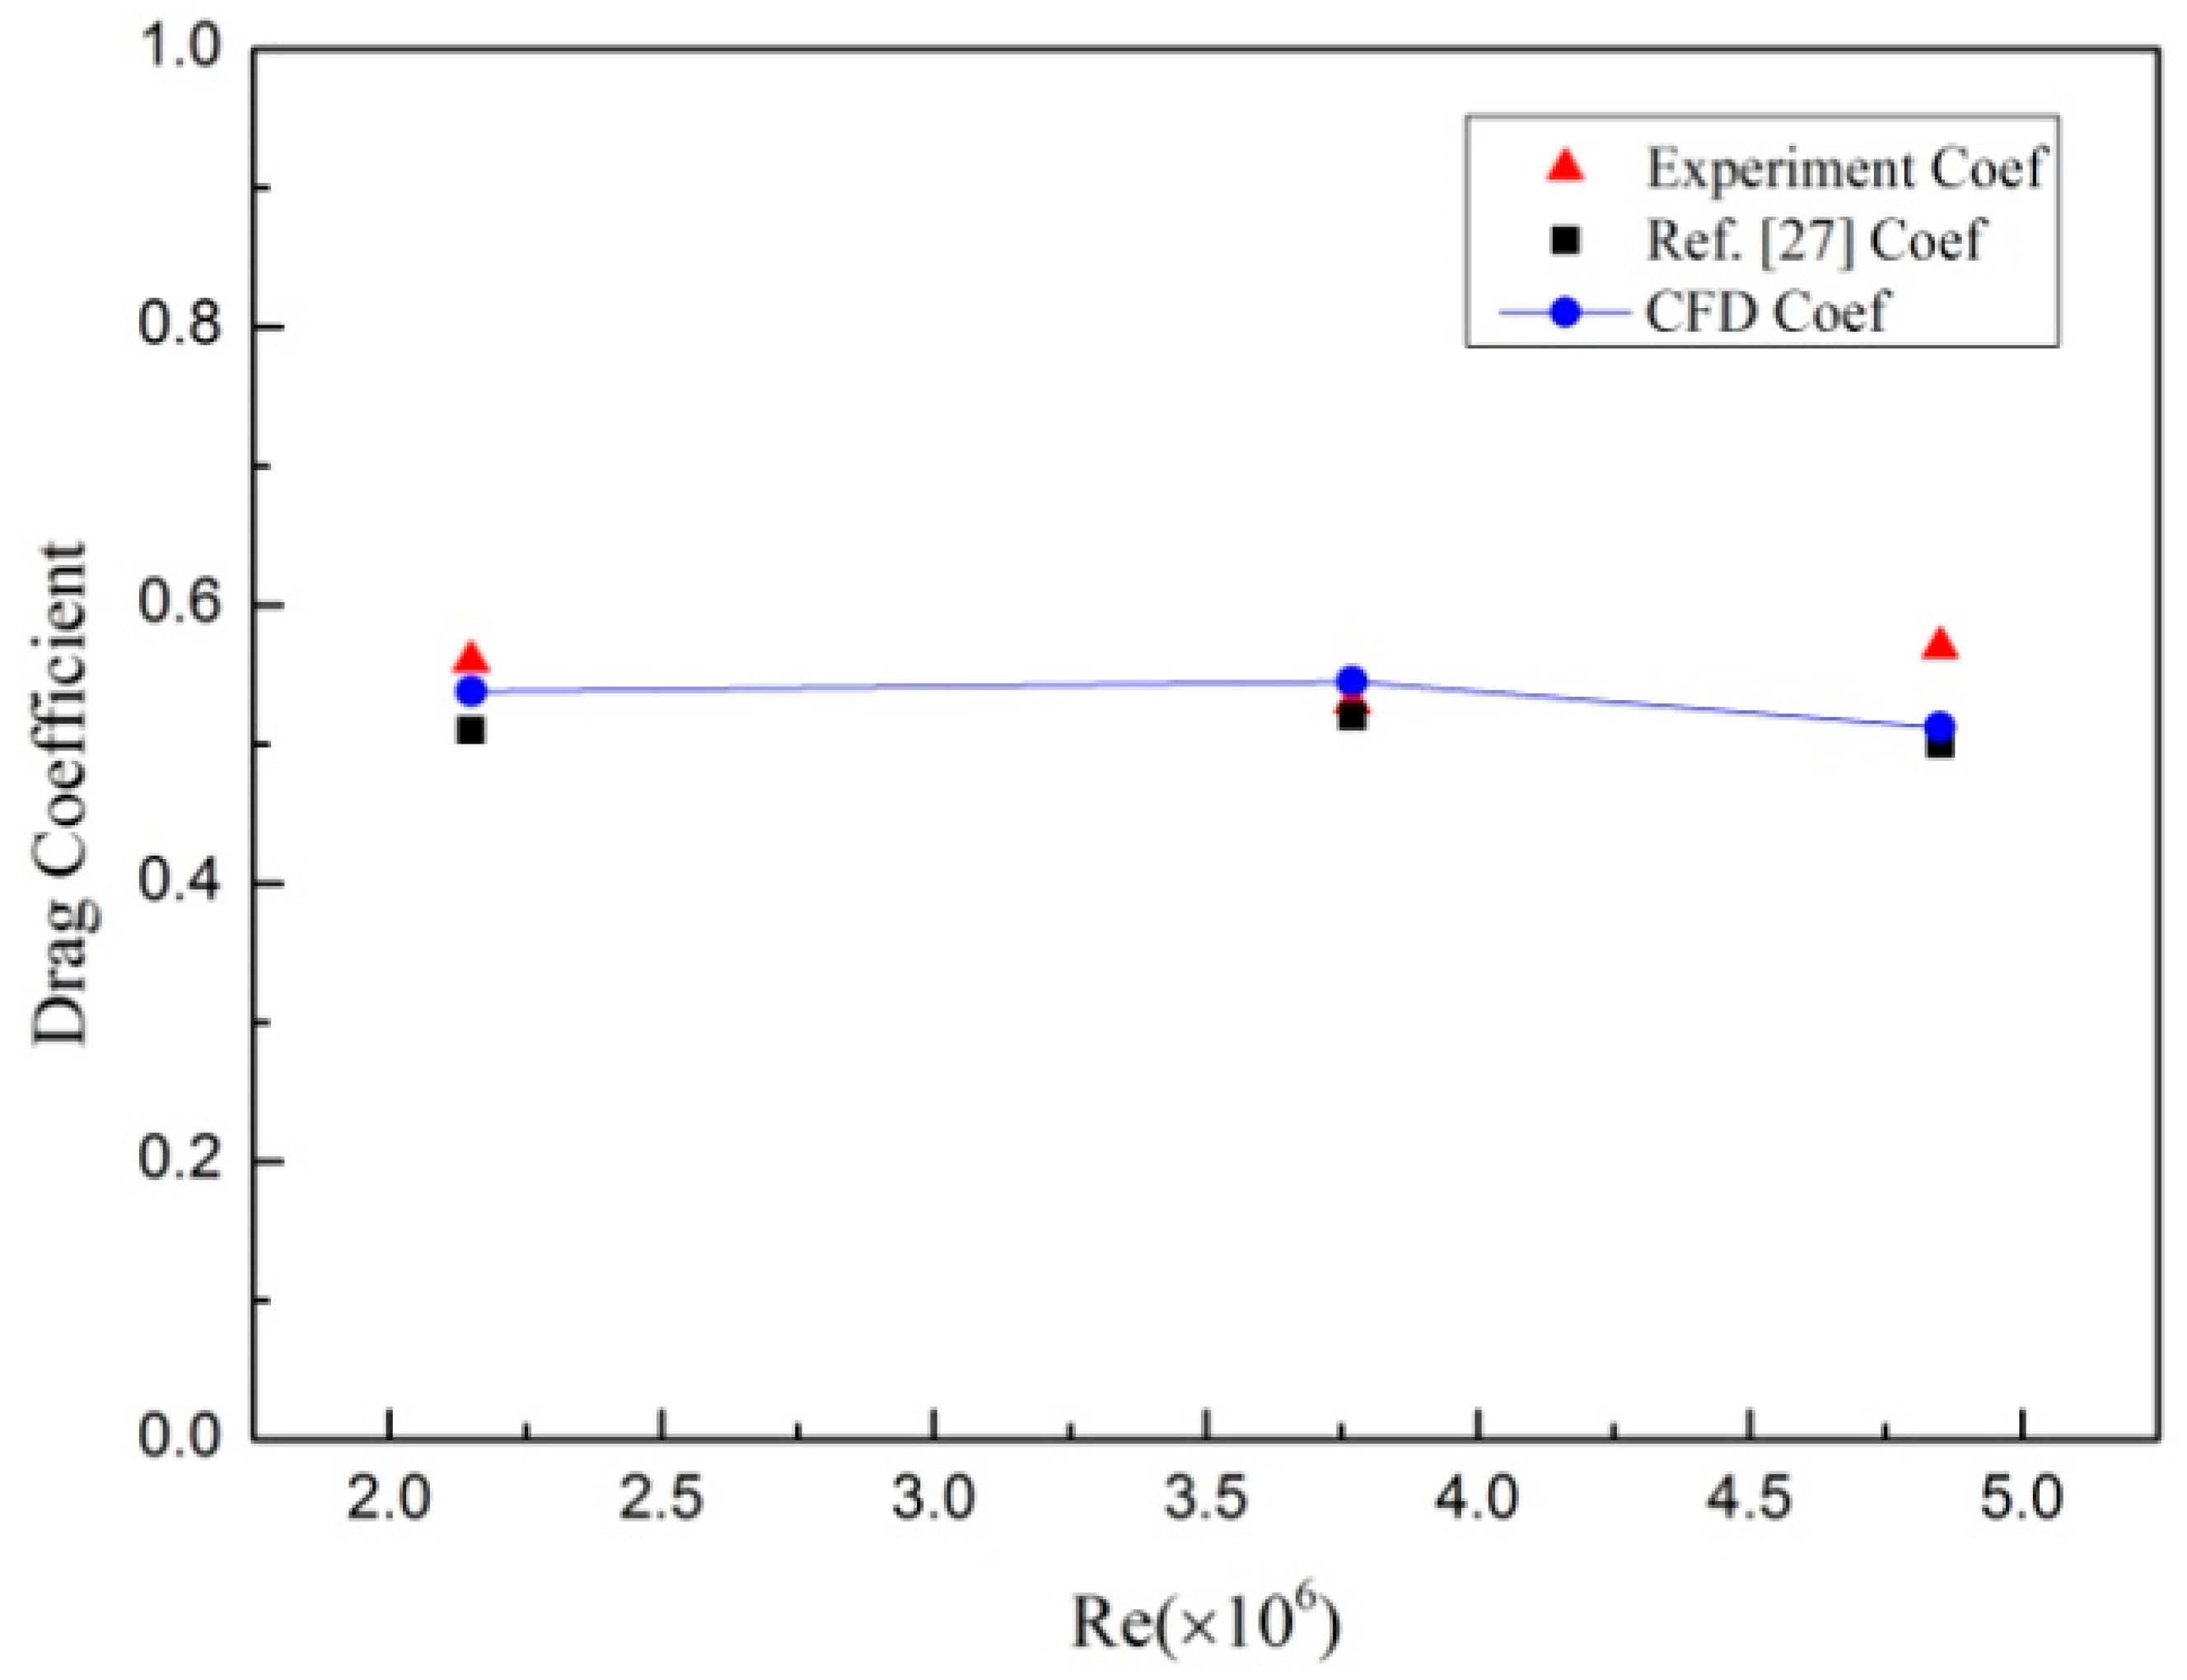
3.2. Verification
4. Results and Discussion
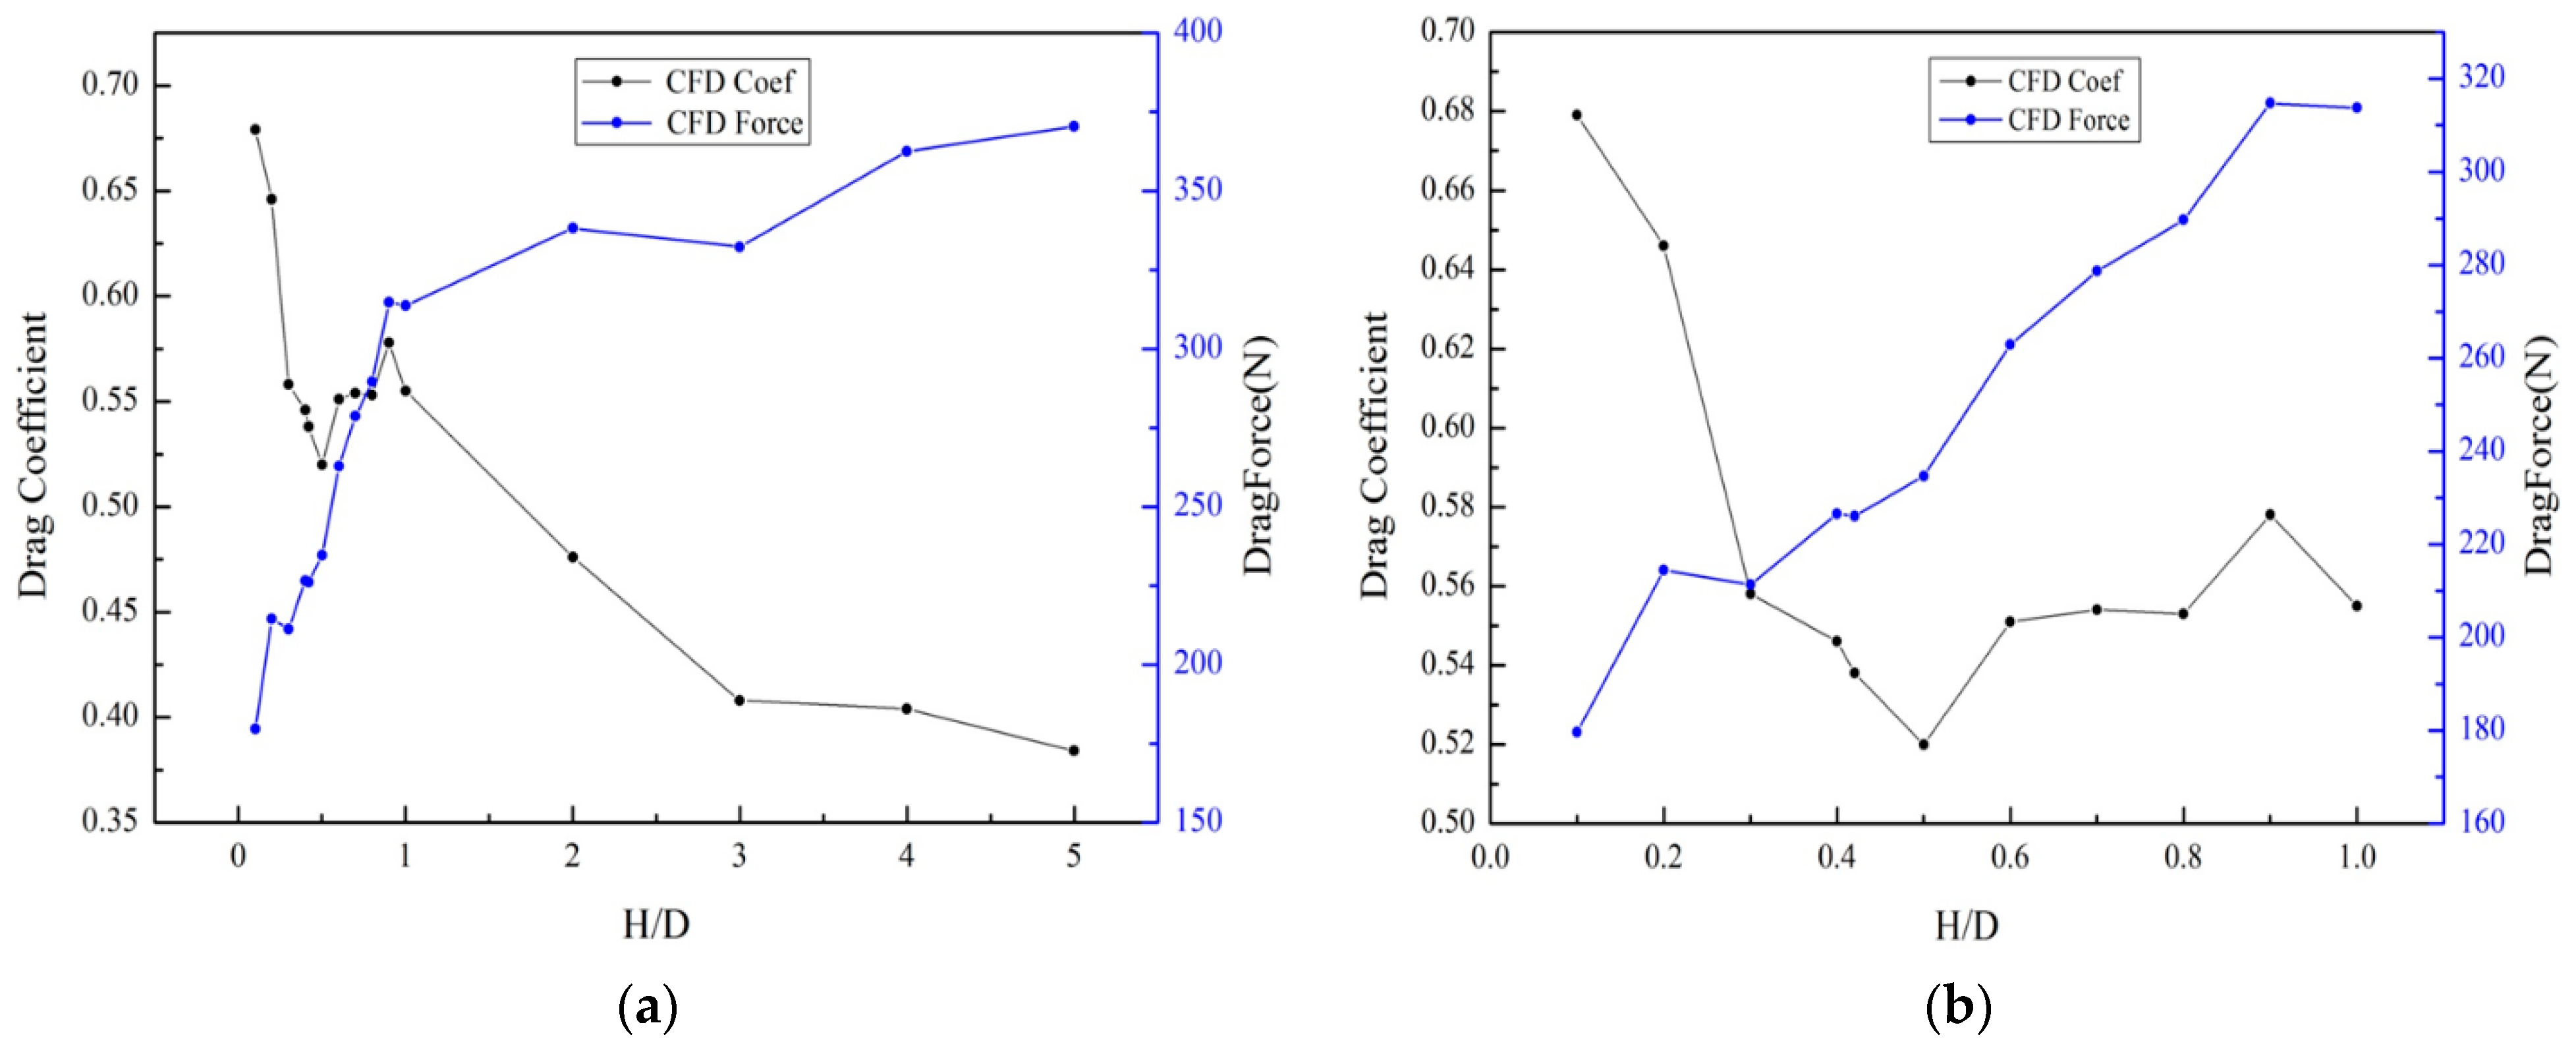
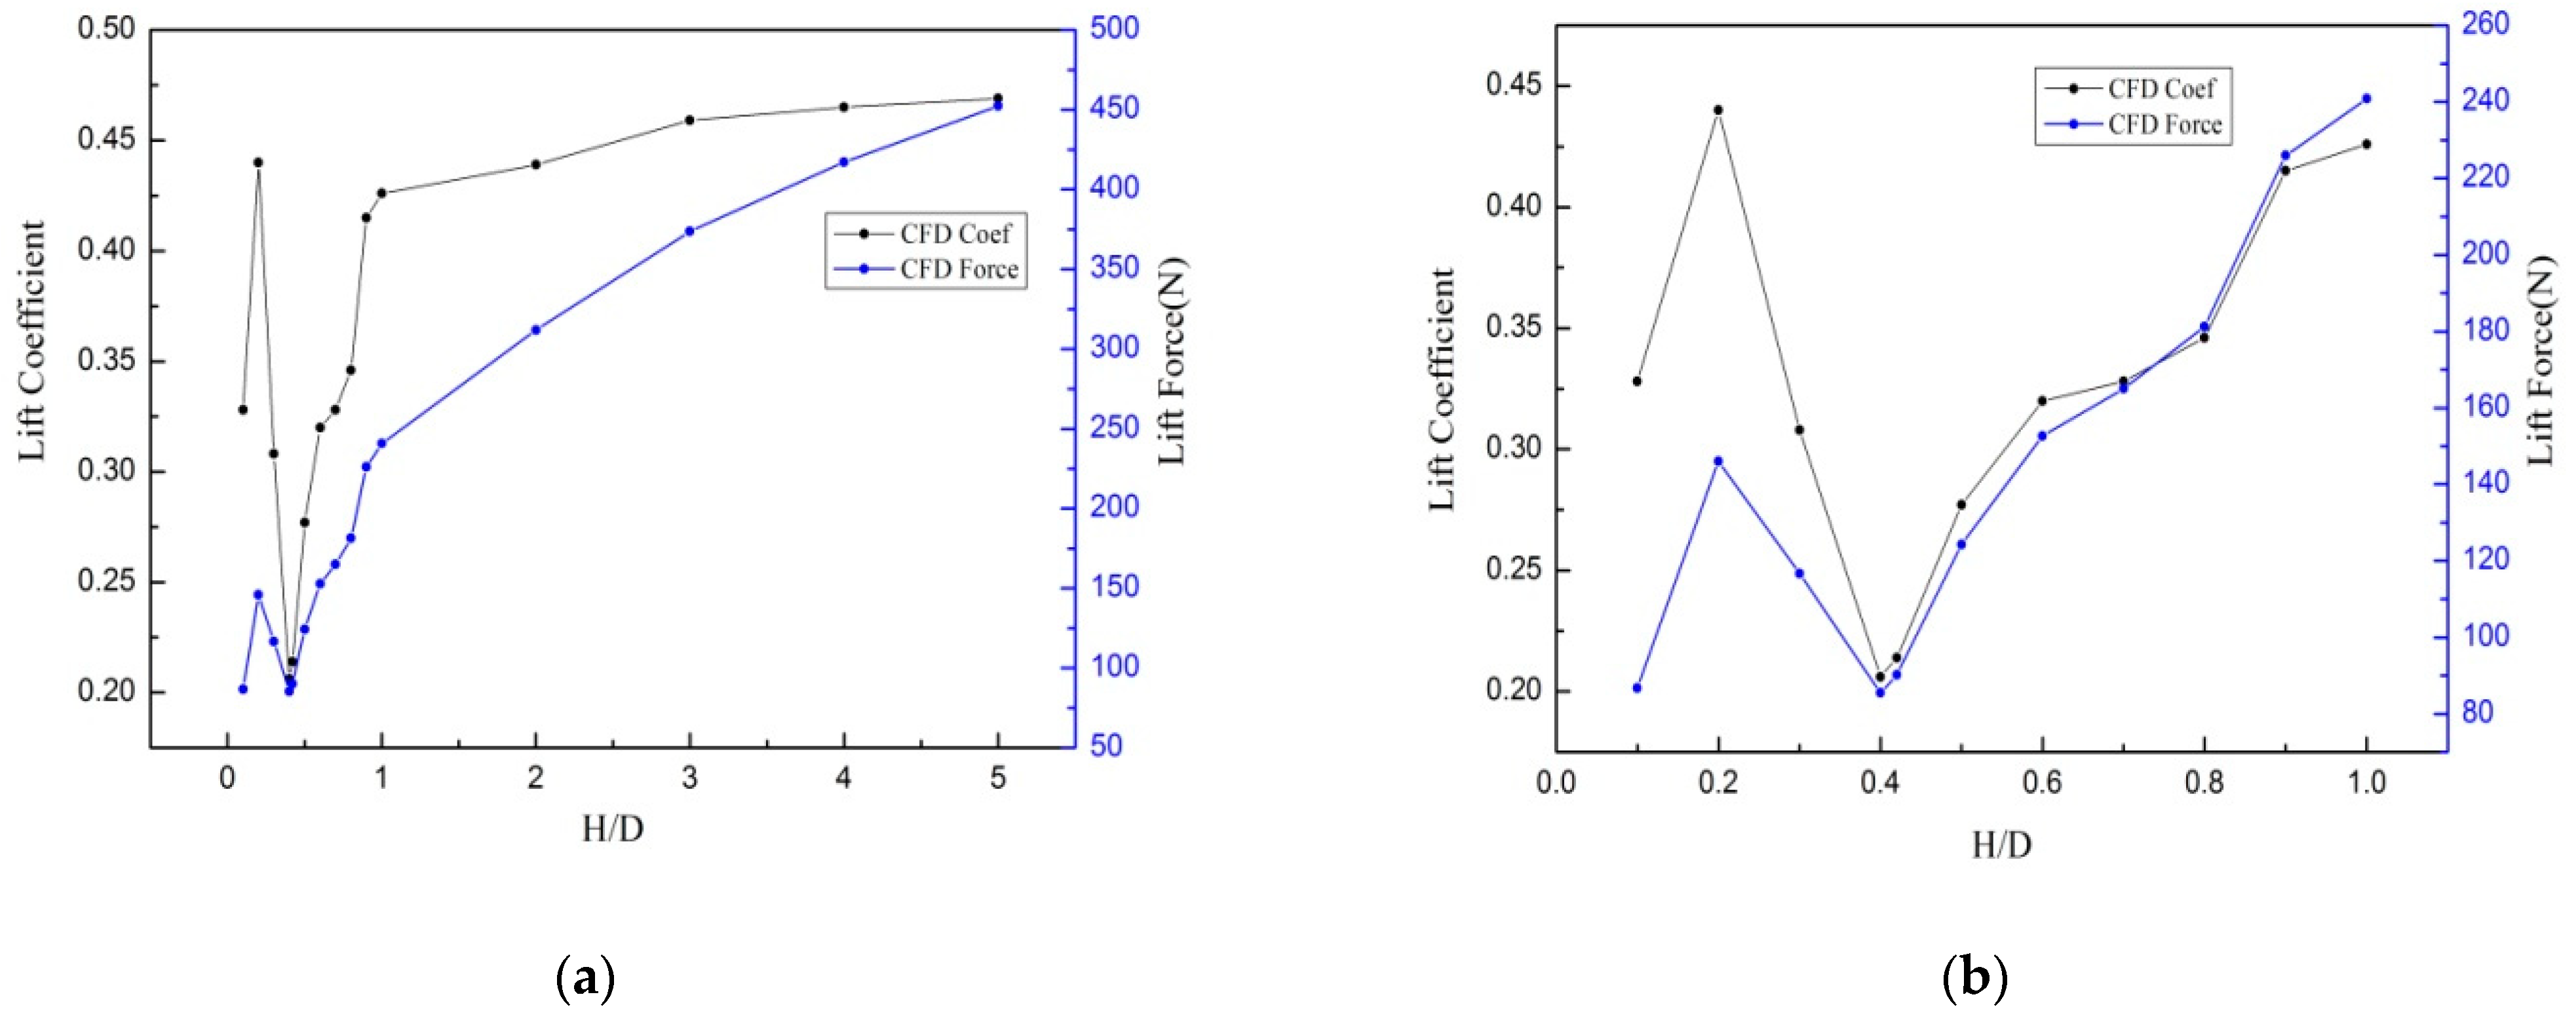
4.1. Average Quantities
4.2. Vortex Formation
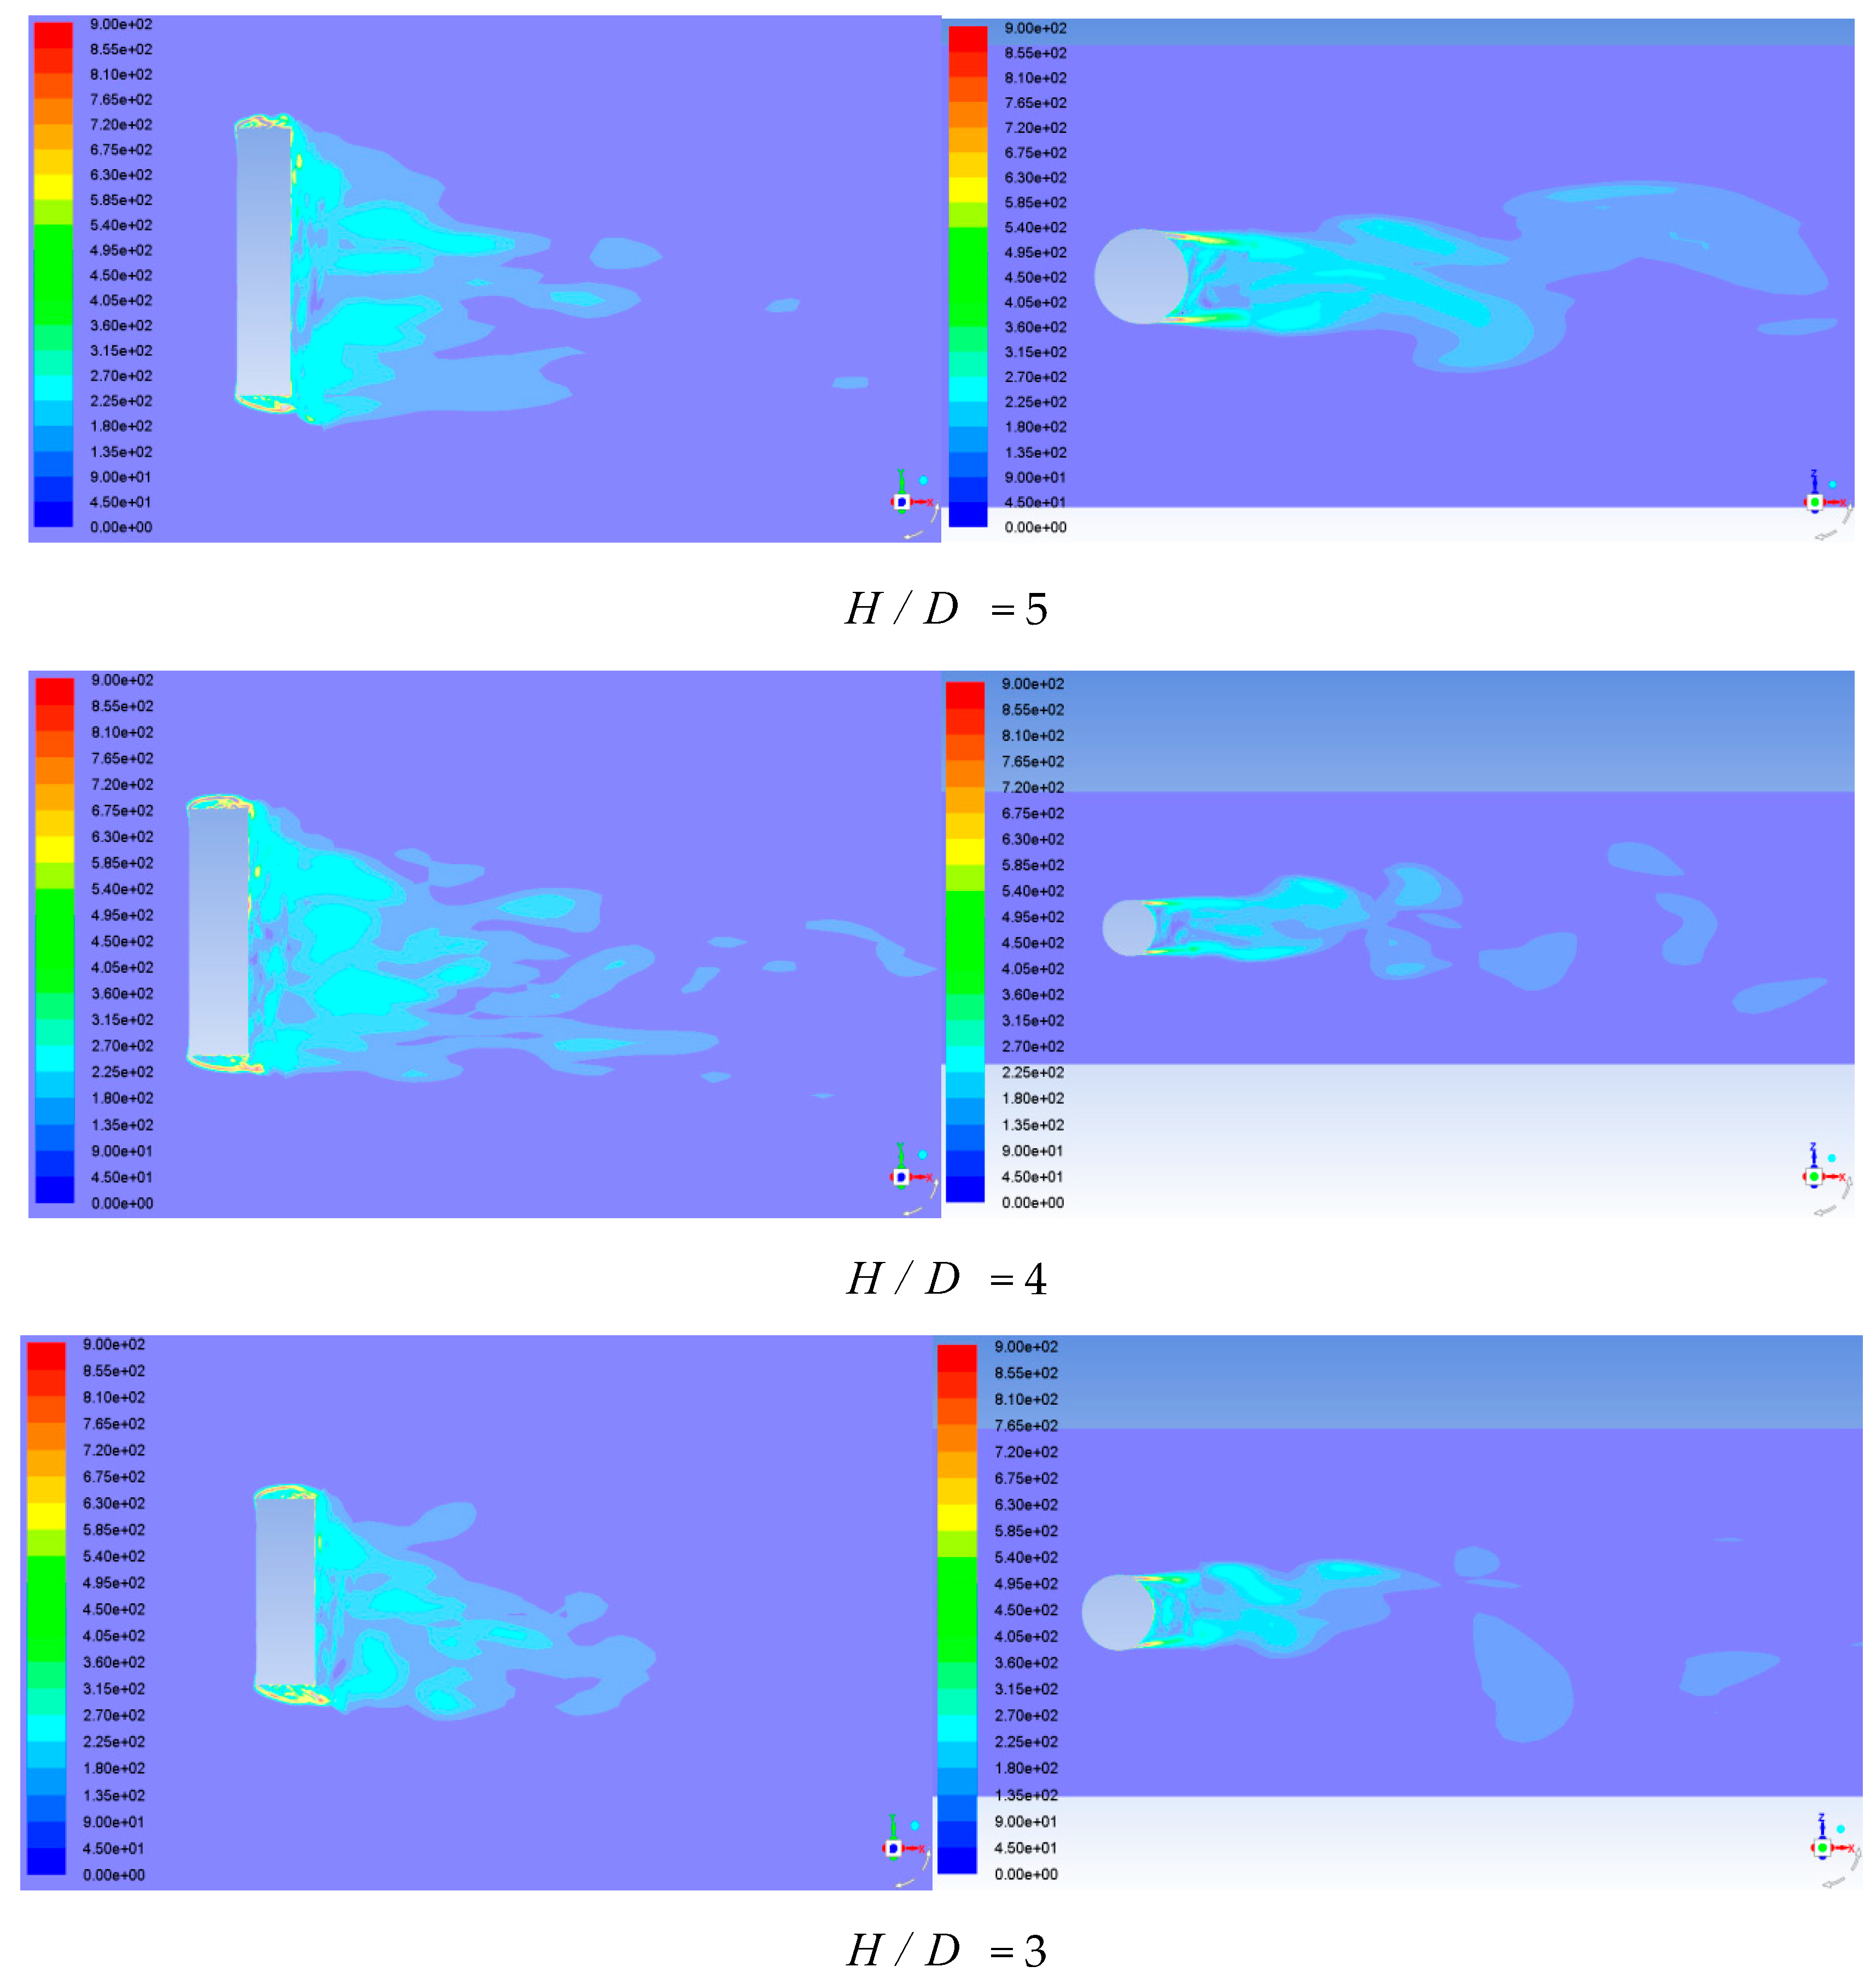
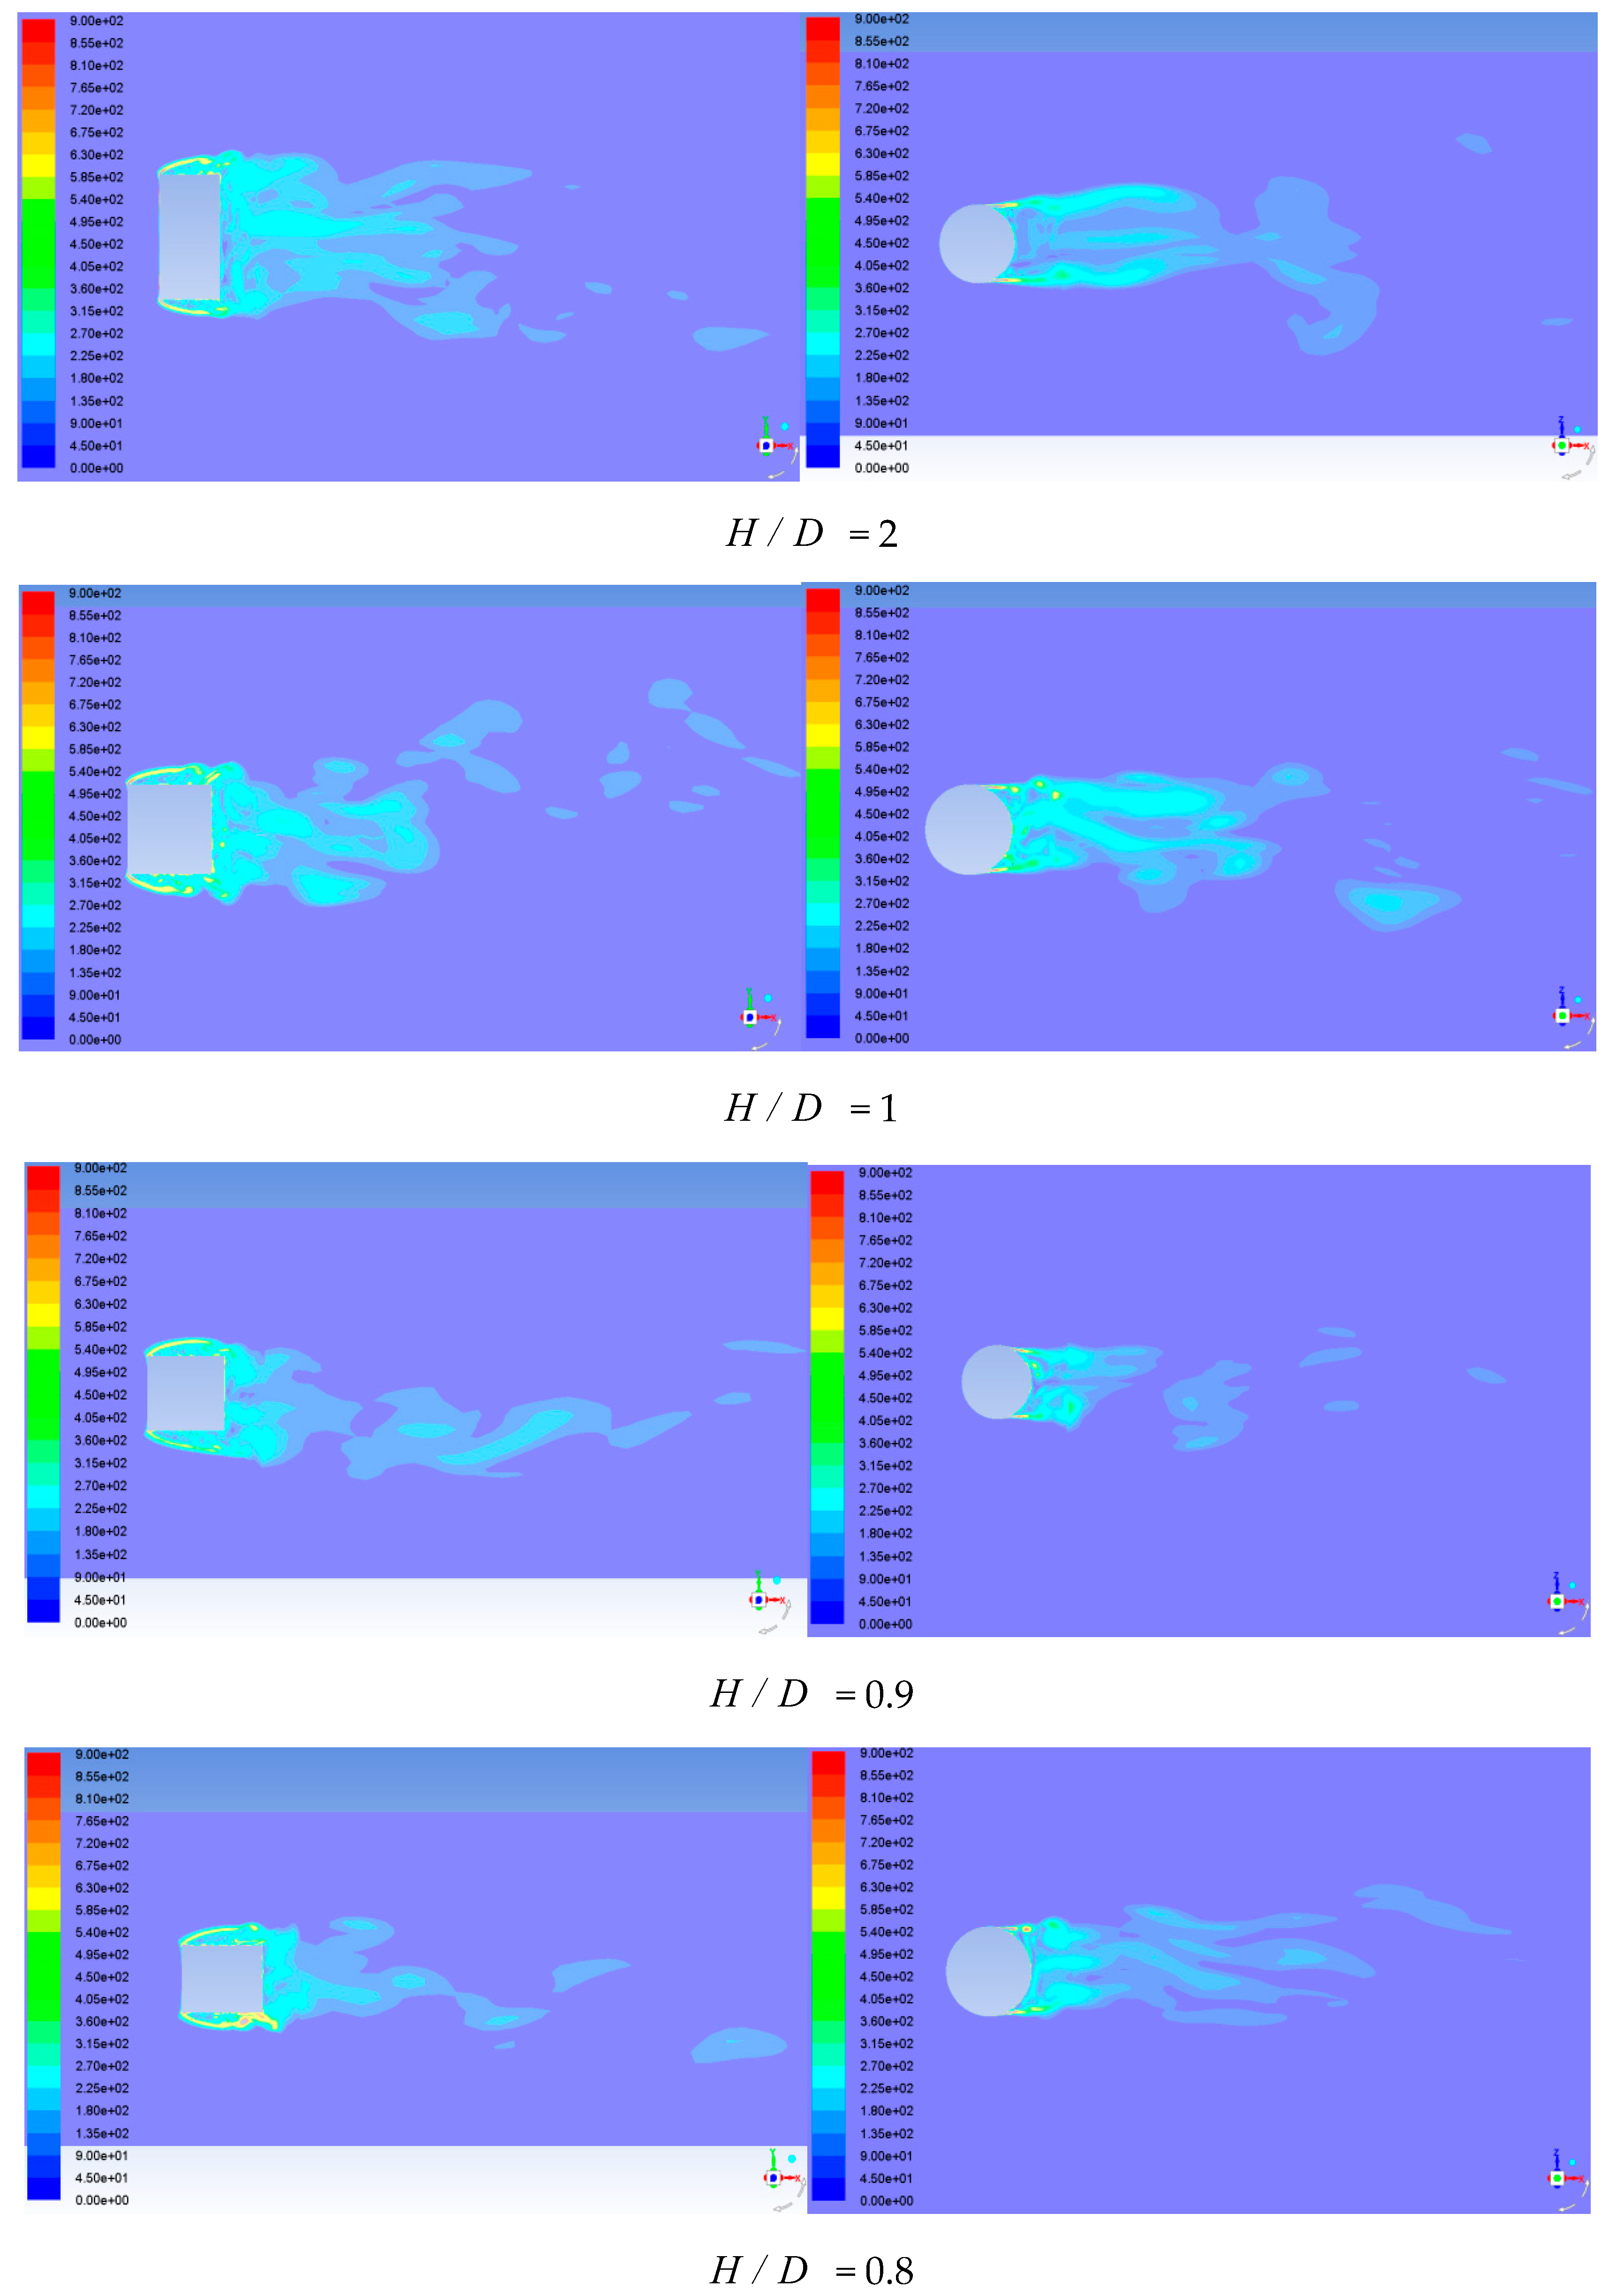
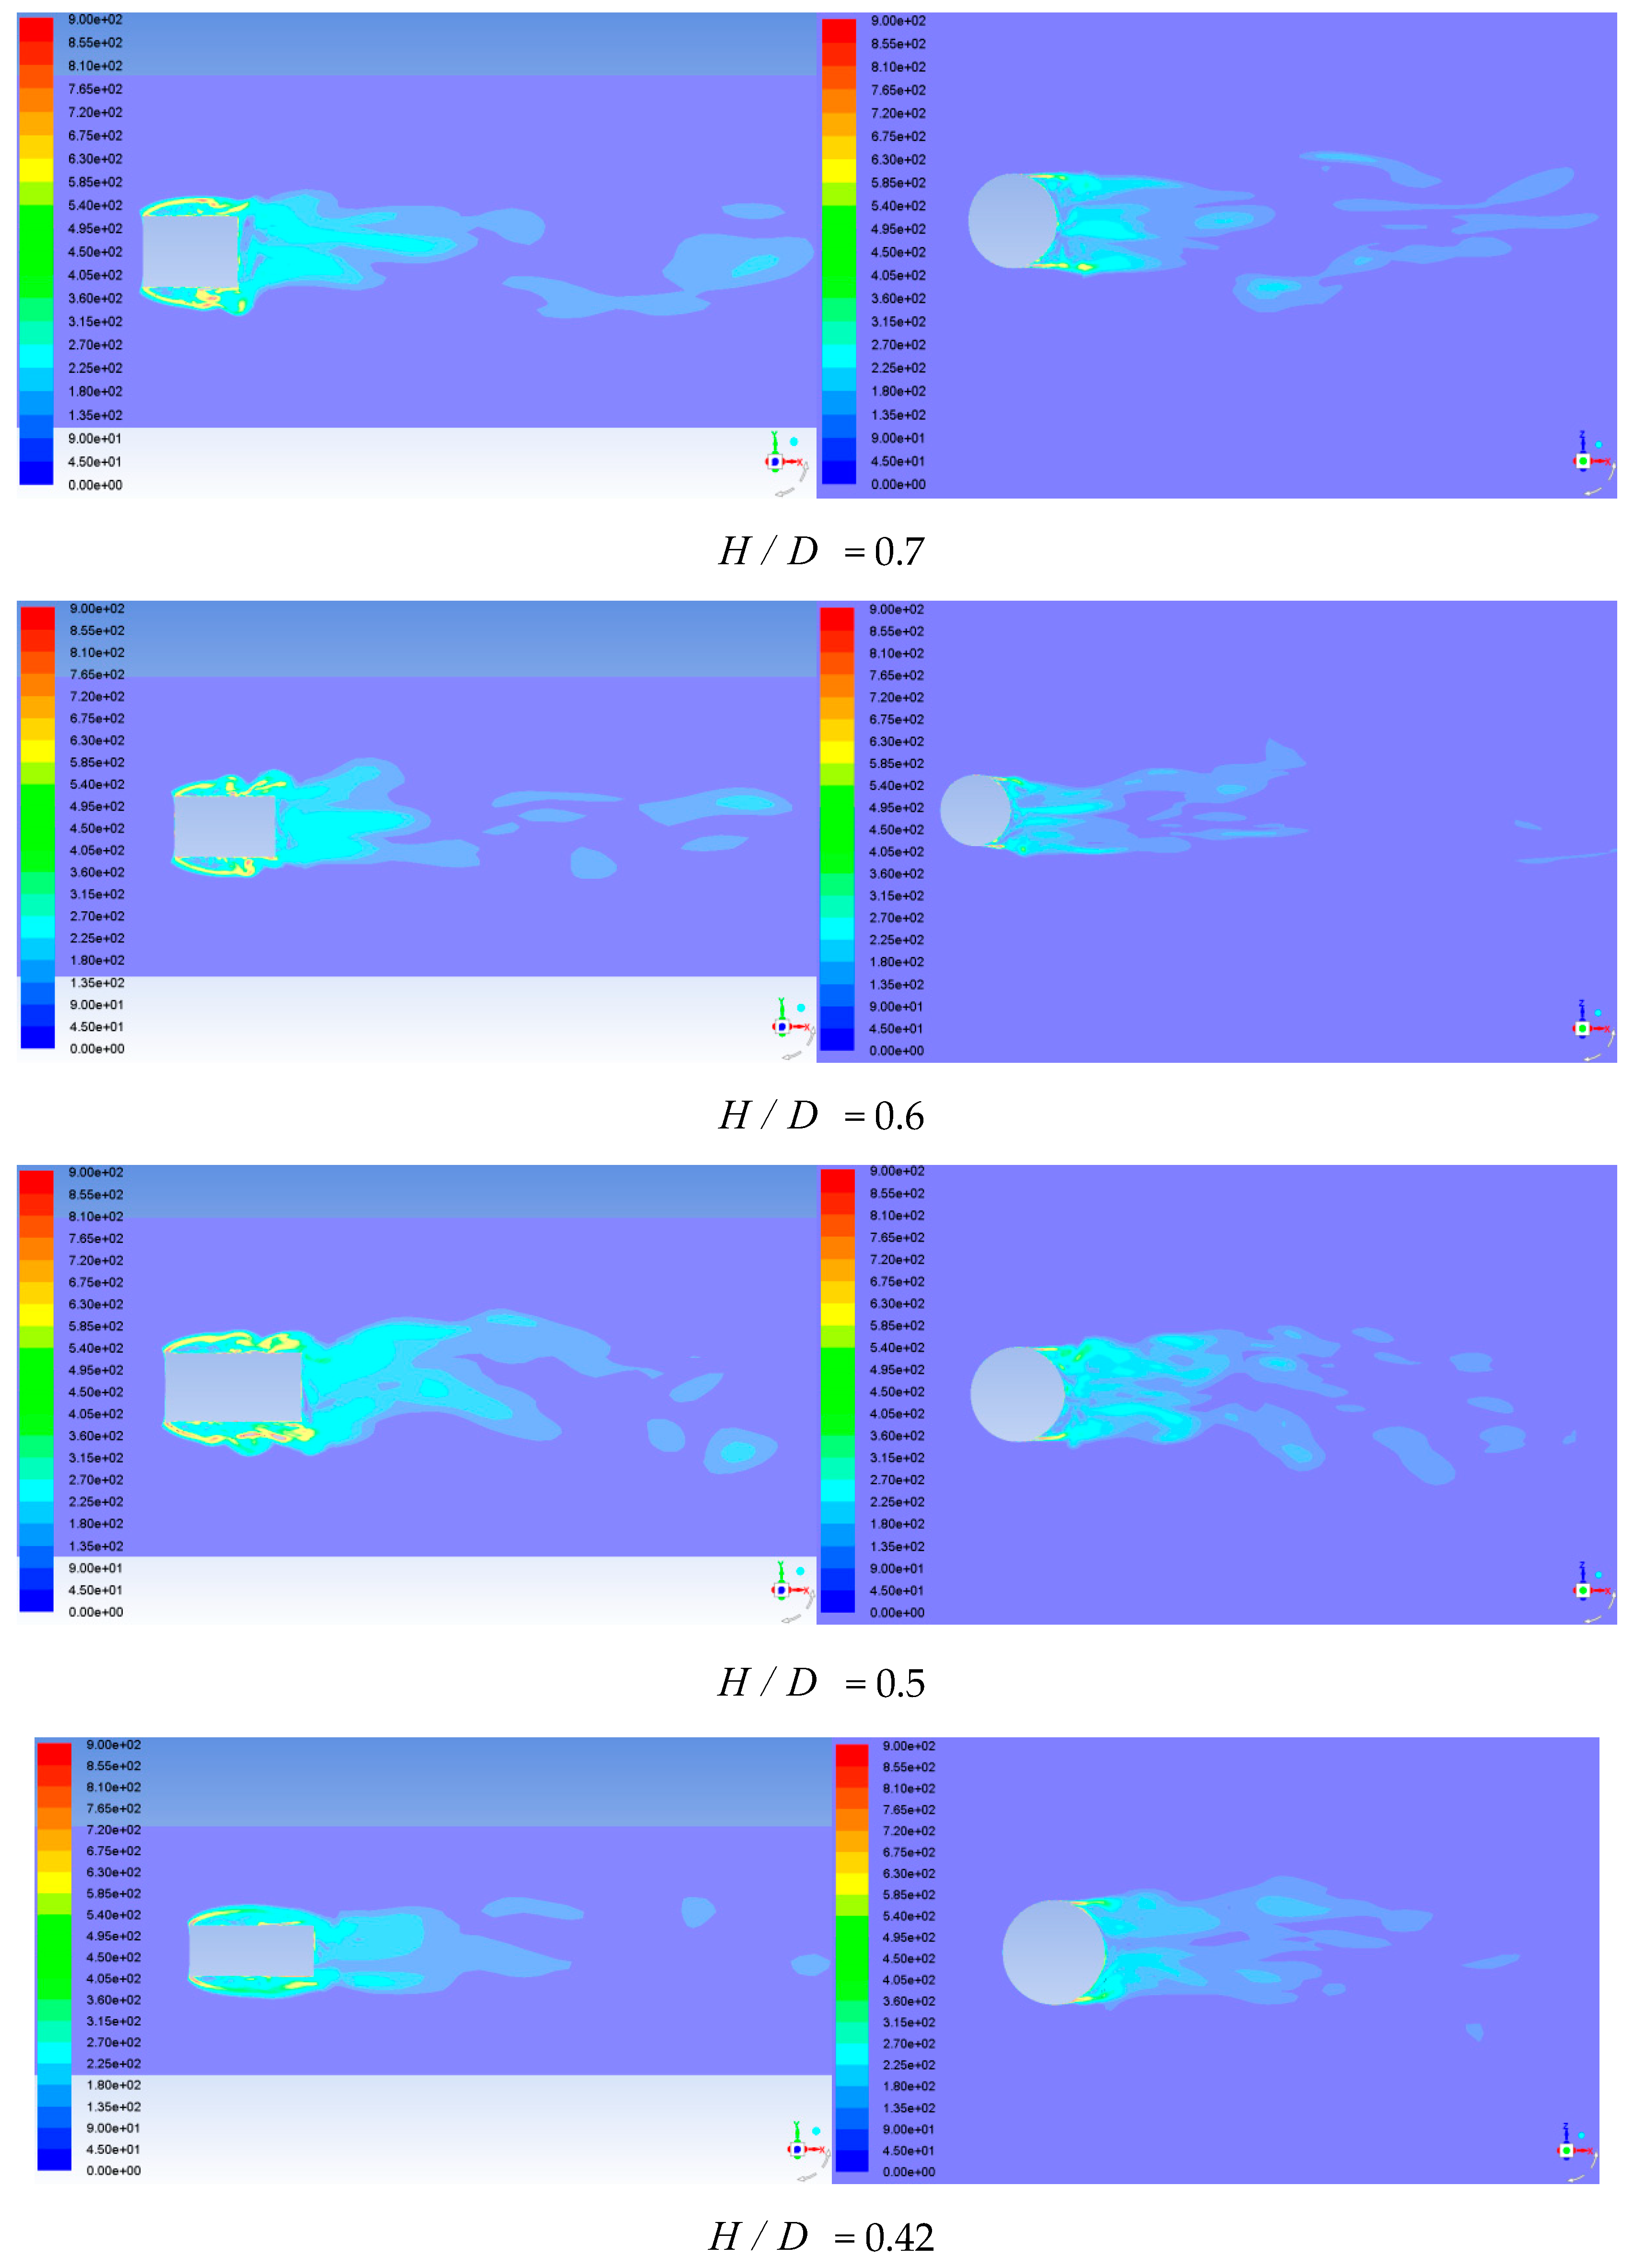
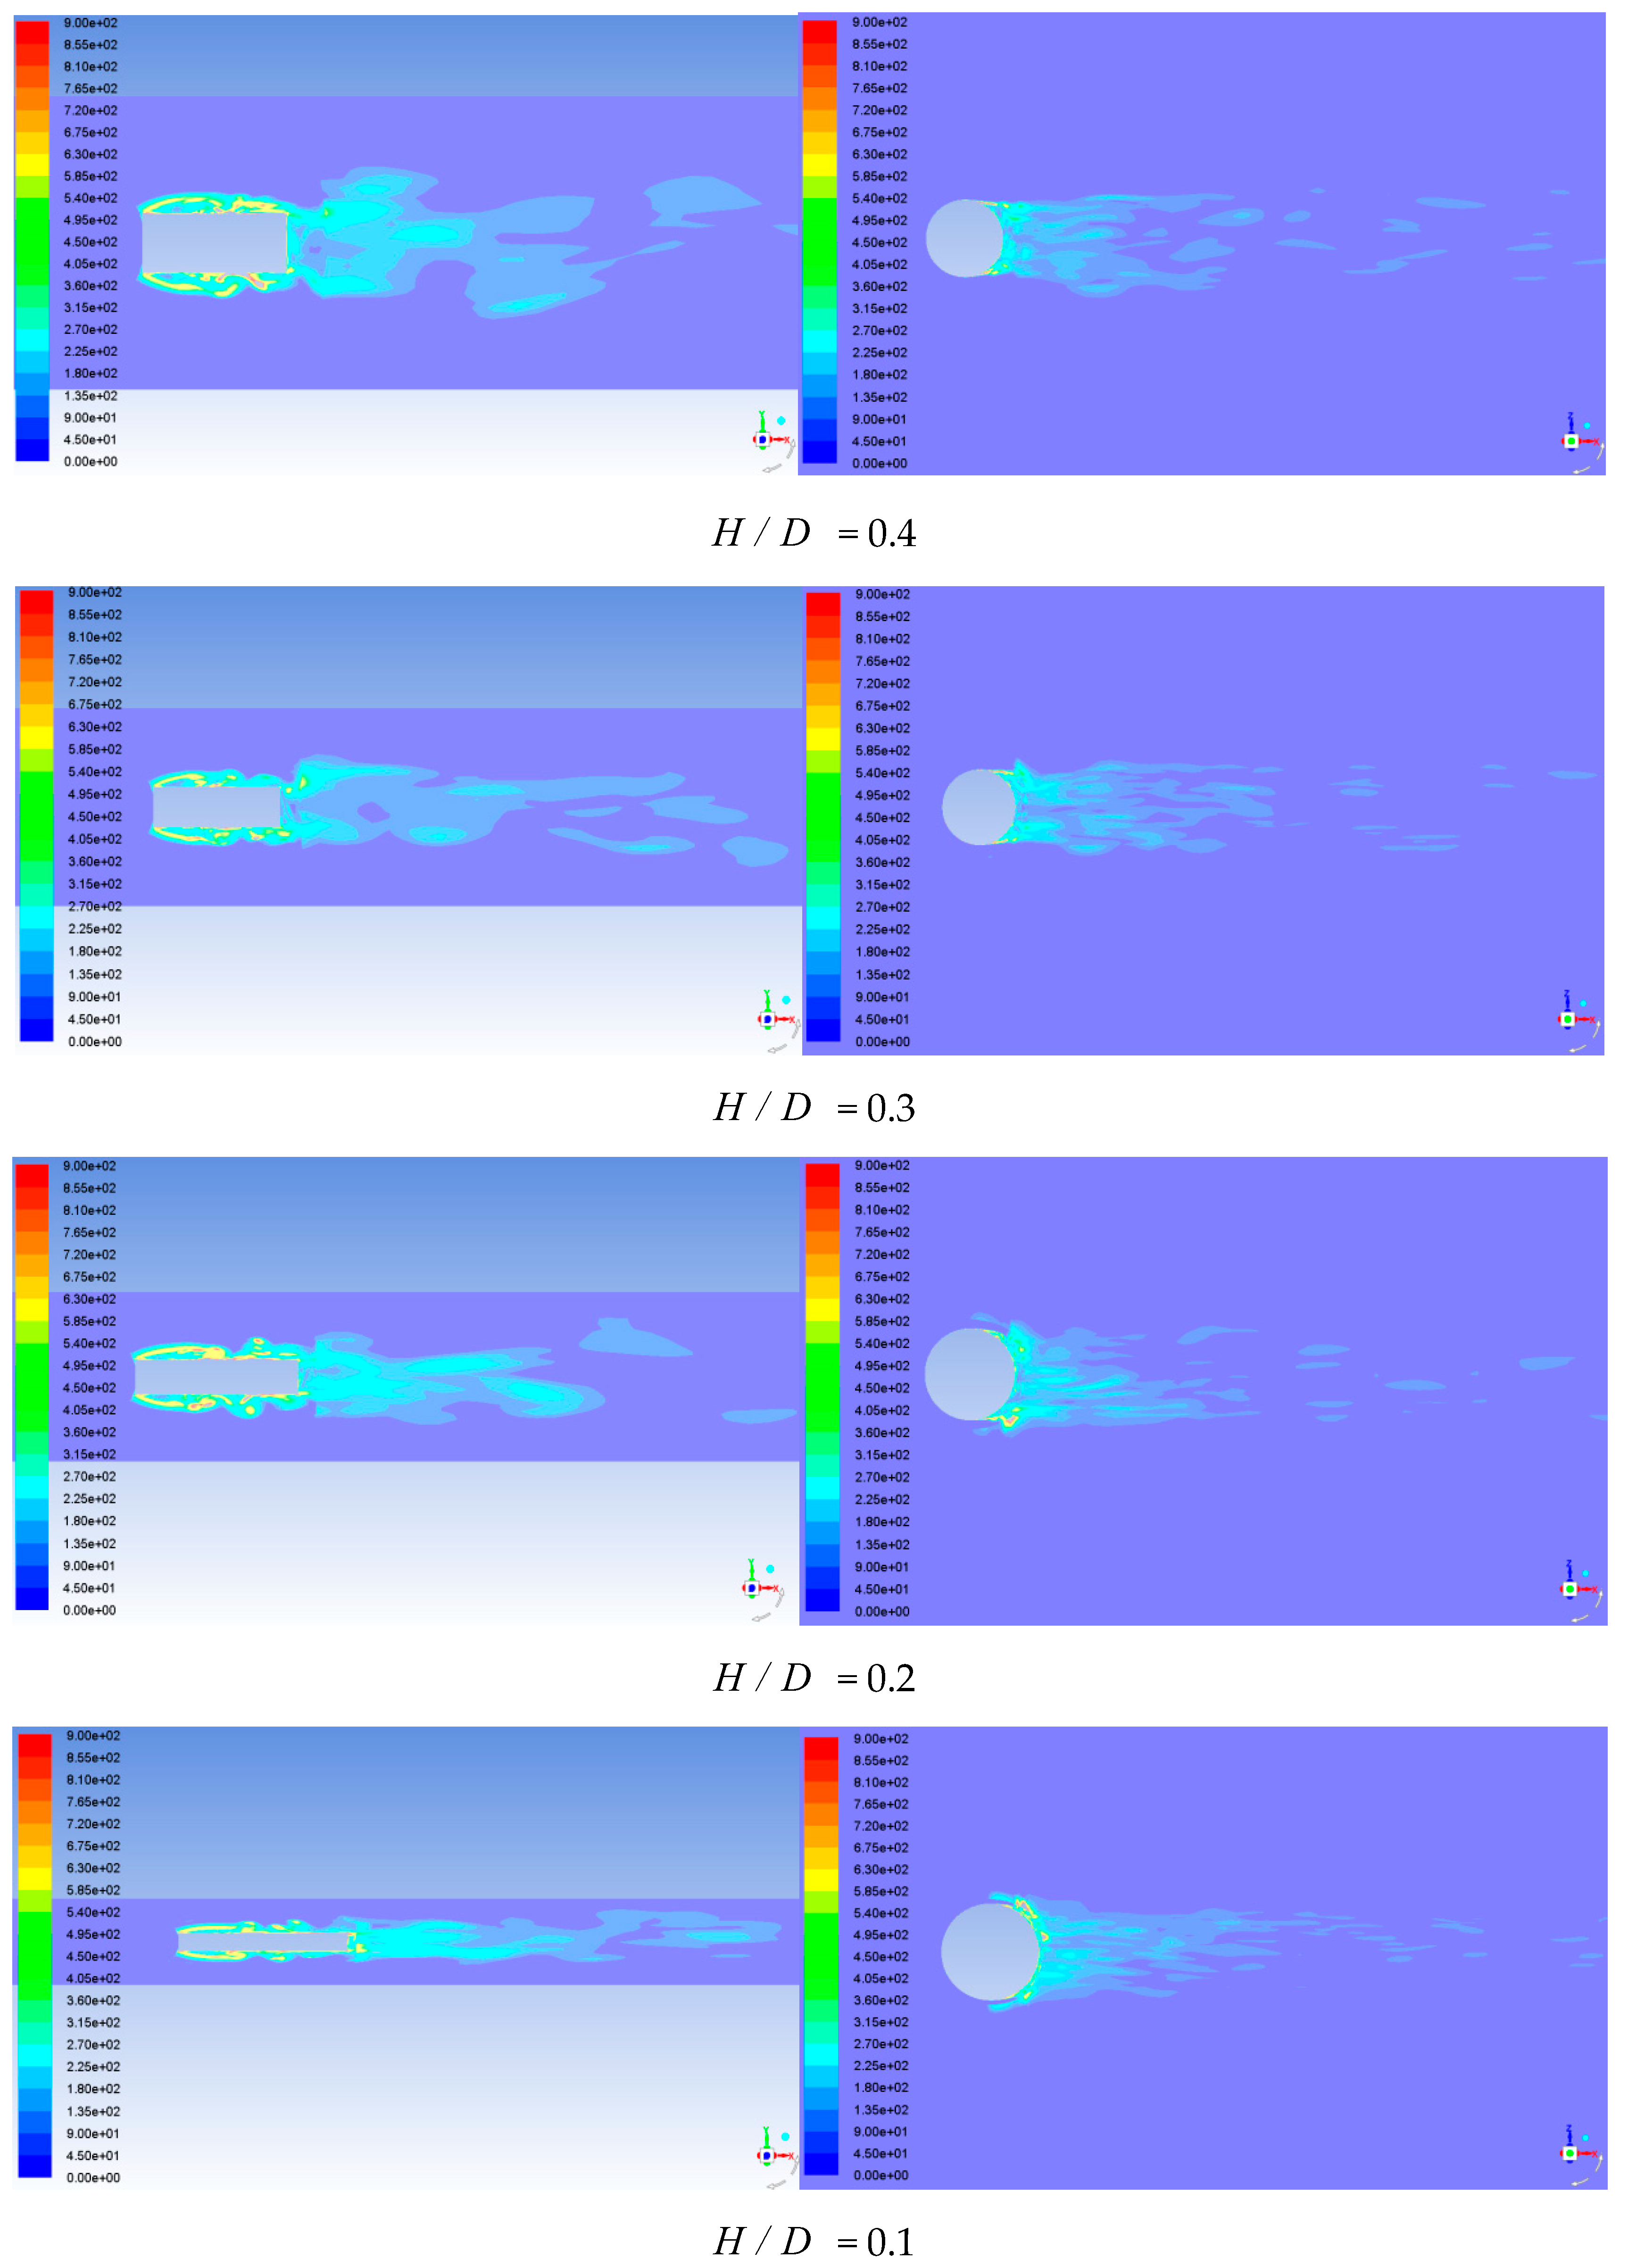
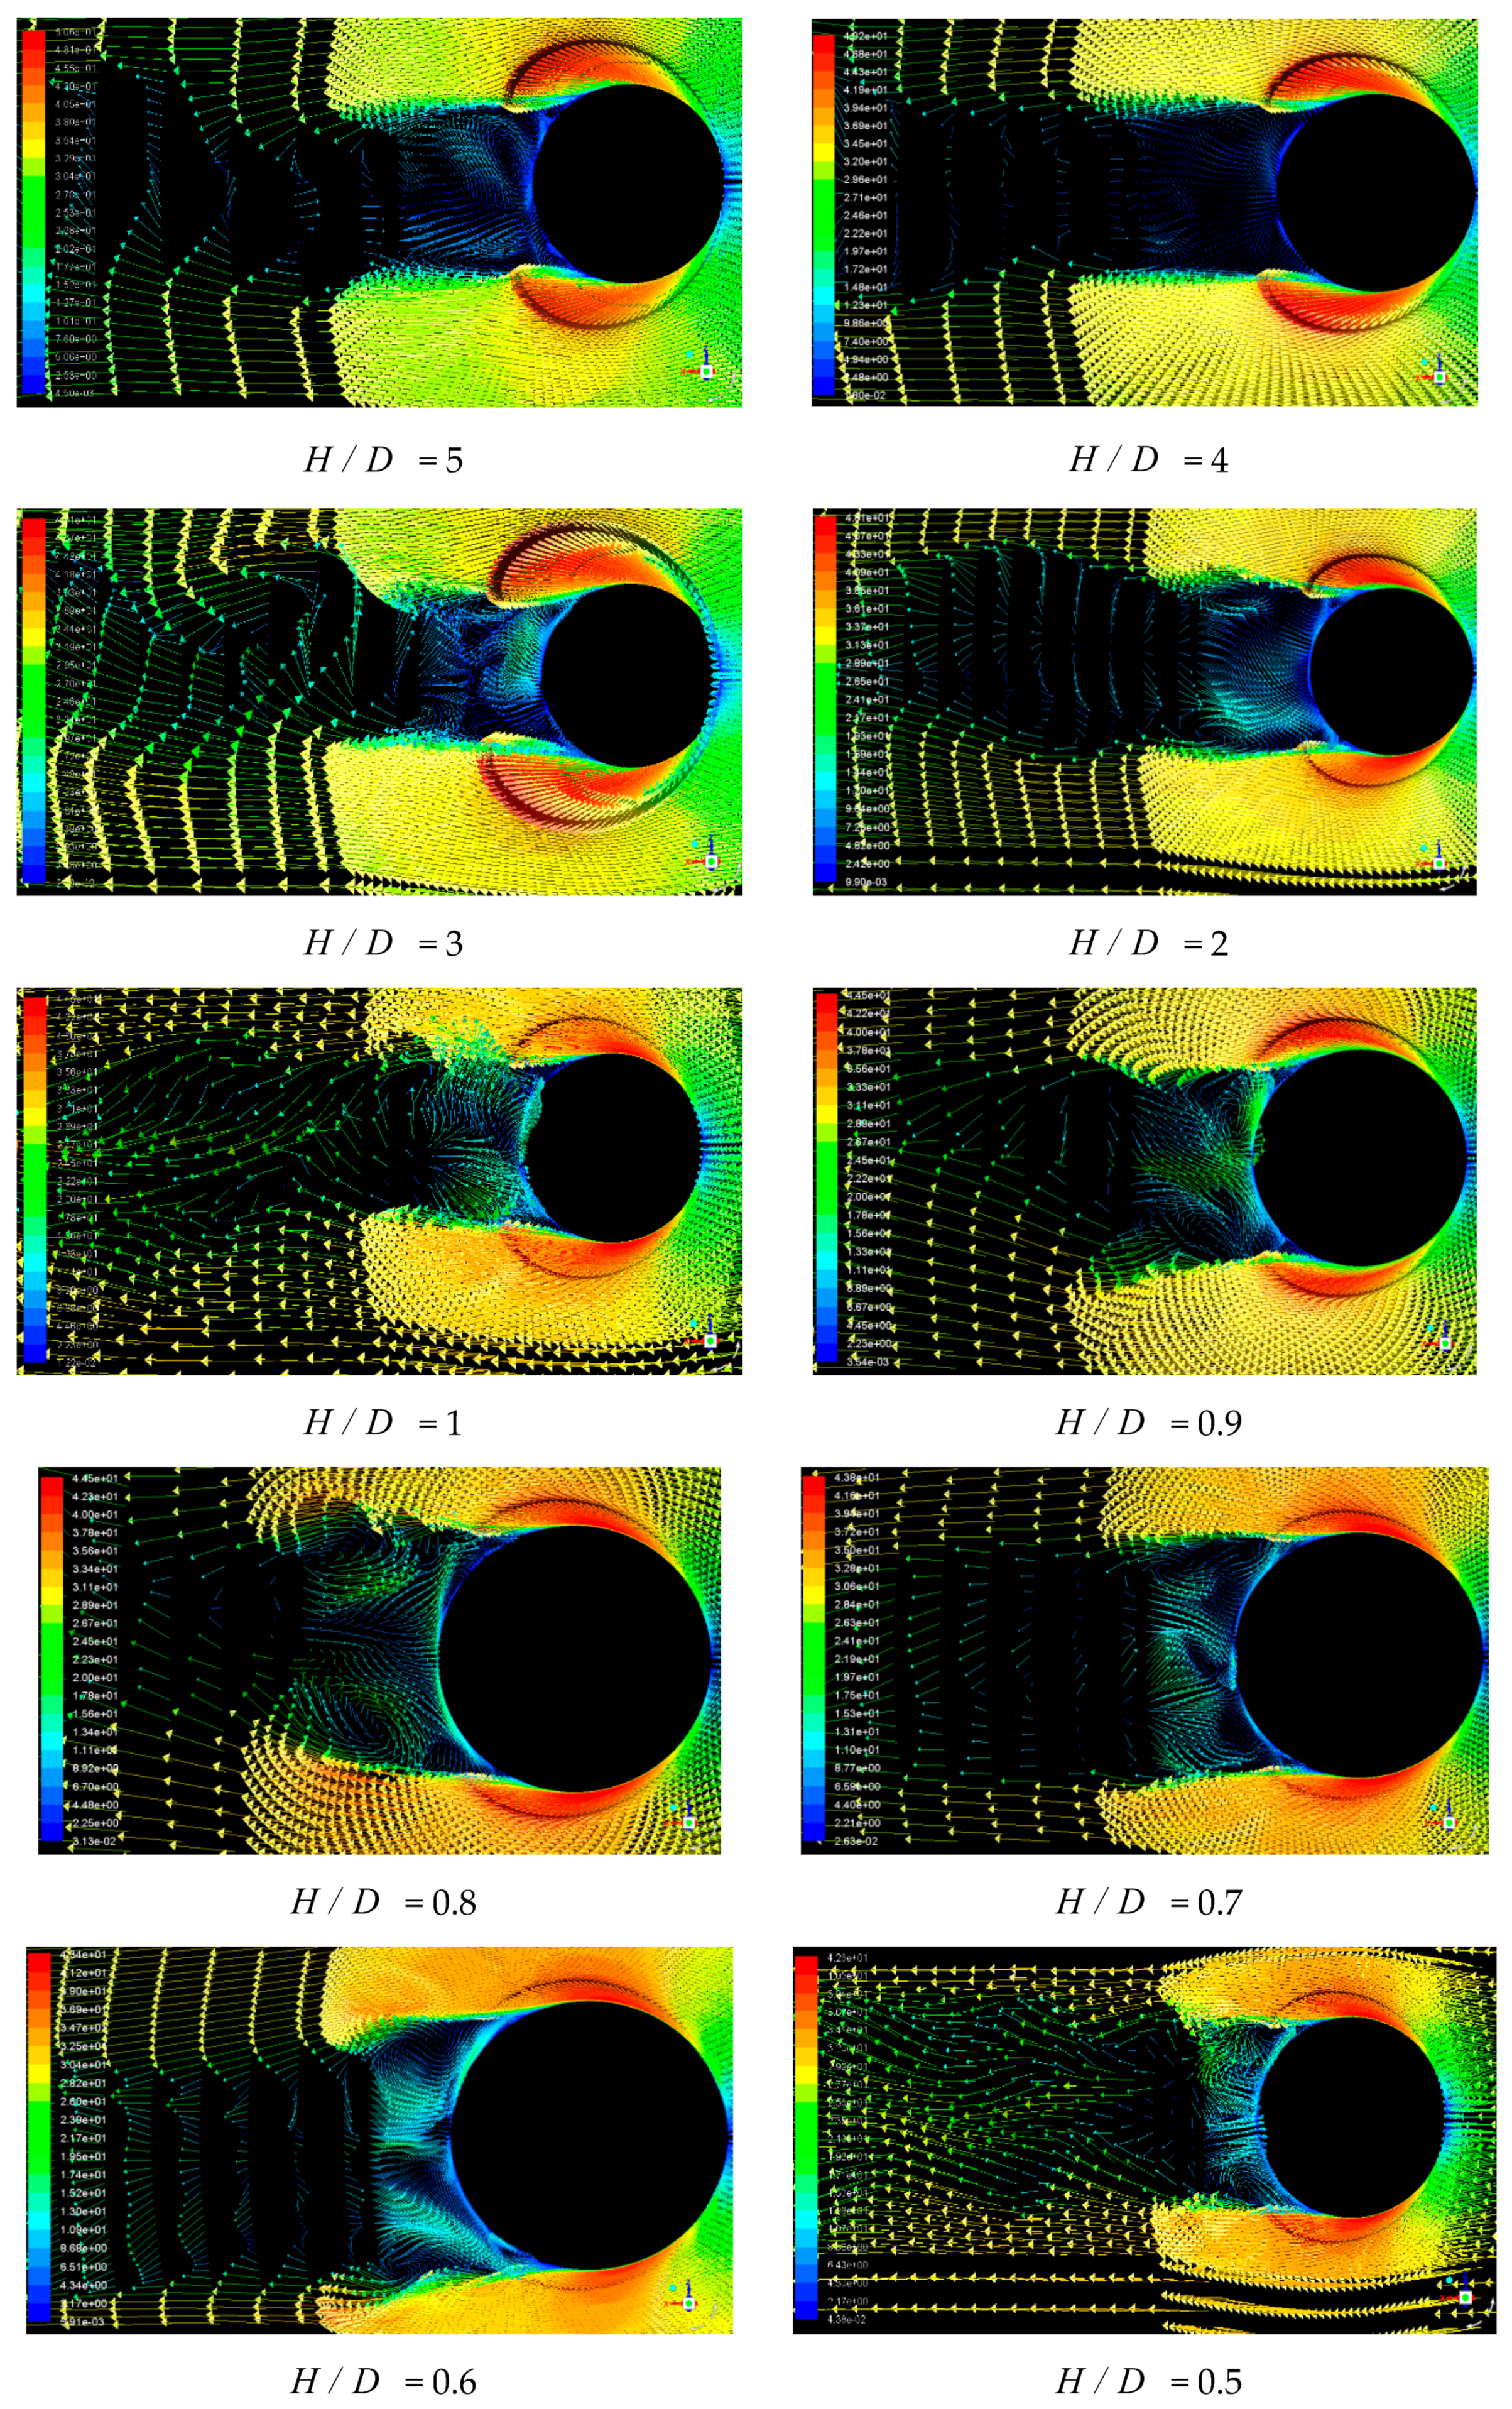
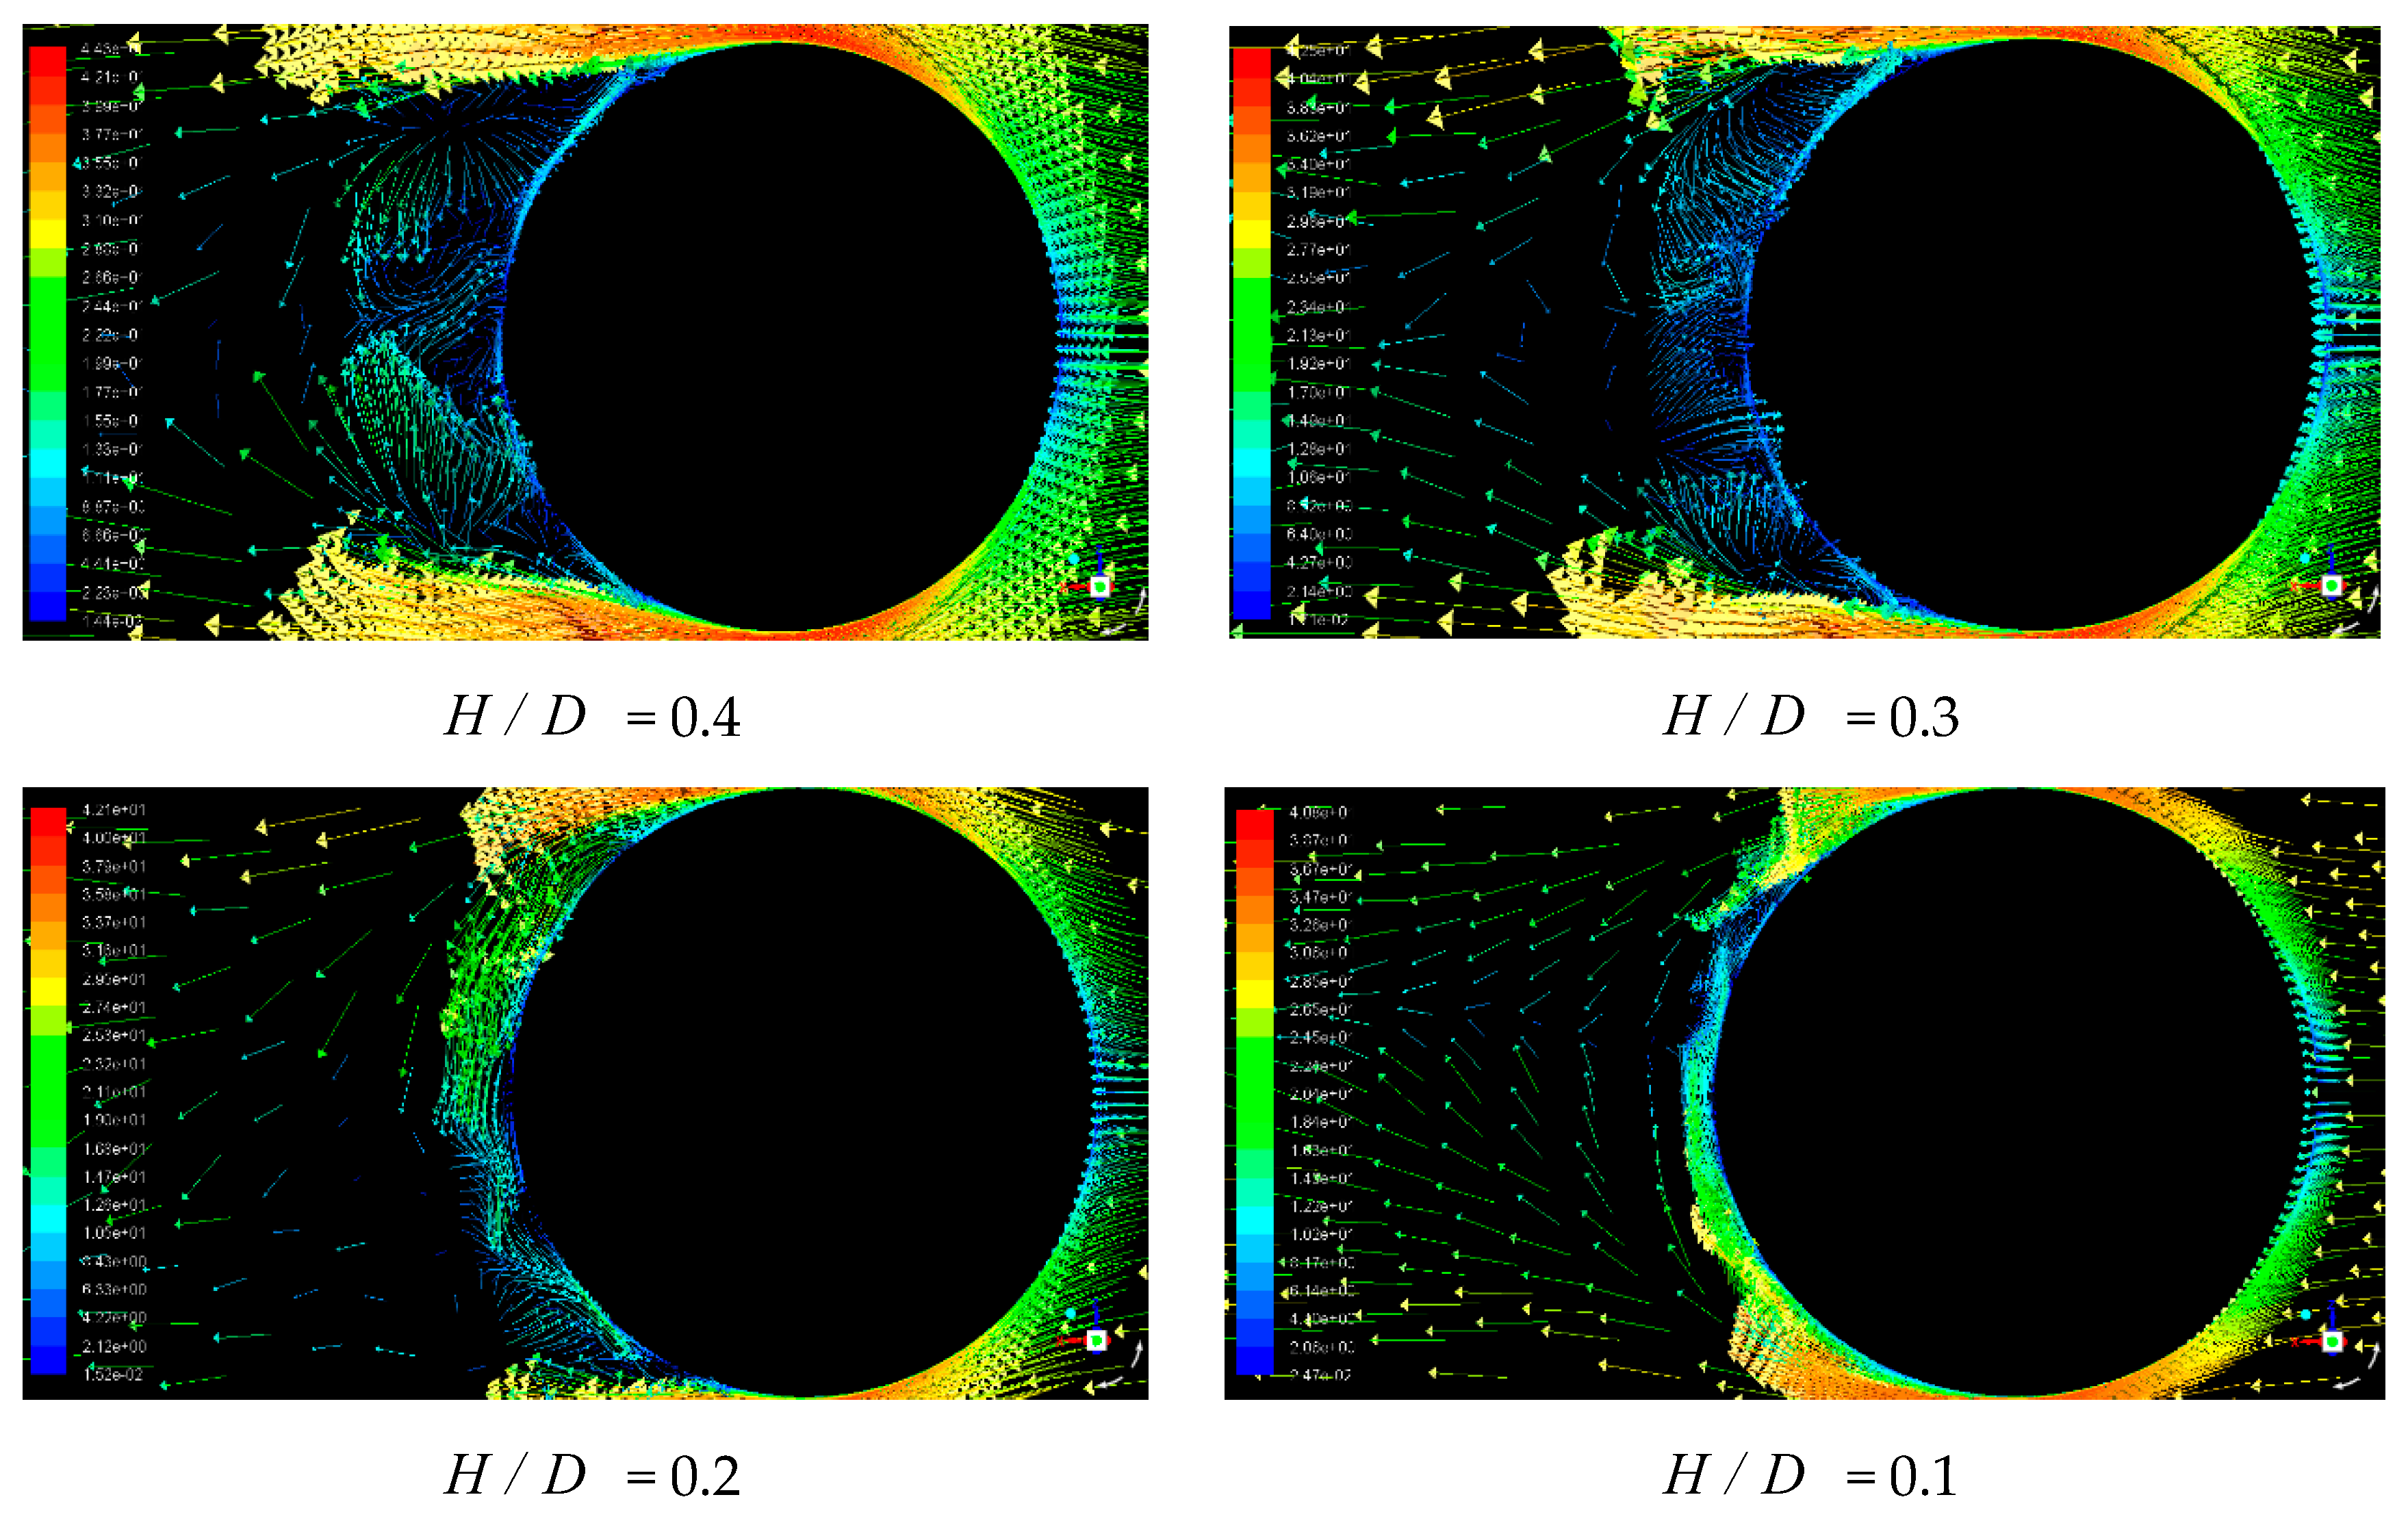
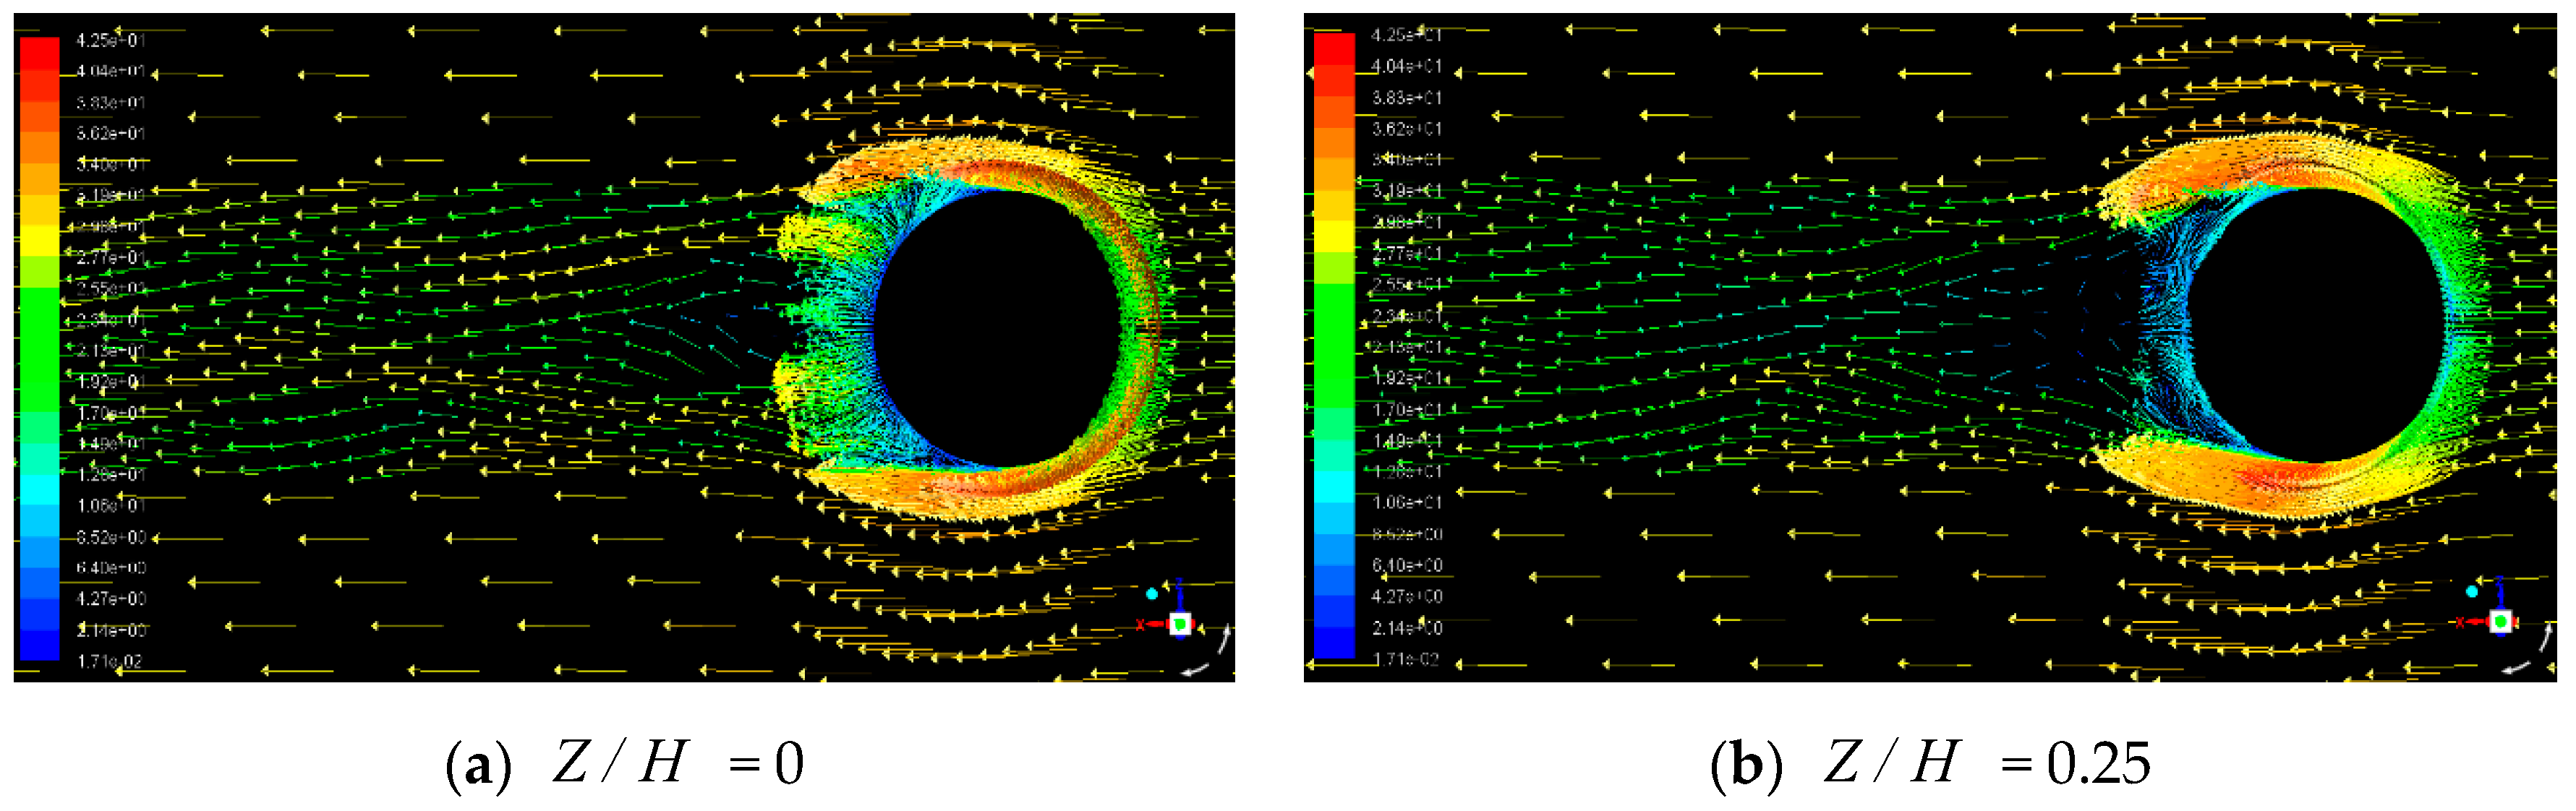
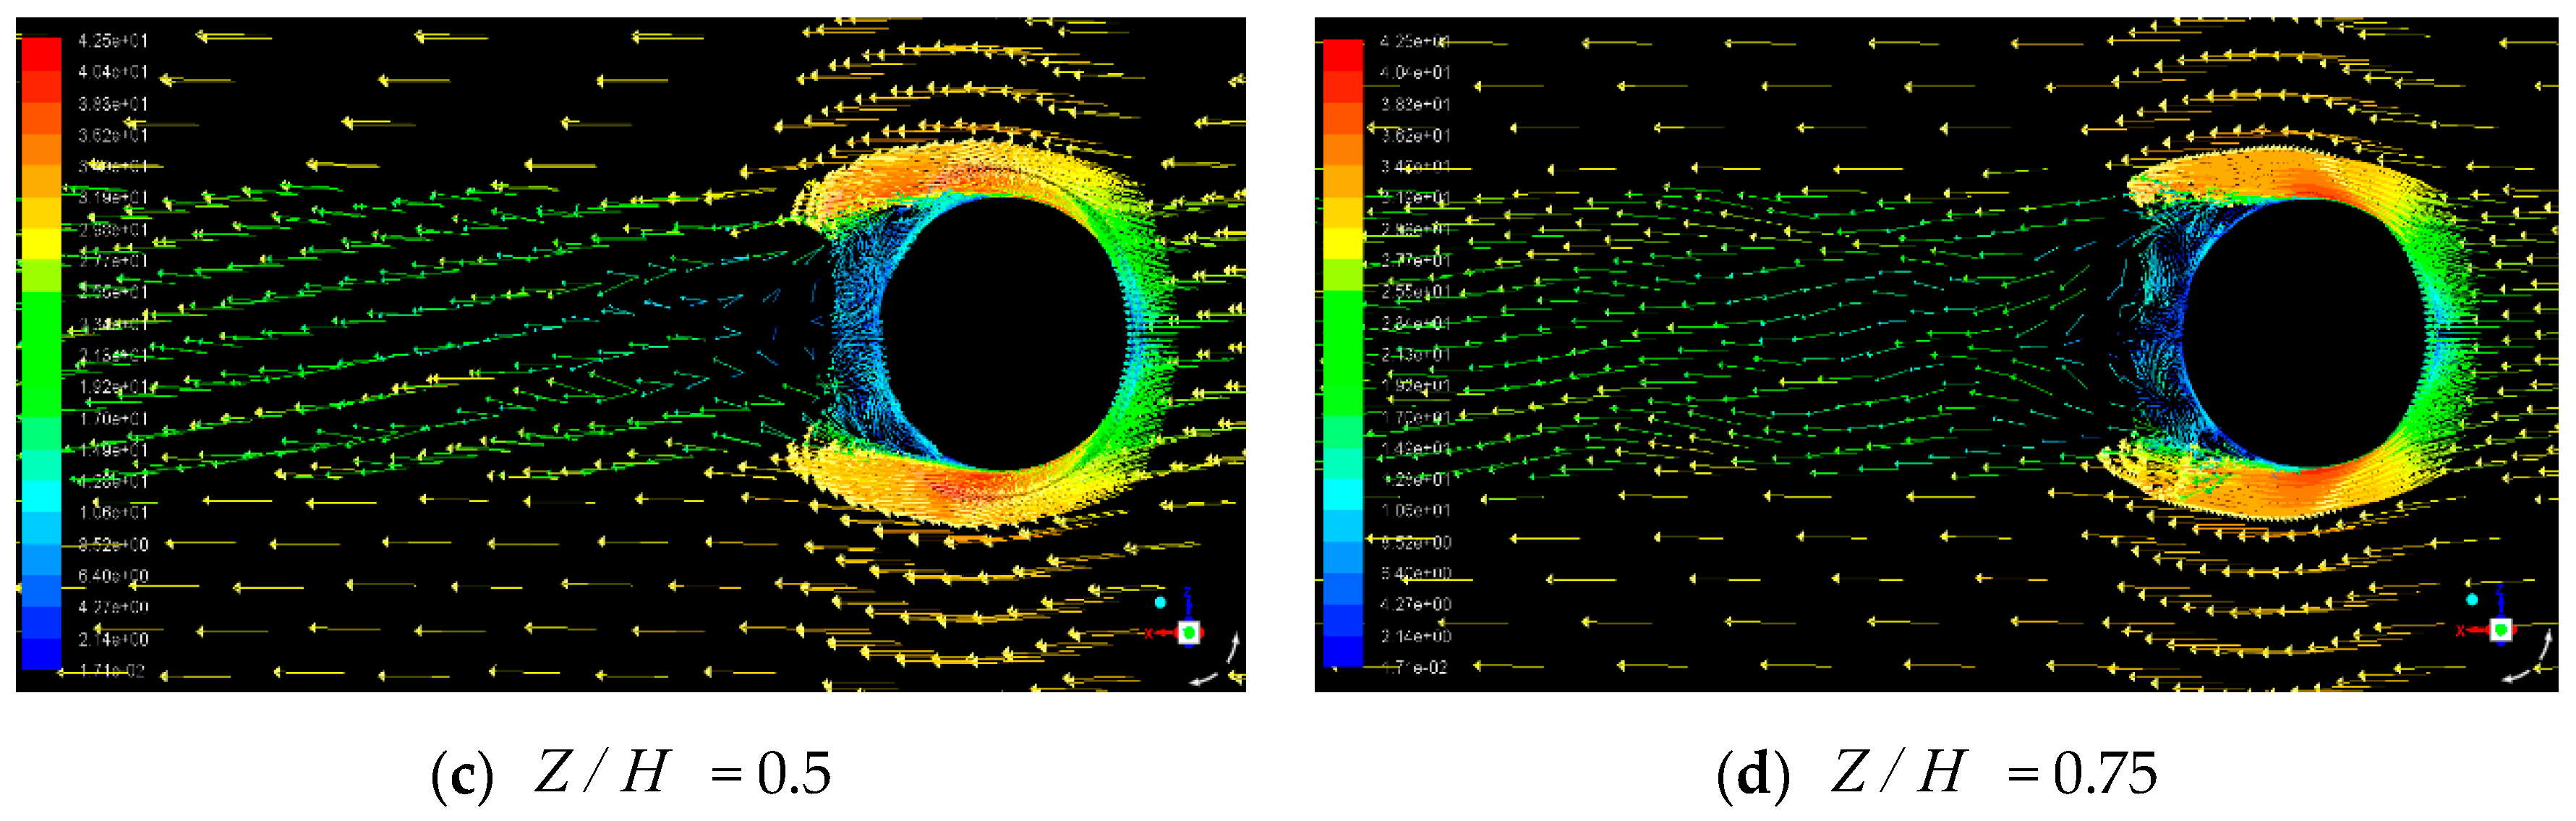
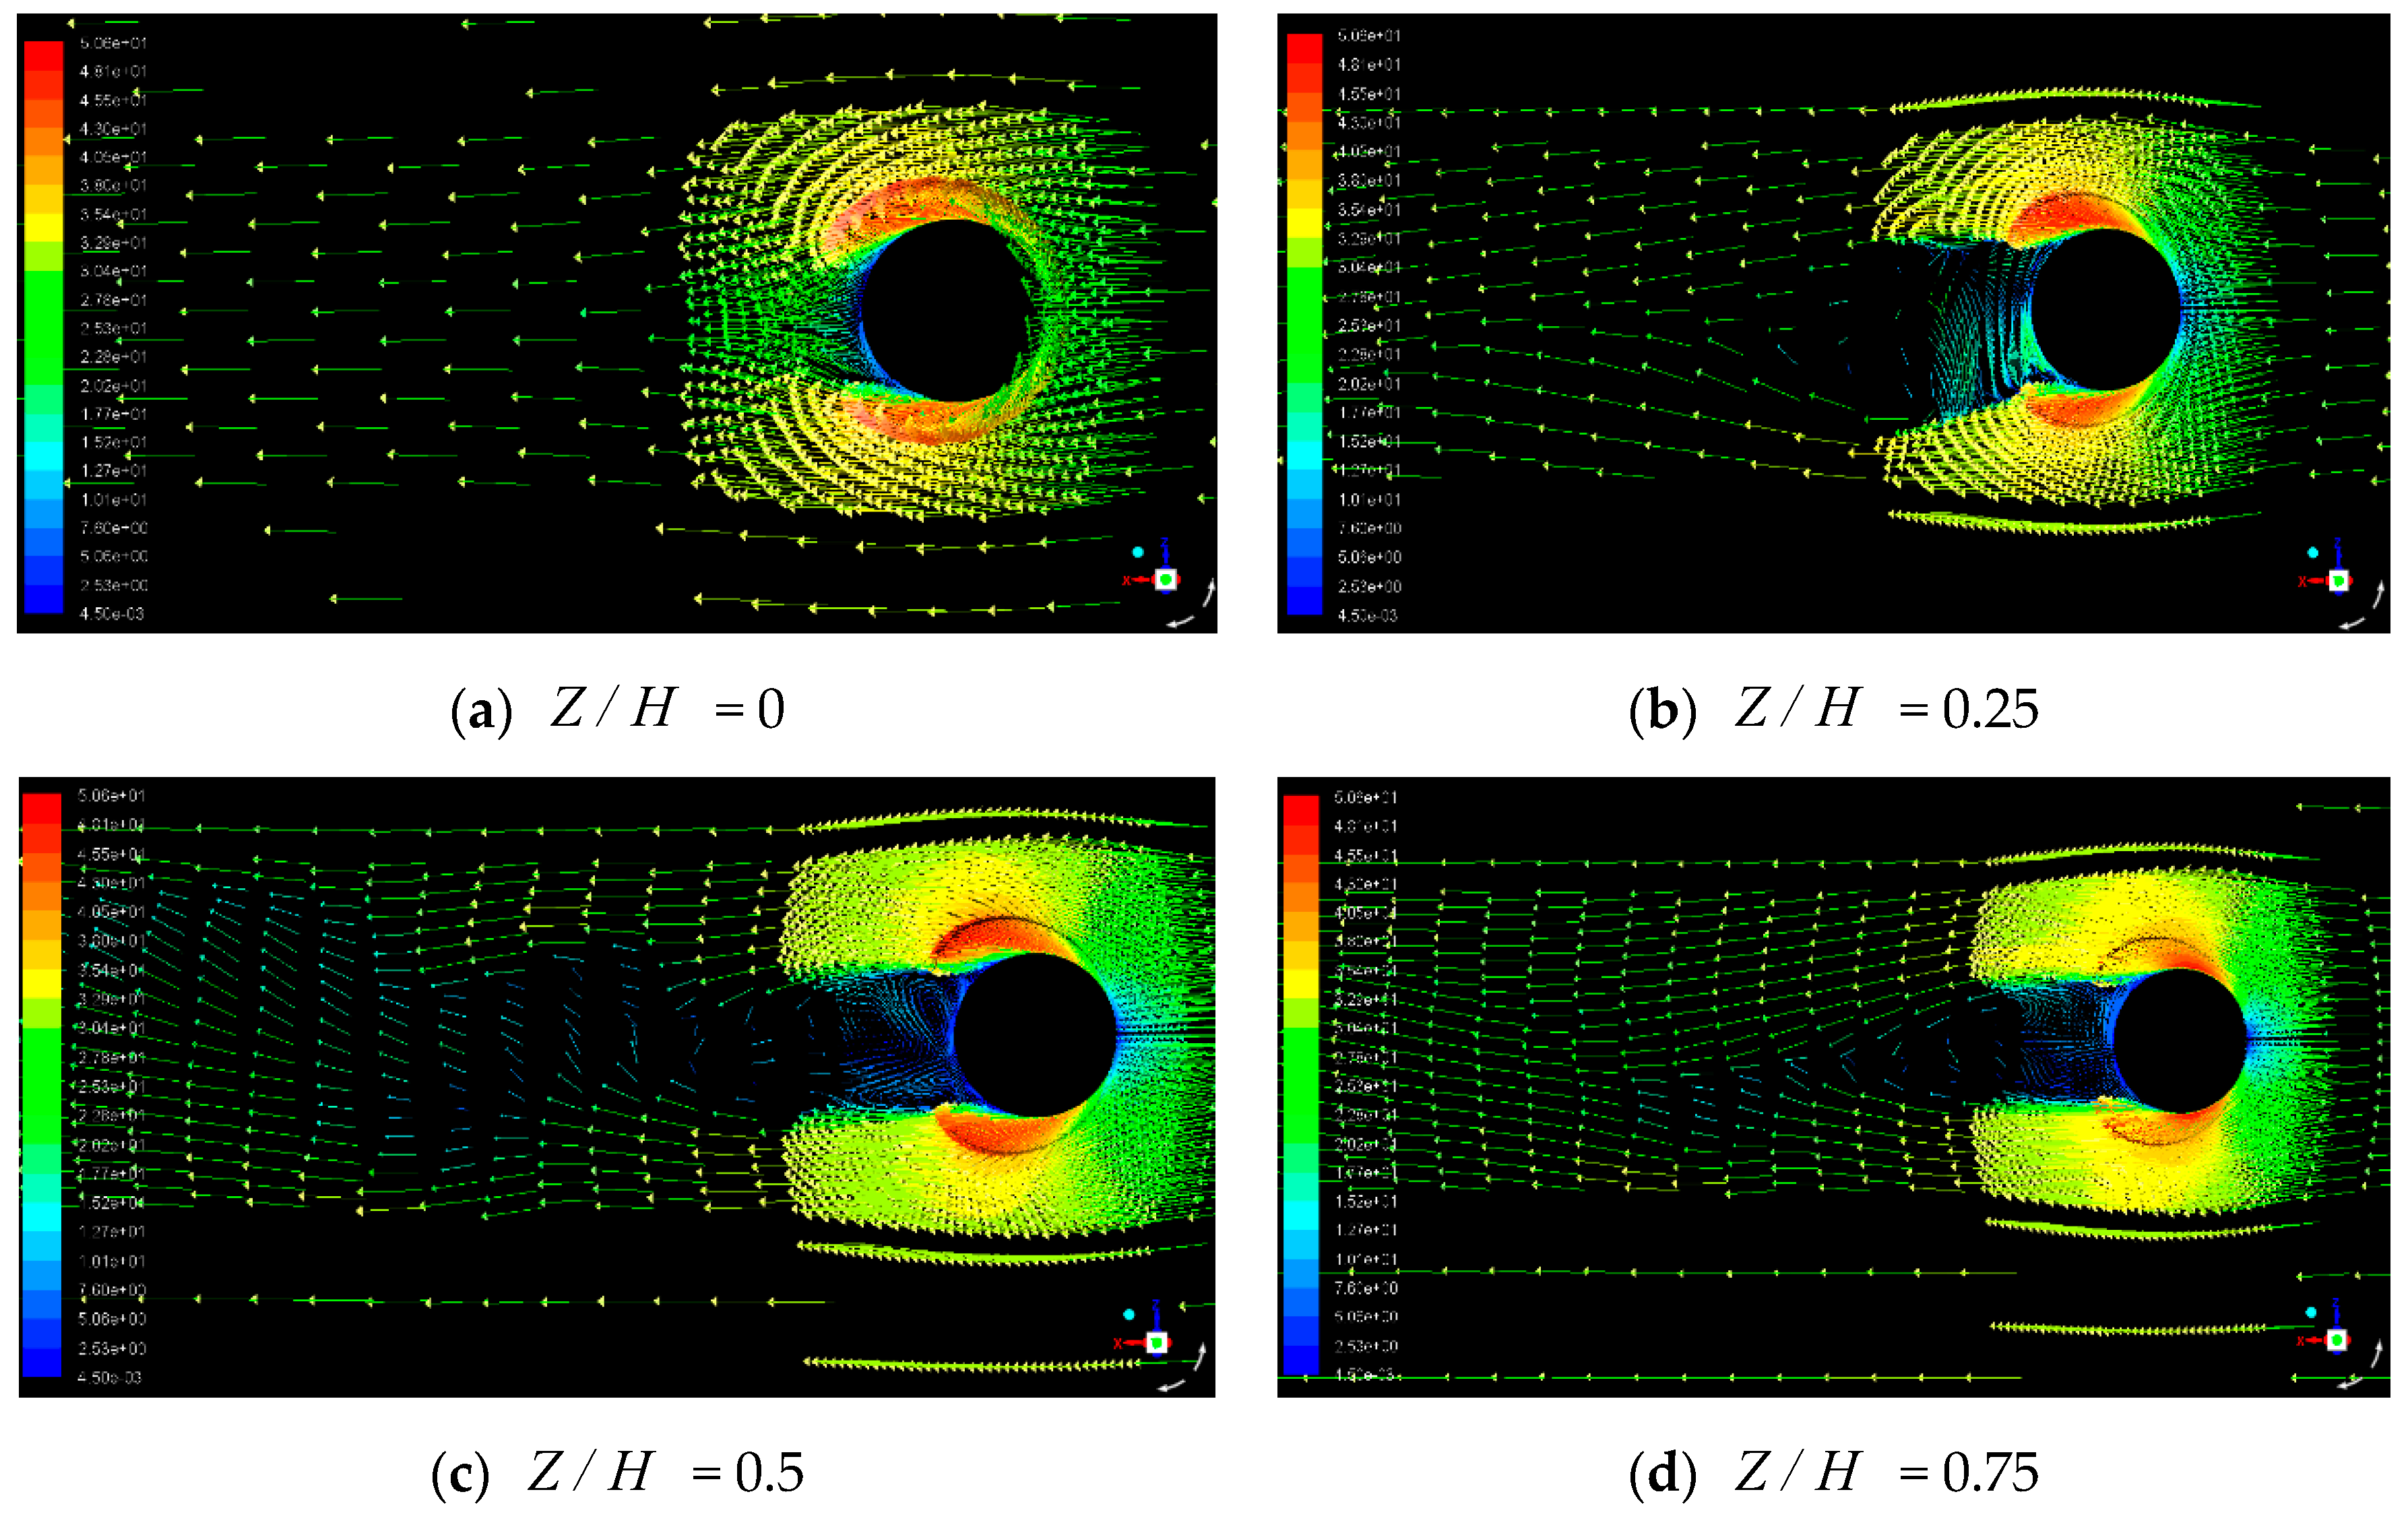
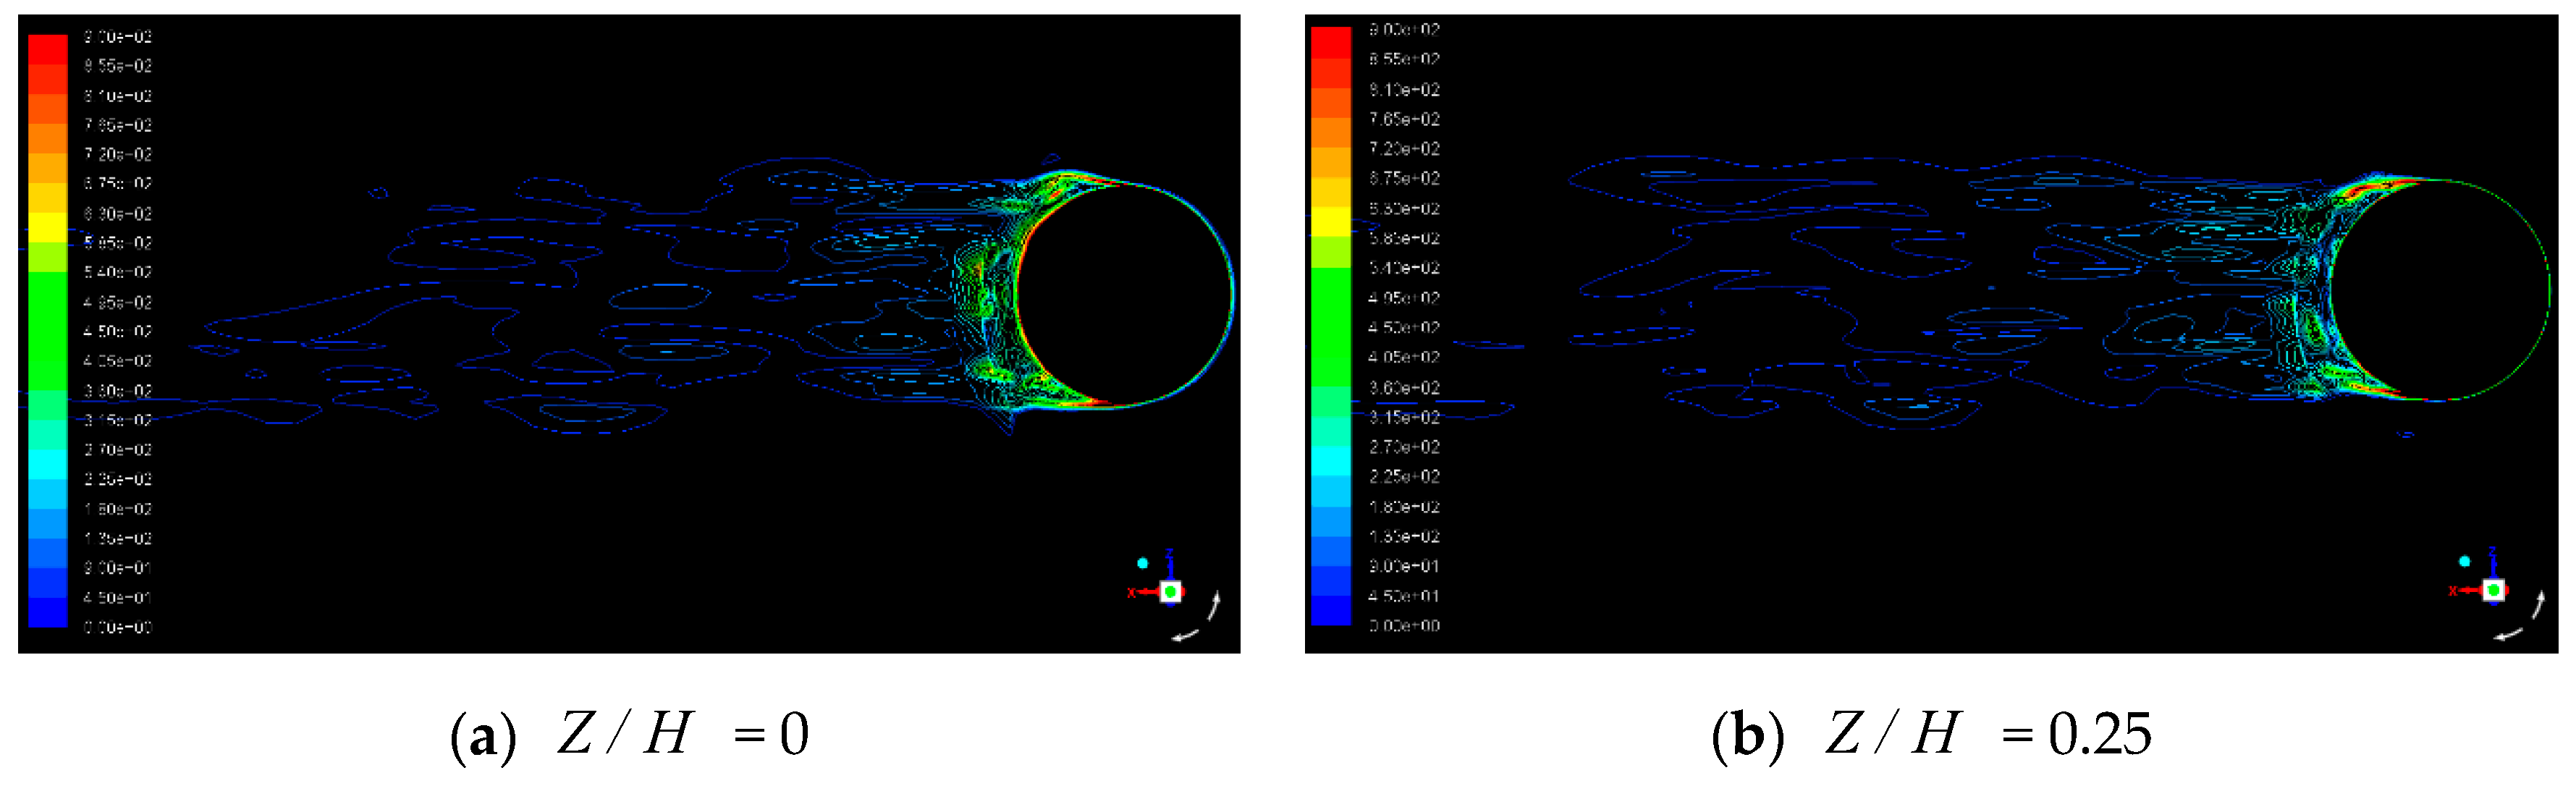
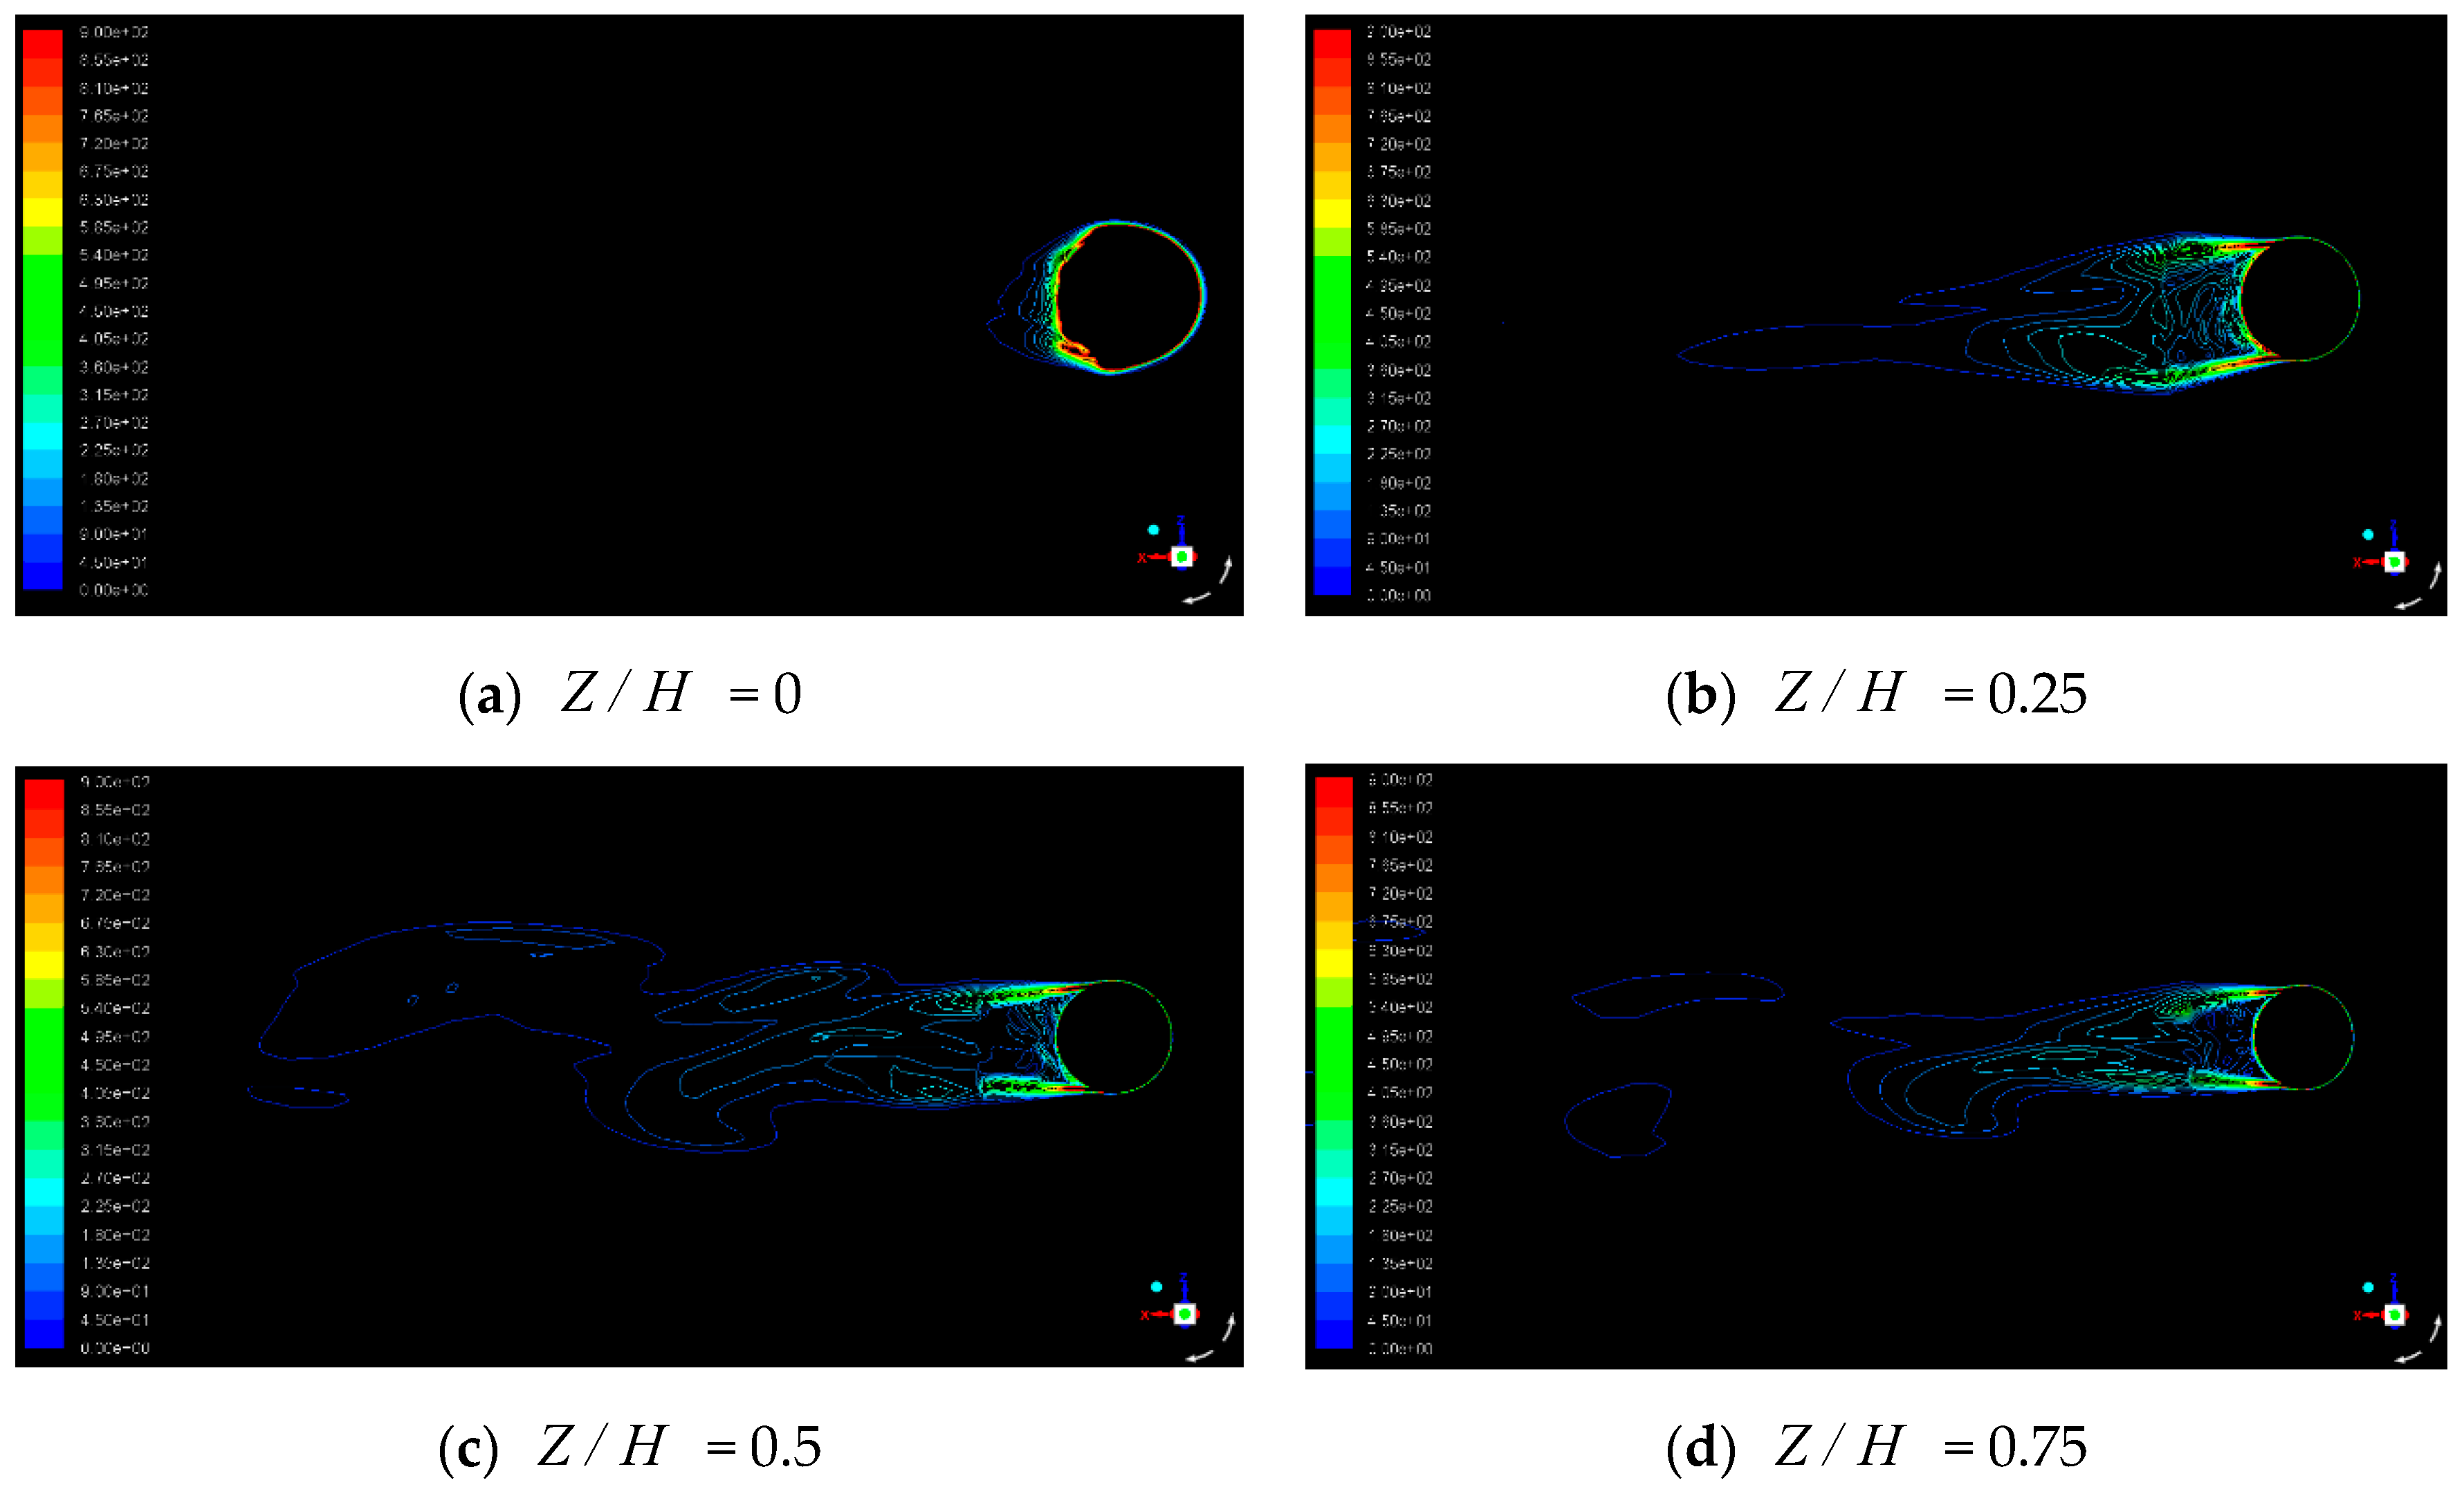
4.3. Flow Visualization
5. Conclusions
Author Contributions
Funding
Conflicts of Interest
References
- Huang, Y.; Zhen, X.; Zhang, Q.; Wang, W.-H. Optimum design and global analysis of flexible jumper for an innovative subsurface production system in ultra-deep water. China Ocean Eng. 2014, 28, 239–247. [Google Scholar] [CrossRef]
- Zhen, X.W.; Huang, Y.; Wang, W.H.; Zhang, Q. Investigation of hydrodynamic coefficients for artificial buoyancy seabed unit. J. Ship. Mech. 2013, 17, 1381–1391. [Google Scholar]
- Wu, J.-H.; Zhen, X.-W.; Liu, G.; Huang, Y. Optimization design on the riser system of next generation subsea production system with the assistance of DOE and surrogate model techniques. Appl. Ocean Res. 2019, 85, 34–44. [Google Scholar] [CrossRef]
- Zhen, X.; Vinnem, J.E.; Han, Y.; Peng, C.; Yang, X.; Huang, Y. New risk control mechanism for innovative deepwater artificial seabed system through online risk monitoring system. Appl. Ocean Res. 2020, 95, 102054. [Google Scholar] [CrossRef]
- Zhen, X.; Wu, J.-H.; Huang, Y.; Han, Y.; Yao, J.-J. Parametric Dimensional Analysis on the Structural Response of An Innovative Subsurface Tension Leg Platform in Ultra-Deep Water. China Ocean Eng. 2018, 32, 482–489. [Google Scholar] [CrossRef]
- Naudascher, E.; Wang, Y. Flow-Induced Vibrations of Prismatic Bodies and Grids of Prisms. J. Fluids Struct. 1993, 7, 341–373. [Google Scholar] [CrossRef]
- Adaramola, M.; Akinlade, O.; Sumner, D.; Bergstrom, D.; Schenstead, A. Turbulent wake of a finite circular cylinder of small aspect ratio. J. Fluids Struct. 2006, 22, 919–928. [Google Scholar] [CrossRef]
- Krajnović, S. Flow around a tall finite cylinder explored by large eddy simulation. J. Fluid. Mech. 2011, 676, 294–317. [Google Scholar] [CrossRef]
- Okamoto, T.; Yagita, M. The Experimental Investigation on the Flow past a Circular Cylinder of Finite Length Placed Normal to the Plane Surface in a Uniform Stream. Bull. JSME 1973, 16, 805–814. [Google Scholar] [CrossRef]
- Sakamoto, H.; Arie, M. Vortex shedding from a rectangular prism and a circular cylinder placed vertically in a turbulent boundary layer. J. Fluid Mech. 1983, 126, 147–165. [Google Scholar] [CrossRef]
- Okamoto, S.; Sunabashiri, Y. Vortex Shedding From a Circular Cylinder of Finite Length Placed on a Ground Plane. J. Fluids Eng. 1992, 114, 512–521. [Google Scholar] [CrossRef]
- Wang, H.F.; Zhou, Y. The finite-length square cylinder near wake. J. Fluid Mech. 2009, 638, 453–490. [Google Scholar] [CrossRef]
- Wang, H.F.; Zhou, Y.; Mi, J. Effects of aspect ratio on the drag of a wall-mounted finite-length cylinder in subcritical and critical regimes. Exp. Fluids 2012, 53, 423–436. [Google Scholar] [CrossRef]
- Tsutsui, T. Flow around a cylindrical structure mounted in a plane turbulent boundary layer. J. Wind. Eng. Ind. Aerodyn. 2012, 104, 239–247. [Google Scholar] [CrossRef]
- Afgan, I.; Moulinec, C.; Prosser, R.; Laurence, D. Large eddy simulation of turbulent flow for wall mounted cantilever cylinders of aspect ratio 6 and 10. Int. J. Heat Fluid Flow 2007, 28, 561–574. [Google Scholar] [CrossRef]
- Gonçalves, R.; Franzini, G.; Rosetti, G.; Meneghini, J.; Fujarra, A. Flow around circular cylinders with very low aspect ratio. J. Fluids Struct. 2015, 54, 122–141. [Google Scholar] [CrossRef]
- Gonçalves, R.T.; Rosetti, G.; Franzini, G.; Meneghini, J.; Fujarra, A. Two-degree-of-freedom vortex-induced vibration of circular cylinders with very low aspect ratio and small mass ratio. J. Fluids Struct. 2013, 39, 237–257. [Google Scholar] [CrossRef]
- Zhao, M.; Cheng, L. Vortex-induced vibration of a circular cylinder of finite length. Phys. Fluids 2014, 26, 015111. [Google Scholar] [CrossRef]
- Yu, D.; Kareem, A. Parametric study of flow around rectangular prisms using LES. J. Wind. Eng. Ind. Aerodyn. 1998, 77, 653–662. [Google Scholar] [CrossRef]
- Yeon, S.M.; Yang, J.; Stern, F. Large-eddy simulation of the flow past a circular cylinder at sub- to super-critical Reynolds numbers. Appl. Ocean Res. 2016, 59, 663–675. [Google Scholar] [CrossRef]
- Vakil, A.; Green, S.I. Drag and lift coefficients of inclined finite circular cylinders at moderate Reynolds numbers. Comput. Fluids 2009, 38, 1771–1781. [Google Scholar] [CrossRef]
- Rostamy, N.; Sumner, D.; Bergstrom, D.; Bugg, J. Local flow field of a surface-mounted finite circular cylinder. J. Fluids Struct. 2012, 34, 105–122. [Google Scholar] [CrossRef]
- Lee, T.; Lin, C.-L.; Friehe, C.A. Large-eddy simulation of air flow around a wall-mounted circular cylinder and a tripod tower. J. Turbul. 2007, 8, N29. [Google Scholar] [CrossRef]
- Palau-Salvador, G.; Stoesser, T.; Fröhlich, J.; Kappler, M.; Rodi, W. Large Eddy Simulations and Experiments of Flow around Finite-Height Cylinders. Flow Turbul. Combust. 2009, 84, 239–275. [Google Scholar] [CrossRef]
- Cai, S.-G.; Ouahsine, A.; Favier, J.; Hoarau, Y. Moving immersed boundary method. Int. J. Numer. Methods Fluids 2017, 85, 288–323. [Google Scholar] [CrossRef]
- Mimeau, C.; Gallizio, F.; Cottet, G.-H.; Mortazavi, I. Vortex penalization method for bluff body flows. Int. J. Numer. Methods Fluids 2015, 79, 55–83. [Google Scholar] [CrossRef]
- Minguez, M.; Luppi, A.; Vivet, R.; Maloberti, R. FSFR-Flat-Buoy stability model tests versus CFD/FSI method. In Proceedings of the Twenty-First International Offshore and Polar Engineering Conference, Maui, HI, USA, 19–24 June 2011; pp. 601–609. [Google Scholar]
- Vivet, R.; Minguez, M.; Berhault, C.; Jacquin, E.; Petrie, F.; Flamand, O. Flat buoy concept for free standing riser application: An improvement of the in-place hydrodynamic behaviour. In Proceedings of the ASME 2011 30th International Conference on Ocean, Offshore and Arctic Engineering, Rotterdam, The Netherlands, 19–24 June 2011; pp. 223–232. [Google Scholar]
- Braza, M.; Chassaing, P.; Minh, H.H. Numerical study and physical analysis of the pressure and velocity fields in the near wake of a circular cylinder. J. Fluid Mech. 1986, 165, 79–130. [Google Scholar] [CrossRef]


| Grid | Node | Computational Time (h) | |||
|---|---|---|---|---|---|
| Ref. [27] | Relative Error (%) | ||||
| 150,000 | 166784 | 54 | 0.513 | 0.56 | −8.39% |
| 300,000 | 322096 | 87 | 0.516 | 0.56 | −7.86% |
| 600,000 | 668376 | 136 | 0.527 | 0.56 | −5.89% |
| 1,200,000 | 1253696 | 192 | 0.538 | 0.56 | −3.93% |
| 2,400,000 | 2460496 | 278 | 0.544 | 0.56 | −2.86% |
| Experiments | Ref. [27] | CFD | Relative Error (%) | ||
|---|---|---|---|---|---|
| Ref. [27] | CFD | ||||
| 2.15 | 0.56 | 0.51 | 0.538 | −8.93% | −3.93% |
| 3.77 | 0.53 | 0.52 | 0.545 | −1.89% | 2.83% |
| 4.85 | 0.57 | 0.5 | 0.512 | −12.28% | −10.18% |
| Recirculation Region Length/m | |
|---|---|
| 0.1 | 0.292 |
| 0.2 | 0.303 |
| 0.3 | 0.403 |
| 0.4 | 0.463 |
| 0.42 | 0.469 |
| 0.5 | 0.511 |
| 0.6 | 0.541 |
| 0.7 | 0.569 |
| 0.8 | 0.576 |
| 0.9 | 0.589 |
| 1 | 0.613 |
| 2 | 0.785 |
| 3 | 0.831 |
| 4 | 0.915 |
| 5 | 0.994 |
Publisher’s Note: MDPI stays neutral with regard to jurisdictional claims in published maps and institutional affiliations. |
© 2021 by the authors. Licensee MDPI, Basel, Switzerland. This article is an open access article distributed under the terms and conditions of the Creative Commons Attribution (CC BY) license (http://creativecommons.org/licenses/by/4.0/).
Share and Cite
Yao, J.; Zhen, X.; Huang, Y.; Wang, W. Numerical Investigation on Hydrodynamic Characteristics of Immersed Buoyant Platform. J. Mar. Sci. Eng. 2021, 9, 168. https://doi.org/10.3390/jmse9020168
Yao J, Zhen X, Huang Y, Wang W. Numerical Investigation on Hydrodynamic Characteristics of Immersed Buoyant Platform. Journal of Marine Science and Engineering. 2021; 9(2):168. https://doi.org/10.3390/jmse9020168
Chicago/Turabian StyleYao, Jinjiang, Xingwei Zhen, Yi Huang, and Wenhua Wang. 2021. "Numerical Investigation on Hydrodynamic Characteristics of Immersed Buoyant Platform" Journal of Marine Science and Engineering 9, no. 2: 168. https://doi.org/10.3390/jmse9020168
APA StyleYao, J., Zhen, X., Huang, Y., & Wang, W. (2021). Numerical Investigation on Hydrodynamic Characteristics of Immersed Buoyant Platform. Journal of Marine Science and Engineering, 9(2), 168. https://doi.org/10.3390/jmse9020168