Article

Fatigue Characteristic of Designed T-Type Specimen under Two-Step Repeating Variable Amplitude Load with Low-Amplitude Load below the Fatigue Limit

1
Department of Naval Architecture, Ocean and Structural Engineering, School of Transportation, Wuhan University of Technology, Wuhan 430063, China
2
China Ship Development and Design Center, Wuhan 430064, China
3
Green & Smart River-Sea-Going Ship, Cruise and Yacht Research Center, Wuhan University of Technology, Wuhan 430063, China
4
Department of Automotive Engineering, School of Automotive Engineering, Wuhan University of Technology, Wuhan 430070, China
*
Author to whom correspondence should be addressed.
J. Mar. Sci. Eng. 2021, 9(2), 107; https://doi.org/10.3390/jmse9020107
Submission received: 4 December 2020 / Revised: 11 January 2021 / Accepted: 12 January 2021 / Published: 20 January 2021
(This article belongs to the Special Issue Ship Structures)

Abstract

:
In order to investigate the non-linear fatigue cumulative damage of joints in ocean structural parts, one type of low carbon steel Q345D was employed to prepare designed T-type specimens, and a series of fatigue experiments were carried out on the specimens under two-step repeating variable amplitude loading condition. The chosen high cyclic loads were larger than the constant amplitude fatigue limit (CAFL) and the chosen low cyclic loads were below the CAFL. Firstly, the S-N curve of designed T-type specimen was obtained via different constant amplitude fatigue tests. Then, a series of two-step repeating variable load were carried out on designed T-type specimens with the aim of calculating the cumulative damage of specimen under the variable fatigue load. The discussions about non-linear fatigue cumulative damage of designed T-type specimens and the interaction effect between the high and low amplitude loadings on the fatigue life were carried out, and some meaningful conclusions were obtained according to the series of fatigue tests. The results show that fatigue cumulative damage of designed T-type specimens calculated based on Miner’s rule ranges from 0.513 to 1.756. Under the same cycle ratio, the cumulative damage increases with the increase of high cyclic stress, and at the same stress ratio, the cumulative damage increases linearly with the increase of cycle ratio. Based on the non-linear damage evaluation method, it is found that the load interaction effect between high and low stress loads exhibits different damage or strengthening effects with the change of stress ratio and cycle ratio.

1. Introduction

Fatigue failure is a common phenomenon in steel structures of the ships and ocean assemblies, which are always subjected to cyclic loading during service [1,2]. Fatigue failure always appears at the local region of mechanical parts or components. In most cases, the cyclic loads applied on the structure of ship and ocean engineering are not constant but variable. Prediction of the fatigue life of structures under variable cyclic loads accurately is crucial for the engineers in the field of ocean and structural engineering, and that requires comprehensive understanding the damage mechanism of structures under the different types of variable fatigue load blocks.
Fatigue damage in metals is a process of irreversible accumulation, which is manifested by progressive internal deterioration of material due to nucleation and growth of micro-cracks, debonding, voids, and so on [3,4]. In general, fatigue failure contains three stages: crack initiation, crack propagation and final catastrophic failure. The difference between high cycle fatigue and low cycle fatigue lies in the percentage of the total life spent in each of three stages. As to the high cycle fatigue, much of the fatigue life is spent in the crack initiation stage [4]. Crack initiation is a highly random event which is strongly affected by the initial state of material properties and microstructural defects [5,6].
In order to predict the fatigue life of metallic components, it is necessary to find a reasonable method to calculate the fatigue damage accumulation in variable amplitude cyclic loads. For a long time, most of design engineers in industry always use Palmgren–Miner law to estimate the fatigue lives of metallic components due to relatively accurate and easy operation of this method. The Palmgren–Miner law is a linear damage rule (LDR). The value of cumulative damage (D) can be calculated by the Equation (1):
D = i = 1 n n i N i = r i
where ni is the number of cycles at a given stress amplitude load, Ni is the cycles to failure at the same stress amplitude load. Miner’s rule suggests that any structure with D < 1.0 during a fatigue test is safe.
The assumption in Miner’s rule is that the fatigue damage due to each of a particular cyclic load in a fatigue test with variable amplitude (VA) loads is exactly the same as that in the fatigue test with a constant amplitude (CA) load [7]. However, there are a large number of previous works [8,9,10,11,12,13,14] indicating that VA load fatigue tests induce larger fatigue damage than the calculated results by the Miner’s law, which leads to non-conservation of Miner’s rule in actual VA load fatigue life predictions (i.e., fatigue failure when D < 1.0). The main deficiencies of LDR are no consideration of the effect of load sequence, the effect of the damage of low amplitude load below fatigue limit and the interaction effect between the high and low amplitude loadings on the fatigue life [15]. All these factors that are not considered may lead to the deviation of fatigue life prediction. Therefore, the fatigue life predictions are unsafe in some cases [16]. Many researchers tried to modify the form of Miner’s rule with the aim of predicting fatigue life precisely. Marco and Starkey [17] proposed a non-linear load-dependent damage rule firstly as follows:
D = r i x i
where xi is a coefficient depending on the ith load. The main novelty of this rule is that the effects of different loading sequences are taken into account in calculation. However, the actual predicted result is usually unsatisfactory, and the experimental results showed that the good agreement only occurred in some cases and some materials [18].
Another approach is making use of the concept of fatigue limit reduction to measure the damage accumulation, when a multi-level load is applied and many rules based on the S-N curve modification have been developed [19]. For all these theories, the original curve is replaced by modified curves. Although these approaches are non-linear damage rules, few of these approaches take into account the load interaction effect.
There are some different methods of treating variable cyclic loading spectra containing the constant amplitude fatigue limit (CAFL) and calculating by the Miner’s law [20,21]. The most widely used assumption is that the S-N curve extrapolated beyond the load cycles at 107 with a relatively flat slope [22,23,24], and the damage accumulation rule is still Miner’ rule. However, a large number of experiments [9,25,26,27,28,29,30,31] show that in fact the actual fatigue damage is larger than in the assumption method. For example, it was reported [12] that the use of a 2-slope S-N curve with the slope change at a stress range above 10.1 N/mm2 (corresponding to about 5.5 × 10⁸ cycles) was potentially unsafe, particularly for loading spectra containing a large number of small cyclic stresses. Moreover, this was especially true for fatigue life of components under the tensile load.
In ship and ocean engineering, there are many joints in structural parts, such as the intersection between longitudinal and transverse bulkhead [32,33,34] which is one of the typical ship structures and is prone to fatigue failure during ship voyages. There are many techniques to perform structural health monitoring to guarantee the structural parts’ safety during service. In the process of structural health monitoring, it is important to accurately capture or predict the deformation of structures. The stresses and displacements of the structural components in the ships can be calculated by different analytical theories and finite element methods. The Carrera unified formulation (CUF)-based finite element analysis (FEA) model has been validated to accurately simulate the deformation of complex structures by laser-based experiments [35]. Nondestructive testing (NDT) are usually employed to assess structural health and secure structure integrity. With the measurements of laser tracker and terrestrial laser scanning, an optimized surface model can be established as a high-accuracy NDT metrology tool [36]. To obtain accurate deformed state of a given composite thin-walled structures, the geometric nonlinear effects of the composite structures can be analyzed by the CUF-based FEA model [37]. Meanwhile, with the consideration of geometrical nonlinear relations in beam and shell-like structures, the deformed state of a given structure can be correctly captured by refined theories based on the CUF [38]. Although the developed theoretical methods promote the structural health monitoring of the structural parts, the fatigue experiments are still necessary to improve the service life of structural parts.
There is a special type of ship called river-sea going ship, which repeats voyaging between the inland river and coast sea along a special voyage line, and the loading environment from which the ship suffers, is much like the two-step repeating load block [39]. When the ship voyages on the sea, the loading on the ship by the sea wave is different from the river wave in the inland river. The loading on the ships can be variable whether the ships voyage on the sea or the inland river. Usually, the high loading on the ship by the sea wave is larger than that by the inland river. Here in the paper, the variable loading on the river-sea going ship is approached by the model of two-step repeating variable amplitude load with low-amplitude load below the fatigue limit. Therefore, a study on fatigue characteristic of designed T-type specimen under the two-step repeating amplitude loading block was carried out in this work. The loading block contained high cyclic load and low cyclic load levels. The high cyclic load was above the CAFL and the fatigue life produced by the high cyclic load lied in the high cycle fatigue range, and the low cyclic load was below the CAFL. Firstly, tensile tests were conducted on the designed T-type specimens to get the material mechanical properties. Then a series of fatigue experiments with both the CA loading and the two-step repeating amplitude load block were conducted on designed T-type specimens. Furthermore, as a comparison, Miner’s rule was used to calculate the fatigue damage accumulation of designed T-type specimen, under every two-step repeating cyclic load condition. Finally, the nonlinear damage parameter was introduced to evaluate the load interaction effect and some conclusions were drawn.

2. Experimental Setup

All the fatigue experiments were carried out via an MTS 322 250 kN Dynamic Fatigue Testing System at the Ship Structure Laboratory of Wuhan University of Technology (Wuhan, China). Figure 1a shows the overall layout of the experiment. The MTS equipment consists of a servo-hydraulic actuator (1) and controller (2). One end of the fatigue specimen was fixed in the platform (3) and the other end was actuated via the servo-hydraulic actuator (1). Figure 1b shows the clamping state of the specimen in fatigue tests. The fatigue test specimen was installed between the grippers (4). All fatigue tests were conducted at room temperature (20 °C).

2.1. Material

The material used for the fatigue test was one type of low carbon steel, Q345D steel. Its chemical compositions (in Wt%) were listed in Table 1. In order to obtain the mechanical properties of Q345D steel, tensile tests were conducted on the standard specimen. Figure 2 shows the standard specimen of the tensile test. The tensile tests were conducted in accordance with the published standard [40]. The test results of mechanical properties are shown in Table 2.

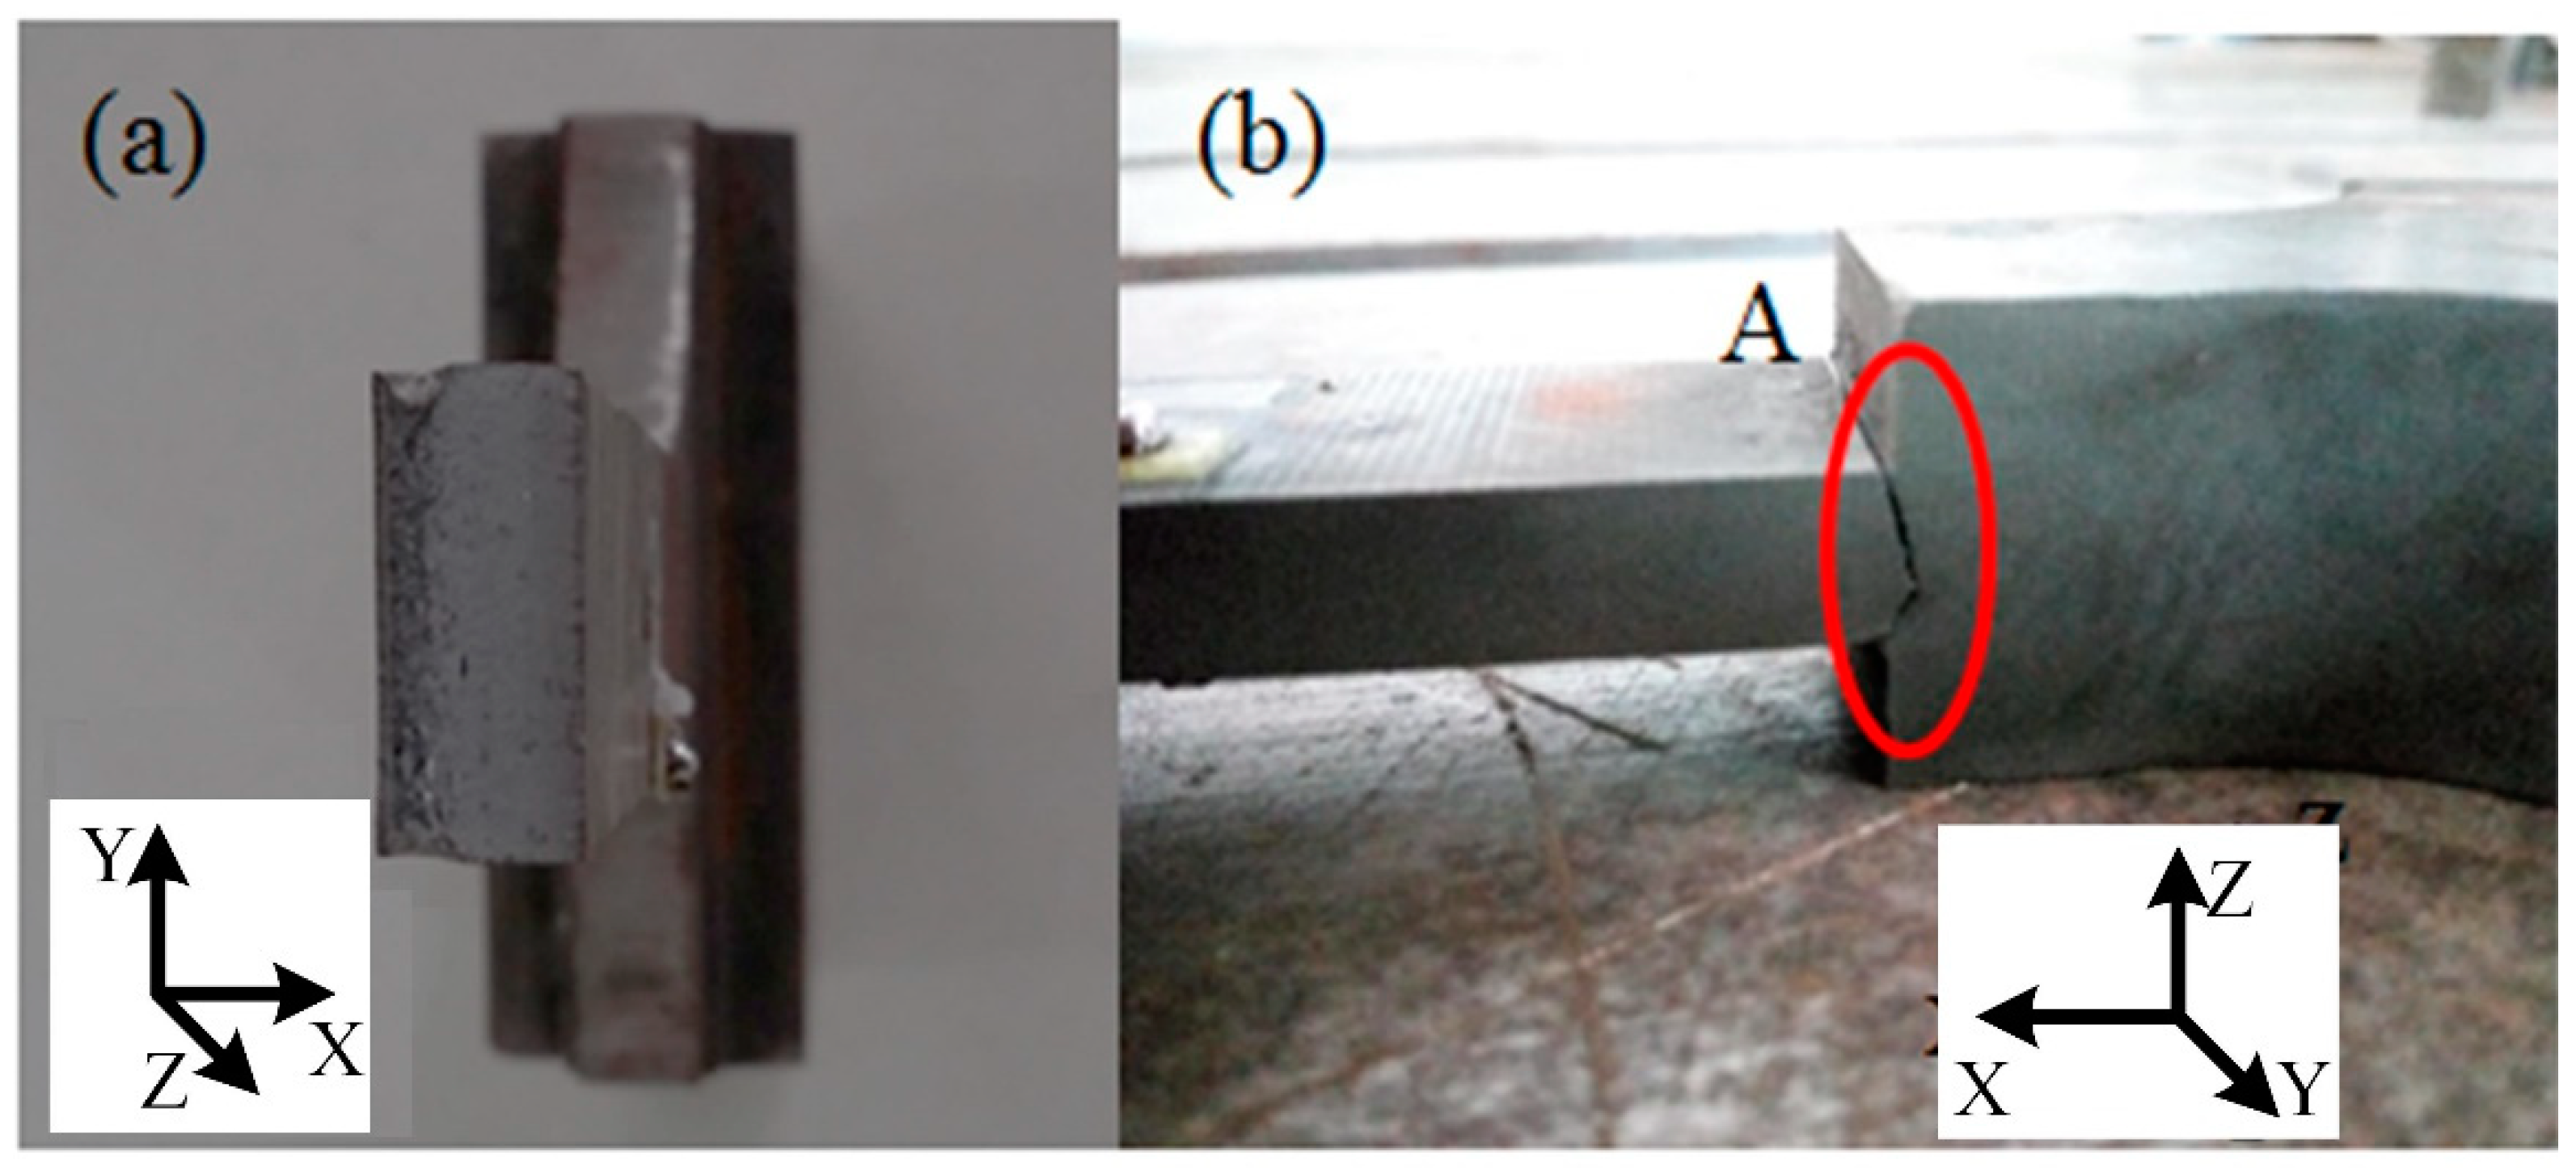
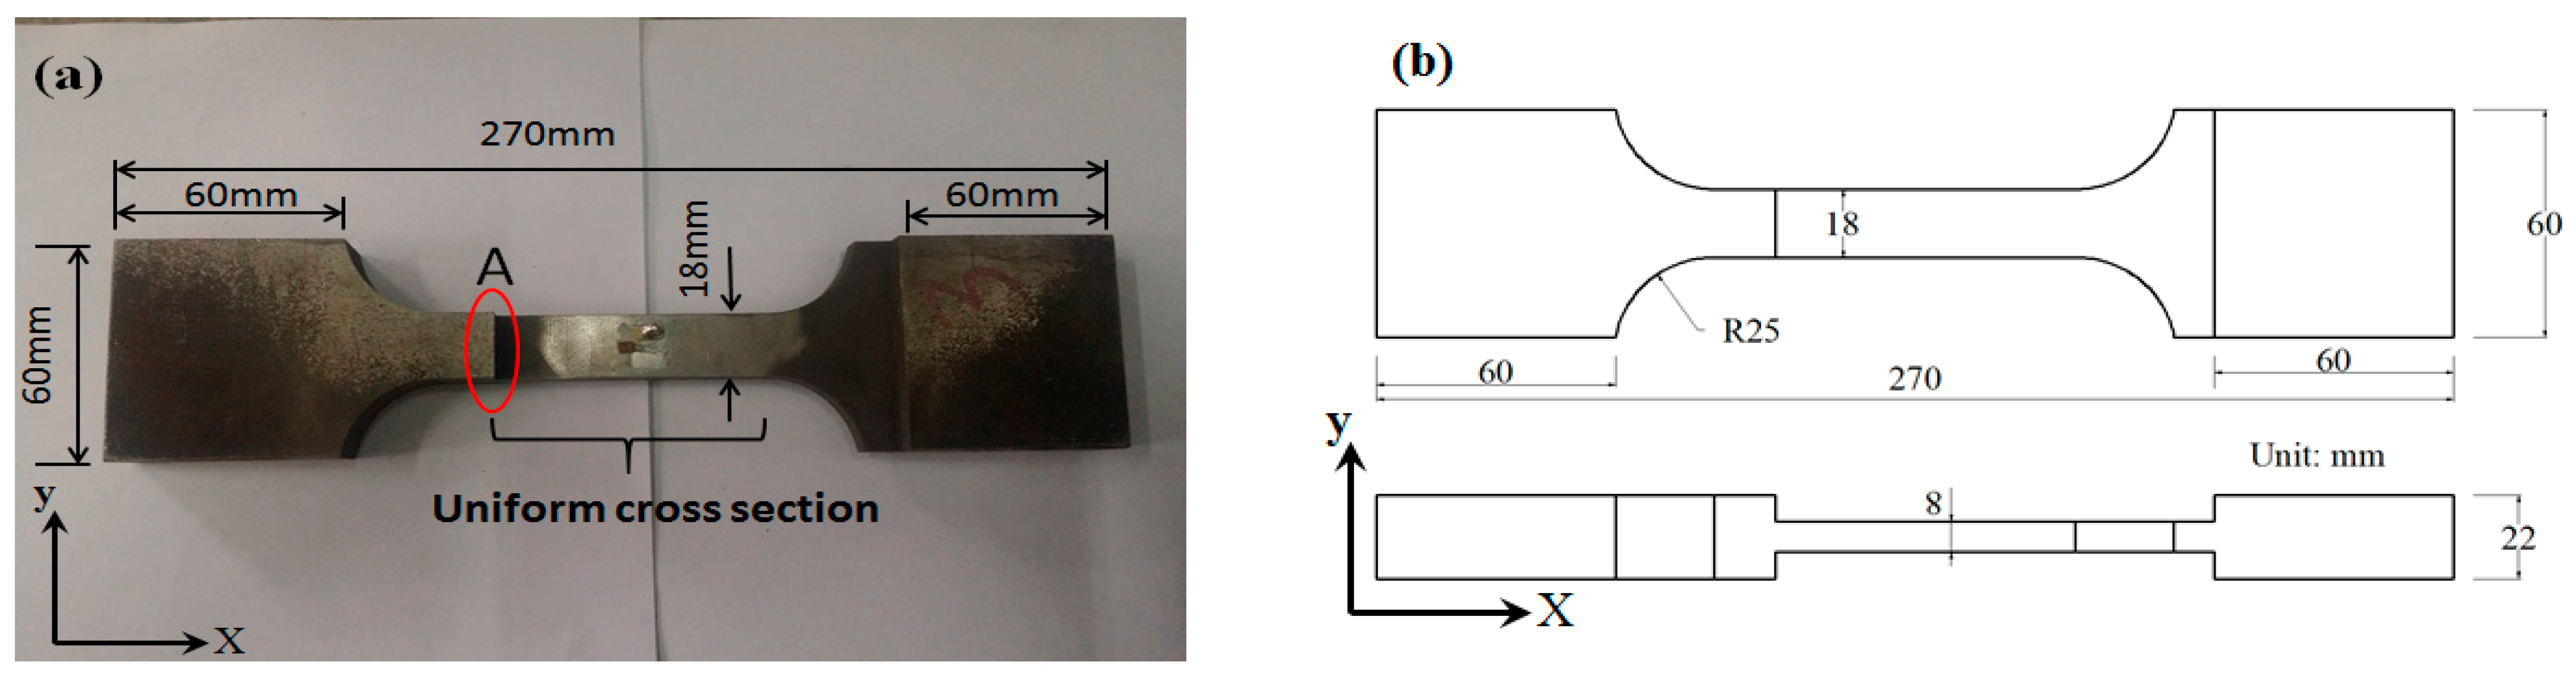
2.2. Designed T-Type Specimen

Figure 3 shows the specimen and its dimensions employed in a fatigue test. The thickness in the middle of uniform cross section was 8 mm. The specimen was prepared with the method of wire-electrode cutting to guarantee its size precision. The specimen had a bilateral symmetrical T-type step (labelled as “A” in Figure 3a) which caused highly localized stress concentration. When the test specimen was subjected to cyclic loading, failure occurred at the T-type step (“A” in Figure 3a).

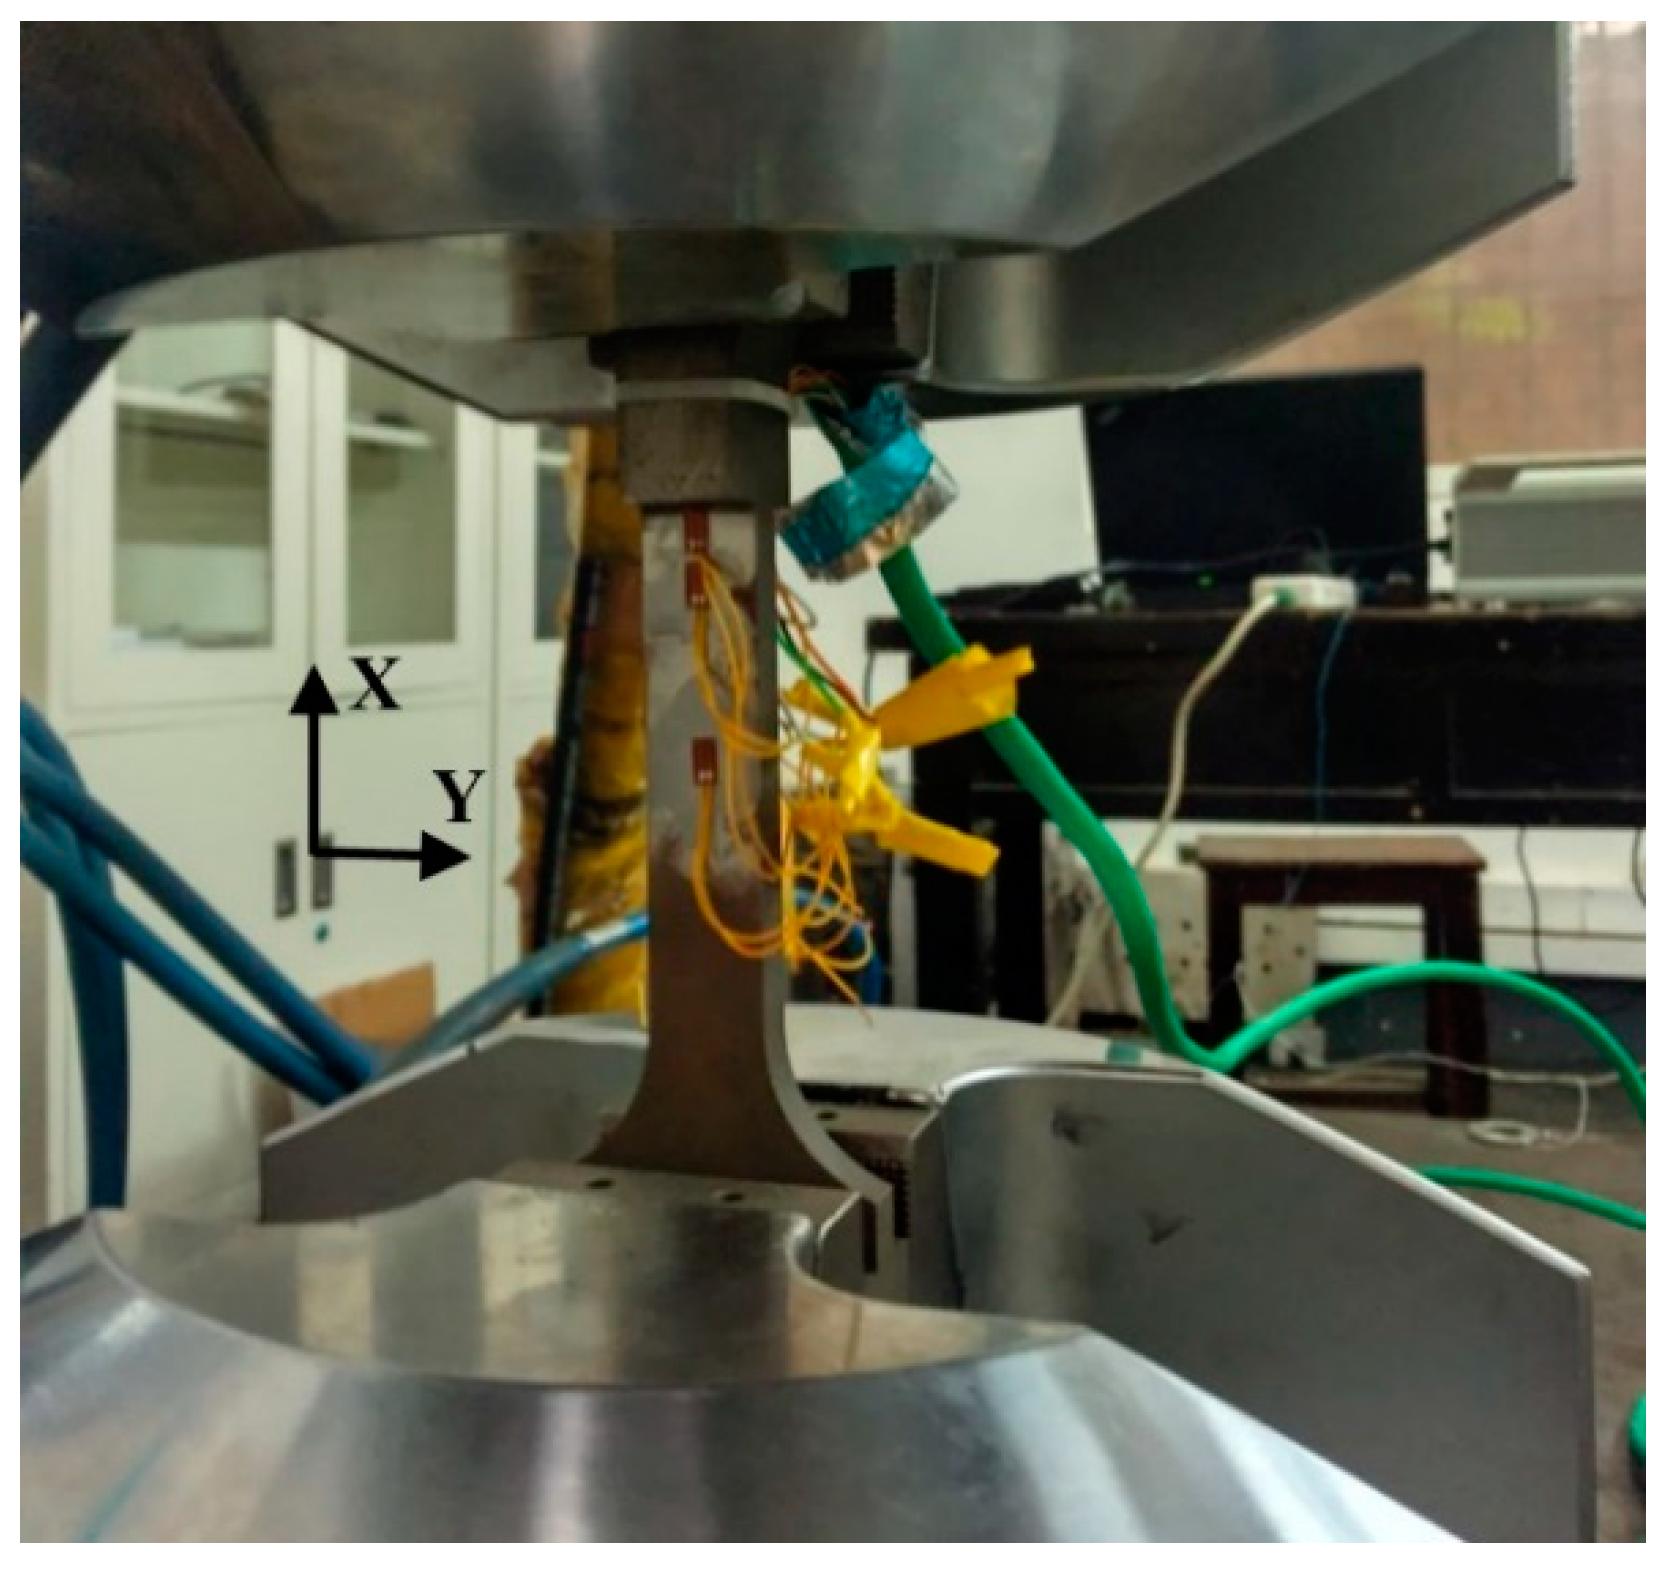
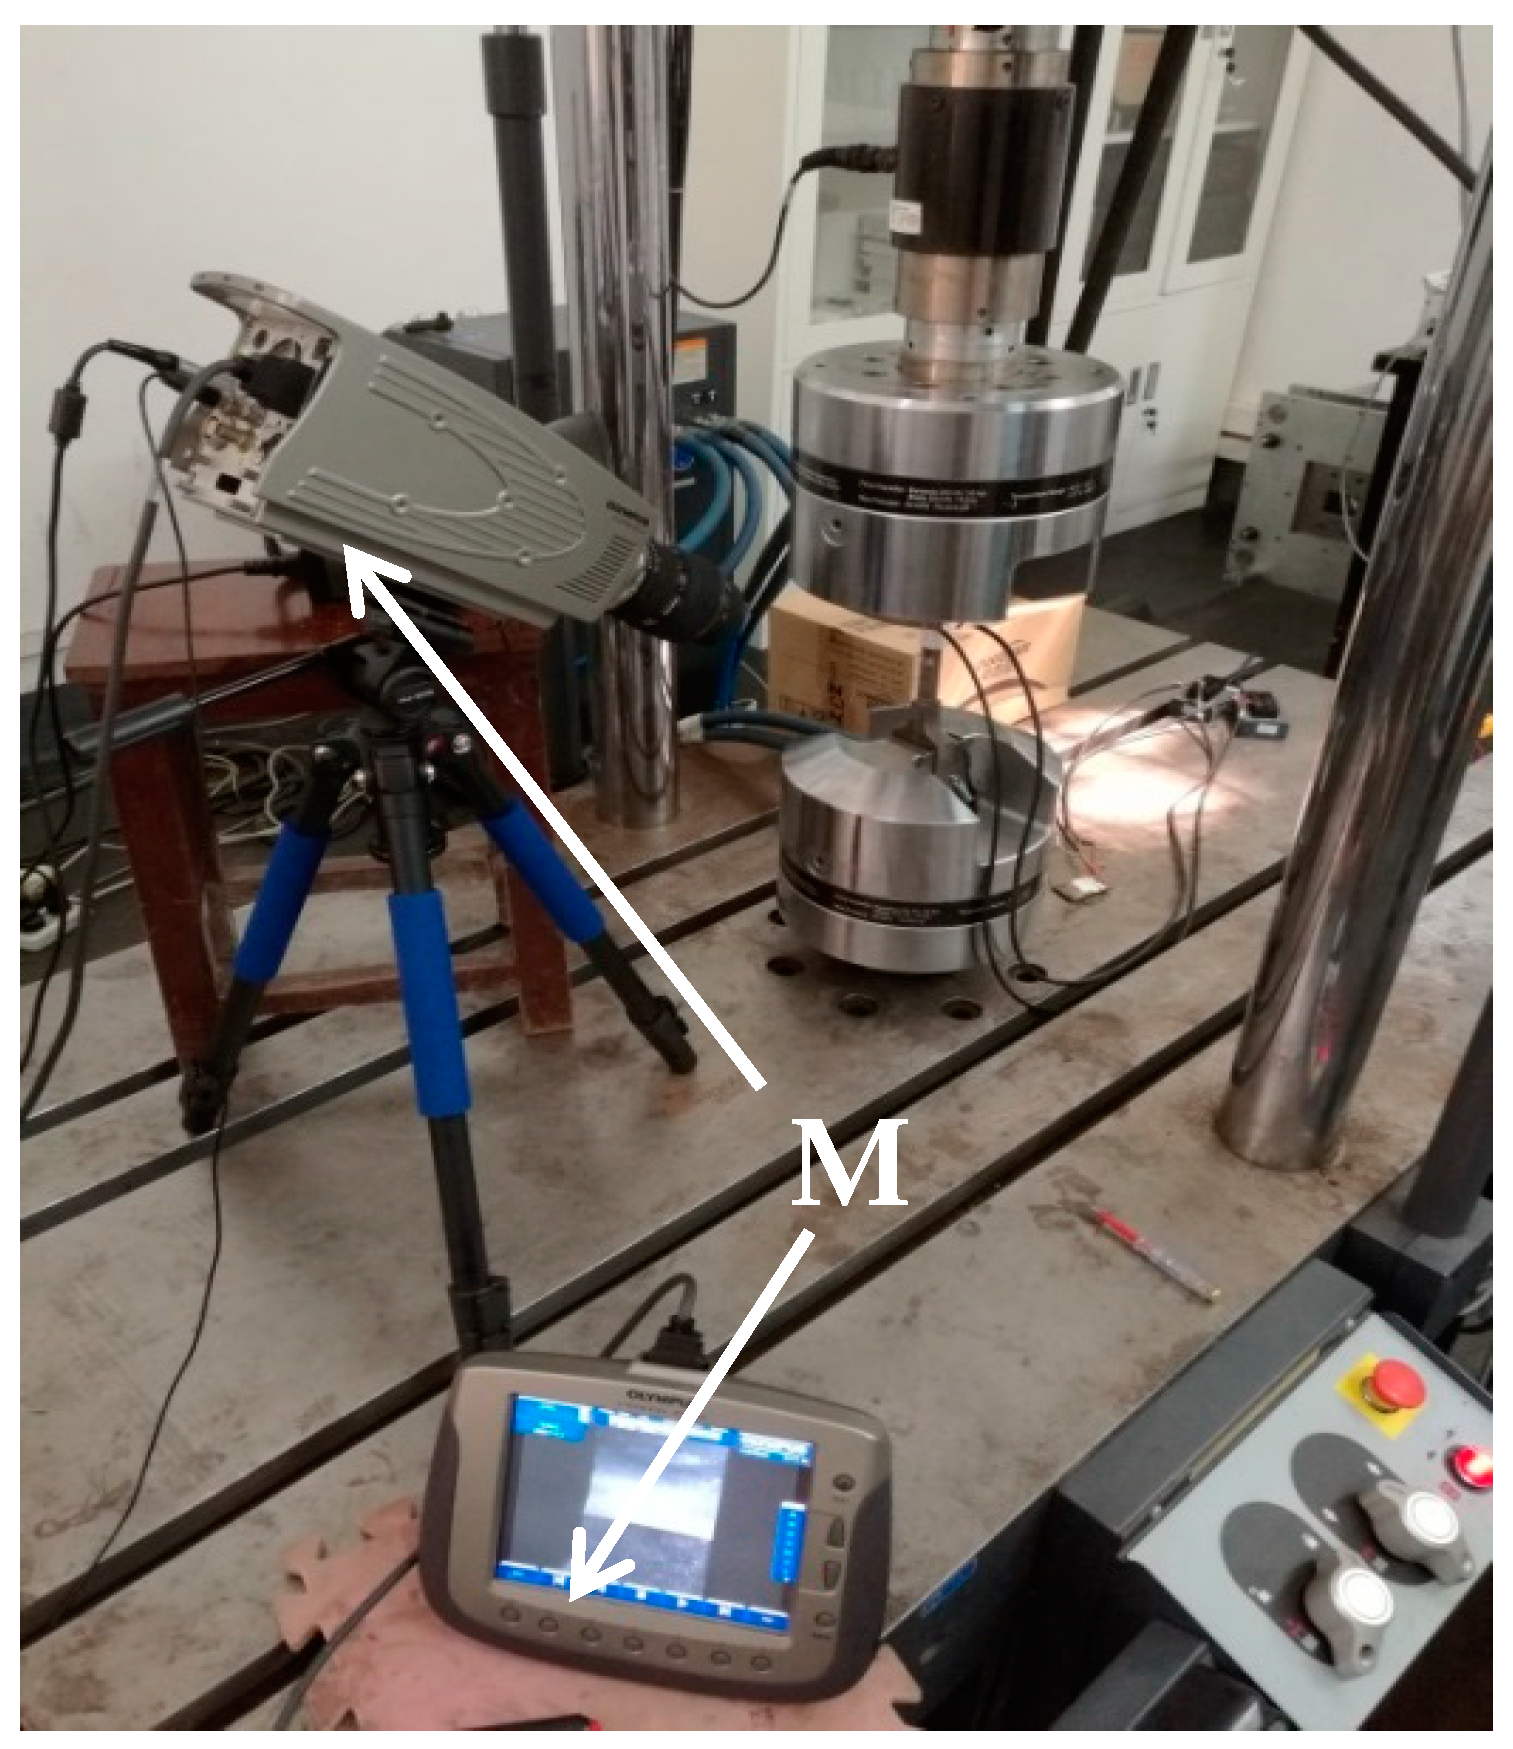
2.3. Strain Measurement
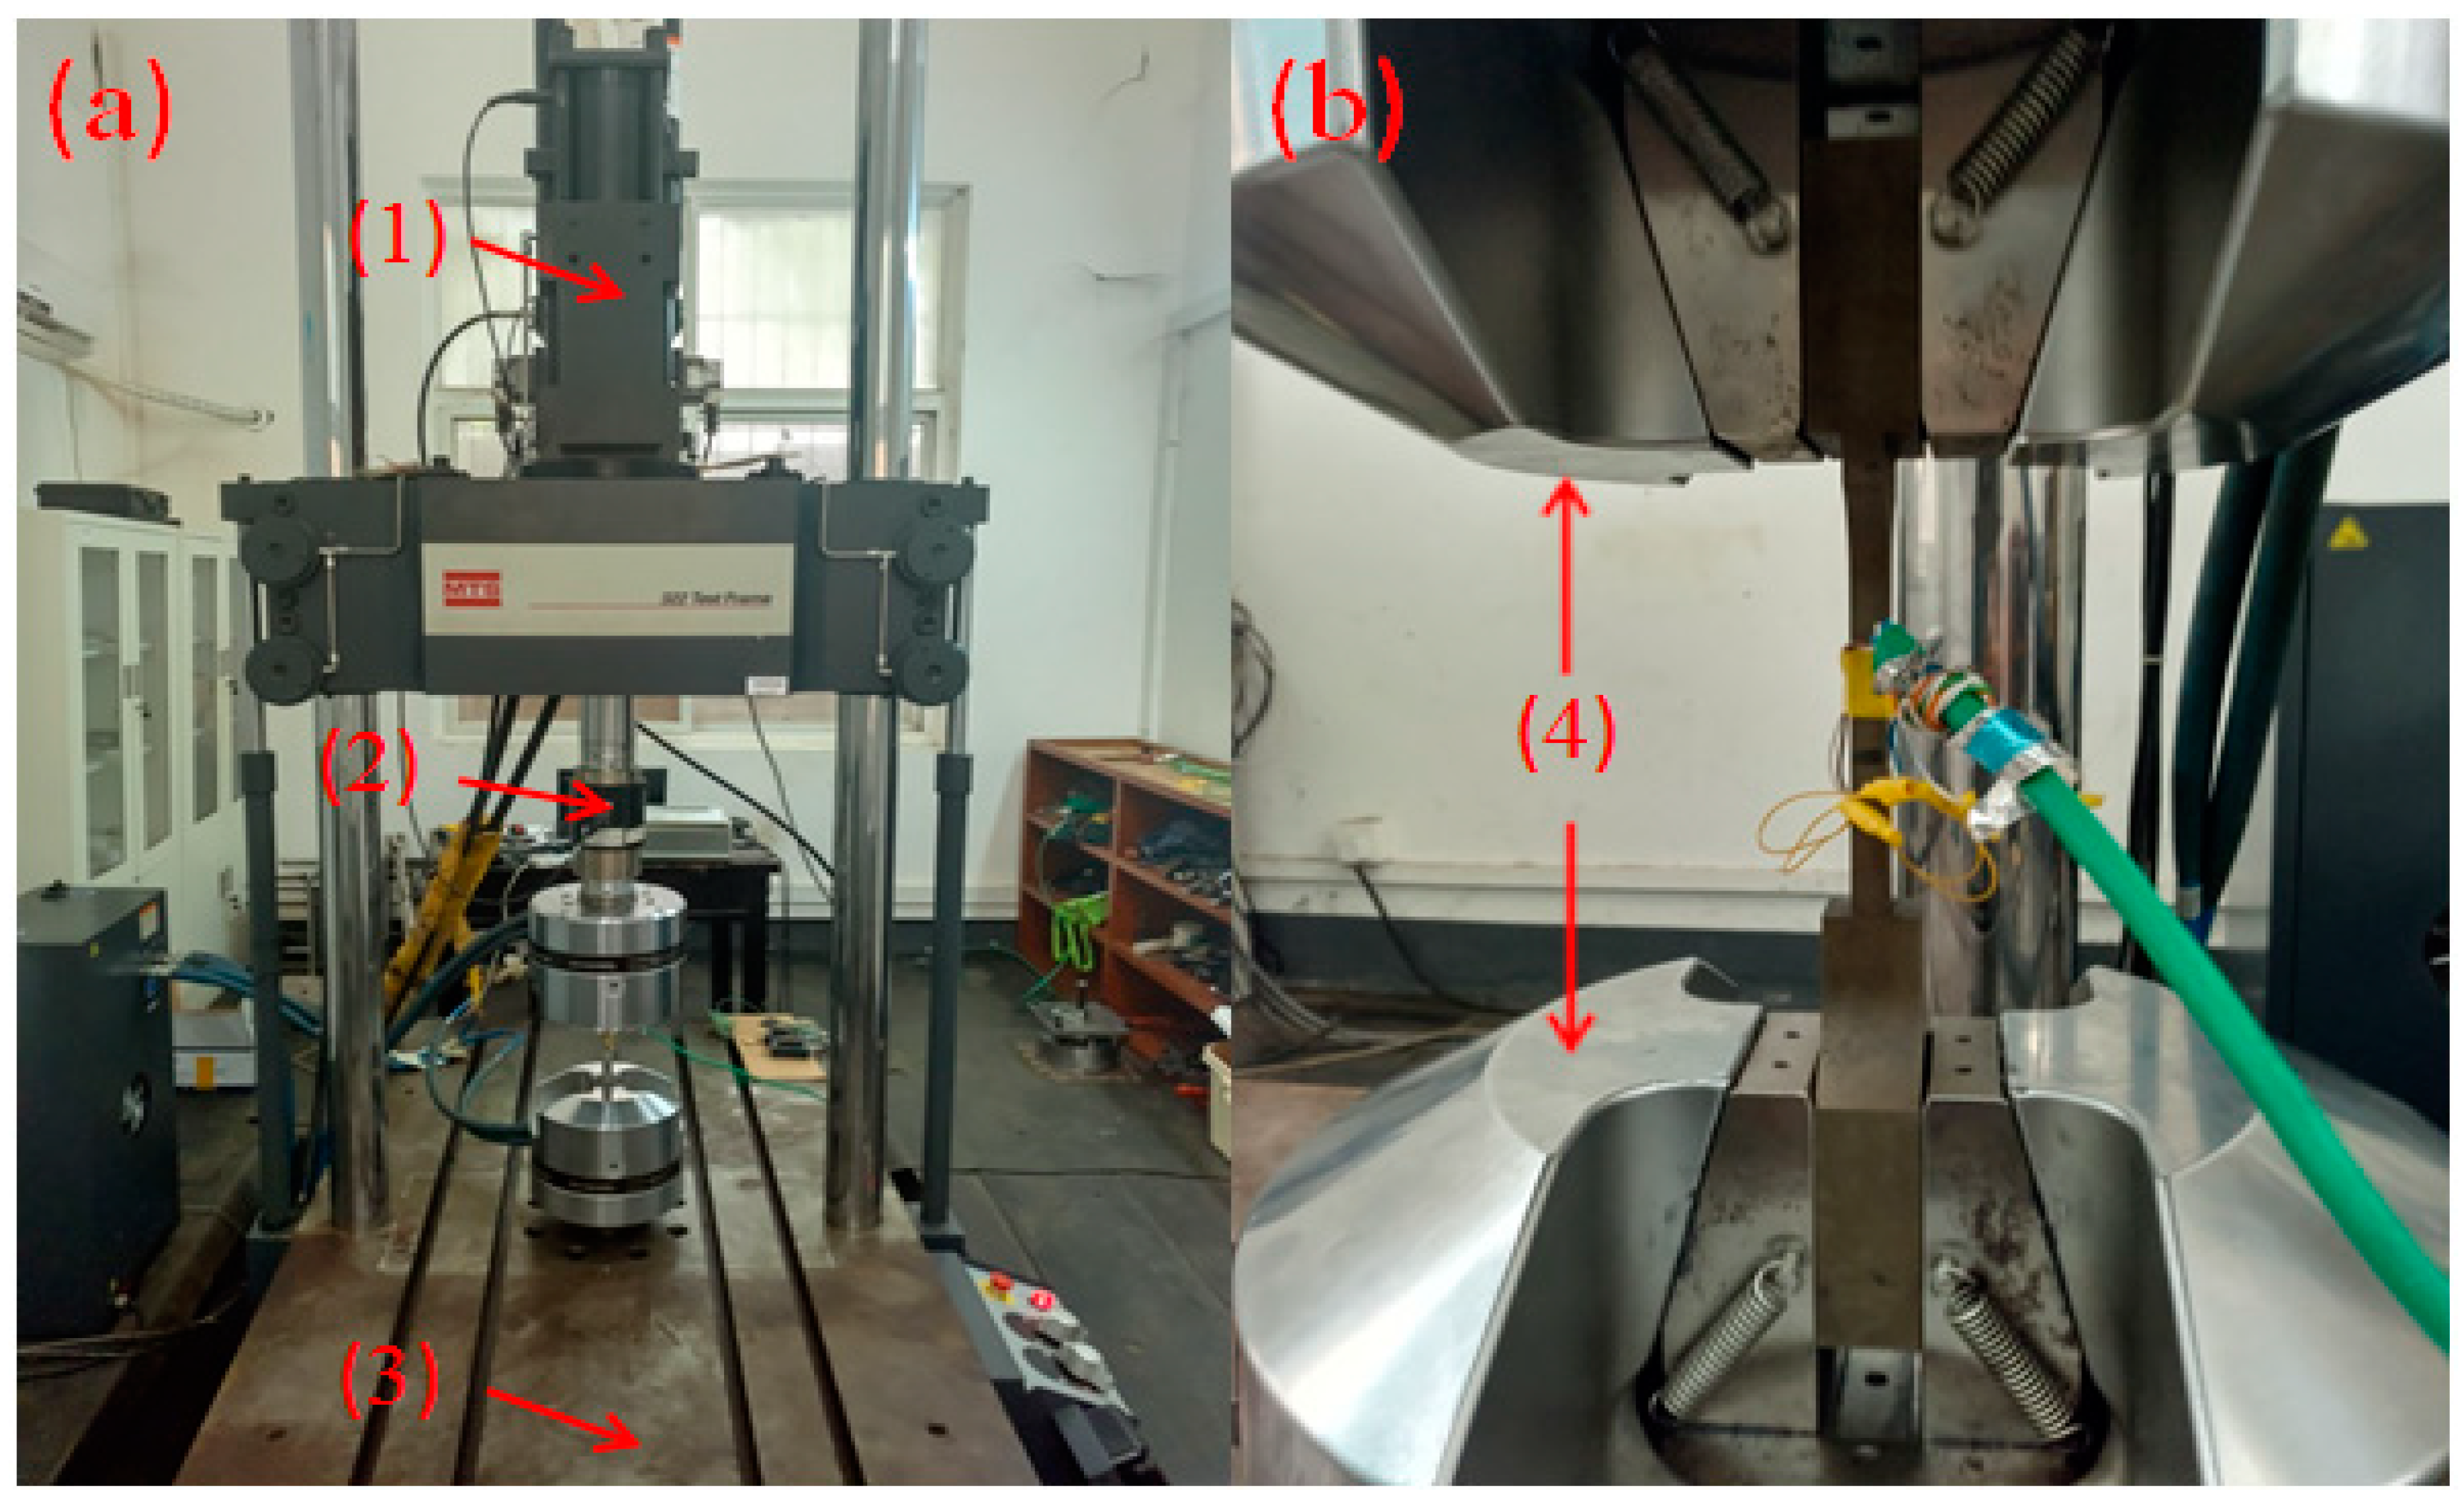
The strain gauges were placed along the step on the surface of uniform cross section on both sides (shown in Figure 4) to measure the strain value variation and to monitor the crack initiation [41]. The stress concentration factor (SCF) at the T-type step (“A” in Figure 3a) was 1.9 according to the method proposed by Dong [42]. The value of the radius at the crack starting zone was 0.4 mm.

2.4. Fatigue Test

The test program involved both CA and VA loading tests on designed T-type specimens. Figure 5 shows the fatigue experiment setup. Figure 5 is the Microscopy System of KEYENCE which was used to observe the fatigue crack at the step (“A” in Figure 3a). All the fatigue tests were conducted with a frequency of 20 Hz in the force control mode. Loading of sinusoidal type was applied at room temperature. Fatigue tests stopped when the cracks on a specimen were found. Figure 6a shows the fracture surface of designed T-type specimen after fatigue failure. Figure 6b shows the crack initiation zone and the path of crack propagation. As shown in Figure 6b, the crack always initiated at one side of the specimen at the step (“A” in Figure 6b) and propagated in the Y direction on the surface. The crack changed its propagation direction into the Z direction after the crack reached one side of the cross section of the specimen. When the crack developed into a certain depth of the specimen then final instantaneous fracture occurred. Compared with the crack initiation life, the crack propagation life was very short. Therefore, the crack initiation life can be regarded as the whole fatigue life of the specimen.

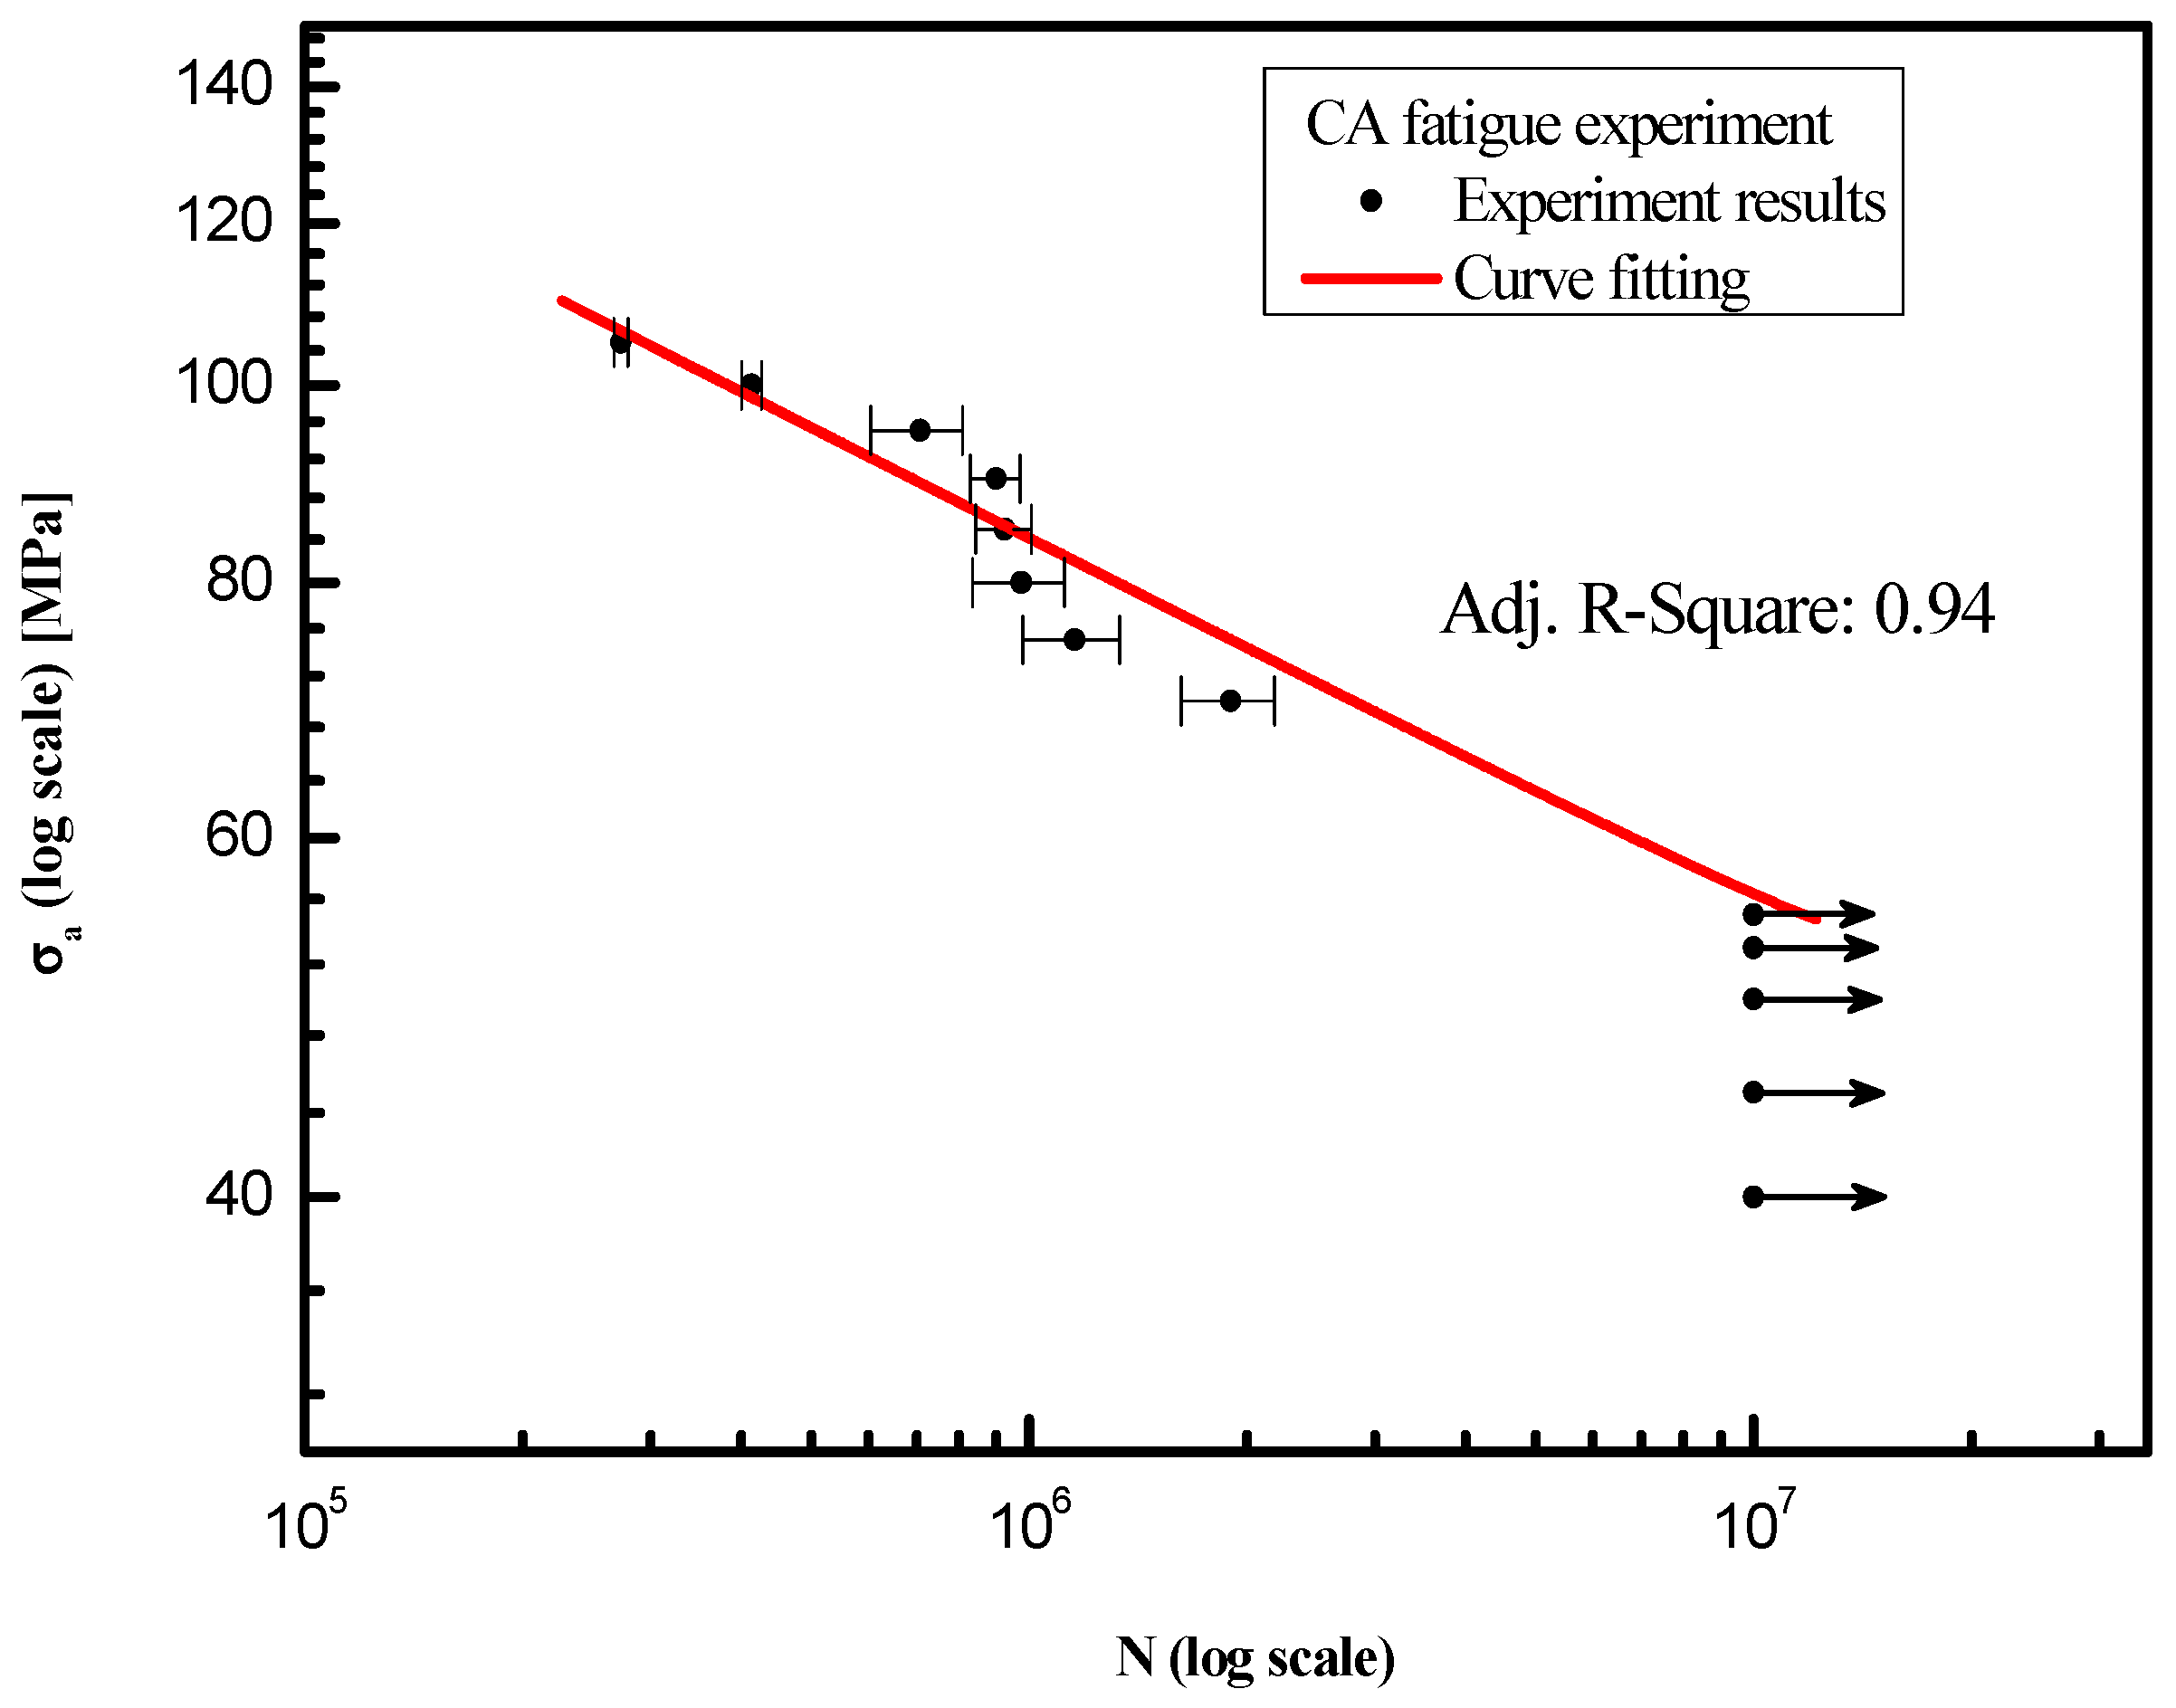
2.4.1. Constant Amplitude Fatigue Tests

Thirteen different stress amplitudes were chosen as CA loading conditions. Three repeated experiments were conducted for every stress amplitude condition. Table 3 shows the specific loading conditions. The stress ratio (R) of all loading conditions is 0.1. According to the recommendation of BS7608 [43], all the fatigue tests were stopped when the cyclic number was larger than 107 if fatigue failure didn’t appear.

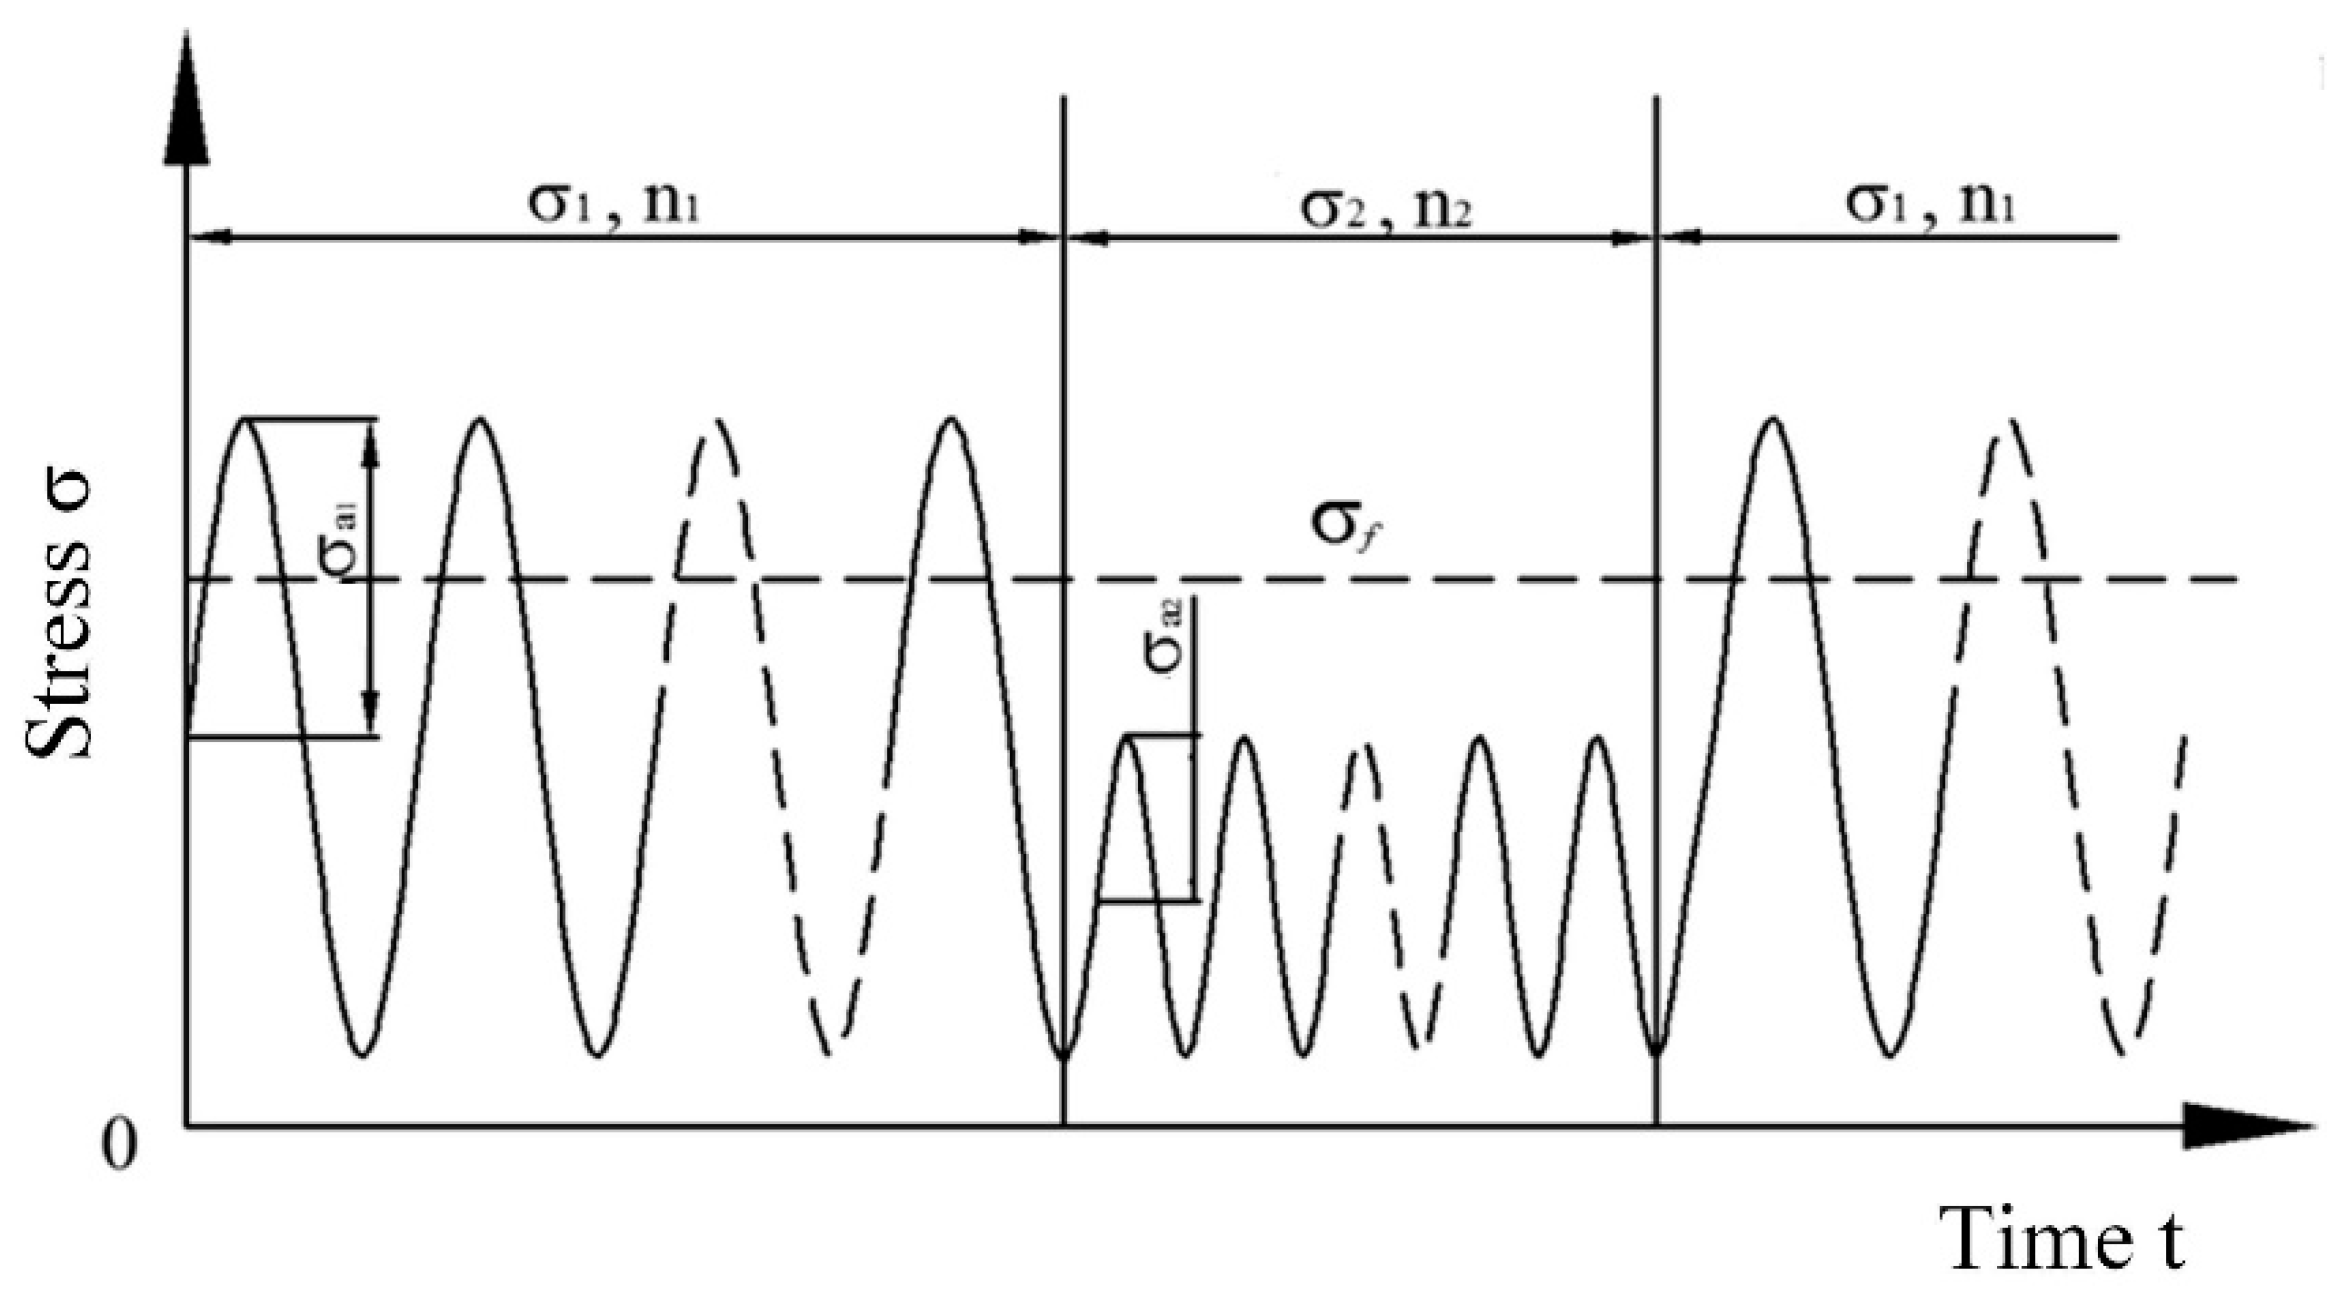
2.4.2. Variable Amplitude Loading Tests

Two-step repeating amplitude fatigue load tests were carried out after CA loading fatigue tests. Figure 7 shows an abridged general view which depicts the loading spectrum of two-step repeating amplitude fatigue load. In the two-step repeating amplitude fatigue load tests, the high cyclic stress and low cyclic stress levels σa1 and σa2 were set to values above and below the CAFL, respectively. The stress ratio of each stress amplitude was R = 0.1. n1 and n2 were the number of cycles of each stress levels σa1 and σa2 in a load block. In the experiments, n1=20,000, and it is the same for all the experiments in this article. n2 was different for different loading cycle ratios. For example, when the loading cycle ratio is 1:1, n2=20,000. When the loading cycle ratio is 1:2, n2=40,000. Before the failure, n1 and n2 kept the same in each loading block for a certain loading cycle ratio. When the failure occurred in the experiments, the failure might appear when the high or the low stress was applied since it is cyclic loading. n1 was the instantaneous number at the failure moment and recorded in the experiment, not 20,000 any longer, if the failure appeared with the high stress applied. Correspondingly, n2 was the instantaneous number at the moment when the failure was detected with the low stress applied, not the set number any longer.

3. Results and Discussion

3.1. Constant Amplitude Test Results

The fatigue lives of different CA conditions were obtained with averaging experimental data from three repeated fatigue tests. Table 4 shows the average experimental results of every CA condition. Figure 8 shows the fitting S-N curve of experimental results. From the experiment results, it can be seen that the experimental scatter is small and the linearity agreement is good in the log-–log scale.

3.2. Variable Amplitude Fatigue Experiment Results

The loading conditions of designed T-type specimens under variable amplitude test are mainly divided into two types, variable high cyclic stress (stress ratio) and high–low load cycle ratio. Table 5 lists the loading conditions of the test. The load type was a two-step repeating load block, and the low cyclic stress was 50 MPa which was below the CAFL according to the CA fatigue experiment results. Table 6 shows the experimental results of every load condition under a two-step repeating amplitude fatigue load block. The item n i stands for the cyclic number contributed by the corresponding cyclic stress amplitude σ a i and the item ( n 1 + n 2 ) stands for the total fatigue life of designed T-type specimen when fatigue failure occurs. The item Nf1 and Nf2 is the cyclic number of fatigue failure under the cyclic stress of σa1 and σa2, respectively. Nf2 is constant and equals 16,000,000 corresponding to σ a 2 = 50 MPa, which is calculated by extrapolating the fitting S-N curve in the log-log plot in Figure 8. σa1 is different in different stress ratio cases and Nf1 can also be calculated by extrapolating the fitting S-N curve in the log-log plot in Figure 8. The calculated values of Nf1 for different high stresses are also shown in Table 6.

4. Damage Accumulation of Variable Fatigue Experiment Analysis

The VA experimental results were analyzed in terms of Miner’s rule to check its validity and to examine the effect of stress below the CAFL under the two-step repeating load block. The calculation method is as follows:
D = n 1 N f 1 + n 2 N f 2
Figure 9 shows the damage accumulation results of designed T-type specimens under the two-step repeating load block by the Miner’s rule. Figure 9 shows the damage accumulation value of every condition with a bar graph, and the different colors represent the fatigue damage contributed by each cyclic stress.
It can be seen that the fatigue damage caused by low cyclic stress below the CAFL is relatively smaller than that caused by high cyclic stress above the fatigue limit. In order to better compare the fatigue damage evolution law of designed T-type specimens under two-step repeating VA loads, the results of the above-mentioned conditions are sorted out, and the variation law of cumulative damage with the high stress under different load cycle ratios is obtained.
As can be seen from Figure 10, the fatigue cumulative damage of designed T-type specimen shows the same change rule under different load cycle ratios. With the increase of high cyclic stress, the cumulative damage value decreases, and the rate slows down gradually. By comparing the cumulative damage of different load cycle ratios under the same high stress, it can be indicated that the greater the cycle ratio, the greater the fatigue cumulative damage of designed T-type specimens. Besides, the rule of fatigue cumulative damage varying with the cycle ratio under different high stresses is obtained. k1, k2, k3 and k4 represent the linear slope of fatigue cumulative damage with the cycle ratio under high-low stress of 105/50, 100/50, 95/50 and 90/50 MPa, respectively.
Under different high-low stress ratios, the fatigue cumulative damage calculated with the change of the cycle ratio based on Miner rule changes linearly, and the slope k of the curve is different. By fitting the relationship between the high stresses in different loading blocks and the slopes k of these curves in Figure 11, as shown in Figure 12, it can be found that the double logarithmic curve satisfies the data linearly. Finally, the logarithmic relationship between the high stress and the slope k of fatigue cumulative damage varying with the cycle ratio is obtained.

5. Non-Linear Damage Evaluation

As the load interaction caused the non-linear damage accumulation in the fatigue test with a two-step repeating amplitude loading block, therefore, the linear damage accumulation did not equal one. The parameter Dnl which defined the damage value of load interaction effect, was introduced into the Miner’s law to evaluate the influence by the load interaction. The value of Dnl was proposed by Kim et al. [32] and could be calculated as the Formula (4).
D n l = 1 D = 1 i = 1 n n i N i
When Dnl is positive, it indicates that the fatigue performance is damaged by load interaction effect, and when Dnl is negative, it indicates that the fatigue performance is strengthened by load interaction effect. The calculating results by the equation (4) were shown in the Figure 13.
As can be seen from Figure 13, the load interaction effect of high-low cyclic stress above and below CAFL shows different damage or strengthening effects with the change of cyclic ratio and high stress. Under the same cycle ratio, with the increase of high stress, the load interaction effect gradually transforms from strengthening effect to damage effect. Under the same stress, with the decrease of cycle ratio n1/n2, the damage effect decreases gradually at high stress area, and with the decrease of cycle ratio n1/n2 at low stress area, the effect of strengthening effect also increases. It can be seen that the load interaction effects of high-low cyclic stress have different damage or strengthening effects on fatigue performance with the change of stress ratio and cycle ratio.
The procedure for fatigue analysis also applies to other ships with variable loading. The linear damage rule must also be updated by considering the nonlinear damage. The form of the nonlinear damage can be developed further according to the actual loading condition.

6. Conclusions

This paper investigated the fatigue characteristics of designed T-type specimen under the two-step repeating load block. The designed T-type joint was common in the ship structure and the fatigue failure always occurred at this type of joint. The two-step repeating load block was introduced to simulate the load environment of voyage line of river-sea going ship and this type of load block was seldom studied systematically.
CA fatigue experiments were conducted first and then VA fatigue experiments. Every CA fatigue experiment was repeated three times. Twenty-three load conditions of VA fatigue experiment were conducted, Miner’s rule was used to calculate the damage accumulation, and the load interaction effect of two-step repeating load block was also evaluated through the formula (4). From the analysis by the Section 4 and Section 5, the following conclusions could be drawn:
(1)
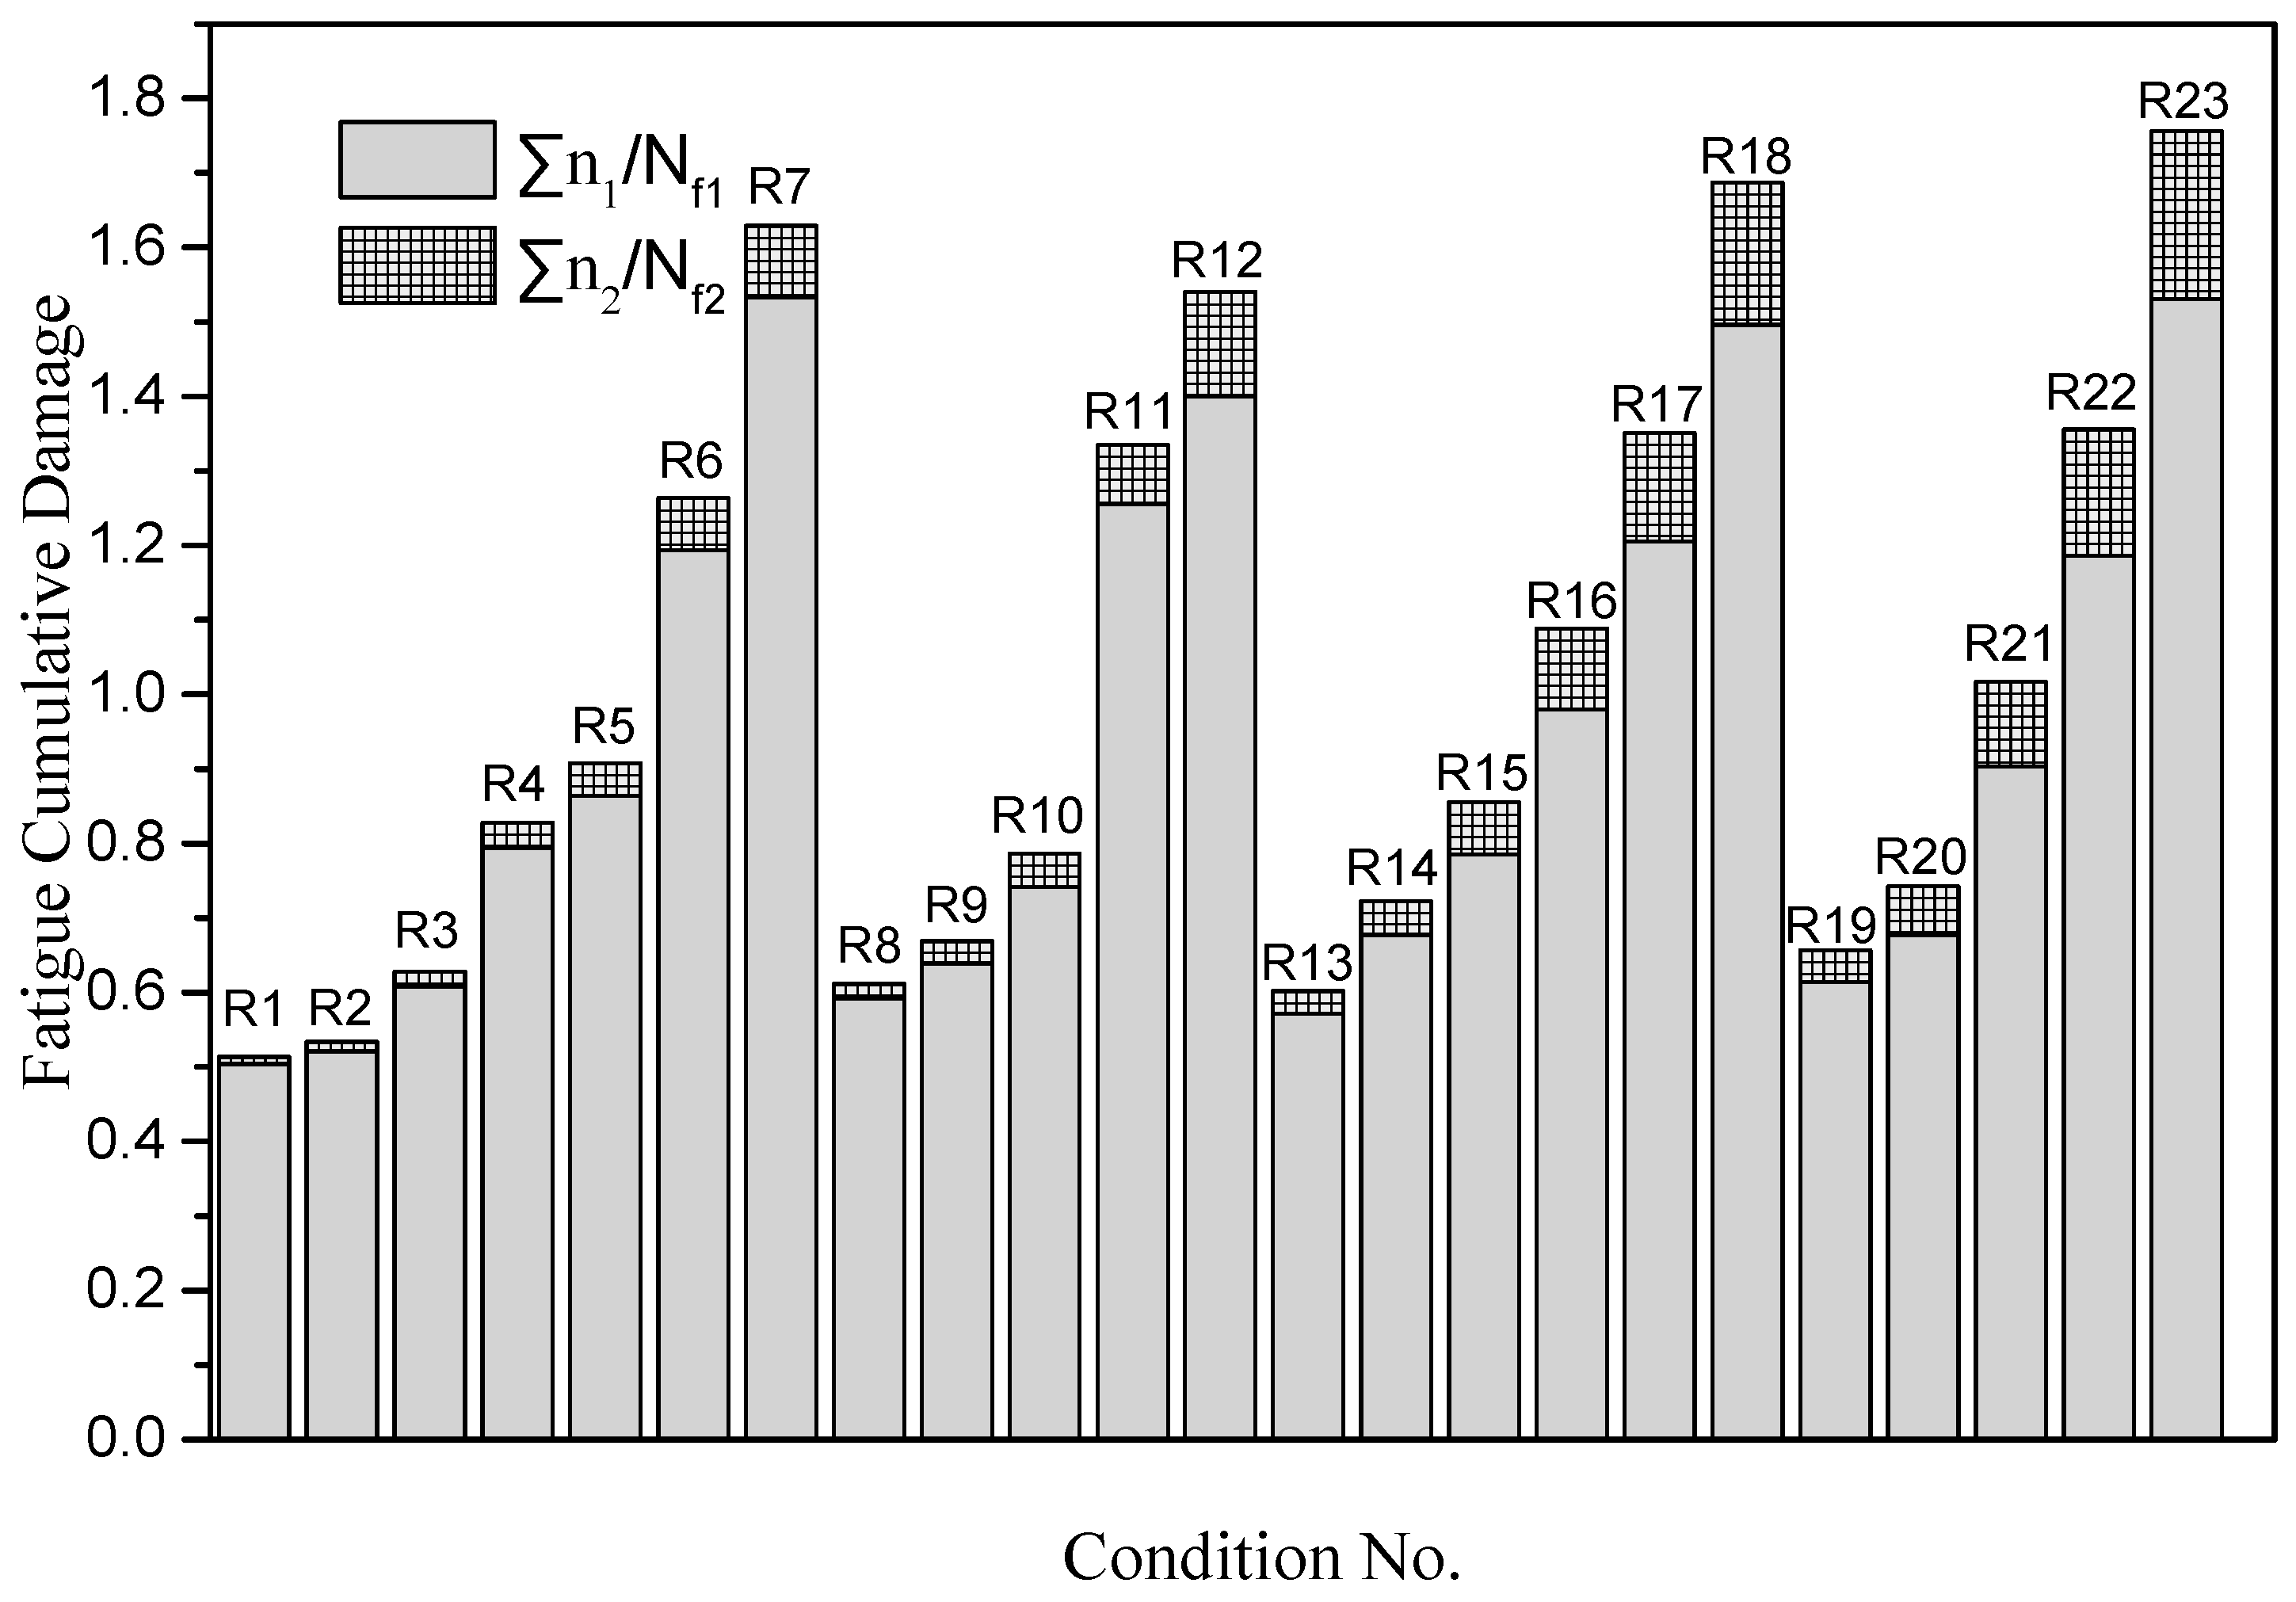
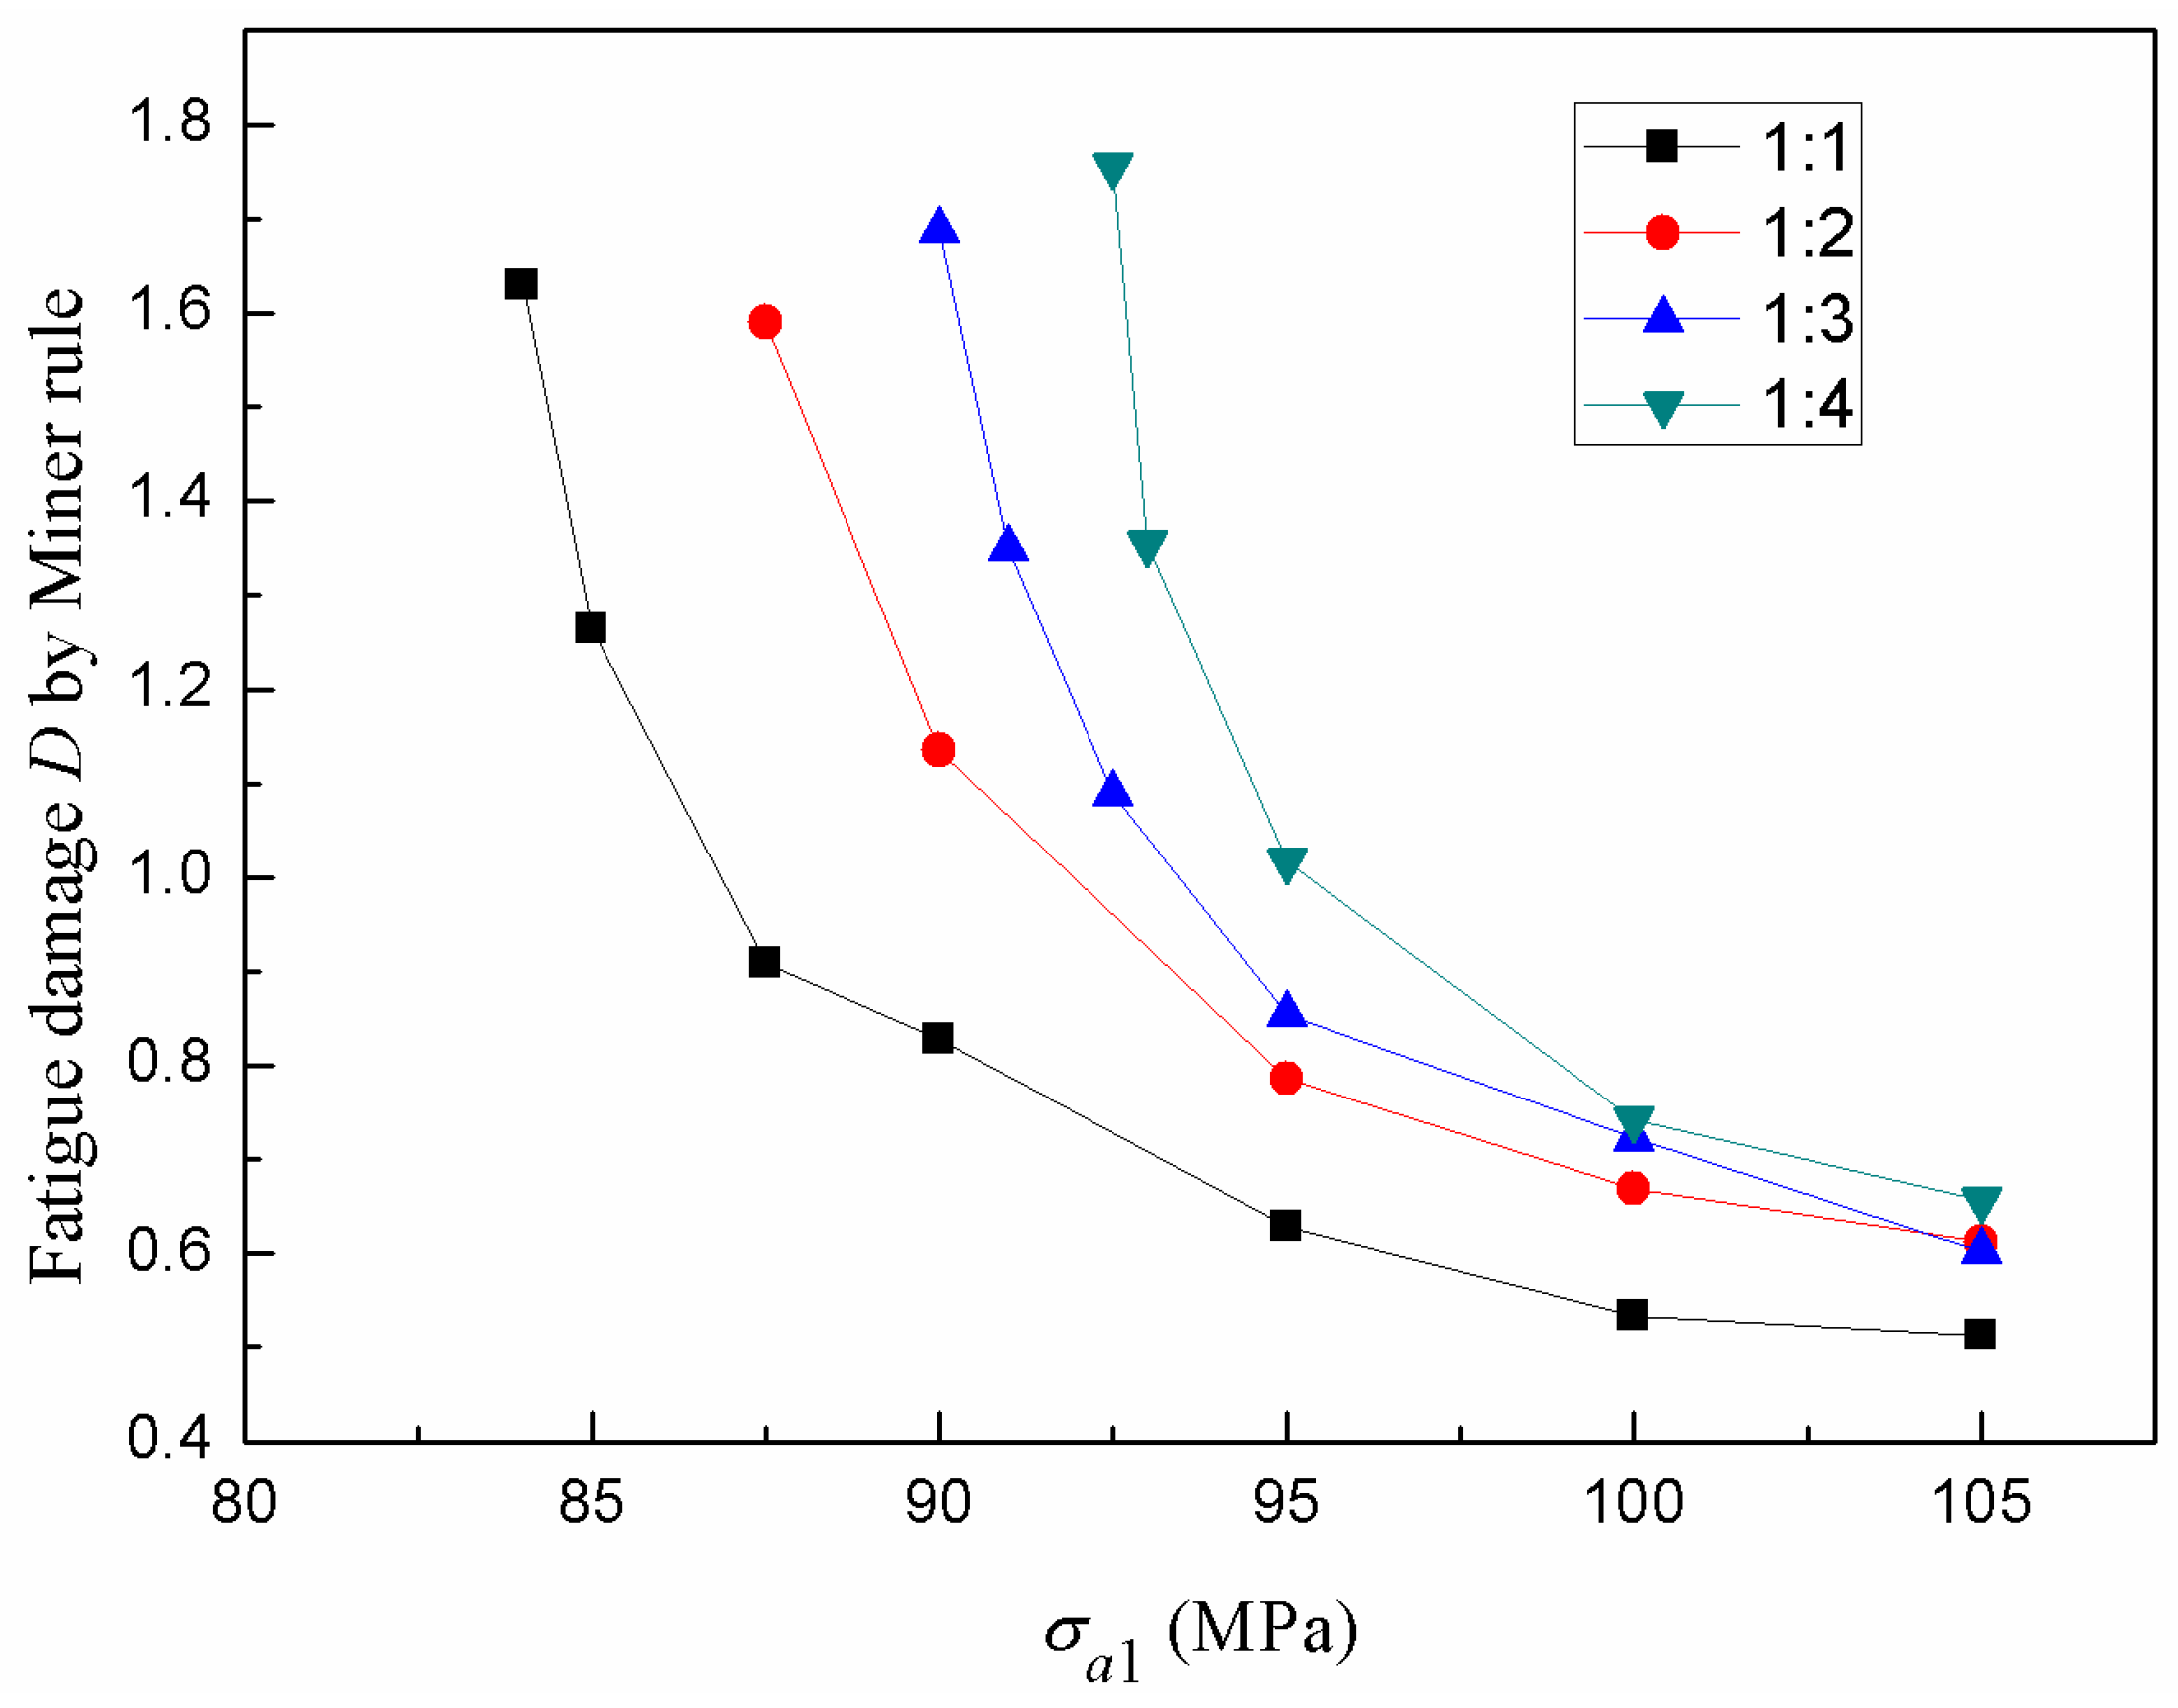
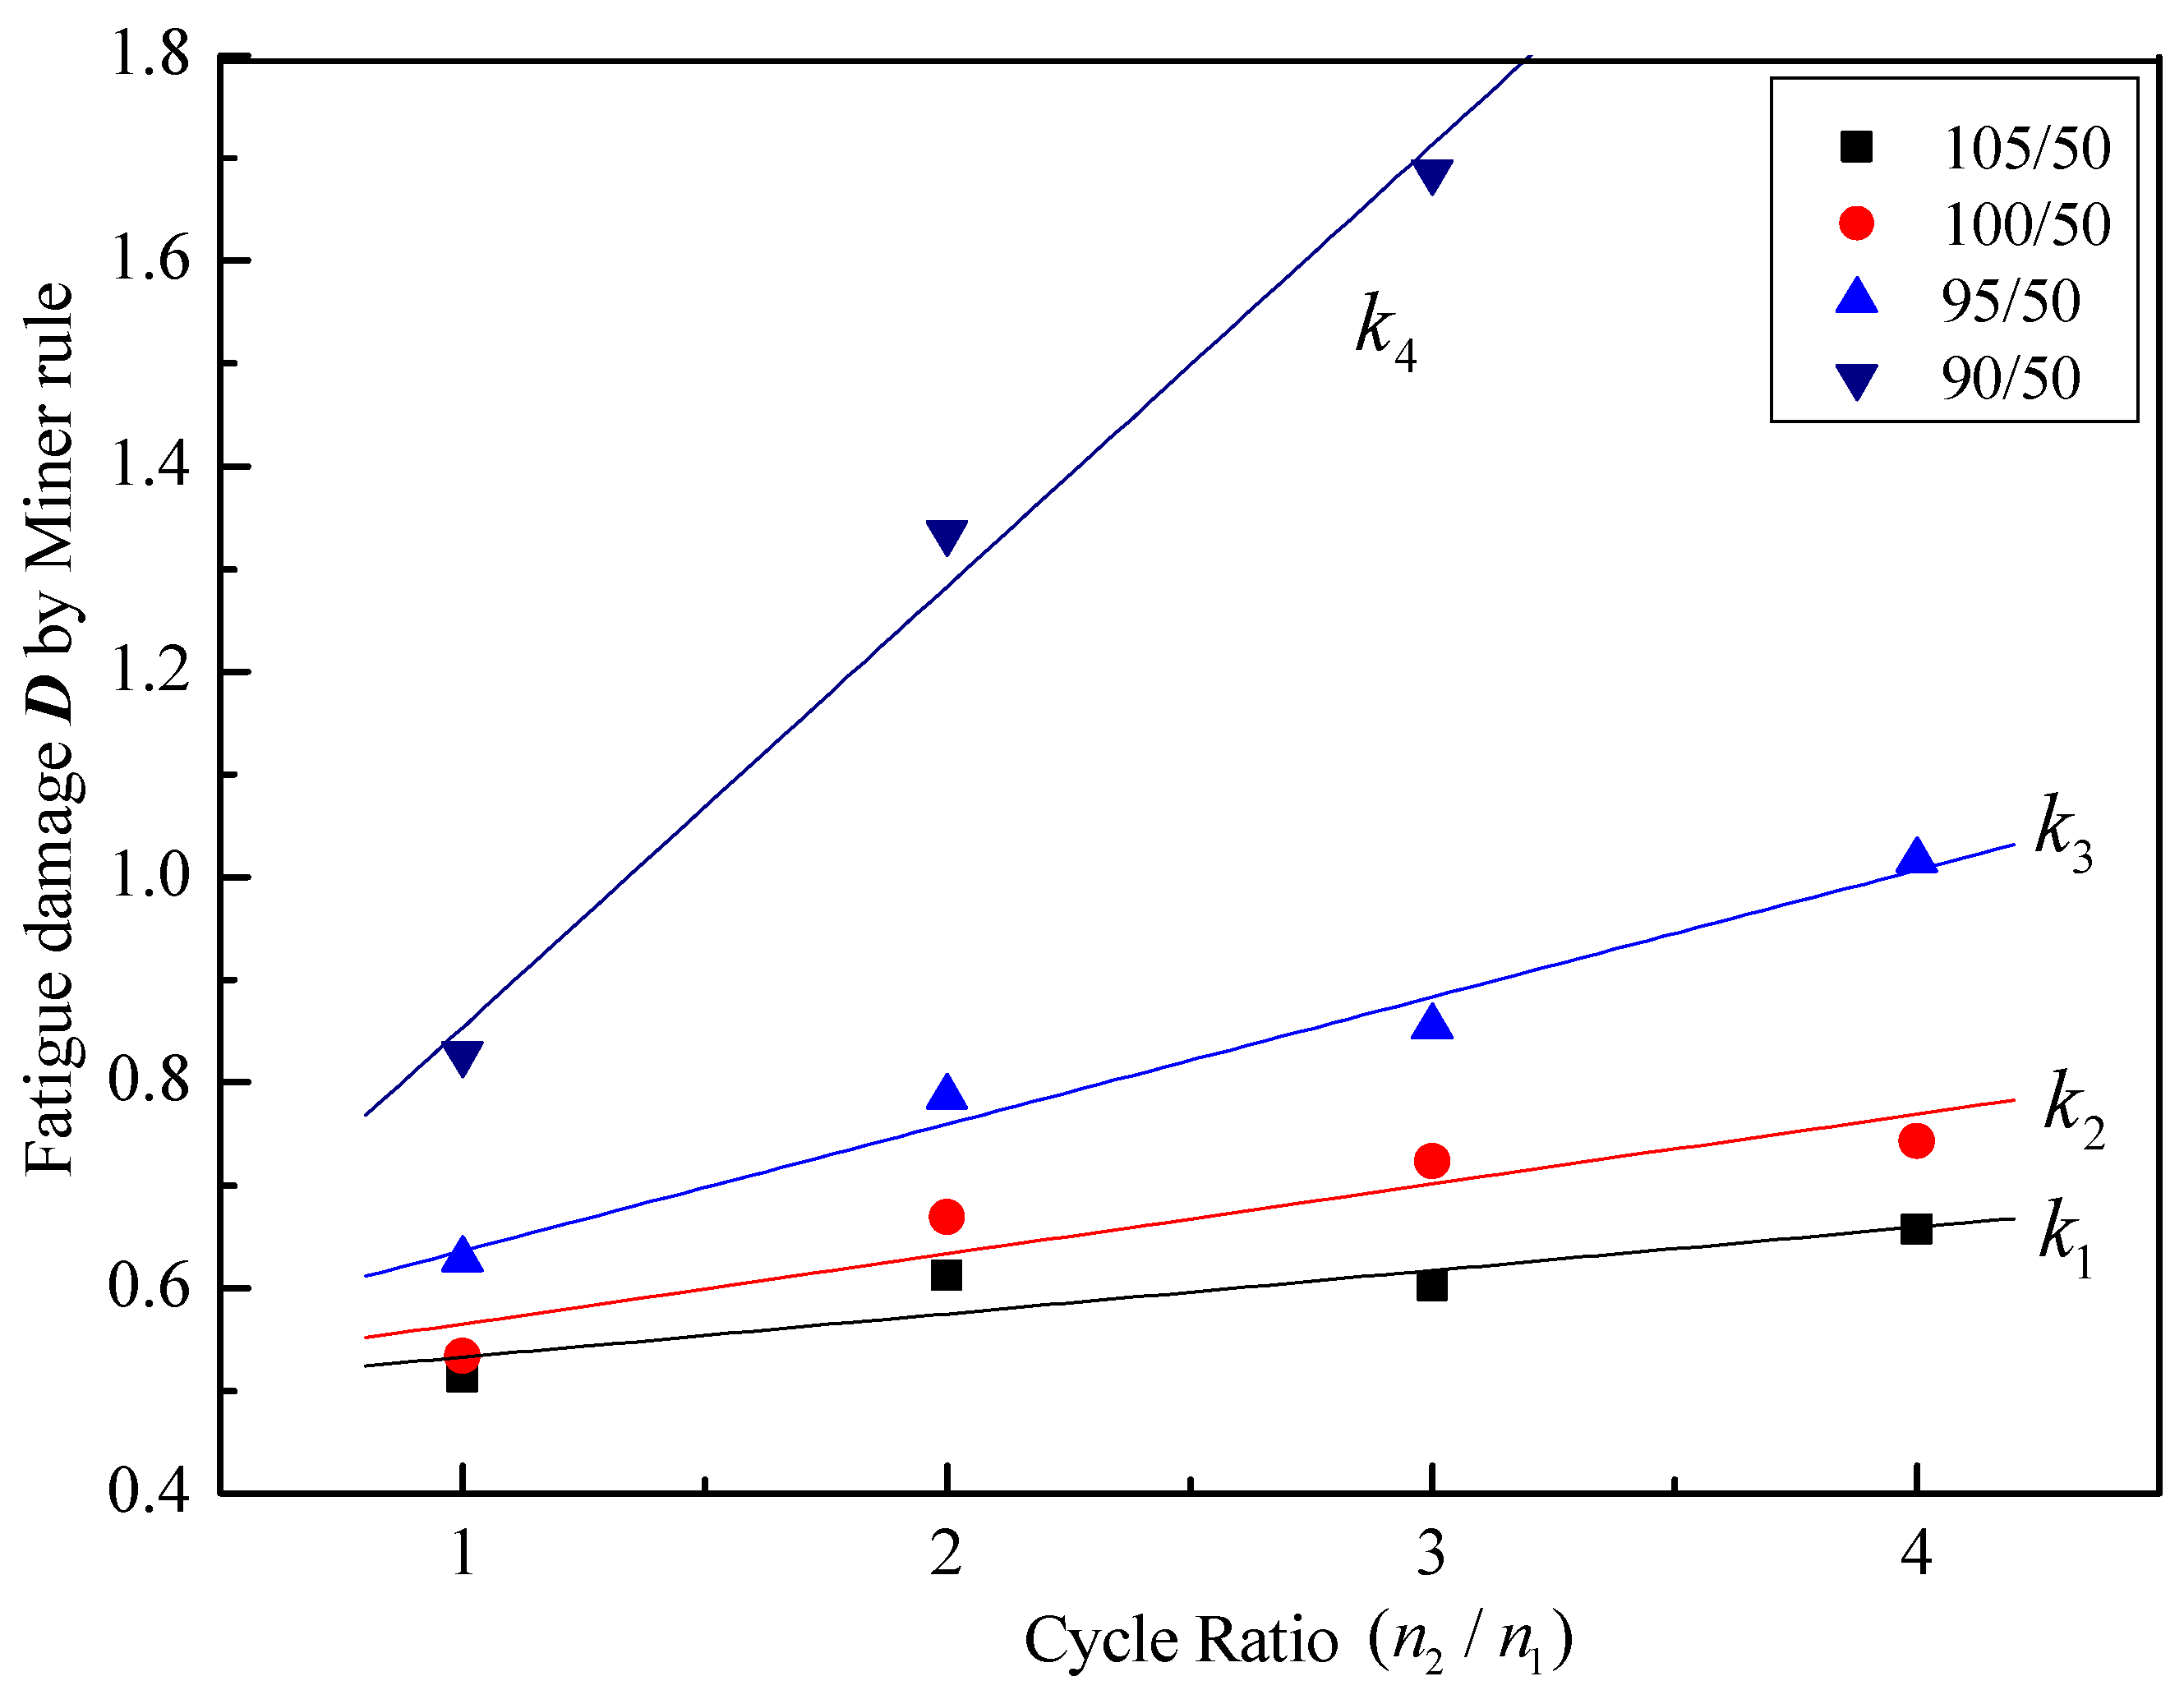
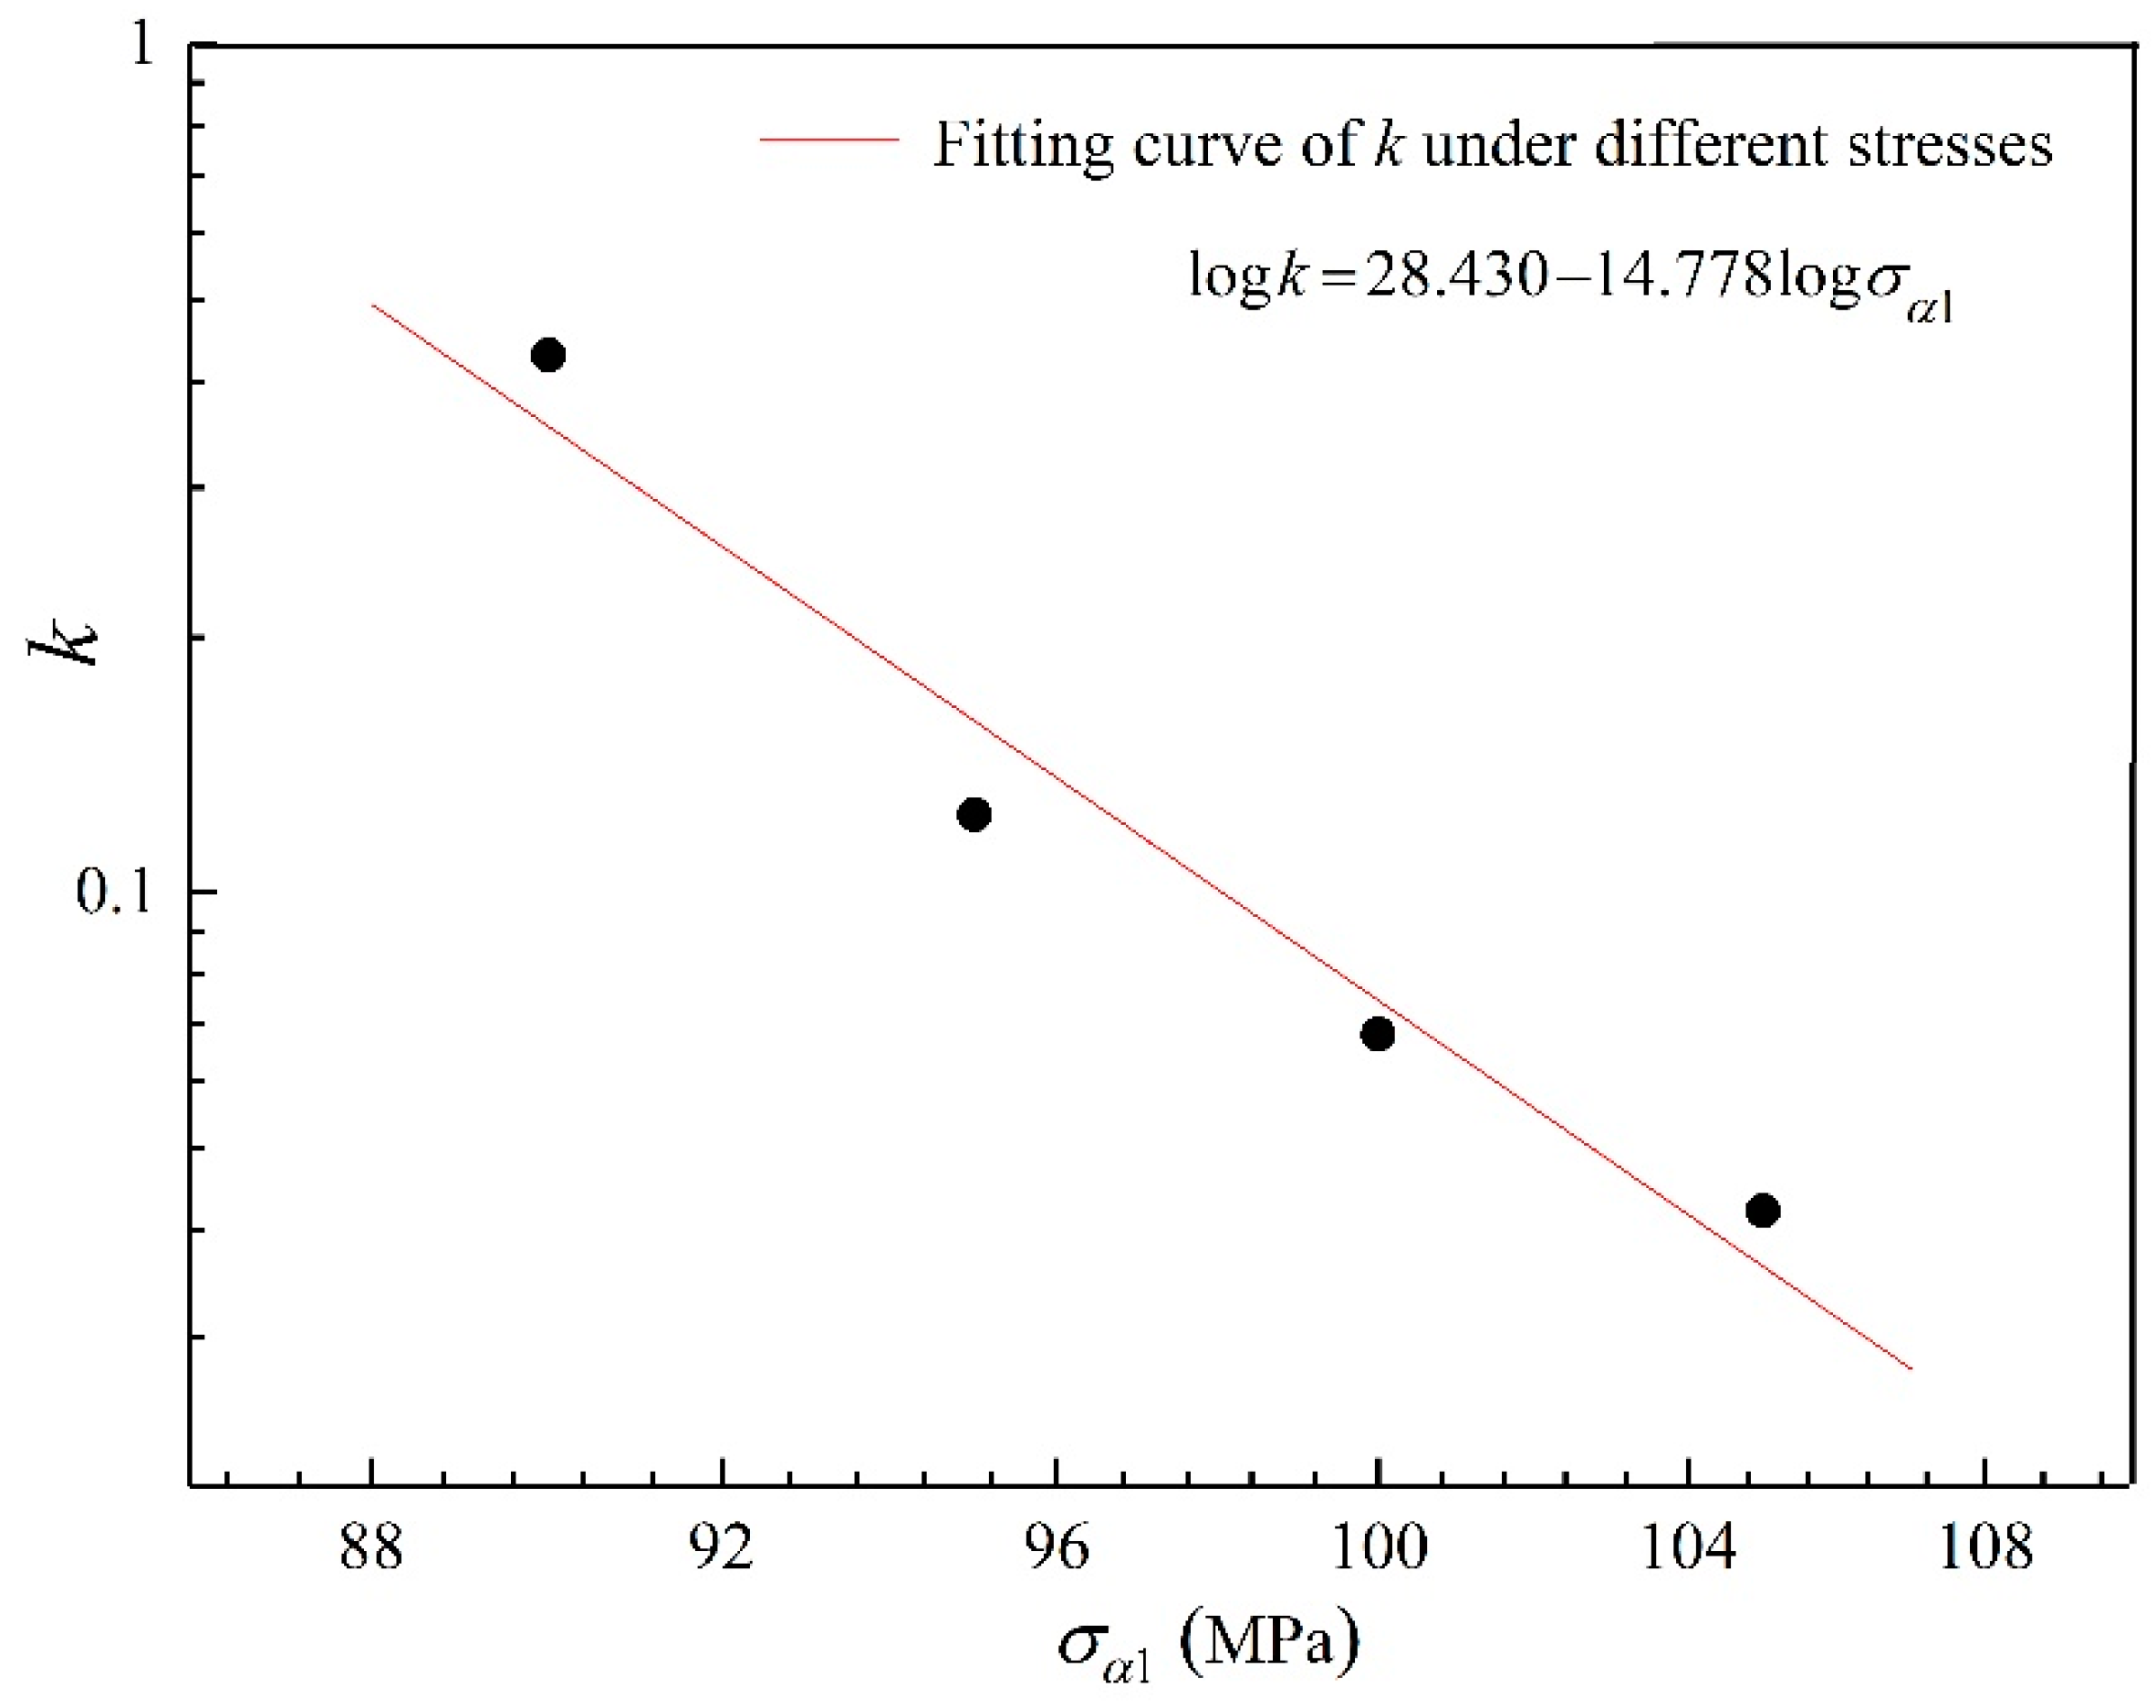
For the fatigue performance of designed T-type specimens under two-step VA load, the fatigue cumulative damage values calculated by linear Miner rule are not 1. Compared with the cumulative damage caused by high cyclic stress, the cumulative damage caused by low stress below CAFL is relatively small. It is found that the cumulative damage decreases with the increase of the high stress under the same cycle ratio. While under the same high-low load stress ratio, the cumulative fatigue damage increases with the linear increase of the cycle ratio of the low stress to the high stress, and logarithmic curve between the slope k and high stress above CAFL is linear.
(2)
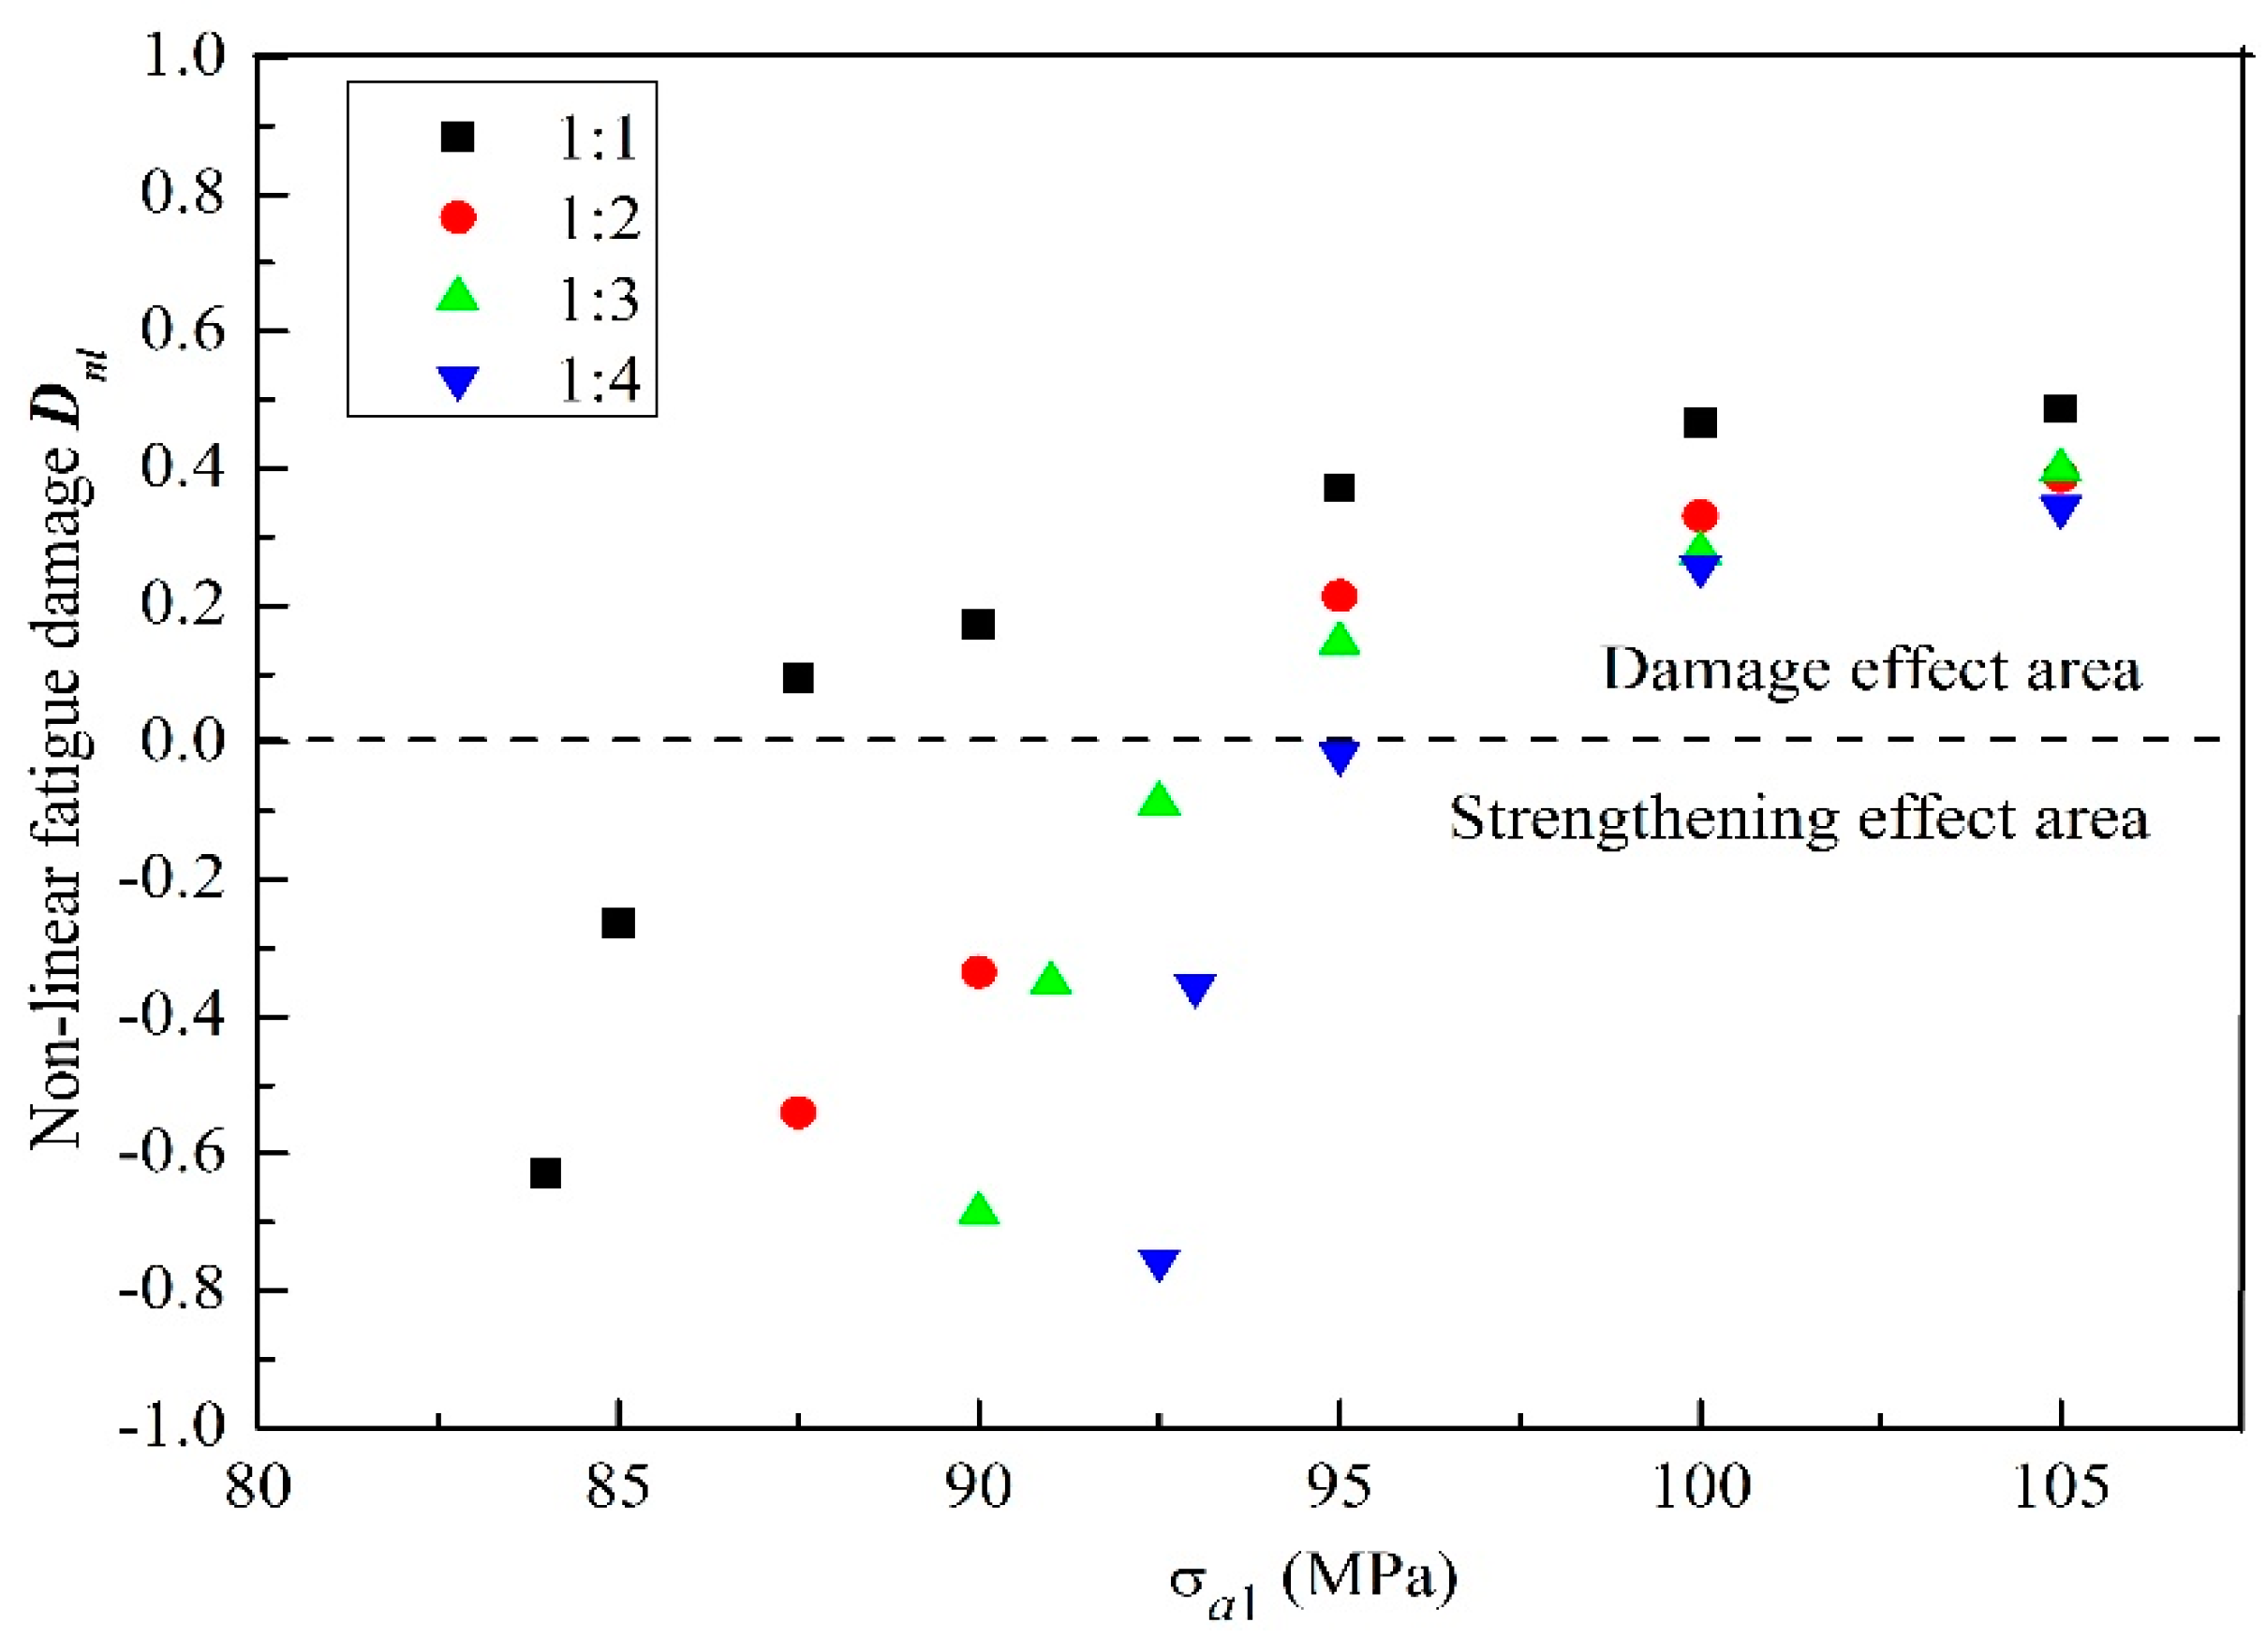
Nonlinear cumulative damage Dnl is used to evaluate the load interaction between low and high cyclic stress. It is found that the load interaction shows different damage or strengthening effects with the change of low-high load cycle ratio and high cyclic stress. The area of strengthening effect occurs at high cyclic stress and low load cycle ratio.
(3)
From Figure 11, it can be seen that the linear slope of fatigue cumulative damage with the cycle ratio n2/n1 increases with the decrease of high stress in the loading block. The slopes k3 and k4 represent the linear slope of fatigue cumulative damage with the cycle ratio n2/n1 under high-low stress of 95/50 and 90/50 MPa, respectively. The reason is that the high stress in the loading block is closer to the low stress 50 MPa, the fatigue damage caused by both the high and the low stresses is much smaller. When the cycles of low stress take a larger percentage, i.e., a larger ratio of n2/n1, the strengthening effects are more obvious. As shown in Figure 13, two of the three points at the high stress of 90 MPa are in the strengthening effect area, and only one of the four points at the high stress of 95 MPa is in the strengthening effect area. All of the four points at the high stress of 100 MPa or 105 MPa are in the damage effect area.
The method also applies to other ship types, like the ship only voyaging on the sea or ship only voyaging on the inland river. The ranges of the high and low loading levels should be set according to the actual loading on the ship. For the river-sea-going ship in this study, it mostly voyages in the inland river and then the load below the CAFL takes the most part in the loading. That’s why the chosen high cyclic loads were larger than the CAFL and the chosen low cyclic loads were below the CAFL. When the ranges of the high and low loading levels in the variable cyclic loading spectra are different, the experiments may show some different results. More investigation will be necessary.

Author Contributions

Conceptualization, J.G., D.S. and Z.W.; data curation, J.G., D.S. and H.D.; formal analysis, J.G., D.S., Z.W. and X.W.; funding acquisition, J.G., Z.W., L.Y. and W.W.; investigation, H.D.; methodology, J.G. and D.S.; project administration, J.G., Z.W. and W.W.; resources, J.G., Z.W. and W.W.; supervision, J.G. and X.W.; visualization, D.S., H.D. and X.W.; writing—original draft, J.G., D.S., Z.W. and X.W.; writing—review & editing, J.G., Z.W., X.W. and L.Y. All authors have read and agreed to the published version of the manuscript.

Funding

This research was funded by the National Natural Science Foundation of China (NSFC) (grant number 51879208), the National Scientific Research Project of the High-tech Ship of China (grant number 2014[493]) and the Fundamental Research Funds for the Central Universities (grant number 205207019).

Institutional Review Board Statement

Not applicable.

Informed Consent Statement

Not applicable.

Data Availability Statement

The data presented in this study are available in Table 3, Table 4, Table 5 and Table 6.

Acknowledgments

All the fatigue experiments were carried out via an MTS 322 250 kN Dynamic Fatigue Testing System at the Ship Structure Laboratory of Wuhan University of Technology (Wuhan, China). The authors are grateful to all the staff of School of Transportation at Wuhan University of Technology for supporting this work.

Conflicts of Interest

The authors declare no conflict of interest. The funders had no role in the design of the study; in the collection, analyses, or interpretation of data; in the writing of the manuscript, or in the decision to publish the results.

References

  1. Gan, J.; Sun, D.; Wang, Z.; Luo, P.; Wu, W. The effect of shot peening on fatigue life of Q345D T-welded joint. J. Constr. Steel Res. 2016, 126, 74–82. [Google Scholar] [CrossRef]
  2. Li, Z.; Mao, W.; Ringsberg, J.W.; Johnson, E.; Storhaug, G. A comparative study of fatigue assessments of container ship structures using various direct calculation approaches. Ocean. Eng. 2014, 82, 65–74. [Google Scholar] [CrossRef]
  3. Beretta, S.; Carboni, M. Variable amplitude fatigue crack growth in a mild steel for railway axles: Experiments and predictive models. Eng. Fract. Mech. 2011, 78, 848–862. [Google Scholar] [CrossRef]
  4. Warhadpande, A.; Jalalahmadi, B.; Slack, T.S.; Sadeghi, F. A new finite element fatigue modeling approach for life scatter in tensile steel specimens. Int. J. Fatigue 2010, 32, 685–697. [Google Scholar] [CrossRef]
  5. Sun, D.; Gan, J.; Wang, Z.; Luo, P.; Wu, W. Experimental and analytical investigation of fatigue crack propagation of T-welded joints considering the effect of boundary condition. Fatigue Fract. Eng. Mater. Struct. 2016, 40, 894–908. [Google Scholar] [CrossRef]
  6. Miner, M.A. Cumulative damage in fatigue. J. Appl. Mech. 1945, 67, A159–A164. [Google Scholar]
  7. Zhang, Y.-H.; Maddox, S. Investigation of fatigue damage to welded joints under variable amplitude loading spectra. Int. J. Fatigue 2009, 31, 138–152. [Google Scholar] [CrossRef]
  8. Stäcker, C.; Sander, M. Experimental, analytical and numerical analyses of constant and variable amplitude loadings in the very high cycle fatigue regime. Appl. Fract. Mech. 2017, 92, 394–409. [Google Scholar] [CrossRef]
  9. Tilly, G. Fatigue of land-based structures. Int. J. Fatigue 1985, 7, 67–78. [Google Scholar] [CrossRef]
  10. Dahle, T. Spectrum fatigue life of welded specimen in relation to the linear damage rule. In Fatigue Under Spectrum Loading and in Corrosive Environments; Blom, A.F., Ed.; EMAS Publishing: Birchwood Park Warrington, UK, 1993; pp. 133–147. [Google Scholar]
  11. Tubby, P.J.; Razmjoo, G.R.; Gurney, T.R.; Priddle, E.K. Fatigue of Welded Joints Under Variable Amplitude Loading, In: OTO 94 804; HSE Books: Sudbury, ON, Canada, 1996. [Google Scholar]
  12. Gurney, T.R. Exploratory Investigation of the Significance of the Low Stresses in a Fatigue Loading Spectrum; TWI Member Report 718/2000; TWI Ltd: Cambridge, UK, December 2000. [Google Scholar]
  13. Berger, C.; Eulitz, K.G.; Heuler, P.; Kotte, K.L.; Naundorf, H.; Schuetz, W.; Sonsino, C.M.; Wimmer, A.; Zenner, H. Betriebsfestigkeit in Germany—An overview. Int. J. Fatigue 2002, 24, 603–625. [Google Scholar] [CrossRef]
  14. Dattoma, V.; Giancane, S.; Nobile, R.; Panella, F. Fatigue life prediction under variable loading based on a new non-linear continuum damage mechanics model. Int. J. Fatigue 2006, 28, 89–95. [Google Scholar] [CrossRef]
  15. Fatemi, A.; Yang, L. Cumulative fatigue damage and life prediction theories: A survey of the state of the art for homogeneous materials. Int. J. Fatigue 1998, 20, 9–34. [Google Scholar] [CrossRef]
  16. Bolchoun, A.; Baumgartner, J.; Kaufmann, H. A new method for fatigue life evaluation under out-of-phase variable amplitude loadings and its application to thin-walled magnesium welds. Int. J. Fatigue 2017, 101, 159–168. [Google Scholar] [CrossRef]
  17. Marco, S.M.; Starkey, W.L. A concept of fatigue damage. Trans. ASME 1954, 76, 627–632. [Google Scholar]
  18. Hell, M.; Wagener, R.; Kaufmann, H.; Melz, T. Fatigue life design of components under variable amplitude loading with respect to cyclic material behaviour. Procedia Eng. 2015, 101, 194–202. [Google Scholar] [CrossRef]
  19. Gatts, R.R. Cumulative fatigue damage with random loading. ASME J. Basic Eng. 1962, 84, 403–409. [Google Scholar] [CrossRef]
  20. He, L.; Akebono, H.; Kato, M.; Sugeta, A. Fatigue life prediction method for AISI 316 stainless steel under variable-amplitude loading considering low-amplitude loading below the endurance limit in the ultrahigh cycle regime. Int. J. Fatigue 2017, 101, 18–26. [Google Scholar] [CrossRef]
  21. Gan, J.; Zhao, K.; Wang, Z.; Wang, X.; Wu, W. Fatigue damage of designed T-type specimen under different proportion re-peating Two-Step variable amplitude loads. Eng. Fract. Mech. 2019, 221, 106684. [Google Scholar] [CrossRef]
  22. Xi, L.; Zheng, S. Strengthening of transmission gear under low-amplitude loads. Mat. Sci. Eng. A-Struct. 2008, 488, 55–63. [Google Scholar] [CrossRef]
  23. Xi, L.; Songlin, Z. Changes in mechanical properties of vehicle components after strengthening under low-amplitude loads below the fatigue limit. Fatigue Fract. Eng. Mater. Struct. 2009, 32, 847–855. [Google Scholar] [CrossRef]
  24. Lee, C.-H.; Chang, K.-H.; Van Do, V.N. Modeling the high cycle fatigue behavior of T-joint fillet welds considering weld-induced residual stresses based on continuum damage mechanics. Eng. Struct. 2016, 125, 205–216. [Google Scholar] [CrossRef]
  25. Ciavarella, M.; D’Antuono, P.; Demelio, G. A simple finding on variable amplitude (Gassner) fatigue SN curves obtained using Miner’s rule for unnotched or notched specimen. Eng. Fract. Mech. 2017, 176, 178–185. [Google Scholar] [CrossRef]
  26. Keating, P.B.; Fisher, J.W. Evaluation of Fatigue Tests and Design Criteria on Welded Details; NCHRP Report 286; Transportation Research Board: Washington, DC, WA, USA, 1986; pp. 163–172. [Google Scholar]
  27. Keating, P.B.; Fisher, J.W. Full-scale welded details under random variable amplitude loading. In Fatigue of Welded Constructions; Maddox, S.J., Ed.; Elsevier: Brighton, UK, 1987. [Google Scholar]
  28. Dahle, T. Long-life spectrum fatigue tests of welded joints. Int. J. Fatigue 1994, 16, 392–396. [Google Scholar] [CrossRef]
  29. Marquis, G. Long Life Spectrum Fatigue Of Carbon And Stainless Steel Welds. Fatigue Fract. Eng. Mater. Struct. 1996, 19, 739–753. [Google Scholar] [CrossRef]
  30. Hobbacher, A.F. Recommendations for fatigue design of welded joints and components. In Recommendations for Fatigue Design of Welded Joints and Components; Springer Nature: London, UK, 2016. [Google Scholar]
  31. Lv, Z.; Huang, H.-Z.; Zhu, S.-P.; Gao, H.; Zuo, F. A modified nonlinear fatigue damage accumulation model. Int. J. Damage Mech. 2014, 24, 168–181. [Google Scholar] [CrossRef]
  32. Kim, M.H.; Kim, S.M.; Kim, Y.N.; Kim, S.G.; Lee, K.E.; Kim, G.R. A comparative study for the fatigue assessment of a ship structure by use of hot spot stress and structural stress approaches. Ocean. Eng. 2009, 36, 1067–1072. [Google Scholar] [CrossRef]
  33. Erny, C.; Thévenet, D.; Cognard, J.-Y.; Körner, M. Fatigue life prediction of welded ship details. Mar. Struct. 2012, 25, 13–32. [Google Scholar] [CrossRef]
  34. Li, Z.; Ringsberg, J.W.; Storhaug, G. Time-domain fatigue assessment of ship side-shell structures. Int. J. Fatigue 2013, 55, 276–290. [Google Scholar] [CrossRef]
  35. Xu, X.; Augello, R.; Yang, H. The generation and validation of a CUF-based FEA model with laser-based experiments. Mech. Adv. Mater. Struct. 2019, 1–8. [Google Scholar] [CrossRef]
  36. Xu, X.; Yang, H.; Augello, R.; Carrera, E. Optimized free-form surface modeling of point clouds from laser-based measurement. Mech. Adv. Mater. Struct. 2019, 1–9. [Google Scholar] [CrossRef]
  37. Carrera, E.; Pagani, A.; Augello, R. On the role of large cross-sectional deformations in the nonlinear analysis of composite thin-walled structures. Arch. Appl. Mech. 2020, 1–17. [Google Scholar] [CrossRef]
  38. Carrera, E.; Pagani, A.; Augello, R. Evaluation of geometrically nonlinear effects due to large cross-sectional deformations of compact and shell-like structures. Mech. Adv. Mater. Struct. 2018, 27, 1269–1277. [Google Scholar] [CrossRef]
  39. Sun, D.; Gan, J.; Wang, Z.; Wu, W.-G. Experimental study on fatigue characteristics of T-welded joint under repeating two-step load. In Proceedings of the International Offshore and Polar Engineering Conference, ISOPE-1-17-236, 27th International Ocean and Polar Engineering Conference, San Francisco, CA, USA, 25–30 June 2017. [Google Scholar]
  40. CCS. Metallic Materials—Tensile Testing. China Classification of Society; Standards Press of China: Beijing, China, 2016. [Google Scholar]
  41. Gao, X.; Gan, J.; Sun, D.; Wu, W. Experimental study on fatigue characteristics of typical welded joints of river-sea-going ship. In Proceedings of the International Offshore and Polar Engineering Conference, ISOPE-1-17-358, 27th International Ocean and Polar Engineering Conference, San Francisco, CA, USA, 25–30 June 2017. [Google Scholar]
  42. Dong, P. A structural stress definition and numerical implementation for fatigue analysis of welded joints. Int. J. Fatigue 2001, 23, 865–876. [Google Scholar] [CrossRef]
  43. BSI. BS 7608: 2014+A1: 2015 Guide to Fatigue Design and Assessment of Steel Products; British Standards Institution: London, UK, 2015. [Google Scholar]
Figure 1. Load frame of the test (a), the installation of designed T-type specimen (b). A servo-hydraulic actuator (1), a controller (2), the platform (3), grippers (4).
Jmse 09 00107 g001
Figure 2. The fractured specimen after the tensile test.
Jmse 09 00107 g002
Figure 3. (a) The specimen and its dimensions after a fatigue test; (b) the dimensions of the specimen before a fatigue test.
Jmse 09 00107 g003
Figure 4. The arrangement of strain gauge on the specimen.
Jmse 09 00107 g004
Figure 5. Tensile tests setup-Microscopy System of KEYENCE(M).
Jmse 09 00107 g005
Figure 6. The fracture surface of designed T- type specimen (a), the crack growth path (b).
Jmse 09 00107 g006
Figure 7. The loading sequence of two-step repeating test.
Jmse 09 00107 g007
Figure 8. Results of experimental data and fitting curve.
Jmse 09 00107 g008
Figure 9. Damage accumulation of every condition.
Jmse 09 00107 g009
Figure 10. Fatigue cumulative damage of designed T-type specimens under different cycle ratios.
Jmse 09 00107 g010
Figure 11. Fatigue damage of designed T-type specimens under different high cyclic stresses.
Jmse 09 00107 g011
Figure 12. Double logarithmic curve between the high stress and slope k.
Jmse 09 00107 g012
Figure 13. The calculation results of the damage value of load interaction effect Dnl.
Jmse 09 00107 g013
Table 1. Chemical compositions of Q345D steel.
Q345DElementCMnSiSPNiCrMoVCuFe
Wt.-%0.151.390.280.0030.0150.010.050.0070.0040.04Balance
Table 2. Mechanical properties of Q345D steel.
Ultimate tensile strength, σ U T S [MPa] 539
Monotonic yield strength, σ Y S [MPa] 384
Young’s modulus, E [GPa]206
Poisson’s coefficient, υ 0.26
elongation, δ [%]30.5
Table 3. Loading conditions of constant amplitude (CA) loading tests.
No.12345678910111213
σ a 1051009590858075705553504540
R0.10.10.10.10.10.10.10.10.10.10.10.10.1
Table 4. CA loading tests of designed T-type specimens.
Specimen No.σa [MPa]RAverage Cycles to FailureThree Repeated Fatigue Experiment Results
C11050.1273,187267,358270,591281,612
C21000.1413,863395,732419,934425,923
C3950.1706,895575,216719,683825,786
C4900.1896,437804,140908,442976,729
C5850.1925,7001,035,762898,867842,471
C6800.1975,620841,147914,5871,171,126
C7750.11,156,4601,400,5691,075,784993,027
C8700.11,933,9421,829,7481,656,7752,315,303
C9550.1107+107+107+107+
C10530.1107+107+107+107+
C11500.1107+107+107+107+
C12450.1107+107+107+107+
C13400.1107+107+107+107+
Table 5. Test loading conditions of the two-step repeating amplitude.
Stress (MPa)
σa1/σa2
Specimen No. under Different Load Block (n1/n2)
20,000/20,000
(1:1)
20,000/40,000
(1:2)
20,000/60,000
(1:3)
20,000/80,000
(1:4)
105/50R1R8R13R19
100/50R2R9R14R20
95/50R3R10R15R21
93/50---R22
92.5/50--R16R23
91/50--R17-
90/50R4R11R18-
87.5/50R5R12--
85/50R6---
84/50R7---
Table 6. The test results of designed T-type specimens under two-step repeating amplitude loading sequence.
Specimen No.First StepSecond Step n 1 n 2 n 1 + n 2
Nf1 (Cycle)Nf2 (Cycle)
R1293,01816,000,000147,790145,000292,790
R2383,80016,000,000200,000204,431404,431
R3509,07516,000,000310,000315,434625,434
R4689,25616,000,000547,533540,0001,087,500
R5804,79316,000,000695,000702,5731,397,573
R6945,57816,000,0001,128,6371,120,0002,248,637
R71,007,23016,000,0001,544,4891,530,0003,174,489
R8293,01816,000,000173,321320,000493,321
R9383,80016,000,000245,315480,000725,315
R10509,07516,000,000377,466720,0001,097,466
R11689,25616,000,000640,0001,276,3591,916,359
R12804,79316,000,0001,126,7102,240,0003,366,710
R13293,01816,000,000167,548480,000657,548
R14383,80016,000,000260,000723,971983,971
R15509,07516,000,000400,0001,109,6371,509,637
R16591,96116,000,000580,0001,743,4922,323,492
R17647,05516,000,000780,0002,326,4833,106,483
R18689,25616,000,0001,031,1263,060,0004,091,126
R19293,01816,000,000180,000677,563837,563
R20383,80016,000,000260,0001,042,7411,302,741
R21509,07516,000,000460,0001,811,5672,271,567
R22573,16616,000,000680,0002,705,4373,385,437
R23591,96116,000,000906,2923,600,0004,506,292
Publisher’s Note: MDPI stays neutral with regard to jurisdictional claims in published maps and institutional affiliations.

