Abstract
The unique environment of the hadal zone has created material circulation patterns and biological gene characteristics. Microbes play an irreplaceable role in the ocean ecological environment and material circulation due to their pervasiveness, abundance, and metabolic diversity. In this paper, we designed and developed a microbial sampling device that can be used in a depth of 10,000 m, with its working parts suitable for the full-sea depth. The multi-stage membrane realized the in situ multi-stage filtrations. The samples were in situ fixedly preserved by RNAlater storage solution. At the same time, we modeled and calculated the multi-stage membrane separation and filtration process, simulated the interception phenomenon of particles with different sizes passing through the multi-stage membrane area, and explored the influence of varying inlet velocities. A multi-stage membrane separation and filtration test system was built. The operational characteristics of different filters were compared and analyzed, and the appropriate filter material was selected according to the flow capacity and physical properties. A 100 MPa high-pressure test was carried out to check the device’s performance under a high-pressure environment. The sampler prototype was constructed and tested in the Mariana Trench. The results indicated that the device could work at the deepest point of the Mariana trench.
1. Introduction
The ocean is the birthplace of the earth’s life. The evolution of organisms shows that life on the planet originates from the sea. The sea covers an area of about 360 million square kilometers, accounting for 70% of the earth’s surface area, and contains rich biological and mineral resources [1]. The average depth of the oceans worldwide is about 3795 m, with a maximum depth of over 10,000 m. At present, only 5% of the ocean has been explored, and less than 0.01% has been sampled. It can be said that human exploration of the deep sea is minimal [2]. The sea area with a depth of more than 6000 m is generally called “ultra-deep sea” or “hadal zone”, accounting for only 1.2% of the total ocean area. These areas often have unique geological characteristics and biological characteristics [3,4,5]. The hadal zone features low temperature, high pressure, high salinity, and lightlessness, and its unique environmental conditions have created particular material circulation patterns and biological gene characteristics [6]. Researchers found unique biota at different hydrothermal vents [7] and bottom sediments [8] in the hadal zone. After separating and analyzing the collected samples, researchers found that microorganisms in the hadal biosphere had high diversity and often had some special functions. For example, some organisms have the solid ability to decompose oil, which is expected to solve the problem of oil leakage and pollution in the ocean [9,10]. Some microorganisms were proved to have high anti-cancer activity [11], anti-tumor activity [12] and are applied for the synthesis of chemical products [13]. Some microorganisms have essential impacts on the ocean’s geological evolution and material cycle [14,15]. Therefore, the sampling and research of hadal microorganisms help us understand the origin of marine life and benefit humanity in various scientific research fields. In order to obtain hadal microorganisms for research and analysis, it is necessary to design and develop a set of microbial in situ multi-stage filtering and preserving devices suitable for the hadal zone. There are two main working modes of the existing deep-sea microbial sampler. One is to obtain a certain amount of pressurized seawater through the sampling bottle and then transfer and cultivate microorganisms in the laboratory after recovery [16,17,18]. However, due to the relatively low content of microorganisms in seawater of great depth, and that the pressure-holding sample tube cannot be made very large, the amount of microorganisms that can be obtained in this way in a single time is very limited, and the sampling efficiency is low. The second is to filter the in situ seawater in the seabed to obtain the enriched filtrate or filter membrane sample [19,20]. This method can greatly improve the microbial biomass obtained in a single operation, but it also requires more complex action mechanisms.
The particularity of the hadal environment has caused great difficulties and challenges to the design and development of operating devices. In the hadal environment, the maximum seawater pressure can reach more than 100 MPa, accompanied by corrosion and low temperature, which puts forward special requirements for the material selection and structural design of its working parts. The development of a set of microbial sampling devices that can operate in a hadal environment can provide a reliable basis for collecting and researching hadal microorganisms. At present, some marine scientists are vigorously conducting research on deep-sea microbial sampling. McNichol et al. [21] developed a specific device to sample hydrothermal vent fluids under in situ conditions and to study microbial metabolism associated with fluid biogeochemistry. Peoples et al. [22] proposed a pressure-retaining sampler (coupled to a Lander) capable of collecting hadal seawaters under in situ conditions during recovery. Parkes et al. [23] proposed high-pressure sampler systems to study prokaryotic subseafloor sediments. Garel et al. [24] described a ready-to-use pressure-retaining sampler capable of collecting and maintaining samples under in situ pressure conditions (up to 60 MPa) during sampling and the ascent from ocean depth. In order to improve the quality of samples, it is also necessary to consider the preservation of samples after sampling. In the existing research, the pressure holding cylinder and pressure compensator are used to maintain the in situ pressure of the sample. The disadvantage of this method is that it will significantly increase the overall size and quality of the device. A relatively new and feasible way is to add a preservation solution to the filtered sample.
Therefore, we developed a set of in situ multi-stage filtering and preserving devices for hadal microorganisms apparatus for hadal depths. Given the specific working requirements, we designed working parts suitable for the deep-sea environment. We built a multi-stage membrane separation and filtration test system to choose the appropriate filter material. The 100 MPa high-pressure test proved the sampling performance of the device. Finally, the sampler prototype successfully worked at a depth of 10,895 m in the Mariana Trench.
2. Equipment Design
2.1. Structural Design
The in situ multi-stage filterings and preserving device for hadal microorganisms include filtration, preservation, and corresponding electrical and mechanical systems. The main innovation lies in designing multi-stage membrane structures and in situ fixed preservation structure to obtain enriched high-quality microbial samples. The diagraw of in situ multi-stage filtering and preserving device is shown in Figure 1. And Table 1 shows the main design indicators of the device
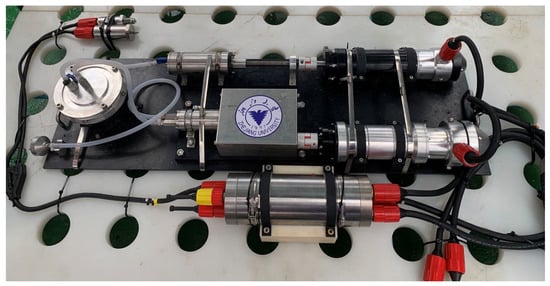
Figure 1.
The in situ multi-stage filtering and preserving device.

Table 1.
Main technical indexes of in situ multi-stage filtering and preserving device for hadal microorganisms.
In order to inject RNAlater preservation solution directly into the device after the filtering sampling operation, the corresponding structure is designed to store the solution and complete the injection operation. The in situ fixed preservation structure adopts the syringe scheme, which can easily realize the preservation solution’s inhalation, storage, and push. All parts of the in situ fixed preservation structure are made of 316 stainless steel. We applied a polytetrafluoroethylene coating to the inner wall of the syringe to improve biocompatibility. The syringe can be filled with 250 mL RNAlater solution. RNAlater preservation solution is a non-toxic tissue preservation reagent that can quickly stabilize the tissue and protect non-frozen cellular RNA. The schematic diagram is shown in Figure 2.
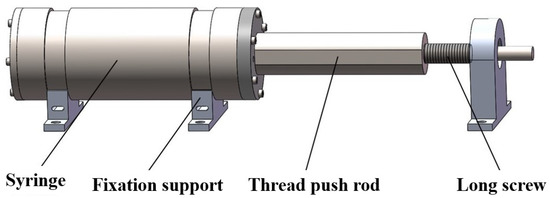
Figure 2.
Device schematic diagram of RNAlater preservation solution injector with syringe structure.
The syringe is a cylindrical structure with a movable piston installed inside, and the piston is connected with the thread push rod. There is a long thread groove in the inner side of the thread push rod and a finite orientation plane on the outer side. The long screw and the thread push rod are engaged through the thread. When the long screw is rotated or reversed, it can drive the thread push rod forward or backward to achieve suction or push action. The end of the long screw is connected with the shaft end of the deep-sea motor through the coupling. Before the whole device is put down, a specific volume of RNAlater preservation solution is pumped into the syringe. Then the syringe joint is connected to the front end of the filter pipeline through the pipeline. When the device completes the filtering action in the seabed, the deep-sea motor is started to drive the long screw rotation. The preservation solution is injected into each filter in turn through the push action of the piston. When the preservation solution is wholly immersed in the microporous filter membrane of the filter, the in situ preservation of microbial samples can be completed.
We selected the flat filter as the working part, mainly composed of the upper cover, the lower cover, and the tray supporting the filter membrane. The top and bottom of the plate filter are designed with the pagoda joint as the inlet and outlet. Before filtering, the filter membrane should be placed on the tray flatly, and the upper cover should be installed to ensure that the sealing ring presses a circle around the filter membrane. The disassembly and installation process are relatively convenient. The tray is designed with spiral grooves on one side and circular holes on the other. Its function is to support the filter membrane and prevent large physical deformation of the filter membrane in the working process. The flat filter selected in this paper is made of 316 stainless steel, which has good structural strength and excellent corrosion resistance and can be installed with a 142 mm filter membrane. The diameter of the joint is 6.35 mm, and it is designed with a one-way valve. The inner diameter of the rubber tube is 7 mm. The physical figure of the plate filter is shown in Figure 3.
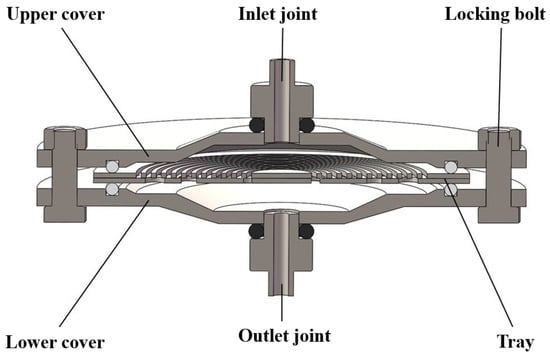
Figure 3.
The physical figure of the plate filter.
2.2. Control Cabin and Battery Pack
It is not easy to make the communication distance between the lander and the scientific research mothership. In order to accurately realize multi-stage filtration and in situ preservation in a hadal seabed environment, we developed a control cabin and battery pack that could work in a deep-sea environment.
The control cabin is used to install the integrated circuit board. Its primary function is to accurately control the start, stop and forward and reverse of two deep-sea motors through its timer. The battery pack serves two deep-sea motors and the control compartment. It adopts the pressure compensation structure. The cabin is filled with hydraulic oil, and the same pressure is maintained with the external environment through the compensator structure. Inside the battery pack, several soft-packed lithium Titanate batteries are formed in series and parallel in a particular order. The nominal capacity of the battery pack is 1012 Wh, and the battery compartment outputs 48 V DC voltage outward through the standard eight-core watertight connector. The battery cabin is 540 mm in length, 270 mm in width, 205 mm in height, and the total weight after oil charging is about 44.5 kg.
The battery pack adopts the soft-clad lithium Titanate core, which is mainly based on considering that the core can typically work under 100 MPa pressure under the oil-filled state. In order to ensure the overall stability of the underwater power system, the cutoff protection function of charge or discharge and the open circuit protection function of overcharge or over-discharge point are integrated into the core. The electrical performance indexes of the battery pack are shown in Table 2.

Table 2.
The electrical performance indexes of the battery pack.
2.3. Electrical Machine
The motor is designed in the form of a pressure compensation rotary seal. A particular space is reserved at the back end of the motor, which can be placed into the drive plate of the motor. The oil-filled motor comprises a DC brushless motor, motor fixed plate, bearing, transmission shaft, sealing ring baffle, motor end cover, motor cabin cylinder, middle cover, electronic cabin cylinder, watertight connector, plug, skin bag, tail cover, and spring pressure cover. The structure diagram of the oil-filled motor is shown in Figure 4.
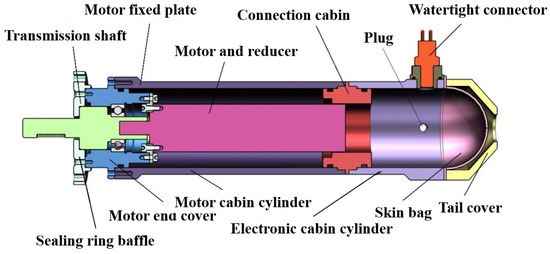
Figure 4.
Structure diagram of underwater oil filling motor.
The motor drive board of the oil-filled motor is mainly composed of a microcontroller, power module, communication module, current detection module, half-bridge drive module, and high-power MOS tube. The microcontroller is the core of the drive board. The internal penetration algorithm controls the half-bridge drive module to achieve the follow-up action according to a sure beat. At the same time, the micro-control collects the voltage signal sent by the current detection module and realizes the overload protection of the motor through internal calculation. External communication can adequately configure this overload protection value to realize real-time communication with the main control board. The main control board of the communication module can easily configure the parameters of the motor drive board, including the speed of the motor, the overload protection threshold of the motor, the positive and negative rotation and stop function of the motor.
3. Simulation Analysis
In recent years, many researchers paid attention to the microbial filtration process from the perspective of the theoretical model [25,26] and developed mathematical models of biofilter samplers to understand and improve the performance of the reactor [27]. We considered using fluid simulation to model and analyze the multi-stage membrane separation and filtration process in the sampling device.
The multi-stage membrane separation filtration process was modeled, the flat filter’s longitudinal profile was intercepted, and the cavity flow field area was drawn. The structure of the tray part is very complex. The actual modeling is simplified as a flat plate with uniform holes, and a discontinuous connected flow field characterizes the profile.
The left and right parts of the region are symmetrical, so to reduce the calculation amount of the simulation process, only half of it is intercepted in the actual modeling. The filter area is simplified to a porous medium layer of 0.4 mm thickness, close to the front of the tray. Three same flat filters connect with each other, and the pipe width is 8 mm. In the actual device, the plate filter is flat, and the gravity direction is from the inlet to the outlet, so the gravity direction in the modeling is left to right. The multi-stage membrane separation and filtration model established in Fluent software is shown in Figure 5.
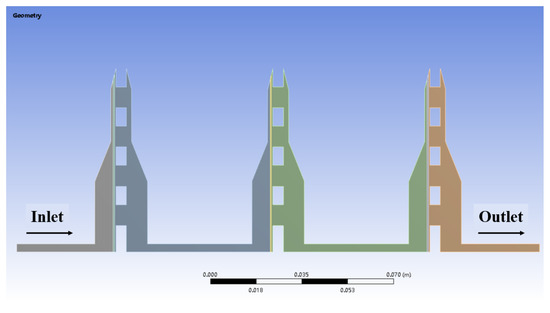
Figure 5.
Multi-stage membrane filtration model diagram.
The left boundary of the model is defined as the fluid inlet, the right boundary is defined as the fluid outlet, the lower boundary is defined as the symmetric surface, and the rest boundary is defined as the wall. The quadrilateral mesh is used for meshing, and the primary size is 0.2 mm. The turbulence and discrete phase models were opened in the solution set, and the solid particles represent the microorganisms in water. The diameter and rate of the injected particles were set. The porous media panel was opened, and the three filter membrane regions’ porosity, viscous resistance coefficient, and inertial resistance coefficient were set. The viscous resistance coefficient and inertial resistance coefficient can be obtained by experimental measurement fitting or Ergun equation. The velocity inlet and pressure outlet were set, the iteration step was 0.02 s, and the total iteration step was 500.
We used the Tecplot 360 software to post-process the simulation results. It has robust numerical simulation and CFD visualization functions and can directly read the cases and dat results files output by Fluent. In Tecplot, the flow field region is restored, i.e., mirroring the symmetric boundary. Firstly, the flow velocity cloud images inside the systems are generated for observation. Since there are only flow velocity I direction and y direction options in Tecplot, it is necessary to build a new combined flow velocity variable. When t = 5 s, the velocity contours inside the system are shown in Figure 6.
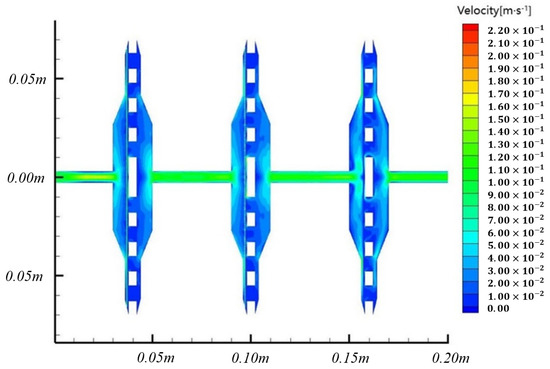
Figure 6.
Flow velocity cloud image inside the system.
In the solution set, the inlet flow velocity was set to 0.1 m/s, and the inlet diameter was 8 mm. Then, the actual flow rate was around 300 mL/min, which was within the expected flow rate range of microbial membrane filtration. It can be seen from the cloud image of the results that the flow velocity in the four sections of the pipeline is stable at 0.1 m/s and below. When passing through each filter area, the liquid flow velocity decreased to a certain extent, consistent with the actual situation. The maximum flow velocity is about 0.22 m/s, which appears at the edge of the filter, where there is a small range of sharp corners. Therefore, it can be considered that the liquid flow velocity in the system is uniform during the multi-stage membrane filtering. The diagraw of volume fraction cloud images of 4 μm particles at different times is shown in Figure 7.
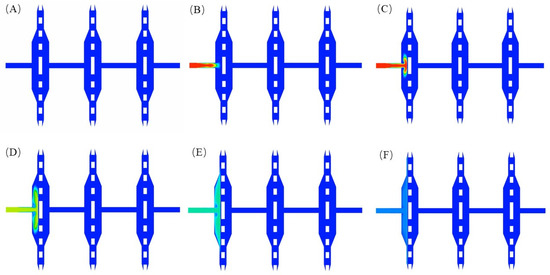
Figure 7.
Volume fraction cloud images of 4 μm particles at different times: (A) t = 0 s; (B) t = 0.5 s; (C) t = 1 s; (D) t = 1.5 s; (E) t = 2 s; (F) t = 2.5 s.
Four kinds of particles with different diameters (4 μm, 0.5 μm, 0.25 μm, and 0.08 μm) were injected into the solution set to distinguish three different filter areas. As shown in Figure 8, it can be seen that 4 μm particles were quickly blocked by the first filter membrane after injection from the inlet and began to spread to both sides. In this process, the particles are gradually uniformly distributed in the front area of the first filter membrane. When t = 2.5 s, the distribution of particles has stabilized. The final volume fraction of 4 μm particles is shown in Figure 9.
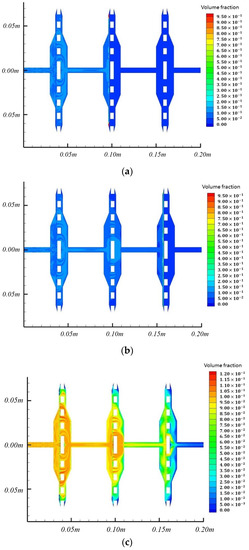
Figure 8.
The final volume fraction cloud image of 0.5 μm, 0.25 μm, and 0.08 μm particles. (a) The final volume fraction cloud image of 0.5 μm particles; (b) The final volume fraction cloud image of 0.25 μm particles; (c) The final volume fraction cloud image of 0.08 μm particles.
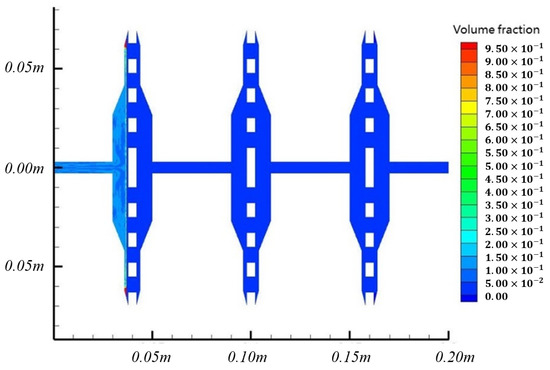
Figure 9.
Four-micrometer particle final volume fraction cloud image.
As shown in Figure 8, the 4 μm particles were finally wholly blocked on the left side of the first filter membrane, which simulated the situation that large-scale microorganisms were first intercepted. After the system reached a stable state, most of the 4 μm particles gathered on the surface and edge of the filter membrane, and only a small part was still dispersed in the area ahead of the filter membrane. The volume fraction of particles on the filter surface is about 30%, and the edge position is more than 95%. This result shows that when large-size particles cannot pass through the filter membrane, they are more likely to gather in the area at the edge of the filter membrane.
For comparison, the final volume fractions of 0.5 μm, 0.25 μm, and 0.08 μm particles are also recorded, as shown in Figure 8a–c. The 0.5 μm particles did not immediately pass when contacting the first filter membrane but first diffused in the area ahead of the filter membrane. The diffusion characteristics were similar to those of 4 μm particles. When the particles reach a certain volume fraction in a limited area, they gradually pass through the first filter membrane and continue to spread backward until the second filter membrane blocks them. Finally, they also tend to gather in the edge area of the second filter membrane. The particles of 0.25 μm and 0.08 μm also showed a similar diffusion pattern. The particles of 0.25 μm passed through the first and second filters and eventually gathered in the edge area of the third filter. The particles of 0.08 μm passed through all three filters.
From the above results, it can be concluded that in the multi-stage membrane separation filtration model, the pore size of each filter membrane is different, and the particles with different diameters show different motion laws when passing through the system. For particles intercepted by a specific filter membrane they will eventually aggregate and distribute on the surface of the filter membrane, especially at the edge position. Particles of a size small enough will not be intercepted entirely by any filter membrane.
4. Experiment
4.1. Laboratory Experiment
The central part of the multi-stage membrane separation filtration test system is three tandem flat filters, and a quantitative pump is used as the power source. In this paper, the DIPump550 intelligent peristaltic pump produced by the Kamoer company is used. The speed range is 0.1–550 r/min, and the maximum output flow rate is 550 mL/min. The maximum output pressure is 0.2 MPa, which supports the function of forwarding and reverse rotation and step-less speed regulation. It has three working modes: automatic cycle, semi-automatic cycle, and manual cycle. It is very suitable for membrane separation and filtration processes. Pressure transmitters are installed on both sides of each plate filter to record the real-time pressure in the pipeline. We used a PCM300 pressure transmitter, and the range was 0–0.16 MPa, the accuracy level was 0.5%, the output was 4–20 mA current signal. Four pressure transmitters were connected to the interface of the data acquisition board in turn, and real-time data were recorded through upper machine software. A flowmeter was set at the end of the pipeline system to observe and record real-time flow. Since the intelligent peristaltic pump used in this paper had the flow digital display function, the external flowmeter was only used as a reference. The connection and assembly of the test system were carried out on the workbench, and the physical diagram is shown in Figure 10.
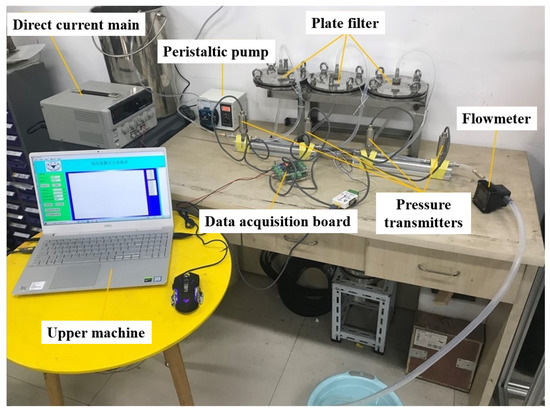
Figure 10.
Material diagram of multi-stage membrane separation and filtering test system.
We tested four kinds of filter membranes of mixed cellulose ester, glass fiber, polypropylene, and polycarbonate to explore the flow velocity–pressure drop characteristics in the working process. The pore size of the filter membrane was 3 μm, 0.2 μm, and 0.1 μm, and the effective diameter was 142 mm. By changing the output flow rate of the peristaltic pump, the pressure data of four pressure transmitters in a period were recorded. After processing, the average pressure drop of each filter membrane was obtained, and the approximate relationship between pressure drop and flow velocity was obtained. The flow velocity–pressure drop curves of four kinds of filters is shown in Figure 11. And the flow velocity–pressure drop of four kinds of filter membranes is shown in Table 3.
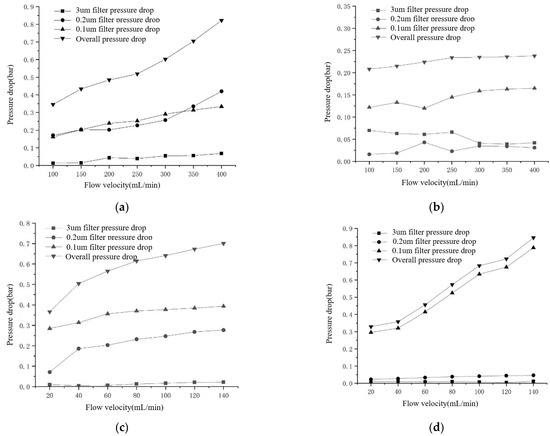
Figure 11.
Flow velocity–pressure drop curves of four kinds of filters. (a) Flow velocity–pressure drop curve of mixed cellulose ester filter membrane (b) Flow velocity–pressure drop curve of glass fiber filter membrane (c) Flow velocity–pressure drop curve of the polypropylene filter membrane (d) Flow velocity–pressure drop curve of the polycarbonate filter membrane.

Table 3.
Flow velocity–pressure drop of four kinds of filter membranes.
In terms of the filter membrane itself after filtration, the surface of the glass fiber filter membrane is flocculent, and it is difficult to altogether remove it from the filter tray, which causes significant difficulties for subsequent sample treatment. The other three materials can maintain a smooth surface, especially polycarbonate filter membrane almost entirely transparent. Therefore, we believe that the mixed cellulose ester filter membrane and polycarbonate filter membrane are more suitable for application in the sampling device.
4.2. High-Pressure Test
In order to check the device’s performance under a high-pressure environment, a 100 MPa high-pressure test was carried out on the whole in situ multi-stage filtering and preserving device of hadal microorganisms, including the control chamber and battery pack. The pressurization rate of the pressurization system is 2 MPa per minute, which is pressurized to 100 MPa.
The sampling device works by way of timing, and the test device usually runs. The in situ multi-stage filtering and preserving device of hadal microorganisms can operate normally under a 100 MPa high-pressure environment, which indicates that the device can be used in a depth of 10,000 m. Figure 12 shows the site diagram of deployment of high-pressure test.
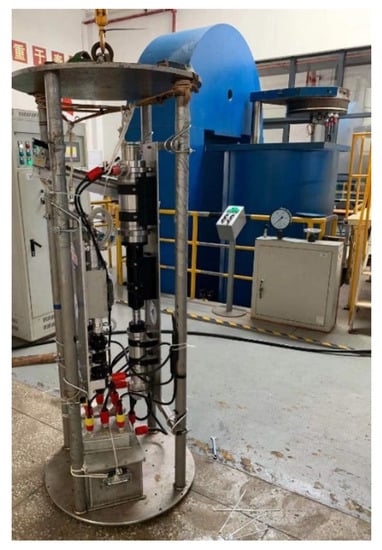
Figure 12.
Deployment of high-pressure test.
4.3. Sea Trail
The in situ multi-stage filtering and preserving device for hadal microorganisms was tested for sea trials during Cruise TS21-1 from 11 August 2021 to 8 October 2021. The sea trial was conducted at one station in the western Philippine Basin (129°44.1004′ E, 16°57.0195′ N, 7745 m) and two stations in the Mariana Trench (142°12.088′ E, 11°19.849′ N, 10,895 m; 142°33.401′ E, 11°21.4619′ N, 10,892 m), as shown in Figure 13.
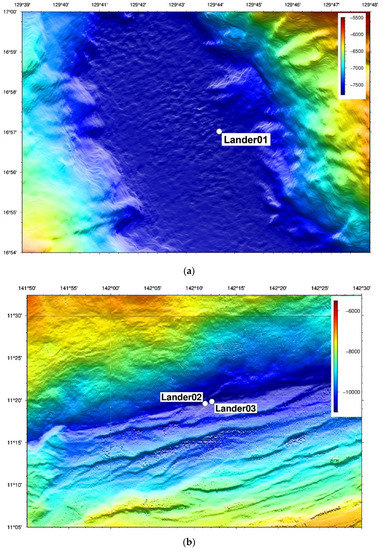
Figure 13.
Sea trail stations. (a) one station in the western Philippine Basin (b) two stations in the Mariana Trench.
The field equipment diagram of sea trial as shown in Figure 14 and the sea trial results as shown in Table 4.The in situ multi-stage filtering and preserving device of hadal microorganisms was operated on the seabed for 13 h, and nine samples with different pore sizes were obtained. For the decontamination process, we filled the device with sterile water before starting the motor. A check valve was installed at one end of the device. The check valve needed a certain pressure to open. There was no medium exchange between the sterile water inside the device and the external seawater. The device filtered a total of 30 L of in situ seawater, and membranes with pore sizes of 3 μm, 0.2 μm, and 0.1 μm were preserved. The samples were stored in −80 °C cold storage. The success of the sea trial verified that the device is capable of working at full-ocean depth, which is expected to provide the necessary support for the establishment of a hadal microbial gene pool.
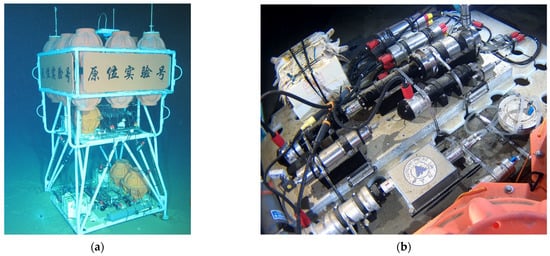
Figure 14.
Field equipment diagram of sea trial. (a) Sea trial overall equipment diagram (b) The in situ multi-stage filtering and preserving device scene diagram.

Table 4.
Sea trial results.
5. Conclusions
In this paper, we designed a hadal microbial in situ multi-stage filtering and preserving device for the full-sea depth. Given the actual work requirements, we designed and developed the working parts such as plate filter, deep-sea motor, control cabin, and battery pack. Aiming at the multi-stage membrane separation and filtration process involved in the device’s work, we considered using fluid simulation to model and analyze the multi-stage membrane separation and filtration process in the sampling device. The influence of different filter materials on the separation and filtration process was tested and analyzed by experiments, and the filter material suitable for seawater microbial sampling was selected. A high-pressure test system was used to check the performance of the device under a high-pressure environment. The in situ multi-stage filtering and preserving device for hadal microorganisms was tested for sea trials during Cruise TS21-1 in 2021. The device was installed on a hadal lander and worked at a depth of 10,895 m in the Mariana Trench.
Author Contributions
Conceptualization, D.R. and J.C.; methodology, D.R.; software, X.P.; validation, D.R., H.W. and X.P.; formal analysis, H.W.; investigation, P.Z.; resources, P.Z.; data curation, D.R.; writing—original draft preparation, D.R.; writing—review and editing, J.C.; visualization, W.H.; supervision, J.C.; project administration, X.P.; funding acquisition, J.C. All authors have read and agreed to the published version of the manuscript.
Funding
The study based on the project named “Research on cutting-edge technology systems for exploration, acquisition, and exploitation of abyssal biological resources”, which is derived from the “National Key R&D Program of China (Grant No SQ2018YFC0310601) supported by the Ministry of Science and Technology of the People’s Republic of China. Additionally, the Strategic Priority Research Program of the Chinese Academy of Science (XDA22000000), National Key Research and Development Plan for China (2016YFC0300800,2017YFC006500), the 2020 Research Program of Sanya Yazhou Bay Science and Technology Citythe Key Program of Sanya Yazhouwan Technology City (SKJC-2021-01-001), Finance Science and Technology Project of Hainan Province (ZDKJ202019), the Institution of Deep Sea Technology Innovation, Chinese Academy of Science.
Institutional Review Board Statement
Not applicable.
Informed Consent Statement
Not applicable.
Acknowledgments
We are grateful to the pilots, the captain, and crews of the R/V Tansuoyihao with lander Yuanweishiyanhao for their professional service during the cruises.
Conflicts of Interest
The authors declare no conflict of interest.
References
- Ramirez-Llodra, E.; Brandt, A.; Danovaro, R.; De Mol, B.; Escobar, E.; German, C.R.; Levin, L.A.; Arbizu, P.M.; Menot, L.; Buhj-Mortensen, P. Deep, diverse and definitely different: Unique attributes of the world’s largest ecosystem. Biogeosciences 2010, 7, 2851–2899. [Google Scholar] [CrossRef]
- Grassle, J.F.; Maciolek, N.J. Deep-Sea Species Richness: Regional and Local Diversity Estimates from Quantitative Bottom Samples. Am. Nat. 1992, 139, 313–341. [Google Scholar] [CrossRef]
- Leon-Zayas, R.; Novotny, M.; Podell, S.; Shepard, C.M.; Berkenpas, E.; Nikolenko, S.; Pevzner, P.; Lasken, R.S.; Bartlett, D.H. Single cells within the Puerto Ricotrench suggest hadal adaptation of microbial lineages. Appl. Environ. Microbiol. 2015, 81, 8265–8276. [Google Scholar] [CrossRef][Green Version]
- León-Zayas, R.; Peoples, L.; Biddle, J.F.; Podell, S.; Novotny, M.; Cameron, J.; Lasken, R.S.; Bartlett, D.H. The metabolic potential of the single cell genomes obtainedfrom the Challenger Deep, Mariana Trench within the candidate superphylum Parcubacteria (OD1). Envion. Microbiol. 2017, 19, 2769–2784. [Google Scholar] [CrossRef]
- Smith, A.B.; Stockley, B. The geological history of deep-sea colonization by echinoids: Roles of surface productivity and deep-water ventilation. Proc. R. Soc. B Biol. Sci. 2005, 272, 865–869. [Google Scholar] [CrossRef] [PubMed]
- Gage, J.; Tyler, P. Deep-Sea Biology: A Natural History of Organisms at the Deep-Sea Floor. J. Anim. Ecol. 1992, 61, 527–528. [Google Scholar]
- Brown, C.; Hodgson, A. The Ecology of Deep-Sea Hydrothermal Vents. Afr. Zool. 2001, 36, 119–120. [Google Scholar] [CrossRef]
- Corliss, B.H. Microhabitats of benthic foraminifera within deep-sea sediments. Nature 1985, 314, 435–438. [Google Scholar] [CrossRef]
- Mason, O.U.; Scott, N.M.; Gonzalez, A.; Robbins-Pianka, A.; Baelum, J.; Kimrel, J.; Bouskill, N.J.; Prestat, E.; Borglin, S.; Joyner, D.C.; et al. Metagenomics reveals sediment microbial community response to Deepwater Horizon oil spill. ISME J. 2014, 8, 1464–1475. [Google Scholar] [CrossRef]
- Lu, Z.M.; Deng, Y.; Nostrand, J.V.; He, Z.; Voordeckers, J.; Zhou, A.; Lee, Y.-J.; Mason, O.U.; Dubonsky, E.A.; Chavarria, K.L.; et al. Microbial gene functions enriched in the Deepwater Horizon deep-sea oil plume. ISME J. 2012, 6, 451–460. [Google Scholar] [CrossRef] [PubMed]
- Feling, R.H.; Buchanan, G.O.; Mincer, T.J.; Kauffman, C.A.; Jensen, P.R.; Fenical, W. Salinosporamide A: A Highly Cytotoxic Proteasome Inhibitor from a Novel Microbial Source, a Marine Bacterium of the New Genus Salinospora. Angew. Chem. Int. Ed. 2010, 42, 355–357. [Google Scholar] [CrossRef]
- Andrianasolo, E.; Lutz, R.; Falkowski, P. Deep-Sea Hydrothermal Vents as a New Source of Drug Discovery. Stud. Nat. Prod. Chem. 2012, 36, 43–66. [Google Scholar]
- Haefner, B. Drugs from the deep: Marine natural products as drug candidates. Drug Discov. Today 2003, 8, 536–544. [Google Scholar] [CrossRef]
- Emerson, D.; Fleming, E.J.; Mcbeth, J.M. Iron-oxidizing bacteria: An environmental and genomic perspective. Annu. Rev. Microbiol. 2010, 64, 561. [Google Scholar]
- Huang, J.-M.; Baker, B.J.; Li, J.-T.; Wang, Y. New microbial lineages capable of carbon fixation and nutrient cycling in deep-sea sediments of the northern South China Sea. Appl. Environ. Microbiol. 2019, 85, e00523-19. [Google Scholar] [CrossRef]
- Cario, A.; Oliver, G.C.; Rogers, K.L. Exploring the deep marine biosphere: Challenges, innovations, and opportunities. Front. Earth Sci. 2019, 7, 225. [Google Scholar] [CrossRef]
- Tamburini, C. Life Under Pressure. Deep-Sea Microbial Ecology. Life as We Know It. Cellular Origin and Life in Extreme Habitats and Astrobiology; Springer: Berlin/Heidelberg, Germany, 2006; pp. 1–17. [Google Scholar]
- Tamburini, C.; Boutrif, M.; Garel, M.; Colwell, R.R.; Deming, J.W. Prokaryotic responses to hydrostatic pressure in the ocean—A review. Environ. Microbiol. 2013, 15, 1262–1274. [Google Scholar] [CrossRef]
- Teague, J.; Scott, T.B.; Sharma, S.; Graham, G.; Allen, M.J. An alternative method to Niskin sampling for molecular analysis of the marine environment. J. Mar. Sci. Eng. 2017, 5, 22. [Google Scholar] [CrossRef]
- Wang, Y.; Gao, Z.M.; Li, J.; He, L.-S.; Cui, G.-J.; Li, W.-L.; Chen, J.; Xin, Y.-Z.; Cai, D.-S.; Zhang, A.-Q. Hadal water sampling by in situ microbial filtration and fixation (ISMIFF) apparatus. Deep. Sea Res. Part I Oceanogr. Res. Pap. 2019, 144, 132–137. [Google Scholar] [CrossRef]
- McNichol, J.; Sylva, S.P.; Thomas, F.; Taylor, C.D.; Sievert, S.M.; Seewald, J.S. Assessing microbial processes in deep-sea hydrothermal systems by incubation at in situ temperature and pressure. Deep. Sea Res. Part I Oceanogr. Res. Pap. 2016, 115, 221–232. [Google Scholar] [CrossRef]
- Peoples, L.M.; Norenberg, M.; Price, D.; McGoldrick, M.; Novotny, M.; Bochdansky, A.; Bartlett, D.H. A full-ocean-depth rated modular lander and pressure-retaining sampler capable of collecting hadal-endemic microbes under in situ conditions. Deep. Sea Res. Part I Oceanogr. Res. Pap. 2019, 143, 50–57. [Google Scholar] [CrossRef]
- Parkes, R.J.; Sellek, G.; Webster, G.; Martin, D.; Anders, E.; Weightman, A.J.; Sass, H. Culturable prokaryotic diversity of deep, gas hydrate sediments: First use of a continuous high-pressure, anaerobic, enrichment and isolation system for subseafloor sediments (DeepIsoBUG). Environ. Microbiol. 2009, 11, 3140–3153. [Google Scholar] [CrossRef]
- Garel, M.; Bonin, P.; Martini, S.; Guasco, S.; Roumagnac, M.; Bhairy, N.; Armougom, F.; Tamburini, C. Pressure-Retaining Sampler and High-Pressure Systems to Study Deep-Sea Microbes Under in situ Conditions. Front. Microbiol. 2019, 10, 453. [Google Scholar] [CrossRef]
- Ottengraf, S.P.P.; van den Oever, A.H.C. Kinetics of organic compound removal from waste gases with a biological filter. Biotechnol. Bioeng. 1983, 25, 3089–3102. [Google Scholar] [CrossRef] [PubMed]
- Viotti, P.; Eramo, B.; Boni, M.R.; Carucci, A.; Leccese, M.; Sbaffoni, S. Development and calibration of a mathematical model for the simulation of the biofiltration process. Adv. Environ. Res. 2002, 7, 11–33. [Google Scholar] [CrossRef]
- Sami, S.; Rahimi, A. Non-isothermal modelling of H2S removal in a biofilter. Environ. Technol. 2011, 32, 373–381. [Google Scholar] [CrossRef] [PubMed]
Publisher’s Note: MDPI stays neutral with regard to jurisdictional claims in published maps and institutional affiliations. |
© 2021 by the authors. Licensee MDPI, Basel, Switzerland. This article is an open access article distributed under the terms and conditions of the Creative Commons Attribution (CC BY) license (https://creativecommons.org/licenses/by/4.0/).