Abstract
To reduce the risk of collision in territorial sea areas, including trade ports and entry waterways, and to enhance the safety and efficiency of ship passage, the International Maritime Organization requires the governing body of every country to establish and operate a vessel traffic service (VTS). However, previous studies on risk prediction models did not consider the locations of near collisions and actual collisions and only employed a combined collision risk index in surveillance sea areas. In this study, we propose a regional collision risk prediction system for a collision area considering spatial patterns using a density-based spatial clustering of applications with noise (DBSCAN). Furthermore, a fuzzy inference system based on a near collision (FIS-NC) and long short-term memory (LSTM) is adopted to help a vessel traffic service operator (VTSO) make timely optimal decisions. In the local spatial pattern stage, the ship trajectory was determined by identifying the actual-collision and near-collision locations simultaneously. Finally, the system was developed by learning a sequence dataset from the extracted trajectory of the ship when a collision occurred. The proposed system can recommend an action faster than the fuzzy inference system based on the near-collision location. Therefore, using the developed system, a VTSO can quickly predict ship collision risk situations and make timely optimal decisions at dangerous surveillance sea areas.
1. Introduction
Collisions at sea with a sailing or anchored ship adversely affect the ship structure or damage the ship hull. The risk of ship damage from a collision is very high. In addition to adversely affecting the hull structure, collisions may result in fatalities, property damage, and environmental pollution from oil spills. The Korean Maritime Safety Tribunal [1] reported that 1238 collision accidents have occurred in the past five years, 1095 (approximately 88%) of which occurred in territorial sea areas, including trade ports and entry waterways [1]. To reduce the risk of collision in these territorial sea areas and to enhance the safety and efficiency of ship passage, the International Maritime Organization requires the governing body of every country to establish and operate a vessel traffic service (VTS) [2].
A VTS is operated by a vessel traffic service operator (VTSO) who predicts ship traffic conditions based on various marine data and coordinates sea traffic information in the monitoring area by providing ship operators with processed and effective sea traffic safety information [2]. In particular, the VTSO may advise, instruct, or exercise authority to movements according to a traffic organizational service (TOS) [3]. The VTSO needs tools to help them identify the risk of collision between vessels. Therefore, the data-based navigation pattern analysis and the collision risk assessment of ships are considered to be crucial for control tasks to ensure an accurate situation assessment during the decision-making process by a VTSO. There have been numerous studies on various strategies to enable a VTSO to make optimal decisions within the monitoring area, as presented in Table A1 [4,5,6,7,8,9,10,11,12].
Existing studies largely classify ship prediction models as regional ship trajectory prediction models [6,9,11,12] and regional ship collision risk index prediction models [4,5,7,8,10], which are based on automatic identification system (AIS) maritime traffic data. Regional ship trajectory prediction models determine ship trajectories from ship-dense hotspots and learn these trajectories using neural networks; the learned models are then applied to ships operating in the region to predict navigation routes. Regional ship collision risk index prediction models identify hotspots with high ship densities and predict the collision risk index in these regions, thus presenting a collision risk assessment model using dynamic information obtained from ships within the region.
The aforementioned methods have significantly contributed to optimal decision making by VTSOs; however, the following challenges remain. Despite identifying collision-prone locations for ships [12], previous studies have simply developed a predictive model for high ship density hotspots without simultaneously considering the near-collision and actual-collision locations in surveillance sea areas [4,5,6,7,8,9,10,11,12]. Furthermore, although a VTSO should continuously manage collision risk assessments from the point when the risk of collision between ships begins until a collision occurs, previous studies have only used a combined collision risk index within the surveillance region.
This study addresses the aforementioned challenges as follows. The near-collision location based on the ship domain (SD) [13] and actual-collision location [1] are both identified as dangerous surveillance sea areas. A regional collision risk prediction system using density-based spatial clustering of applications with noise (DBSCAN) [14] for clustering-based determination of the near-collision locations is proposed, and the results are compared with the actual-collision locations [1]. Furthermore, a fuzzy inference system (FIS) [13] is used for collision risk assessments from the point when the risk of collision between ships begins until a collision occurs. Finally, long short-term memory (LSTM) [15] is adopted to learn the sequence dataset from the extracted ship trajectory when a collision occurs to allow VTSOs to make optimal timely decisions using sequence data from the points when the collision risk in sea areas begin until a collision occurs.
The remainder of this paper is organized as follows. Section 2 presents the theoretical background of this study. Section 3 describes the proposed regional collision risk prediction system based on SD, DBSCAN, fuzzy inference system based on a near collision (FIS-NC) [13], and LSTM at the collision area considering spatial patterns. Section 4 presents the MATLAB computation simulation results and the discussion. Finally, Section 5 presents a summary of the main conclusions of the study.
2. Theoretical Background
2.1. Near Collision
Collisions with a high complexity in maritime traffic bear a significant risk [16]. In other words, if the complexity surpasses the threshold, the probability of a near collision increases significantly. Hence, this study intends to determine the near collision through the SD [17] considering the complexity. Near collision is defined to occur when the SDs of the own ship (OS) and target ship (TS) overlap, as shown in Figure 1.
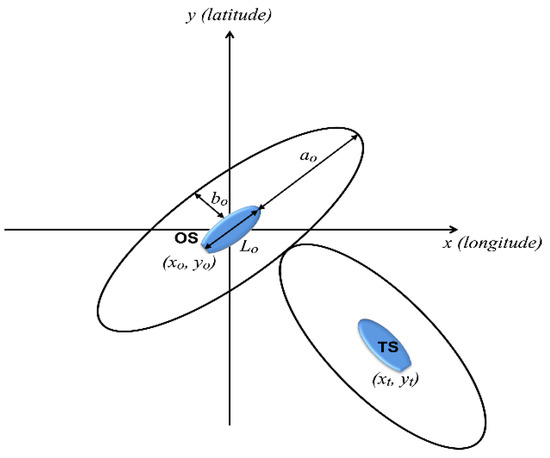
Figure 1.
The ship domain with elliptical dimensions.
However, selecting the size and shape of the most suitable SD for ship navigation is challenging. Namgung and Kim [13] theoretically analyzed the method proposed by Fuji and Tanaka [18] and Bakdi et al. [19] for determining the SD, where the length and speed of the ship were regarded as parameters. They calculated the long () and short radii () of the SD using Equation (1) for each 0.1 velocity change.
where is the velocity of the OS, and is 10 . The SD of the TS can also be obtained using Equation (1).
2.2. Fuzzy Inference System Based on near Collision
In fuzzy logic, fuzzy IF-THEN rules are used to formulate conditional statements. Figure 2 shows the inference process of the FIS-NC proposed by Namgung and Kim [13].
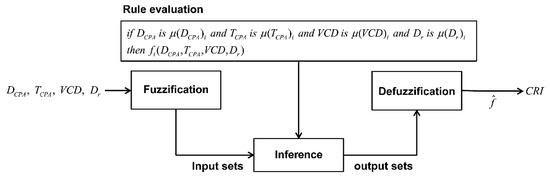
Figure 2.
The inference process of the fuzzy inference system based on a near collision (FIS-NC).
First, the inputs, including DCPA, TCPA, the variance of compass degree (VCD), and , are collected using automatic radar plotting aids (ARPA) and AIS; then, they are checked for affiliations to the appropriate fuzzy sets, as shown in Figure 3.
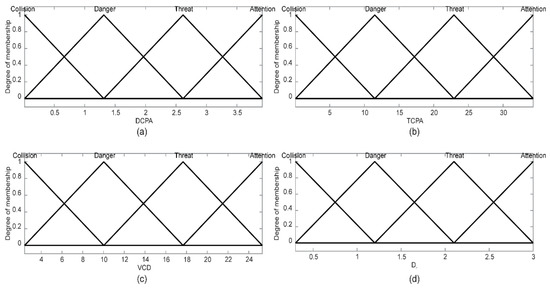
Figure 3.
The fuzzy membership function of FIS-NC [13]: (a) DCPA, (b) TCPA, (c) VCD, and (d) Dr.
In the second step, the fuzzified inputs, , , , and , are entered into the antecedents of the fuzzy rules. The result is then entered into the consequent membership function , which is a first-order polynomial as follows:
where is a constant, and is the fuzzy rule. Therefore, 256 fuzzy rules with combinations of each membership function using Figure 3 are formed, as summarized in Table 1.

Table 1.
The components of the fuzzy inference rules for FIS-NC.
In the third step, the aggregation is performed by unifying the outputs of all rules. In the last step, the input for the defuzzification process is the aggregated output fuzzy set; the output is estimated by the collision risk index (CRI) using the weighted average function (), which is calculated as follows:
The calculated CRI ranges from 0.00 to 1.00 [13], and the time point for collision avoidance is as follows: the give-way vessel and stand-on vessel take a collision-avoidance action for CRI ≥ 0.01 and CRI ≥ 0.33, respectively.
The following equations express the mathematical formulation of the input set.
where Dr is the relative distance between the coordinates of the OS and TS ; and are the course and velocity of the OS, respectively; and are the course and velocity of the TS, respectively; is the relative velocity; is the relative course; is the azimuth of the TS; is the relative bearing; and i is the current time.
2.3. DBSCAN
DBSCAN is a data clustering algorithm that considers a group of data that are connected as a chain; data with constant density are considered to be in the same cluster regardless of the concept of distance [14]. The algorithm begins by presenting learning data in coordinate spaces, where each learning data item expressed as coordinate points is divided into three forms: core, border, and noise, as shown in Figure 4.
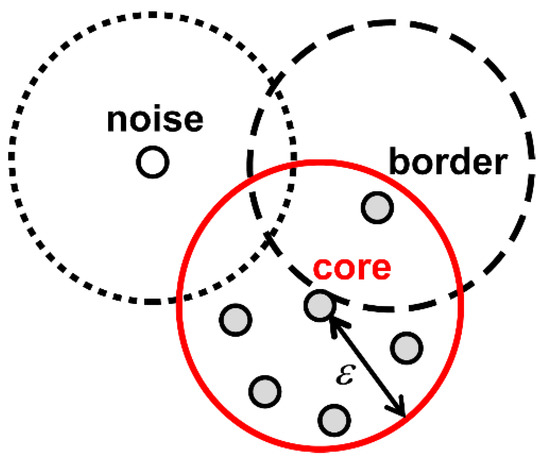
Figure 4.
The three forms of density-based spatial clustering of application with noise (DBSCAN).
The symbol definitions are outlined below:
Definition:
: Full set of learning data;
: Density measurement radius;
: Minimum number of data points within radius ;
: Number of neighbor data points in radius of ;
: Neighbor data points in radius of .
- : if ;
- : if ;
- : if .
2.4. Long Short-Term Memory
In the sequence data (from the point when the risk of collision between ships begins until a collision occurs), the data prediction must be considered along with the current data, as the previous data affect the current data. LSTM is an artificial recurrent neural network (RNN) architecture [15] used in the field of sequence data learning. Unlike standard feedforward neural networks, LSTM has feedback connections. Figure 5 shows a schematic architecture of common LSTM comprising a cell, an input gate, an output gate, and a forget gate. Here, the cell remembers values over arbitrary time intervals. Additionally, the input, output, and forget gates control the information flow into and out of the cell.
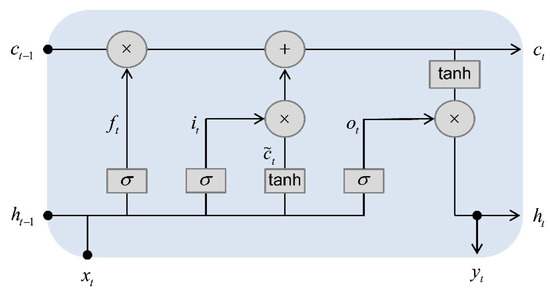
Figure 5.
The schematic architecture of LSTM.
The equations representing LSTM can be presented as follows:
where is the input vector at time step ; and represent the weight matrix and bias vector for linear transformation, respectively; refers to the sigmoid function as an element-wise activation function; and denotes the point-wise vector products.
3. Regional Collision Risk Prediction System
3.1. Process of System Development
Figure 6 shows the development process of a regional collision risk prediction system using SD, DBSCAN, FIS-NC, and LSTM, which can be categorized into the global spatial pattern, local spatial pattern, and system development stages. In the global spatial pattern stage, the route density is identified using AIS maritime traffic data. By setting up the SD on the operating ship, the near collision is extracted at the point where SDs overlap. In the local spatial pattern stage, the near-collision locations are clustered and compared with the actual-collision locations using the DBSCAN. After simultaneously identifying the actual-collision and near-collision locations, the ship trajectory is extracted when a collision occurs. Finally, the system is developed by learning the input (DCPA, TCPA, VCD, and )–output (CRI) sequence dataset from the extracted ship trajectory when a collision occurs using the LSTM.
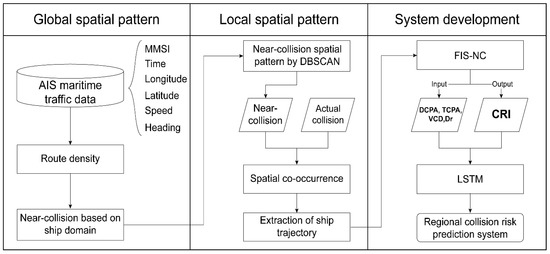
Figure 6.
The flowchart of a regional collision risk prediction system.
3.2. Global Spatial Pattern
The Mokpo sea area often experiences close navigation involving several small- and medium-sized cargo ships, coastal ferries, and fishing boats. Therefore, several collisions have occurred in this area. In this study, we considered the regional collision risk prediction system for the Mokpo sea area. The route density in Figure 7 shows the ship trajectory obtained from the AIS maritime traffic data from 8 July to 10 July 2019, and the ship operation situation was observed as 493 cases in the three days extracted from the AIS maritime traffic data. Near-collision identification for three days using the SD showed that 139 cases occurred.
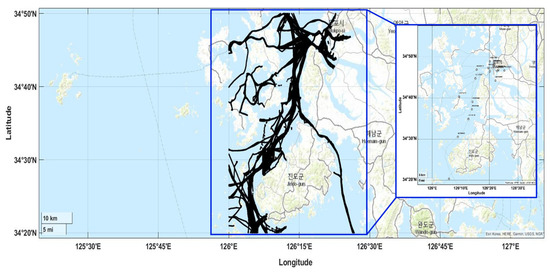
Figure 7.
The global spatial pattern analysis based on the automatic identification system (AIS) maritime traffic data of the Mokpo sea area: route density and ship operation situation.
3.3. Local Spatial Pattern
Figure 8a shows the results of the analysis of the near-collision and actual-collision points at the Mokpo sea area. The results of the clustering of the near-collision locations using the DBSCAN algorithm (see Algorithm 1) are shown in Figure 8b; the near-collision and actual-collision regions were identified simultaneously. The trajectory of the ship from the point when the collision risk began to that when the collision occurred was extracted based on the near-collision and actual-collision locations. The ship trajectory at this point was obtained from the near-collision location based on the AIS maritime traffic data, as shown in Figure 9. The extracted ship trajectory spanned from the point when the risk of collision began to that when the near collision and the actual collision occurred simultaneously.
| Algorithm 1. Near-collision spatial pattern using DBSCAN |
| Input:, , , Output: Cluster () 1 Initialize 2 for do as (1); 3 IF 4 ← 5 Repetition (1) ← Expand 6 else if 7 continue next point ← 8 end 9 end |
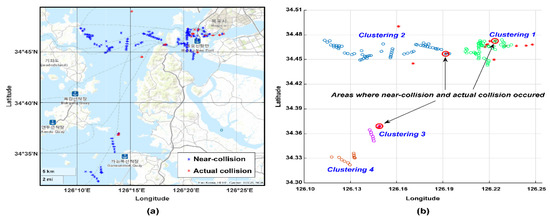
Figure 8.
The local spatial pattern analysis: (a) The distribution of the near-collision and actual-collision locations and (b) the areas of collision co-occurrence.
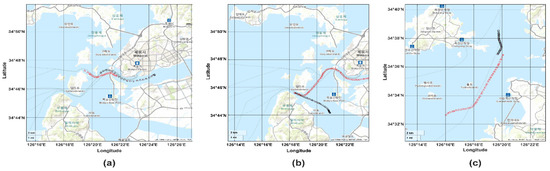
Figure 9.
The extracted ship trajectory: (a) clustering 1, (b) clustering 2, and (c) clustering 3.
3.4. System Development
In the extracted ship trajectory, the inputs were DCPA, TCPA, VCD, and , and the output was set to the CRI obtained using FIS-NC. To predict the CRI for future constant time steps, we determined the output data using the data shifted by one time step at each time step of the input data, as shown in Figure 10. The input data from the extracted ship trajectory were used when the CRI inferred from the FIS-NC exceeded 0.000.
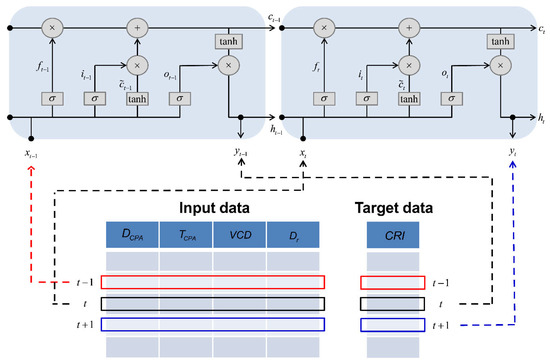
Figure 10.
The schematic of long short-term memory (LSTM) used for the regional collision risk prediction system.
Figure 11a,c,e show a comparison of the learning results of the test data and values predicted using LSTM. At this time, the training data (predicted values) comprise the CRI learned by the LSTM, and the test data comprise the CRI shifted by one time step at each time step of the input data via the FIS-NC. The selection criteria for the regional collision risk prediction system used the root mean square error (RMSE) value, as shown in Figure 11b,d,f. The RMSE values at clustering 1, 2, and 3 are 0.013, 0.017, and 0.038, respectively.
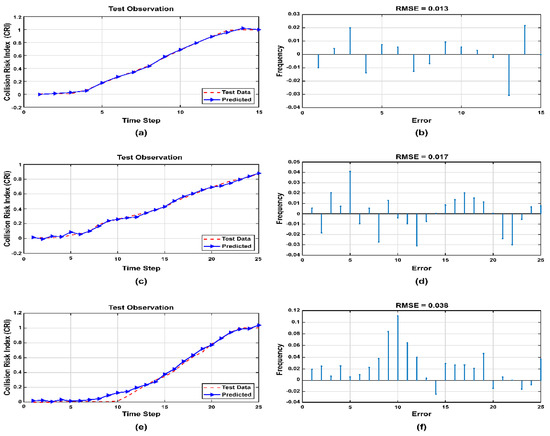
Figure 11.
The test performance of the regional collision risk prediction system: (a) The test observation of clustering 1; (b) The root mean square error (RMSE) of clustering 1; (c) The test observation of clustering 2; (d) The RMSE of clustering 2; (e) The test observation of clustering 3; and (f) the RMSE of clustering 3.
4. Results and Discussion
4.1. Simulation Results
To verify the performance, the developed regional collision risk prediction system was compared with the FIS-NC by applying the extracted ship trajectory presented in Section 3.3, and the results were analyzed. The CRI values measured using the developed system and the FIS-NC according to are presented in Figure 12 and Table 2. In the initial encounter situation, the CRI values obtained from the FIS-NC and the developed system were 0.000 and 0.008 in clustering 1, 0.000 and 0.007 in clustering 2, and 0.000 and 0.007 in clustering 3, respectively. When a near collision occurred, the CRI values were 1.000 and 1.000 in clustering 1, 0.833 and 0.881 in clustering 2, and 0.999 and 0.999 in clustering 3, respectively. In particular, the CRI values obtained using the developed system were generally higher than those obtained from the FIS-NC according to .
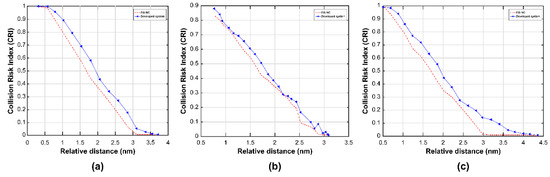
Figure 12.
The comparison of results of the FIS-NC and the developed system: (a) clustering 1, (b) clustering 2, and (c) clustering 3.
Table 2.
The comparison of results of the FIS-NC and the developed system in clustering 1, 2, and 3.
4.2. Discussion
The CRI in the simulation results was obtained from the FIS-NC and the developed system. However, because each system obtained a different CRI for the same distance, the response distance and time for the collision avoidance of the give-way and stand-on vessels vary. Therefore, the results are analyzed by comparison to those reported by Cockcroft and Lameijer [20] to ensure that the point positioning for collision avoidance for the CRI obtained from each system is adequate for the give-way and stand-on vessels. According to Cockcroft and Lameijer [20], a close-quarter situation, which initiates the collision risk between vessels, is approximately 3 nm based on rule 22 of collision regulations (COLREGs) [21]. Here, the give-way vessel is required to act early to avoid a collision, and the stand-on vessel must maintain its course and speed. However, if it becomes apparent that the give-way vessel will not take the appropriate action within approximately 2 nm, the stand-on vessel is permitted to take action to avoid collision through maneuvering only.
Table 3 presents a comparison of the results of the time points for collision avoidance, as discussed in Section 2.2. In all clustering, the FIS-NC and the developed system recommended an action to avoid a collision before 3 nm and 2 nm in the case of the give-way vessel and stand-on vessel, respectively. In particular, the developed system recommended action faster than the FIS-NC. Therefore, a VTSO can predict collision risk situations between ships quickly and make optimal decisions in dangerous surveillance sea areas in advance via the developed system by securing additional nm.
Table 3.
The comparison of results of point positioning for collision avoidance in clustering 1, 2, and 3.
Although the developed system can be used for various purposes, including monitoring the maritime autonomous surface ships (MASS) from the remote-control operator on land, it can only be used in certain areas. Therefore, further research is required to ensure that the developed system can be used for a wide range of applications in the entire surveillance sea area.
5. Conclusions
This study developed a regional collision risk prediction system using the SD, DBSCAN, FIS-NC, and LSTM at collision areas considering spatial patterns and the location where the actual collision occurred, defined as the dangerous surveillance sea areas. In the global spatial pattern stage, the near-collision location was extracted from the route density. In the local spatial pattern stage, the ship trajectory was extracted after identifying the actual-collision and near-collision locations simultaneously. Finally, the system was developed by learning the input (DCPA, TCPA, VCD, and )–output (CRI) sequence dataset from the extracted ship trajectory when a collision occurred. The performance of the developed system was compared with that reported in existing research, and the results indicate that the developed system can overcome the drawbacks identified in existing systems: (i) the failure to consider the near-collision and actual-collision locations in the surveillance sea areas and (ii) the provision of a combined collision risk index solely within the region. Furthermore, the developed system recommended action faster than the FIS-NC. Therefore, a VTSO can predict collision risk situations between ships quickly and make timely optimal decisions in dangerous surveillance sea areas via the developed system by securing additional nm. However, the developed system can only be used in certain areas; therefore, further research is required to ensure that it can be used for a wide range of applications in the entire surveillance sea area.
Author Contributions
Conceptualization, H.N. and J.-S.K.; methodology, J.-S.K.; software, H.N.; validation, H.N. and J.-S.K.; formal analysis, J.-S.K.; investigation, H.N.; resources, H.N.; data curation, J.-S.K.; writing—original draft preparation, H.N.; writing—review and editing, J.-S.K.; visualization, H.N.; supervision, J.-S.K.; project administration, J.-S.K.; funding acquisition, H.N. and J.-S.K. All authors have read and agreed to the published version of the manuscript.
Funding
This work was supported in part by the Basic Science Research Program through the National Research Foundation of Korea (NRF) by the Ministry of Education under Grant 2020R1I1A1A01060533, and in part by the National Research Foundation of Korea (NRF) grant funded by the Korean Government (MSIT) under Grant NRF-2019RG1A1098184.
Institutional Review Board Statement
Not applicable.
Informed Consent Statement
Not applicable.
Conflicts of Interest
The authors declare no conflict of interest.
Abbreviations
| AIS | automatic identification system |
| ARPA | automatic radar plotting aids |
| CRI | collision risk index |
| DBSCAN | density-based spatial clustering of application with noise |
| FIS | fuzzy inference system |
| FIS-NC | fuzzy inference system based on near collision |
| LSTM | long short-term memory |
| MASS | maritime autonomous surface ships |
| OS | own ship |
| RNN | recurrent neural network |
| RMSE | root mean square error |
| SD | ship domain |
| TS | target ship |
| VCD | variance of compass degree |
| VTS | vessel traffic service |
| VTSO | vessel traffic service operator |
Appendix A
Table A1.
Comparison and analysis of various strategies for optimal decision of VTSO.
Table A1.
Comparison and analysis of various strategies for optimal decision of VTSO.
| Source | Development Purpose | Research Method | Utilization | |||||
|---|---|---|---|---|---|---|---|---|
| AIS Maritime Traffic data | Ship Trajectory | Collision Risk Index | Ship Domain | Near Collision | Actual Collision | |||
| Qu et al. [4] | Collision risk assessment | Fuzzy logic | √ | - | √ | √ | - | - |
| Zhen et al. [5] | Collision risk assessment | DBSCAN | √ | - | √ | - | - | - |
| Kim et al. [6] | Caution area traffic prediction | CNN | √ | √ | - | - | - | - |
| Zhang et al. [7] | Regional ship near-miss collision risk assessment | VCRO | √ | - | √ | √ | √ | - |
| Liu et al. [8] | Real-time regional collision risk prediction | DBSCAN, RNN | √ | - | √ | √ | - | - |
| Capobianco et al. [9] | Ship trajectory prediction | LSTM | √ | √ | - | - | - | - |
| Chen et al. [10] | Real-time regional collision risk analysis | DBCAN, VO | √ | - | √ | √ | √ | - |
| Murray and Perera [11] | Regional ship behavior prediction | RNN, HDBSCAN | √ | √ | - | - | - | |
| J. Mazurek et al. [12] | Ship–ship collision frequency based on trajectory | IWRAP Mk2 | √ | √ | - | - | - | - |
| Namgung and Kim (this paper) | Regional collision risk prediction | DBSCAN, Fuzzy logic, LSTM | √ | √ | √ | √ | √ | √ |
References
- Korean Maritime Safety Tribunal. Status of Marine Accidents. Available online: https://www.kmst.go.kr/kmst/statistics/annualReport/selectAnnualReportList.do (accessed on 6 May 2021).
- International Maritime Organization. Guidelines for Vessel Traffic Services, IMO Resolution A; International Maritime Organization: London, UK, 1997. [Google Scholar]
- IALA Guideline 1089, Provision of VTS Services (INS, TOS, NAS), 1st ed.; International Association of Marine Aids to Navigation and Lighthouse Authorities: Saint Germain en Laye, France, 2012.
- Qu, X.; Meng, Q.; Li, S.Y. Ship collision risk assessment for the Singapore strait. Accid. Anal. Prev. 2011, 43, 2030–2036. [Google Scholar] [CrossRef] [PubMed] [Green Version]
- Zhen, R.; Riveiro, M.; Jin, Y. A novel analytic framework of real-time multi-vessel collision risk assessment for maritime traffic surveillance. Ocean Eng. 2017, 145, 492–501. [Google Scholar] [CrossRef]
- Kim, K.; Lee, K.M. Deep learning-based caution area traffic prediction with automatic identification system sensor data. Sensors 2018, 18, 3172. [Google Scholar] [CrossRef] [PubMed] [Green Version]
- Zhang, W.; Feng, X.; Qi, Y.; Shu, F.; Zhang, Y.; Wang, Y. Towards a model of regional vessel near-miss collision risk assessment for open waters based on AIS data. J. Navig. 2019, 72, 1449–1468. [Google Scholar] [CrossRef]
- Liu, D.; Wang, X.; Cai, Y.; Liu, Z.; Liu, Z.-J. A novel framework of real-time regional collision risk prediction based on the RNN approach. J. Mar. Sci. Eng. 2020, 8, 224. [Google Scholar] [CrossRef] [Green Version]
- Capobianco, S.; Millefiory, L.M.; Forti, N.; Braca, P.; Willett, P. Deep learning methods for vessel trajectory prediction based on recurrent neural networks. arXiv 2021, arXiv:2101.02486. [Google Scholar] [CrossRef]
- Chen, P.; Li, M.; Mou, J. A velocity obstacle-based real-time regional ship collision risk analysis method. J. Mar. Sci. Eng. 2021, 9, 428. [Google Scholar] [CrossRef]
- Murray, B.; Perera, L.P. An AIS-based deep learning framework for regional ship behavior prediction. Reliab. Eng. Syst. Saf. 2021, 215, 107819. [Google Scholar] [CrossRef]
- Mazurek, J.; Lu, L.; Montewka, J.; Krata, H.; Kujala, P. An updated method identifying collision-prone locations for ships. A cased study for oil tankers navigating in the Gulf of Finland. Reliab. Eng. Syst. Saf. 2022, 217, 108024. [Google Scholar] [CrossRef]
- Namgung, H.; Kim, J.-S. Collision risk inference system for maritime autonomous surface ships using COLREGs rules compliant collision avoidance. IEEE Access 2021, 9, 7823–7835. [Google Scholar] [CrossRef]
- Ester, M.; Kriegel, H.; Sander, J.; Xu, X. A density-based algorithm for discovering clusters in large spatial databases with noise. In Proceedings of the 2nd International Conference on Knowledge Discovery and Data Mining (KDD’96), Portland, OR, USA, 2–4 August 1996; pp. 226–231. [Google Scholar]
- Hochreiter, S.; Schmidhuber, J. Long short-term memory. Neural Comput. 1997, 9, 1735–1780. [Google Scholar] [CrossRef] [PubMed]
- Van Westrenen, F.; Baldauf, M. Improving conflicts detection in maritime traffic: Case studies on the effect of traffic complexity on ship collisions. Proc. Inst. Mech. Eng. Part M J. Eng. Marit. Environ. 2020, 234, 209–222. [Google Scholar] [CrossRef]
- Szlapczynski, R.; Szlapczynska, J. Review of ship safety domains: Models and applications. Ocean Eng. 2017, 145, 277–289. [Google Scholar] [CrossRef]
- Fujii, Y.; Tanaka, K. Studies in marine traffic engineering: Traffic capacity. J. Navig. 1971, 24, 543–552. [Google Scholar] [CrossRef]
- Bakdi, A.; Glad, I.K.; Vanem, E.; Engelhardtsen, Ø. AIS-based multiple vessel collision and grounding risk identification based on adaptive safety domain. J. Mar. Sci. Eng. 2020, 8, 5. [Google Scholar] [CrossRef] [Green Version]
- Cockcroft, A.N.; Lameijer, J.N.F. A Guide to the Collision Avoidance Rules, 7th ed.; Butterworth Heinemann: Oxford, UK, 2011; pp. 1–183. [Google Scholar]
- IMO. Convention on the International Regulations for Preventing Collisions at Sea, 8th ed.; International Maritime Organization: London, UK, 1972. [Google Scholar]
Publisher’s Note: MDPI stays neutral with regard to jurisdictional claims in published maps and institutional affiliations. |
© 2021 by the authors. Licensee MDPI, Basel, Switzerland. This article is an open access article distributed under the terms and conditions of the Creative Commons Attribution (CC BY) license (https://creativecommons.org/licenses/by/4.0/).