Article

Demographics of Scomberomorus commerson in the Central Taiwan Strait

1
Coastal and Offshore Resources Research Center of Fisheries Research Institute, Council of Agriculture, Executive Yuan, Kaohsiung 806043, Taiwan
2
Fisheries Agency, Council of Agriculture, Executive Yuan, Taipei 100058, Taiwan
3
Institute of Oceanography, National Taiwan University, Taipei 106216, Taiwan
4
Department of Environmental Biology and Fisheries Science, National Taiwan Ocean University, Keelung City 202301, Taiwan
5
Center of Excellence for Ocean Engineering, National Taiwan Ocean University, Keelung City 202301, Taiwan
6
Institute of Marine Affairs and Resource Management, National Taiwan Ocean University, Keelung City 202301, Taiwan
7
George Chen Shark Research Center, National Taiwan Ocean University, Keelung City 202301, Taiwan
*
Author to whom correspondence should be addressed.
J. Mar. Sci. Eng. 2021, 9(12), 1346; https://doi.org/10.3390/jmse9121346
Submission received: 18 October 2021 / Revised: 17 November 2021 / Accepted: 24 November 2021 / Published: 30 November 2021
(This article belongs to the Special Issue Interannual Variation of Planktonic Species and Fish Populations)

Abstract

:
The narrow-barred Spanish mackerel Scomberomorus commerson is an economically essential species; however, few studies have investigated its demographic structure in the northwestern Pacific, which includes Taiwan’s waters. This study examined the growth parameters, age composition, mortality, and sex ratio of S. commerson catches by examining sagittal otoliths and other biological data collected in a 3-year project from June 2018 to June 2021. The transverse sections of sagittal otoliths exhibited alternating translucent and opaque zones, in annual cycles, and this observation was validated by otolith edge analysis. Opaque zones began to form in October; the growth peaked in December and lasted until March. Growth parameters were estimated for female (L = 144.1 cm fork length [FL], k = 0.39 y−1, to = −0.85 y) and male (L = 136.0 cm FL, k = 0.32 y−1, to = −1.49 y) specimens. The maximum recorded FL, body weight, and age were 159.0 cm, 27 kg, and 9.2 y for female and 135.0 cm, 17.8 kg, and 7.2 y for male specimens. Rapid growth was observed for both sexes, with FL reaching 66.8 ± 14.2 cm in female specimens and 70.1 ± 11.0 cm in male specimens during the first year of life. An age–length key based on the direct otolith aging and FL dataset (N = 646) was used to estimate the age composition of 3-year catches measured at landing (N = 16,133). The results verified that the S. commerson currently caught in the central Taiwan Strait are mainly young fish aged 1+ to 2+ y. The estimated fishing mortality (0.27 y−1) and exploitation rate (0.30) suggested that overfishing was not occurring in this stock. The findings of this study have helped clarify the population dynamics of the S. commerson in the Taiwan Strait, and the biological parameters reported herein can aid the management and conservation to ensure the sustainability of this species in this region.

1. Introduction

The narrow-barred Spanish mackerel Scomberomorus commerson is a pelagic and highly migratory species that is mainly distributed in the Indo-Pacific region from the Red Sea and South Africa to Asian and Oceanic regions (e.g., Taiwan, Japan, and Australia) [1]. S. commerson inhabits waters around the edge of the continental shelf and shallow waters at depths from 10 to 100 m [2]. The species can reach a maximum fork length (FL) of 2.4 m and body weight (BW) of 70 kg [3], and its longevity has been documented for more than 20 y [4].
S. commerson is an economically essential species [5]. The global annual catch of this species steadily increased from 70,000 metric tons in the 1970s to more than 220,000 metric tons in 2008 [6] because of the high demand for this species. This growing catch volume has increased the risk to this resource; therefore, extensive studies and long-term monitoring programs have been conducted in several regions to examine the possible sustainable use of this species [7,8,9,10]. The stock status of S. commerson varies in different areas. For example, overfishing of this species was reported in Omani and Iranian waters; however, the stock was sustainably exploited in the Torres Strait, northern Australia [10,11,12]. S. commerson is also a crucial catch species in Taiwan, which was mainly caught by drift gillnets, longlines, and trolling lines. The main fishing ground for S. commerson is the shallowest section of the southwestern region of the Taiwan Strait. Catches of S. commerson from this area account for more than 70% of the total S. commerson catch in Taiwan’s waters. The annual catch of S. commerson in Taiwan’s waters decreased dramatically from 6600 metric tons in 2002 to 517 metric tons in 2019 [13]. This substantial decline can be attributed to high demand, unregulated fishing practices, and overexploitation. However, no restrictions currently exist for the total catch and size in Taiwanese waters. Although the stock of this species is likely overexploited, there is no stock assessment being conducted on this species around the Taiwan Strait. Thus, relevant studies should be conducted to collect biological data, including fundamental parameters to further assess the species’ stock status.
The stock status of fish resources can be evaluated by examining the age structure of a fish population [14]. Growth is the biological parameter that is most widely used to examine the life history of commercially exploited fish [15]. Reliable age structure data (e.g., growth rate, mortality rate, and longevity) can be used to evaluate the exploitation status of fish resources [16]. The growth of fish can be estimated by using tag recapture data that include the FL at tagging, FL at recapture, and release time. However, this estimation method has specific drawbacks [17]. For example, tagging experiments are costly to conduct, and the recovery rates for tagged fish are usually low. Alternatively, the age of fish can be estimated through the growth rings found in a fish’s calcified structure such as its scales, vertebrae, fin ray spines, and otoliths [16]. By counting the translucent and opaque zones or growth rings that are seasonally deposited in these tissues, the age of fish can be estimated, and their corresponding growth parameters can be determined [18]. These data can be used to examine a species’ growth rate, mortality rate, and longevity, information that can aid the development of population models, population assessments, and catch utilization management.
Age and growth information of S. commerson has been documented in various areas, i.e., in India [19], Oman [4,10,20], South Africa [21,22,23], Saudi Arabia [24], Australia [3,25], and Iran [11]. However, few studies have investigated the age and growth of S. commerson in Taiwan’s waters. An early and preliminary study was conducted by Chen [26] to determine the age and growth parameters of S. commerson caught in the Taiwan Strait. However, the biological parameters and demographics of this fish species are likely to have changed after more than 50 years of commercial fishing. Moreover, climate change and other natural environmental variations may have also promoted alterations in the species growth and demographics throughout this time [27]. Weng et al. [28] explored the reproductive biology of this species and verified that its reproductive period is from March to August. The updated information of spawning seasons and formation seasons of otolith annuli will allow us to refine the growth equation of this species.
Demographic changes in fish stock, such as age composition, mortality rate, and sex ratio, can be used as indicators of the stock status for management purposes. However, directly determining the age for a large number of fish is very time-consuming. Alternatively, the age structure of a fish stock can be more efficiently estimated by the relationship between age and length for a relatively small subsample of fish stock: a so-called age–length key. The age structure can be further used to estimate the mortality and exploitation rate of a fish stock. In the present study, we aimed to examine the periodicity of otolith annuli for S. commerson caught in the Taiwan Strait. Then, otolith annuli and fish length were used to estimate the growth parameters of S. commerson and to construct an age–length key, which can convert body length data to age structure for all specimens with length data collected over a 3-year period. The mortality, exploitation rate, and sex ratios were also estimated herein to provide further insight into the demographic structure of this species. The findings of the present study can aid the future stock assessment and management of S. commerson in the Taiwan Strait.

2. Materials and Methods
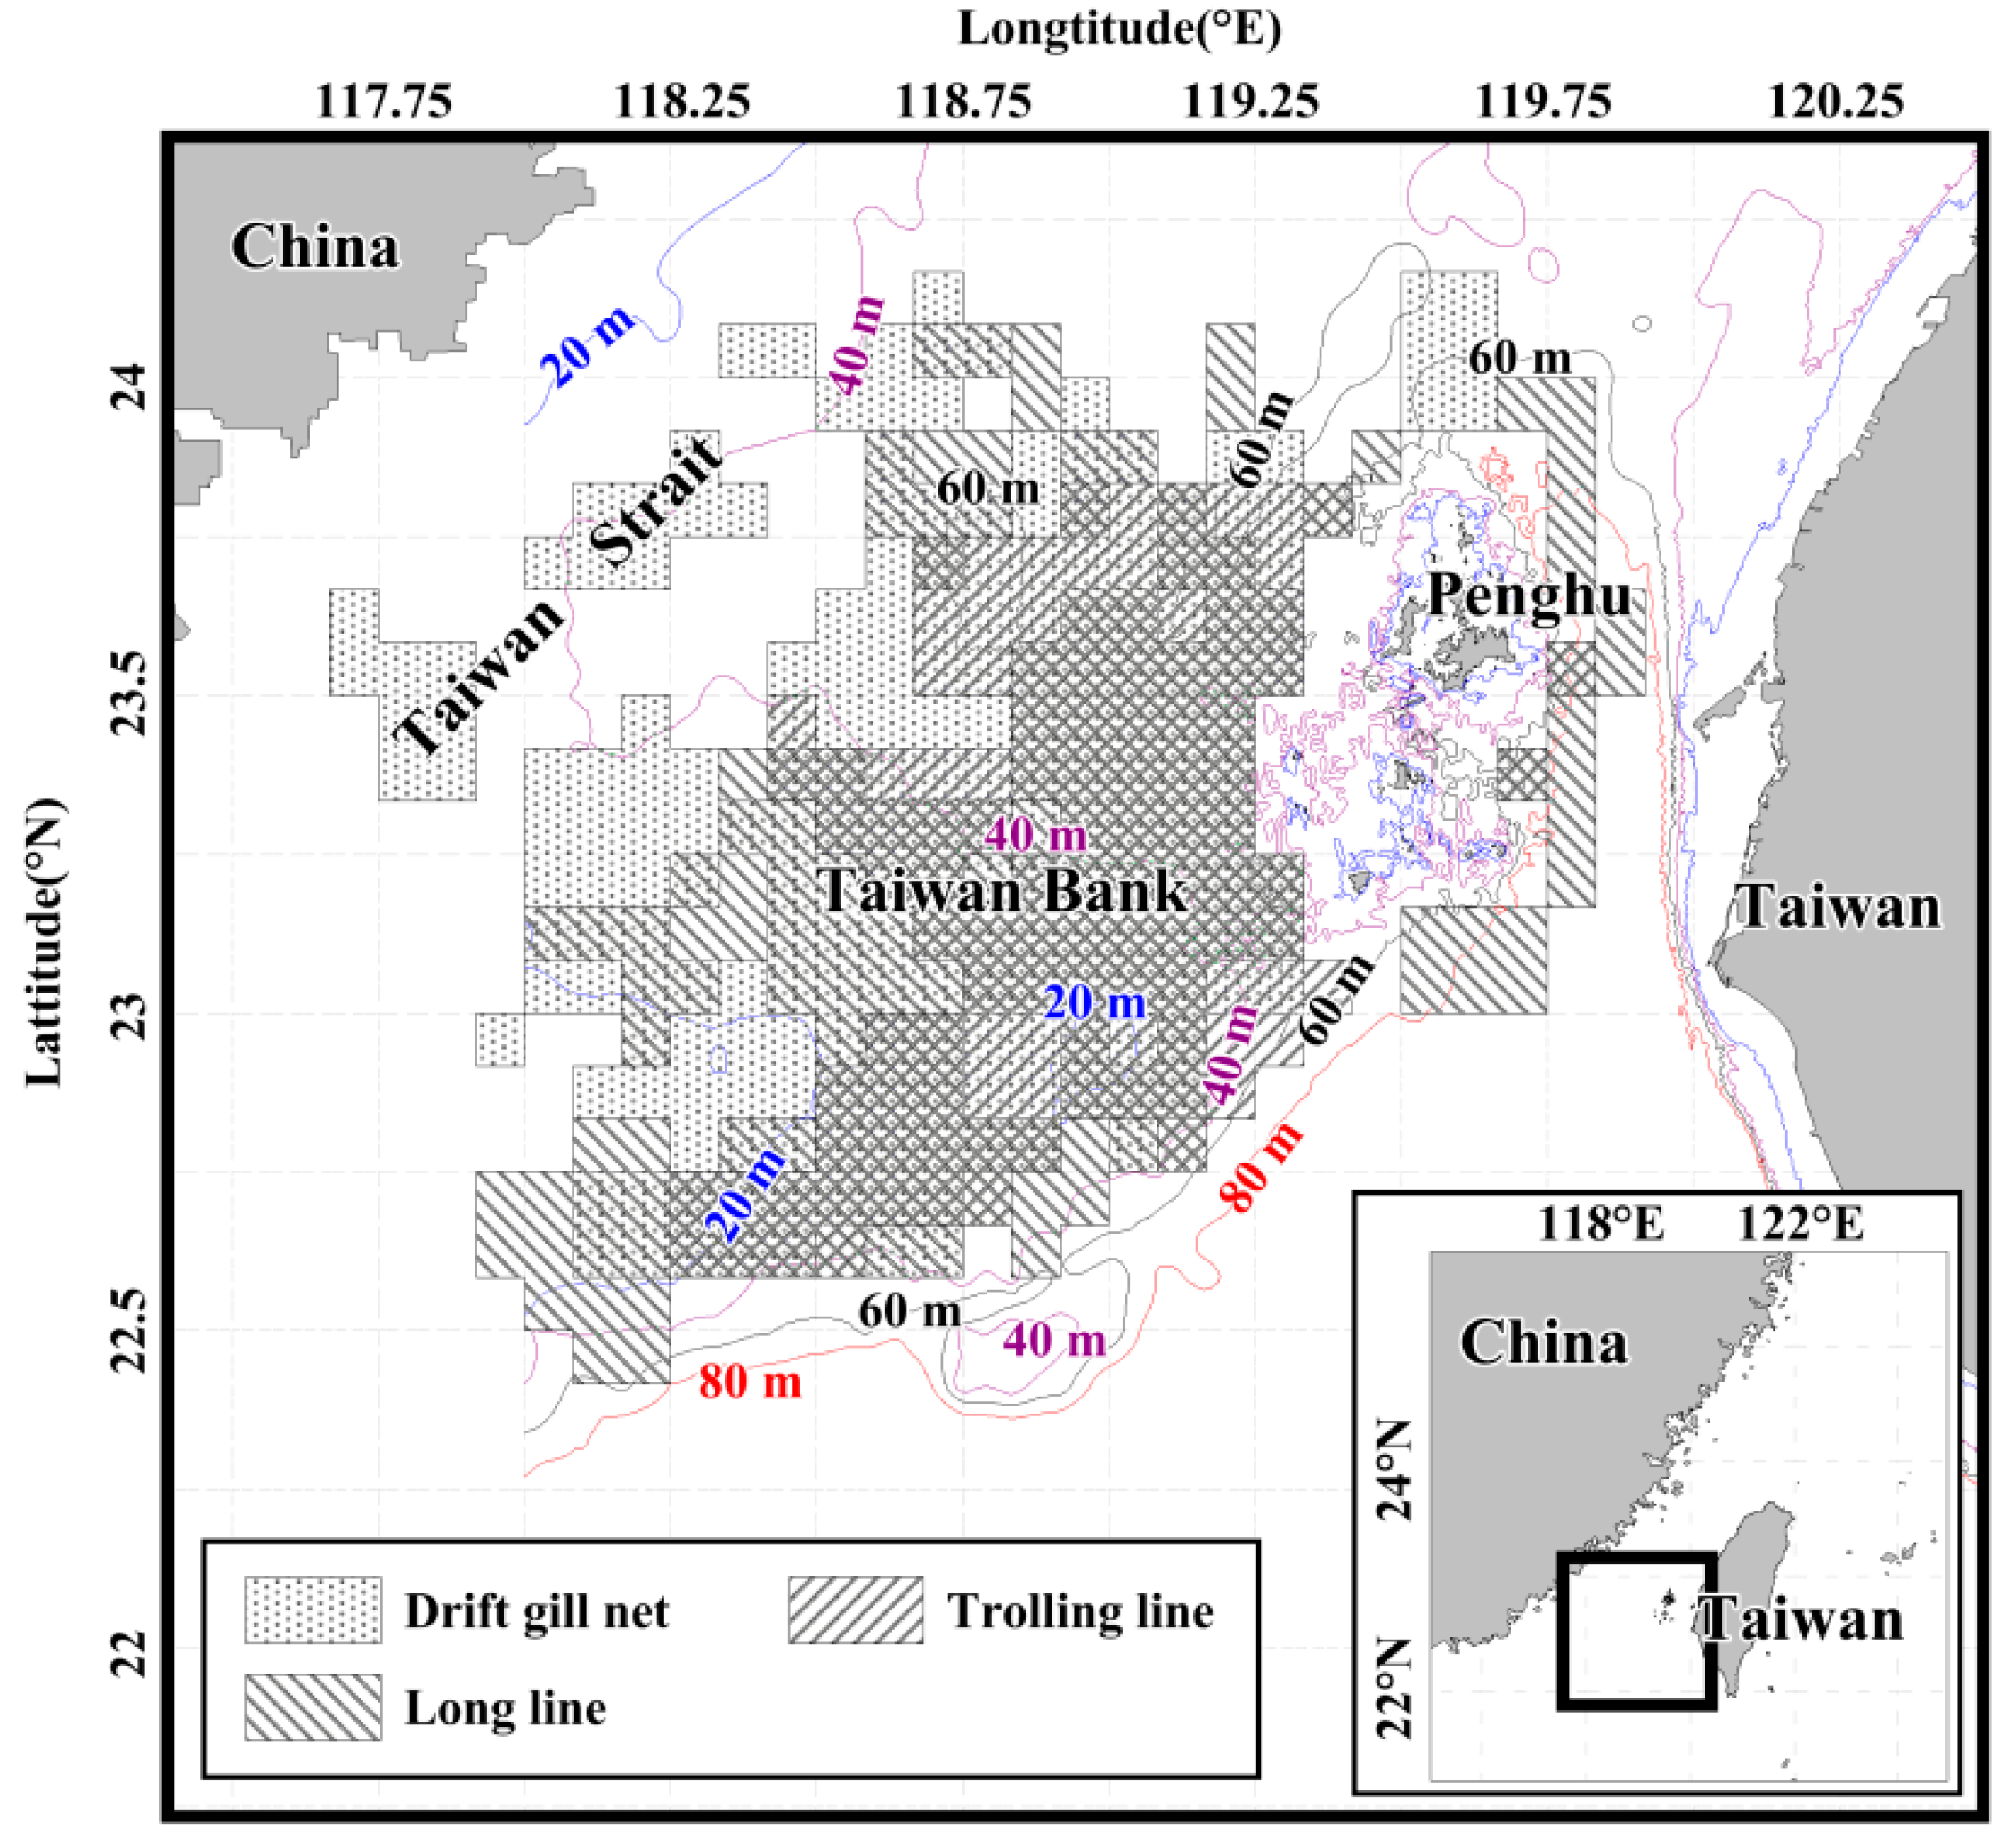
2.1. Sampling

Specimens of S. commerson were collected from a Penghu fish market monthly from June 2018 to June 2021 (Figure 1). These fish were caught using drift gillnets, trolling lines, or longlines, and juvenile fish were caught by torchlight fishing vessels that operate in the waters of the central Taiwan Strait. The fish sampling vessels equipped with a voyage data recorder (VDR) were used to collect data regarding the location and timing of catches in the species’ fishing grounds. The catch locations of the fish by different fishing gears were shown in Figure 1. All obtained specimens were transported to a laboratory where the FL (cm) and BW (kg) were measured (n = 654), gonads were examined to determine the sex (n = 646), and their otoliths (n = 654) were dissected for age determination. In addition, we measured the body length of 16,133 individuals landed at the fishing market to analyze the catch size and age composition. The length data were sorted by fishing gears, and the fish number in each 5 cm interval was divided by the total fish caught by each fishing gear to show the size distribution. The sex data of these 16,133 fish were unavailable because the fish were not dissected at the fish market.

2.2. Otolith Preparation for Age Determination

The otoliths were measured along their long axis (anterior-to-posterior direction) to 0.01 mm and embedded in epoxy resin (Struers Inc., Cleveland, OH, USA); transverse sections (350–400 μm) containing the otolith core were extracted using a low-speed saw (Buehler isomet, Buehler Inc., Lake Bluff, IL, USA). The otolith sections were then mounted on a glass slide with Permount mounting medium (Avantor Inc., Radnor, Pennsylvania, USA) for the examination of translucent and opaque zones (Figure 2). For the eight juveniles with an FL of <35 cm and unknown sex, their sectioned otoliths were embedded in epoxy resin again, and the otoliths were ground and polished using a grinder–polisher machine (Metaserv 2000, Buehler, Inc., Lake Bluff, IL, USA) to reveal their daily growth increments. Images of otolith sections were obtained using a compound light microscope (Nikon 90i, Minato, Tokyo, Japan) with transmitted light. During examination of the otolith images, the observed daily growth increments and number of annual otolith translucent–opaque zones from the nucleus to the outer edge of the otolith ventral arm were counted. Each otolith specimen was examined twice by a well-trained person, with an interval of >2 weeks separating each examination. The otolith reading precision levels of the two rounds of counting were evaluated by applying the average percentage error (APE) method proposed by Beamish and Fournier [29]. The APE formula is as follows:
APE   = 100 %   × 1 R i = 1 R X ij X j ,
where R is the number of reading rings, Xij is the reading ring value or estimated age of sample j in interpretation i, and Xj is the average value of the reading ring value or estimated age of sample j.

2.3. Validation of Otolith Opaque Zone Formation

Marginal zone analysis (MZA) was performed to validate the periodicity of the opaque zone deposits in the otoliths of S. commerson. The MZA method is widely used to investigate fishery-targeted species (e.g., [30]); it is also used to examine fish species for which rearing experiments and mark–recapture researches are infeasible. Each otolith section (excluding those of the eight juvenile S. commerson specimens) was checked to verify whether the otolith edge type was translucent or opaque, and the ratio of translucent margins to opaque edges of the otoliths collected every month was calculated to infer the time and periodicity of translucent and opaque zone formation. Given the timing of birth, catch month, and otolith edge type, the estimated age can be adjusted to and expressed in years and months [24]. We assumed that the S. commerson specimens had hatched in May given the results of a recent reproductive study [28]. Two formulas were developed to calculate the decimal ages of fish caught in different months and with different otolith edge types:
Age = ( ( 5 + ( 12 × ( n 1 ) + ( m + 3 ) ) / 12 ,
Age = ( ( 5 + ( 12 × ( n 1 ) + ( m 9 ) ) / 12 ,
where n is the number of opaque zones, and m is the month of capture. When a specimen’s otolith edge was translucent, its age was calculated using Equation (2). When the specimen’s otolith edge was opaque and the fish had been caught between January and June, its age was also calculated using Equation (2). Conversely, when a specimen’s otolith edge was opaque and the fish was caught between July and December, its age was calculated using Equation (3).

2.4. Growth and Sex Ratio Analysis

The observed length-at-age data (sex-specific and sex-combined data) were fitted using the von Bertalanffy growth function (VBGF; [31]) and the nonlinear least squares method. The sexes of the eight juvenile fish were unknown, and these fish were only included in the sex-combined growth analysis. The growth equation was as follows: L t = L ( 1 + e k   ( t t 0 )   , where L t is the FL (in cm) at age t (in y), L is the theoretical asymptotic FL, k (y−1) is the growth coefficient that describes how quickly the asymptotic FL was attained, and t0 is the theoretical age at which the FL equaled 0. Per the method developed by Kimura [32], we plotted a 95% confidence interval ellipse graph around the k and L estimates to compare the growth coefficients of male and female specimens. A maximum likelihood ratio test [32] was used to test the growth difference among sexes. Moreover, the growth parameters k and L were used to calculate the growth-performance index (Φ’ = lnk + 2 ln L ).
The sex ratio (percent females) of S. commerson was calculated by the age class. Chi- square (χ2) test was used to examine differences from an expected 1:1 only for the age class 0 to 4 y because the sample sizes of the fish with age > 5 y were too small for the statistical analysis.

2.5. Age Composition Estimation by Using an Age–Length Key

An age–length key (ALK, [33]) for the S. commerson specimens was derived using the otolith direct aging data and the FLs of the 654 fish specimens (351 female specimens, 295 male specimens, and 8 juvenile specimens without sex data). The FLs of the S. commerson specimens ranged from 45 to 145 cm, and the specimens were grouped according to 5 cm length intervals. Each cell of the ALK indicates the proportions of different age groups in fish with an FL in the specified length interval. Thereafter, for the 16,133 fish whose FLs were measured at the Penghu fish market, the total number of fish in each length interval was multiplied by the ratio of each length interval that corresponded to a given age in the ALK. The age composition of the 16,133 fish was estimated by summing the length classes to obtain the value for each age class.

2.6. Analysis of Mortality and Exploitation Rate

Total mortality (Z) was estimated based on Ricker’s [34] catch curve: ln(N) = AZt, where A is a constant, and t is age. Natural mortality was estimated by the equation ln (M) = −0.0066 − 0.2793 × ln( L ) + 0.6543 ln(k) + 0.463 ln(T) [35], where L (cm FL) and k (y−1) are parameters of the von Bertalanffy growth function, and T (°C) is the annual mean sea water temperature of 25 °C, which was measured by the Conductivity-Temperature-Depth probes (SBE 911 plus, SeaBird Electronics Inc., Bellevue, WA, USA). Fishing mortality (F) was then estimated as F = ZM, and the exploitation rate (E) was estimated as E = (F/Z) [36].

3. Results

3.1. Regression of Otolith Size and FL

The results obtained from the S. commerson specimens indicate a positive linear relationship between the otolith long axis and the FL when considering both combined and separate sexes (Table 1). The slope of the linear regression was slightly but still significantly higher for the female specimens than the male specimens (ANCOVA, p < 0.001). This small but significant difference was likely related to the larger female specimens in the regression analysis. Nevertheless, these results suggest that otolith size is a good proxy for FL in S. commerson.

3.2. Structure of Otolith Sections

The transverse otolith sections had a narrow core area, which extended the growth to a dorsal (short) arm and a ventral (long) arm. An inflection (elbow) point appears in both the dorsal and ventral arms of otolith specimens when the fish had an FL of approximately >65 cm (range: 50–90 cm; n = 130). Concentric growth increments were visible near the core area, and then the rings became difficult to observe because of the appearance of radial striae in the antisulcus half of the ventral arm around the inflection (Figure 2). The first opaque zone was always adjacent to and beyond the inflection, and the ventral arm provided the most easily readable opaque zones. Therefore, the opaque zones in the ventral arm were counted to estimate the age of the S. commerson specimens. A false annulus frequently appeared between the first and second opaque zones; it could be identified by its shorter opaque patch, which lacked complete growth layers connecting the antisulcus and sulcus sides. Among the otoliths examined, 165 samples showed the false rings that can be easily identified, and the false rings were not counted for age determination.

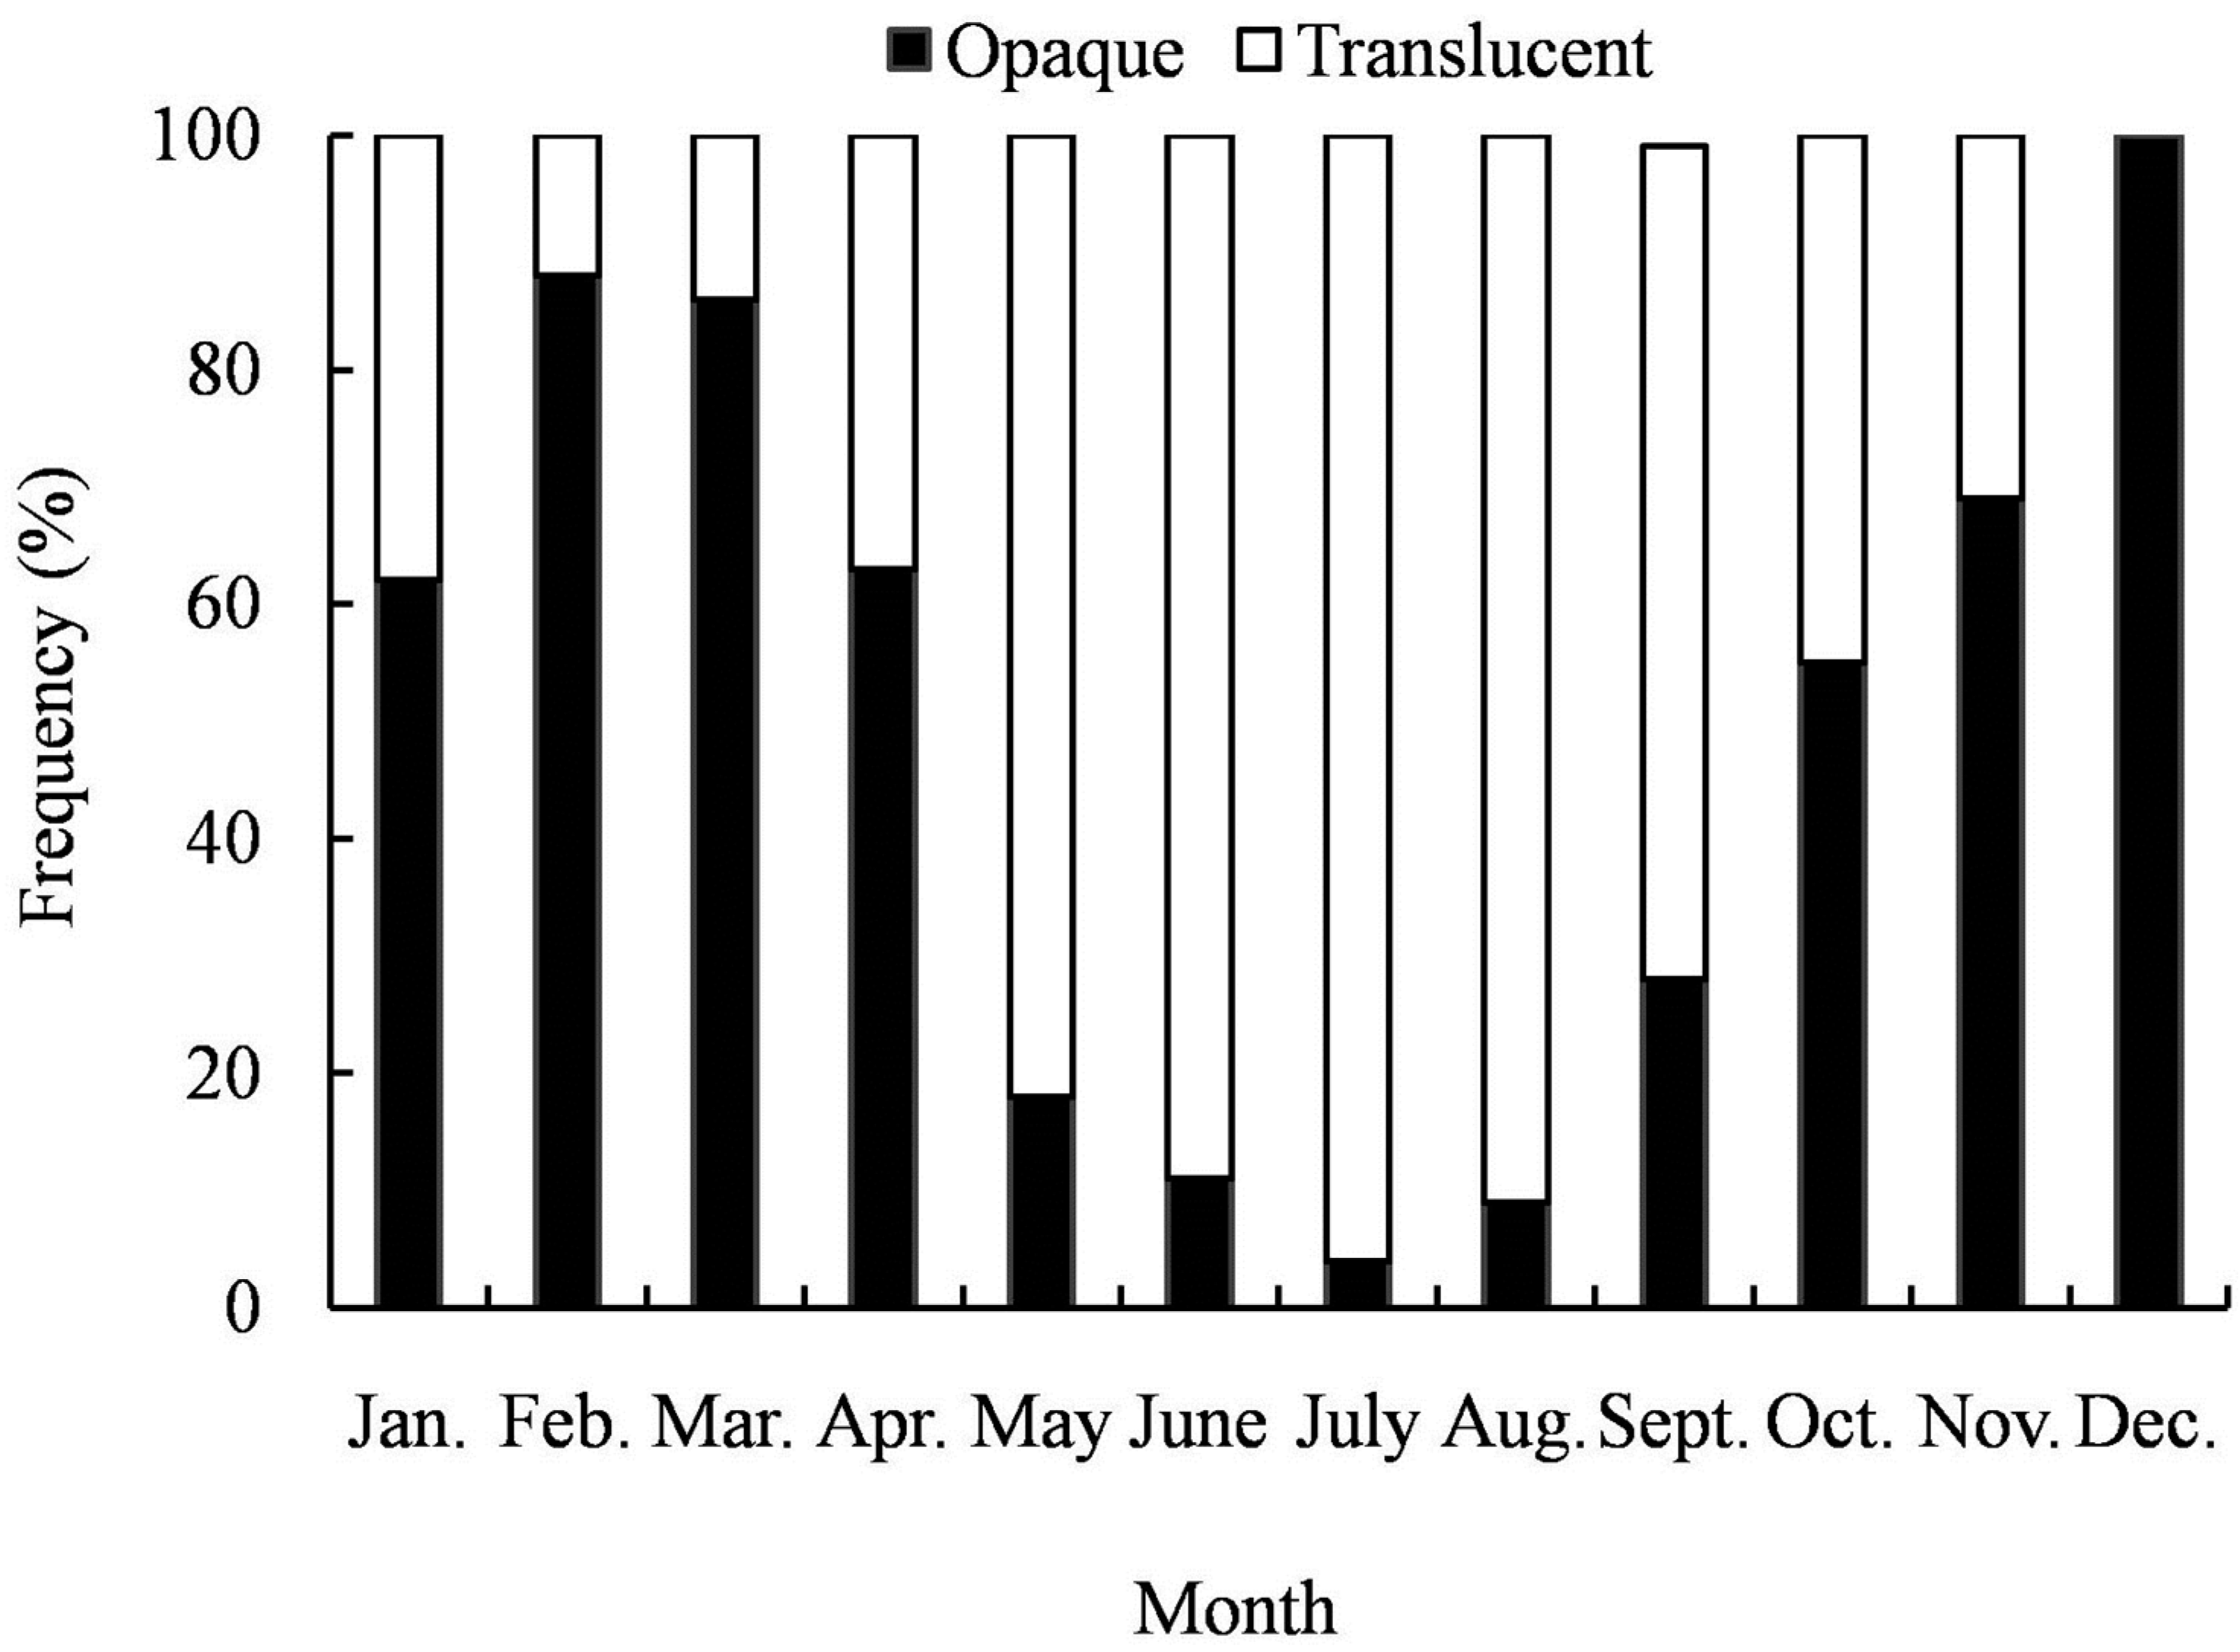
3.3. Formation of Opaque Zones

Opaque zones were present on the otolith edge for >50% of the specimens caught between October and April, and the occurrence of opaque zones peaked at 100% (i.e., all specimens) in December (i.e., winter in Taiwan; Figure 3). Opaque zones were rarely present on the otolith edge of specimens caught between May and August, and the minimum frequency of occurrence, 3%, was obtained for specimens caught in July. The annual peak in the occurrence of opaque edges in winter suggested that the opaque zone formed annually. Therefore, one translucent zone plus one opaque zone was defined as a year. Furthermore, among the S. commerson specimens with only one opaque zone in their otolith (n = 55), an opaque edge formed between November and March in 78.2% (n = 43) of the specimens, and an opaque edge during the other months in only 21.8%. This finding suggested that the first otolith opaque zone forms in winter.

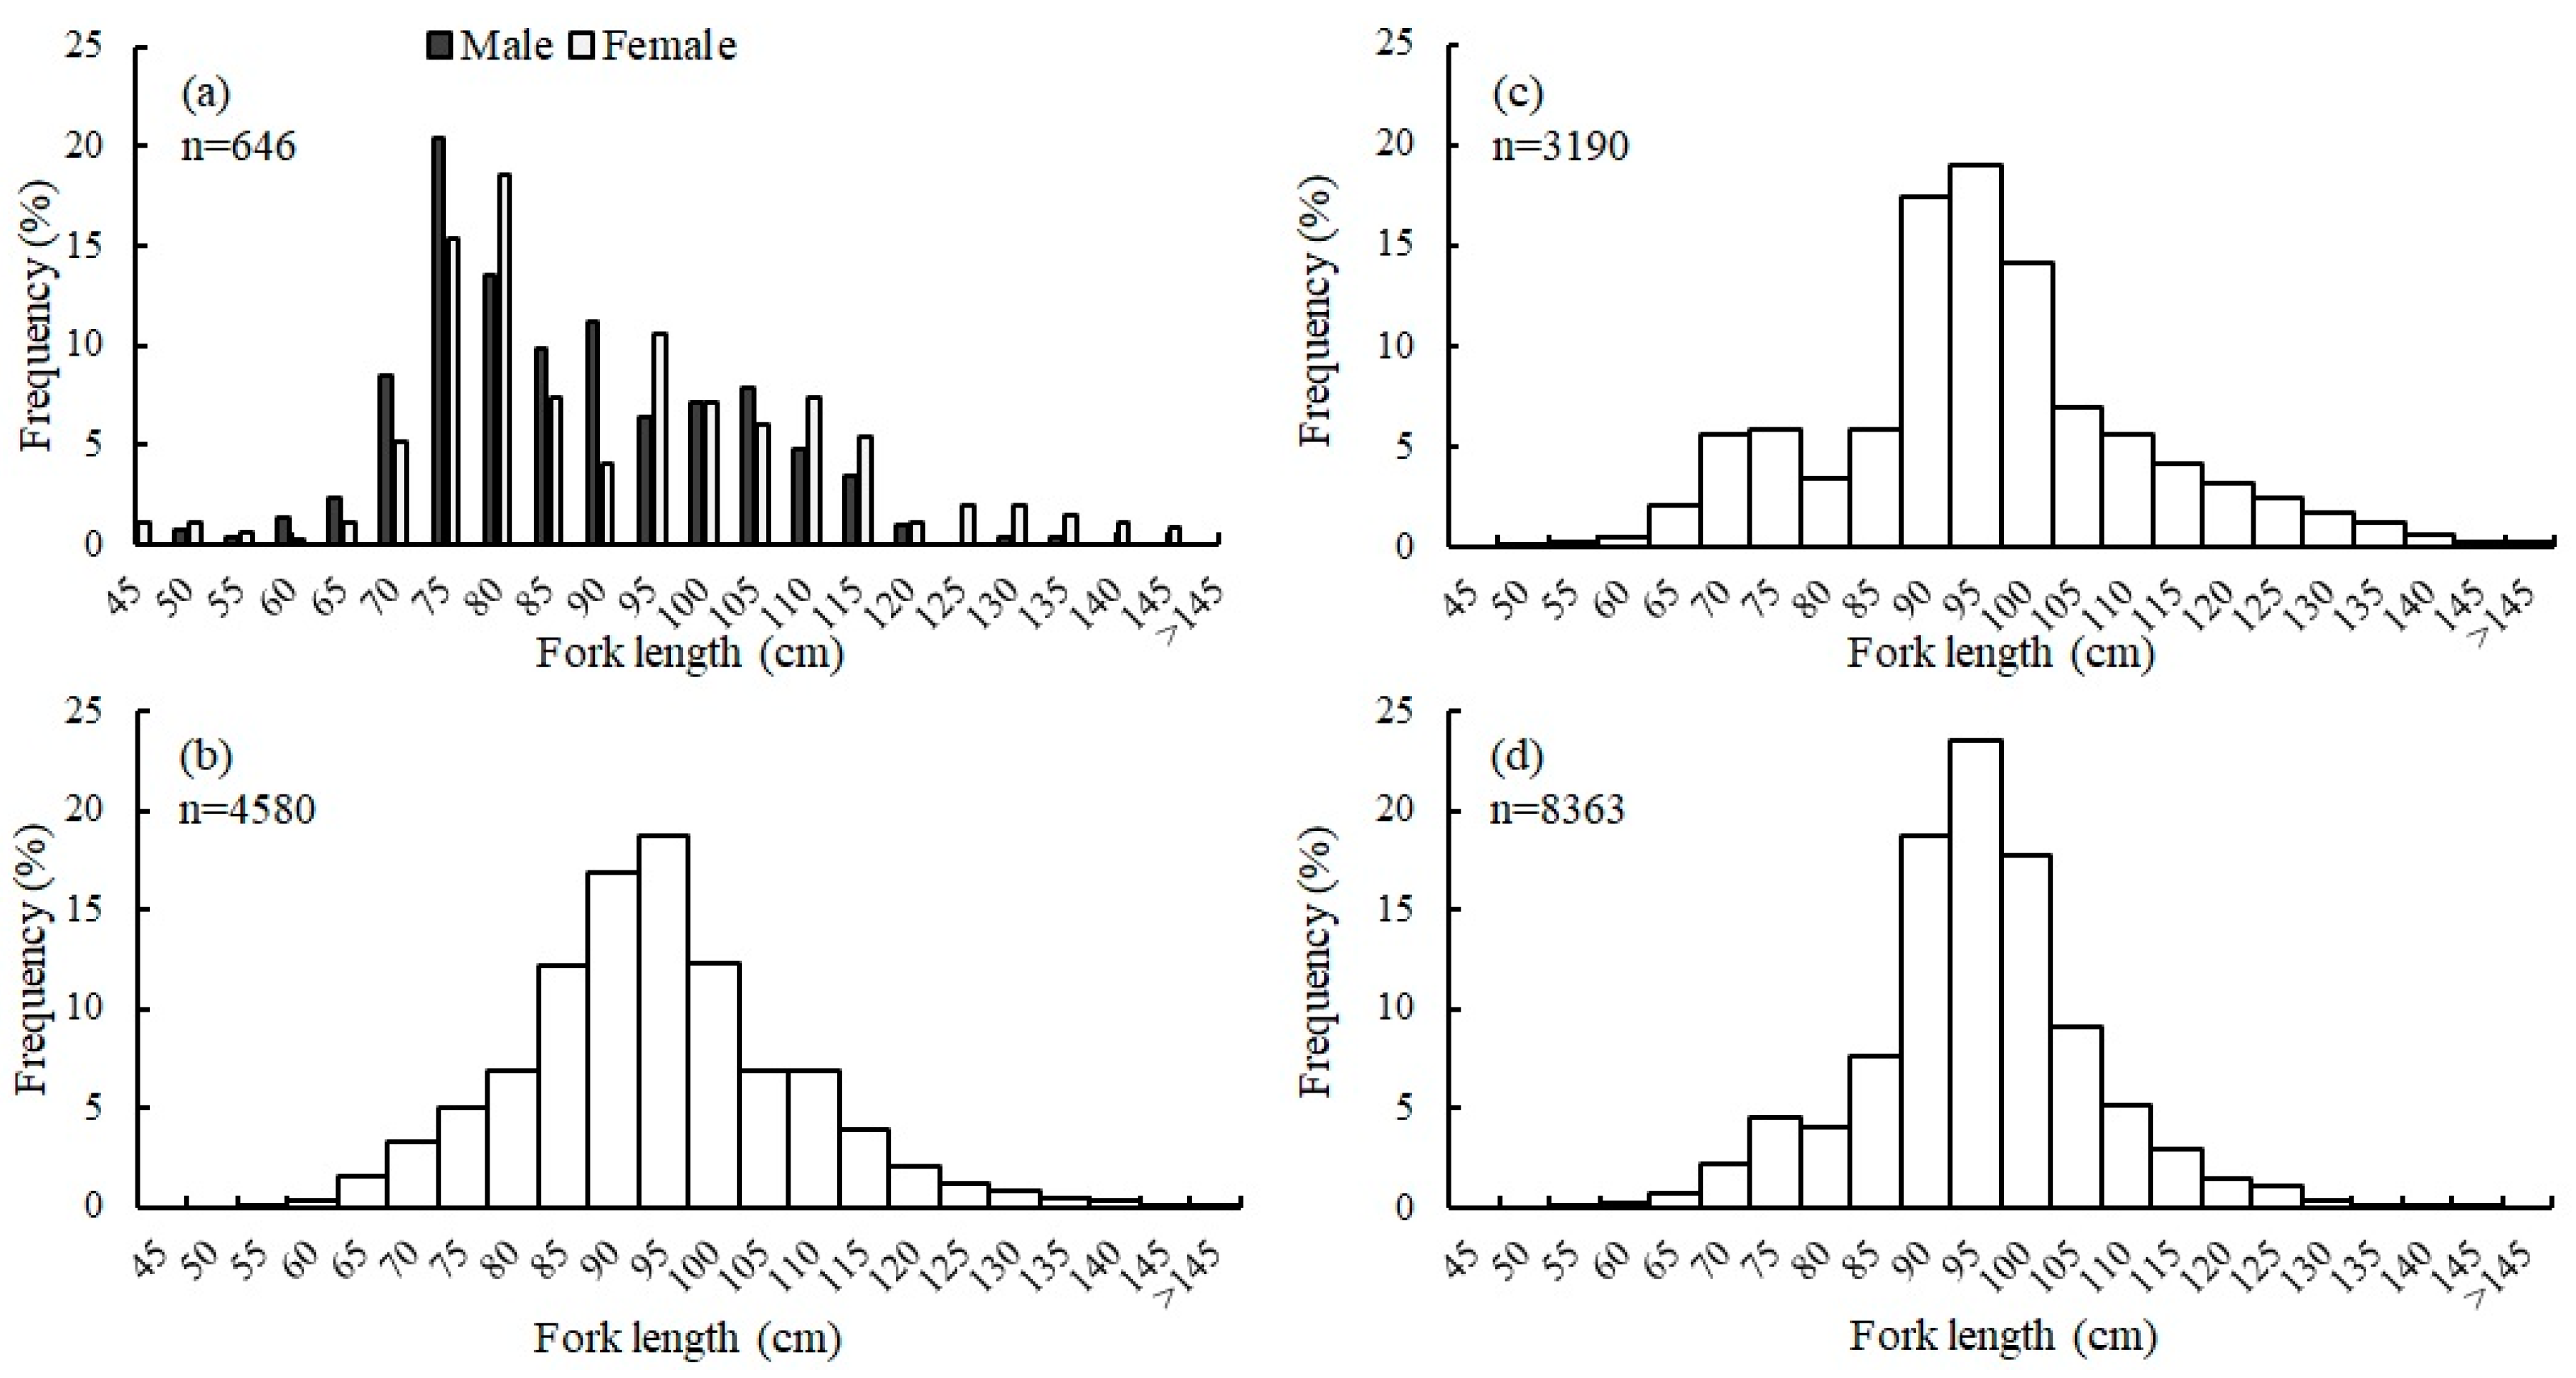
3.4. Size and Age Composition

Otoliths were collected from 654 specimens, namely 351 female specimens, 295 male specimens, and 8 juvenile fish specimens. The FLs of the female and male specimens ranged from 35.0 to 159 cm and from 34.5 to 135 cm, respectively. The most frequently observed FLs for male (20.4%) and female (18.6%) specimens were 75 and 80 cm, respectively (Figure 4a). The mean ages of the 351 female and 295 male specimens were 1.8 y ± 1.8 (range: 0.2–9.2 y) and 1.6 y ± 1.0 (range: 0.3–7.2 y), respectively (Figure 5). An APE of 1.2% was obtained for two readings of the 646 otolith images made by an otolith reader. A sex-combined ALK (Table A1) was derived from the otolith direct aging data and corresponding FLs of the specimens. The ALK was then used to estimate the age composition of the 16,133 specimens whose FLs were measured at the fish market. The FL of the 16,133 S. commerson specimens exhibited a unimodal distribution that peaked at the 95 cm interval; this interval accounted for 21.4%, 20.6%, and 25.0% of the specimens caught using longlines, trolling lines, and drift gillnets, respectively (Figure 4). With respect to estimated age composition, the 16,133 specimens were mainly aged from 1 to 2 y (this age range accounted for 83.6%–85.7% of the annual total catch from 2018 to 2021) followed by the ages of 0 (5.02%–7.1%) and 3 y (5.3%–7.7%; Appendix A, Table A2; Figure 5c). Specimens aged >4 y accounted for only 3.0% of the total catch.

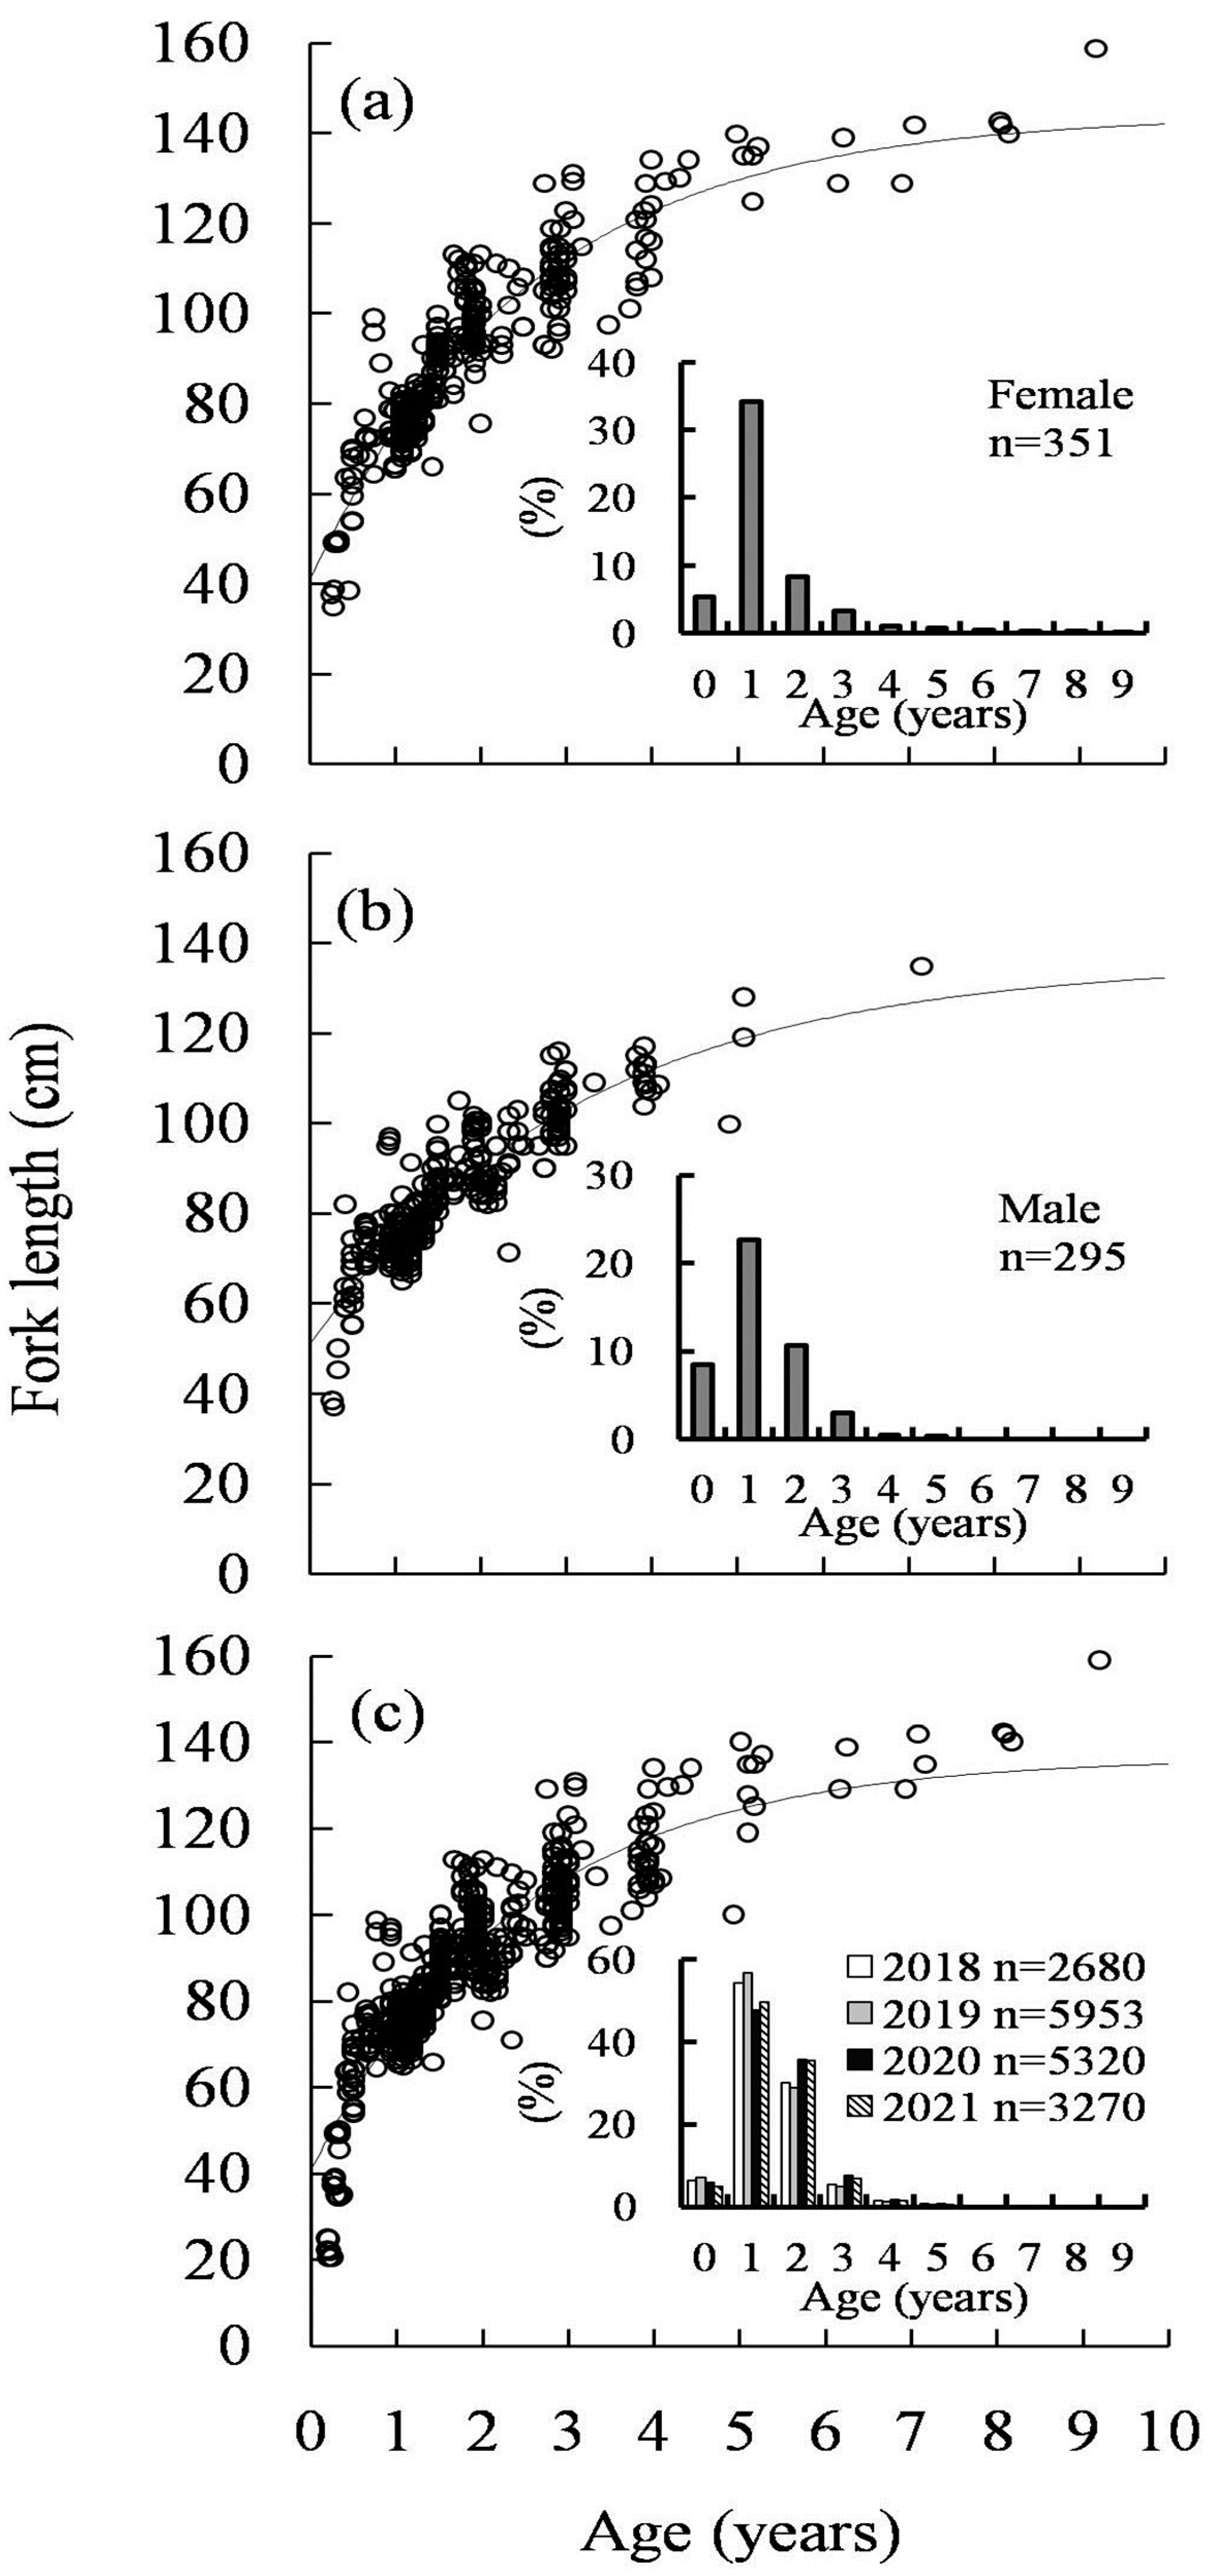
3.5. Growth Model Analysis

The growth parameters of VBGF were estimated for male specimens, female specimens, and sex-combined specimens. Specifically, L = 144.1 cm, k = 0.39 y−1, and t 0 = −0.85 y for the female specimens; L = 136.0 cm, k = 0.32 y−1, and t 0 = −1.49 y for the male specimens; and L = 136.5.1 cm, k = 0.41 y−1, and t 0 = −0.86 y for the sex-combined specimens (Figure 5). The growth-performance index (Φ’) based on the abovementioned growth parameters was 9.0 and 8.7 for the female and male S. commerson (Table 2). The estimated growth parameters (k and L ) with a 95% confidence interval exhibited an elliptical distribution and did not overlap between sexes (Figure 6). A significant difference in growth parameters was discovered between male and female specimens (maximum likelihood-ratio test, p < 0.01). Both male and female specimens grew most quickly before the age of 1 y; however, a slight difference was observed with respect to average FL (male specimens, 69.4 cm; female specimens, 65.6 cm) at ages <1 y. At age 2 y, the growth rate of female specimens was significantly higher (t test, p < 0.001) than that of the male specimens (female specimens, 103.9 cm; male specimens, 96.2 cm). At age 3 y, the FL of the female specimens (114.5 cm) was still greater than that of the male specimens (109.6 cm). Significantly fewer male fish specimens were aged > 4 y, with only five such specimens being collected (Figure 5b). The older group of specimens exhibited female predominance. The oldest female specimen was aged 9.2 y (159 cm), whereas the oldest male fish was aged 7.2 y (135 cm; Figure 5a,b).

3.6. Mortality and Exploitation Rate

The annual instantaneous rate of total mortality at (Z) derived from the age-base catch curve was 0.90 y−1. The annual instantaneous rate of natural mortality (M) derived from the equation Pauly [35] was estimated as 0.64 y−1 using the maximum age of 9.2 y. The annual instantaneous rate of fishing mortality at (F) was estimated as 0.27 y−1, and the exploitation rate (E) was 0.30.

3.7. Sex Ratio

Regarding the specimens’ sex ratios, a significant difference was observed in specimens aged 0 to 1 y (χ2, p < 0.05; Table 3). The sex ratio skewed to male specimens at age 0 y and to female specimens at age 1 y. The small samples did not enable the detection of differences in sex ratio after the age of 2 y.

4. Discussion

This study provides comprehensive information on the growth parameters, age composition, mortality, and sex ratio of the S. commerson caught in the Taiwan Strait. The data reported herein can also be used to determine recruitment dynamics, which are required for conducting age-structured stock assessment modelling.

4.1. Age Validation

Studies should examine the age and growth of otoliths on the basis of validated periodic growth increments [37]. Otolith marginal zone analysis is regarded as an appropriate and effective method for performing age validation [18]. This method was used in several studies to validate the opaque zones of otoliths in S. commerson from various oceanic regions. However, the clarity, readability, and timing of opaque zone formation in otoliths usually vary by fish habitat and geological location [38]. For example, opaque zones form in the otoliths of S. commerson between September and December in South Africa [16,21], between July and October in eastern Australia [3], between November and March in Western Australia, and between July and September in the Arabian Gulf [24]. Therefore, validation of otolith opaque zone formation among S. commerson inhabiting the Taiwan Strait was required. Our results suggested that opaque zones form in otoliths annually in winter; this finding is consistent with that of Chen [26], who discovered that S. commerson in this area developed their first otolith annulus ring between October and December. Collectively, the findings of the present study and those of the aforementioned studies conducted in other regions suggest that the development of translucent and opaque zones in the otoliths of S. commerson follows a seasonal pattern and is influenced by water temperature. Other than seawater temperature, seasonal fluctuations in primary productivity and food supply may also affect the deposition of translucent and opaque zones in the otoliths of S. commerson [24]. This phenomenon is observed in numerous subtropical and tropical species, in which opaque zones develop in otoliths during the cold season when fish metabolism is lower, and translucent zones develop during periods of accelerated growth (e.g., [39,40]).

4.2. Verification of Otolith Direct Aging

The precision of otolith direct aging has varied among multiple studies; APEs of 0.9% in Queensland [3], 14.4% in the Arabian Sea [24], 11.2% in South Africa [23], 20.3% in Australia [21], and 1.2% in Taiwan (i.e., the present study) have been reported. Aging precision is influenced by several factors such as the otolith preparation method, presence of false annual rings, and the readers’ experience. Some S. commerson specimens had otoliths with two opaque zones developed within 1 y, with one zone being wider than the other [19,21]. The secondary narrow opaque zone usually appears as fine lines between opaque zones, and it is not regarded as an annulus ring [3,41]. Lee [23] conducted a tag and recapture experiment, which indicated that opaque zone deposition occurs once a year, and narrow opaque zones should be regarded as false annuli. In some individual specimens, real annuli were combined with later increments during later growth, thus creating another pair of wide and narrow opaque zones (Figure 2; [42]). False annuli increase aging bias, and identifying them can sometimes be difficult. Nevertheless, the high reading precision in the present study could mainly be attributed to the young age of the fish specimens, a clear definition of false annuli, and high readability of opaque zones, all of which reduced the reading bias relating to otolith direct aging.

4.3. Fish Longevity and Age Composition of the Catch

The maximum age of the S. commerson observed in this study was lower than those estimated by researchers in other regions. For example, the maximum ages of male and female specimens were respectively 15.3 and 16.2 y in Saudi Arabia [24] and 14.6 and 13.57 y in South Africa [23]. In Oman, the maximum age of female specimens was 20 y (Table 2; [4]). McPherson [3] reported that the maximum age of native fish in Northeastern Queensland was 14 y (FL of 155 cm and BW of 35 kg), considerably older than the maximum age of 9.2 y observed in the present study (FL of 159 cm and BW of 27 kg). The lower maximum age observed in the present study does not imply a shorter lifespan for the S. commerson in the Taiwan Strait. Large fish are rarely caught in the Taiwan Strait because of the fishing gear selectivity of the hook and drift gillnet used in fishery operations. Moreover, large fish are priced highly and always delivered to restaurants without dissection, which is usually performed at a fish market. All of these factors substantially increase the difficulty of collecting the otoliths of large and older fish. Nevertheless, more than 650 specimens were sampled for otolith direct aging, and the FLs of 16,133 specimens were measured. The results clearly indicated that the S. commerson caught in the Taiwan Strait were mostly aged between 1 and 2 y. Similar results have been reported by studies conducted in the coastal waters of Oman [4] and South Africa [23], where the catches of S. commerson were predominantly aged between 0 and 2 y and between 1 and 3 y, respectively. The reason for the absence of older S. commerson in the Taiwan Strait is unclear; however, it may be related to the migratory life history of the species, which involves older fish moving to surrounding areas such as the South China Sea. Further studies should conduct tag and recapture experiments to clarify the migratory life history of S. commerson in this region. The truncated age structure may also indicate overfishing or high fish mortality in relation to the stock in the Taiwan Strait.

4.4. Fish Growth among Regions and between Sexes

Although the growth parameters (k and L ) of the S. commerson specimens examined in this study were within the range reported by other researchers, our estimated parameters are evidently different from those for stocks living in other oceanic regions and from those reported in an earlier study conducted in the Taiwan Strait ([26]; Table 2). Chen [26] determined the ages of fish specimens by examining the whole otolith rather than a thin otolith section, which limited Chen’s analysis to fish aged between 1 and 6 y. Although the growth-performance index (Φ’) of S. commerson in this study was comparable to the values in other regions, the low Φ’ index based on Chen’s study [26] was very different from ours and other studies. However, a meaningful comparison of the results derived using different otolith preparation methods cannot be conducted because of the uncertainty relating to aging biases between multiple studies.
The growth parameter k of the S. commerson specimens in the Taiwan Strait was higher than the estimated values reported by studies conducted in several other regions, with the exceptions being the stocks in Northeastern Queensland and the Northern Persian Gulf. The high growth parameter k obtained in the present study could be attributed to the high proportions of younger fish used in the study for assessing fish growth; however, other factors such as oceanic conditions, exploitation rate, and genetics could also have contributed to the differences in the growth of fish stocks across multiple geographical locations [43,44]. For example, the higher fish growth rate may have been related to the high number of bait organisms that gather in the seasonally mixed thermal front by the Kuroshio Current branches and South China Sea water masses around the Penghu islands [45].
In addition, sexual dimorphisms in S. commerson growth have been reported in multiple studies obtaining varying results. Devaraj [19] revealed no significant difference in growth between male and female S. commerson in India. However, the studies conducted in Northeastern Queensland indicated that female specimens grew faster and lived longer than male specimens [3,7]; this finding corresponds to the results of the present study. By contrast, McIlwain et al. [4] and Ballagh et al. [25] reported that among fish specimens collected from the Gulf of Oman and Arabian Sea, the female specimens grew more slowly than the male specimens but were larger when they had reached an asymptotic size. Although the present study verified sexual dimorphism in the growth of S. commerson, future studies should examine more size classes (particularly those that are closer to the maximum size of the species) to refine the growth parameter estimations for male and female S. commerson. A comprehensive understanding of the sexual dimorphisms of this species can improve the accuracy and precision of stock assessments, and such understanding can be achieved by applying a sex-specific age-structured assessment method [46].

4.5. Mortality, Sex Ratio, and Suggestions for Fishery Management

Many factors can affect the fluctuations of fish population; however, fishing was one of the important factors which led to the decrease in abundance [47]. The exploitation rate of a fish stock larger than 0.4 can be considered as overfishing of the stock [20]. In this study, the fishing mortality and exploitation rate of S. commerson in the Taiwan Strait were 0.27 y−1 and 0.3, suggesting that this stock is not overexploited. However, the reasons resulting in a large reduction in the total landings of S. commerson from 6600 to 517 metric tons during the periods of 2002 and 2019 need further investigation.
The sex ratio and age at sexual maturity are essential biological parameters used in stock assessments, particularly those that utilize age- and size-structured models. The present study discovered that the sex ratio skewed to male and female specimens at the ages of 0 and 1 y, respectively. However, our limited sample size did not allow us to determine the sex ratio for the full life span of S. commerson. Rose et al. [48] examined 2306 S. commerson specimens and discovered that small specimens (60–100 cm FL) exhibited male predominance; however, female predominance (>50%) was observed among specimens with an FL of >100 cm, and specimens with an FL of >130 cm were all female (Figure 4a). These results indicate that fishery management strategies that reduce fishing mortality among S. commerson with an FL > 100 cm can help protect the spawning stock biomass of this species. For example, greater proportions of female S. commerson are caught by longline and trolling fishery [22,49]; hence, these methods can be temporarily prohibited during the spawning season to reduce the catch of female fish. However, the catch of S. commerson has substantially decreased due to high demand, unregulated fishing practices, and overexploitation. To protect the S. commerson resource in the Taiwan Strait, Taiwan’s exploitation rate should be reduced through control measures such as reduction of the length of drift gillnets and implementation of a fishing moratorium during the spawning season.

5. Conclusions

S. commerson grows rapidly before the age of 1. The average growth rate of female fish is higher than that of male fish, with a maximum age of 9.2 and 7.2 y, respectively. The occurrence rate of opaque zones was highest in November and March (especially in winter), which was estimated to be related to the season and complex environmental factors. This study provides information regarding the age structure and growth parameters as well as the age composition of catch, and the information can be used as crucial reference information for future fishery management.

Author Contributions

Conceptualization, J.-S.W. and M.-A.L.; methodology, J.-S.W., L.-C.C., Y.-S.L. and J.-S.H.; data curation, J.-S.W.; writing—original draft preparation, J.-S.W. and L.-C.C.; writing—review and editing, J.-C.S. and K.-M.L.; project administration, J.-S.W.; funding acquisition, J.-S.W. All authors have read and agreed to the published version of the manuscript.

Funding

This study was financially supported by the Council of Agriculture, Executive Yuan, Taiwan, ROC on contracts 108AS-9.2.3-AI-A1, and 109AS-9.2.3-AI-A3.

Institutional Review Board Statement

Approvement for animal welfare in this study is not required because the fish landed were all dead.

Informed Consent Statement

Not applicable.

Data Availability Statement

The raw data of individual age, FL, WT and sex presented in this study are available on request from the corresponding author.

Acknowledgments

We would like to thank captain J. J. Horng for is assistance during the study period.

Conflicts of Interest

The authors declare no conflict of interest.

Appendix A

Table A1. The age–length key for sex-combined S. commerson from the otolith study.
FL (cm)Age (Years)Total
0123456789
<4514---------14
506---------6
553---------3
605---------5
65101--------11
701726--------43
7524891-------114
8011931-------105
852467-------55
9013313-------47
95136181------56
1004211941-----46
105-132710------44
110-522143-----40
115-4112------29
120--3111----7
125---511----7
130--12212---8
135---122-1--6
140-----21-1-4
145-------12-3
>145---------11
Total98367123401073231654
Table A2. The estimated age distribution of the entire landing for S. commerson.
FL (cm)Age (Years)Total
0123456789
Percentage (%)
<450.00---------0
50100.00---------4
55100.00---------15
60100.0---------44
6590.809.20--------174
7039.5460.46--------435
7520.9878.130.89-------567
8010.5688.490.95-------426
853.6480.0316.33-------1182
902.1170.2227.67-------2794
951.7964.2532.161.80------3734
1008.7045.6541.302.162.19-----2966
105-29.5761.339.10------1593
110-12.5154.9925.037.47-----951
115-13.8837.9048.22------533
120--42.8128.4314.3814.38----299
125---71.2814.3614.36----188
130--12.8424.7724.7812.8424.77---109
135---16.1333.8733.87-16.13--62
140-----48.4824.24-27.28-33
145-------33.3366.67-15
>145---------1009
Total6.0952.2132.516.361.570.750.230.100.120.0616,133

References

  1. Randall, J.E.; Hoover, J.P. Coastal Fishes of Oman; Crawford House Publishing Pty Limited: Goolwa, NSW, Australia, 1995. [Google Scholar]
  2. Tobin, A.; Mapleston, A. Exploitation Dynamics and Biological Characteristics of the Queensland East Coast Spanish Mackerel (Scomberomorus Commerson) Fishery; CRC Reef Research Centre, James Cook University: Townsville, QLD, Australia, 2004. [Google Scholar]
  3. McPherson, G.R. Age and growth of the narrow-barred Spanish Mackerel (Scomberomorus commerson Lacepede, 1880) in North-eastern Queensland waters. Aust. J. Mar. Fresh. Res. 1992, 43, 1269–1282. [Google Scholar] [CrossRef]
  4. McIlwain, J.; Claereboudt, M.; Al-Oufi, H.; Zaki, S.; Goddard, J.S. Spatial variation in age and growth of the kingfish (Scomberomorus commerson) in the coastal waters of the Sultanate of Oman. Fish. Res. 2005, 73, 283–298. [Google Scholar] [CrossRef]
  5. Carpenter, K.E. Food and Agriculture Organization of the United Nations. Living Marine Resources of Kuwait, Eastern Saudi Arabia, Bahrain, Qatar, and the United Arab Emirates; Food and Agriculture Organization of the United Nations: Rome, Italy, 1997. [Google Scholar]
  6. Fauvelot, C.; Borsa, P. Patterns of genetic isolation in a widely distributed pelagic fish, the narrow-barred Spanish mackerel (Scomberomorus commerson). Biol. J. Linnean Soc. 2011, 104, 886–902. [Google Scholar] [CrossRef] [Green Version]
  7. Claereboudt, M.R.; McIlwain, J.L.; Al-Oufi, H.S.; Ambu-Ali, A.A. Patterns of reproduction and spawning of the kingfish (Scomberomorus commerson, Lacepede) in the coastal waters of the Sultanate of Oman. Fish. Res. 2005, 73, 273–282. [Google Scholar] [CrossRef]
  8. Mackie, M.C.; Lewis, P.D.; Gaughan, D.J.; Newman, S.J. Variability in spawning frequency and reproductive development of the narrow-barred Spanish mackerel (Scomberomorus commerson) along the west coast of Australia. Fish. Bull. 2005, 103, 344–354. [Google Scholar]
  9. Niamaimandi, N.; Kaymaram, F.; Hoolihan, J.P.; Hossien, G.; Seyed, M.; Fatemi, R. Conservation. Population dynamics parameters of narrow-barred Spanish mackerel, Scomberomorus commerson (Lacèpéde, 1800), from commercial catch in the northern Persian Gulf. Glob. Ecol. 2015, 4, 666–672. [Google Scholar]
  10. Govender, A.; Al-Oufi, H.; McIlwain, J.; Claereboudt, M.C. A per-recruit assessment of the kingfish ( Scomberomorus commerson) resource of Oman with an evaluation of the effectiveness of some management regulations. Fish. Res. 2006, 77, 239–247. [Google Scholar] [CrossRef]
  11. Shojaei, M.G.; Motlagh, S.A.T.; Seyfabadi, J.; Abtahi, B.; Dehghani, R. Age, growth and mortality rate of the narrow-barred Spanish Mackerel (Scomberomerus commerson Lacepede, 1800) in coastal waters of Iran from length frequency data. Turk. J. Fish. Aqu. Sci. 2007, 7, 115–221. [Google Scholar]
  12. O’Neill, M.F.; Tobin, A. Torres Strait Spanish Mackerel; Department of Agriculture and Fisheries: Brisbane, QLD, Australia, 2015. [Google Scholar]
  13. Fisheries Agency. Fisheries Statistical Yearbook Taiwan, Kinmen and Matsu; Fisheries Agency, Council of Agriculture, Executive Yuan: Taipei, Taiwan, 2020. [Google Scholar]
  14. Hüssy, K.; Radtke, K.; Plikshs, M.; Oeberst, R.; Baranova, T.; Krumme, U.; Sjöberg, R.; Walther, Y.; Mosegaard, H. Challenging ICES age estimation protocols: Lessons learned from the eastern Baltic cod stock. ICES. J. Mar. Sci. 2016, 73, 2138–2149. [Google Scholar] [CrossRef]
  15. Ballagh, A.C.; Welch, D.; Williams, A.J.; Mapleston, A.; Tobin, A.; Marton, N. Integrating methods for determining length-at-age to improve growth estimates for two large scombrids. Fish. Bull. 2011, 109, 90–100. [Google Scholar]
  16. Lee, B. The Biology of and Fishery for King Mackerel, Scomberomorus Commerson (Scombridae), along the Southern Mozambique and KwaZulu-Natal Coast; Oceanographic Research Institute: Durban, South Africa, 2013. [Google Scholar]
  17. Haddon, M. Modelling and Quantitative Methods in Fisheries; Taylor & Francis: New York, NY, USA, 2001. [Google Scholar]
  18. Campana, S.E.; Thorrold, S.R. Otoliths, increments, and elements: Keys to a comprehensive understanding of fish populations? Can. J. Fish. Aquat. Sci. 2001, 58, 30–38. [Google Scholar] [CrossRef]
  19. Devaraj, M. Age and growth of three species of seerfishes scomeromorus commersou, S. guttatus and S. lineolatus. Indian J. Fish. 1981, 28, 104–127. [Google Scholar]
  20. Al-Hosni, A.H.S.; Siddeek, M.S. Growth and mortality of the narrowbarred Spanish Mackerel, Scomberomorus commerson (Lacepede), in Omani waters. Fish. Manag. Ecol. 1999, 6, 145–160. [Google Scholar] [CrossRef]
  21. Govender, A. Growth of the king mackerel (Scomberomorus commerson) off the coast of Natal, South Africa— from length and age data. Fish. Res. 1994, 20, 63–79. [Google Scholar] [CrossRef]
  22. Govender, A. Mortality and biological reference points for the king mackerel (Scomberomorus commerson) fishery off Natal, South Africa (based on a per-recruit assessment). Fish. Res. 1995, 23, 195–208. [Google Scholar] [CrossRef]
  23. Lee, B.; Mann, B.Q. Age and growth of narrow-barred Spanish mackerel Scomberomorus commerson in the coastal waters of southern Mozambique and KwaZulu-Natal South Africa. Afr. J. Mar. Sci. 2017, 39, 397–407. [Google Scholar] [CrossRef]
  24. Grandcourt, E.M.; Abdessalaam, T.Z.; Francis, F.; Al Shamsi, A.T. Preliminary assessment of the biology and fishery for the narrow-barred Spanish mackerel, Scomberomorus commerson (Lacépède, 1800), in the southern Arabian Gulf. Fish. Res. 2005, 76, 277–290. [Google Scholar] [CrossRef]
  25. Ballagh, A.C.; Begg, G.A.; Mapleston, A.; Tobin, A. Growth trends of Queensland east coast Spanish mackerel (Scomberomorus commerson) from otolith back-calculations. Mar. Fresh. Res. 2006, 57, 383–393. [Google Scholar] [CrossRef]
  26. Chen, T.S. Studies on the age, growth, maturity and spawning of Spanish mackerel Scomberomorus commersoni (Lacépéde) in Taiwan Strait. Bull. Taiwan Fish. Res. Inst. 1973, 22, 103–108. [Google Scholar]
  27. Wang, H.Y.; Shen, S.F.; Chen, Y.S.; Kiang, Y.K.; Heino, M. Life histories determine divergent population trends for fishes under climate warming. Nat. Commun. 2020, 11, 4088. [Google Scholar] [CrossRef]
  28. Weng, J.S.; Yu, S.F.; Lo, Y.S.; Shiao, J.C.; Lee, M.A.; Liu, K.M.; Huang, H.H.; Wang, Y.C.; Wu, L.J. Reproductive biology of the narrow-barred Spanish mackerel (Scomberomorus commerson) in the central Taiwan Strait, western Pacific. Deep Sea Res. Part II 2020, 175, 104755. [Google Scholar] [CrossRef]
  29. Beamish, R.J.; Fournier, D.A. A Method for Comparing the Precision of a Set of Age Determinations. Can. J. Fish. Aquat. Sci. 1981, 38, 982–983. [Google Scholar] [CrossRef]
  30. Radebe, P.; Mann, B.; Beckley, L.; Govender, A. Age and growth of Rhabdosargus sarba (Pisces: Sparidae), from KwaZulu-Natal, South Africa. Fish. Res. 2002, 58, 193–201. [Google Scholar] [CrossRef]
  31. von Bertalanffy, L. A quantitative theory of organic growth. Hum. Biol. 1938, 10, 181–213. [Google Scholar]
  32. Kimura, D. Likelihood methods for the von Bertalanffy growth curve. Fish. Bull. 1980, 77, 765–776. [Google Scholar]
  33. FriÁriksson, Á. On the Calculation of Age-Distribution Within a Stock of Cod by Means of Relatively Few Age-Determinations as a Key to Measurements on a Large Scale. Rapports et Procbs-Verbaux des R6unions, Conseil International Pour Exploration de la Mer. 1934, Volume 86, pp. 1–14. Available online: https://books.google.co.kr/books/about/On_the_Calculation_of_Age_distribution_W.html?id=uCHXzQEACAAJ&redir_esc=y (accessed on 20 November 2021).
  34. Ricker, W.E. Computation and interpretation of biological statistics of fish populations. Bull. Fish. Res. Board Can. 1975, 191, 382. [Google Scholar]
  35. Pauly, D. On the interrelationships between natural mortality, growth parameters, and mean environmental temperature in 175 fish stocks. ICES J. Mar. Sci. 1980, 39, 175–192. [Google Scholar] [CrossRef]
  36. King, M. Fisheries Biology, Assessment and Management, 2nd ed.; Wiley-Blackwell: London, UK, 2007; 400p. [Google Scholar]
  37. Campana, S.E. Accuracy, precision and quality control in age determination, including a review of the use and abuse of age validation methods. J. Fish Biol. 2001, 59, 197–242. [Google Scholar] [CrossRef]
  38. Fowler, A.J. Annulus formation in otoliths of coral reef fish-a review. In Recent Developments in Fish Otolith Research; Secor, D.H., Dean, J.M., Campana, S.E., Eds.; University of South Carolina Press: Columbia, SC, USA, 1995; pp. 45–64. [Google Scholar]
  39. Beckman, D.W.; Wilson, C.A. Seasonal timing of opaque zone formation in fish otoliths. In Recent Developments in Fish Otolith Research; Secor, D.H., Dean, J.M., Campana, S.E., Miller, A.B., Eds.; University of South Carolina Press: Columbia, SC, USA, 1995; pp. 27–44. [Google Scholar]
  40. Hsieh, Y.; Shiao, J.C.; Lin, S.W.; Iizuka, Y. Quantitative reconstruction of salinity history by otolith oxygen stable isotopes: An example of a euryhaline fish Lateolabrax japonicus. Rapid Commun. Mass Spectrom. 2019, 33, 1344–1354. [Google Scholar] [CrossRef]
  41. Newman, S.J.; Mackie, M.C.; Lewis, P.D. Age-based demography and relative fisheries productivity of Spanish mackerel, Scomberomorus commerson (Lacepede) in Western Australia. Fish. Res. 2012, 129, 46–60. [Google Scholar] [CrossRef]
  42. Lewis, P.; Mackie, M.C. Methods Used in the Collection, Preparation and Interpretation of Narrow-Barred Spanish Mackerel (Scomberomorus Commerson) Otoliths for a Study of Age and Growth in Western Australia; Fisheries Research Report No. 143; Department of Fisheries: Perth, WA, Australia, 2002. [Google Scholar]
  43. Lester, R.J.G.; Thompson, C.; Moss, H.; Barker, S.C. Movement and stock structure of narrow-barred Spanish mackerel as indicated by parasites. J. Fish Biol. 2001, 59, 833–842. [Google Scholar] [CrossRef]
  44. Moore, B.R.; Buckworth, R.C.; Moss, H.; Lester, R.J.G. Stock discrimination and movements of narrow-barred Spanish mackerel across northern Australia as indicated by parasites. J. Fish Biol. 2003, 63, 765–779. [Google Scholar] [CrossRef]
  45. Jan, S.; Wang, J.; Chern, C.S.; Chao, S.Y. Seasonal variation of the circulation in the Taiwan Strait. J. Mar. Syst. 2002, 35, 249–268. [Google Scholar] [CrossRef]
  46. Wang, S.P.; Sun, C.L.; Punt, A.E.; Yeh, S.Z. Evaluation of a sex-specific age-structured assessment method for the swordfish, Xiphias gladius, in the North Pacific Ocean. Fish. Res. 2005, 73, 79–97. [Google Scholar] [CrossRef]
  47. Williams, E.H.; Shertzer, K.W. Effects of fishing on growth trait: A simulation analysis. Fish. Bull. 2006, 103, 392–403. [Google Scholar]
  48. Rose, D.; Bailey, S.; Staunton-Smith, J.; Mackenzie, B. Fisheries Long Term Monitoring Program: Summary of Spanish Mackerel (Scomberomorus commerson) Survey Results: 2004–2005; Department of Primary Industries and Fisheries: Brisbane, QLD, Australia, 2006. [Google Scholar]
  49. Claereboudt, M.R.; Al-Oufi, H.S.; McIlwain, J.; Goddard, J.S. Relationships between fishing gear, size frequency and reproductive patterns for the kingfish (Scomberomoms commerson Lacépède) fishery in the gulf of oman. In Management of Shared Fish Stocks; Pogue, A.I.L., O’Brien, C.M., Rogers, S.I., Eds.; Blackwell: Oxford, UK, 2004; pp. 56–67. [Google Scholar]
Figure 1. Sampling area for S. commerson in the Taiwan Strait based on VDR data.
Jmse 09 01346 g001
Figure 2. Photomicrograph of a sagittal section of S. commerson aged 7.08 years (142 cm FL; female). The arrows show the position of opaque zones. The otolith was photo-graphed at Figure 40× magnification.
Jmse 09 01346 g002
Figure 3. Monthly changes in the frequency of opaque and translucent zones appeared in the edge of sectioned otoliths (n = 556).
Jmse 09 01346 g003
Figure 4. Fork length (FL) distribution of S. commerson caught in the Taiwan Strait. Panel (a) was the fish sampled for otoliths. Length data of eight juveniles with an FL of <35 cm were not shown. The length data of the fish without otolith collection were shown by different fishing gears: (b) longline, (c) trolling line, and (d) drift gillnet.
Jmse 09 01346 g004
Figure 5. Von Bertalanffy growth curves fitted to S. commerson length at age data for (a) females, males, and (b) sex-combined samples (n = 654). The inserted figure in panel (c) represents the age composition of S. commerson in 2018–2021 estimated by the age–length key developed in this study.
Jmse 09 01346 g005
Figure 6. Confidence regions (95%) of growth parameters (k and L ) for female (n = 351) and male (n = 295) S. commerson estimated in this study and compared with the values reported in earlier studies.
Jmse 09 01346 g006
Table 1. Relationship between otolith long axis (OL) and fork length (FL) for female and male S. commerson.
SexNEquationr2p-Value
Female218FL = 7.49 × OL − 2.800.914<0.001
Male205FL = 8.43 × OL − 17.520.842<0.001
Sexes combined423FL = 7.64 × OL − 6.100.88<0.001
Table 2. Parameters of the VBGF (k and L ), growth-performance index (Φ’), and maximal age of S. commerson in different areas reported by different authors.
VBGF ParameterΦ’Age
(Year)
SexRegionSource
k L   cm   ( FL )
0.39144.19.09.2FemaleTaiwan StraitThis study
0.31135.98.77.2MaleTaiwan StraitThis study
0.16130.17.96CombinedTaiwan Strait[26]
0.17155.08.314FemaleNorth-eastern Queensland[3]
0.25127.08.310MaleNorth-eastern Queensland[3]
0.51124.89.015FemaleEast coast of Queensland[25]
0.75104.79.011MaleEast coast of Queensland[25]
0.18187.18.7-CombinedIndian[19]
0.29134.38.6-CombinedSouth Africa[21]
0.28173.69.0-CombinedOman[20]
0.20151.38.420FemaleOman[10]
0.28134.78.510MaleOman[10]
0.31140.48.720FemaleSultanate of Oman[4]
0.60118.89.010MaleSultanate of Oman[4]
0.24136.18.415.3FemaleSouthern Arabian Gulf[24]
0.22125.68.216.2MaleSouthern Arabian Gulf[24]
0.31130.58.614.6FemaleKZN and Mozambique[23]
0.28119.28.313.6MaleKZN and Mozambique[23]
0.50148.09.3-CombinedNorthern Persian Gulf[9]
0.42140.09.010CombinedSouth of Iran[11]
Table 3. Sex ratio of S. commerson in all age classes in this region.
AgeFemaleMaleSex Ratio (%)χ2p
0355538.94.440.035 *
122114660.215.330.0001 *
2546943.91.830.176
3211952.50.100.751
47370.01.600.205
55271.4--
630---
721---
820---
910---
Total35129554.04.850.027 *
* significance at the 5% level.
Publisher’s Note: MDPI stays neutral with regard to jurisdictional claims in published maps and institutional affiliations.

