1. Introduction
Filter-feeding sponges are one of the major components of marine benthic communities with a worldwide distribution [
1]. Data on sponge size and pumping rates (filtration rates) are important for ecological studies in determining the grazing impact, matter transport and nutrient cycling of observed populations of sponges [
2,
3,
4,
5,
6]. While sponge volume (
V) may be more difficult to measure or estimate in situ than the osculum cross-sectional area (
OSA), the latter has also been used as a correlation parameter [
7], who used the following allometric relationships to characterize sponges:
where
Q/V denotes the volume-specific pumping rate,
Q the pumping rate,
V the sponge volume,
OSA the osculum cross-sectional area, and
U the exhalant jet speed at osculum.
Demosponges are modular filter feeders that consist of one or several units, known as “aquiferous modules” [
8,
9,
10]. An aquiferous module is a functional unit that draws ambient water through numerous inhalant openings (ostia) into an incurrent canal system by means of pumping units (choanocyte chambers,
CC) that filter the water for nutrition and then eject it via an excurrent canal system to an atrial cavity and through a single exhalant opening (osculum) as a jet to the surrounding water.
Temporal variation in
OSA and pumping activity is a common feature among sponges [
11,
12,
13]. Laboratory observation of the pumping activity of a multi-oscula sponge colony indicated that the sponge is sensitive to changes in water motion resulting in contractions of oscula, and further that a constriction of an individual osculum may cause closure of adjacent oscula and thus become a behavioral response of the entire modular sponge colony [
14]. More recently, [
15] compared relations between sponge size,
OSA, exhalant jet speed, and pumping rate (
Q =
OSA × U) of single-osculum explants and of individual aquiferous modules of multi-oscula explants of the demosponge
Halichondria panicea. The latter modules were identified by observing from which osculum surface administered dye emerged, and there was a fair agreement in results between the two types of modules. For both types, the pumping rate was a linear function of the modules’ size (volume), and it was suggested [
15] that this finding along with data from the literature on five demosponges [
16] indicated that the density of choanocytes may be of the same order, independent of sponge size, although it is still unknown whether the choanocyte chamber density and its pumping rate vary through the ontology of long-lived species, especially for those that reach considerable size. Suggesting a constant density of pumping units (choanocytes) throughout any given sponge size, and assuming simple geometric (isometric) scaling
V~
OSA3/2, [
17] suggested a theoretical scaling of
Q~
OSA3/2, which has been experimentally supported and confirmed in other studies, see Table 4 in [
15]. However, [
6,
7] found in recent in situ studies on 20 demosponges that
Q on average increased allometrically
Q =
a1OSAb1 with scaling exponent
b1 ≈ 0.75, 1.07 and 0.67 (instead of the theoretical value of
b1 = 3/2), thus suggesting that the choanocyte density may not be constant but on the contrary decreases with sponge size.
A consequence of possible constant density and pumping rate of choanocytes is that
Q as a function of size
V is linear, i.e.,
Q =
aV, and further that the volume-specific pumping rate is constant
Q/V =
aVb,
b = 0, regardless of sponge size. This is supported by [
13] and see Figure 5 in [
15], but not by Table 5 in [
6] that give negative
b values ranging from −0.2 to −0.7. Further, [
7] recently reported
b = −0.52 for seven Red Sea sponge species and
b = −0.43 for eight Caribbean species and therefore suggested that the theoretical considerations that explained the relationships observed by [
15,
17] for relatively small sponge explants may not be “expected to hold for much larger and more static sponges”. Thus, the scaling
b < 1 of power-law exponents may, according to [
7], be explained by different aquiferous system structures and by choanocyte chamber densities, which may vary among species and with sponge size, and that the distribution of choanocyte chambers may vary in different parts of the sponge body. Further, according to [
7], “as the sponge grows, the aquiferous system may become more complex” and thus a “constraint on the growth”. Obviously, the relationships between sponge dimensions and pumping rate are not simple and vary among species. Specifically, the increase in pressure losses with increasing size in the aquiferous system structure may account for the observed scaling
b < 1 as discussed in the present study.
Here, as a supplement to the recent detailed summary of allometric data correlations by Table 4 in [
7], we present available experimental literature data on volume-specific pumping rate (
Q/
V =
aVb) of demosponges characterized by values of the exponent
b. Furthermore, we present possible modelling of this relationship. Previous studies [
16,
18] have determined the pressure losses for a specified pumping rate while the present approach, also using a model for the choanocyte pumps, gives the pumping rate. The way in which morphological length scales change with size increase affects pumping rate through changing pressure losses and may be an important factor and thus some help to explain observed trends. Thus, a key issue of the present study has been to establish trends in
Q/V versus
V based on use of pump-system characteristics.
2. Available Data
Over the years, there has been a considerable interest in measuring the pumping rate (
Q) of sponges as a function of their size (volume
V). Results are often expressed as volume-specific pumping rate (
Q/
V, in units of mL water pumped per min per mL sponge = mL min
−1 mL
−1= min
−1) versus volume (
V, in units of cm
3), see
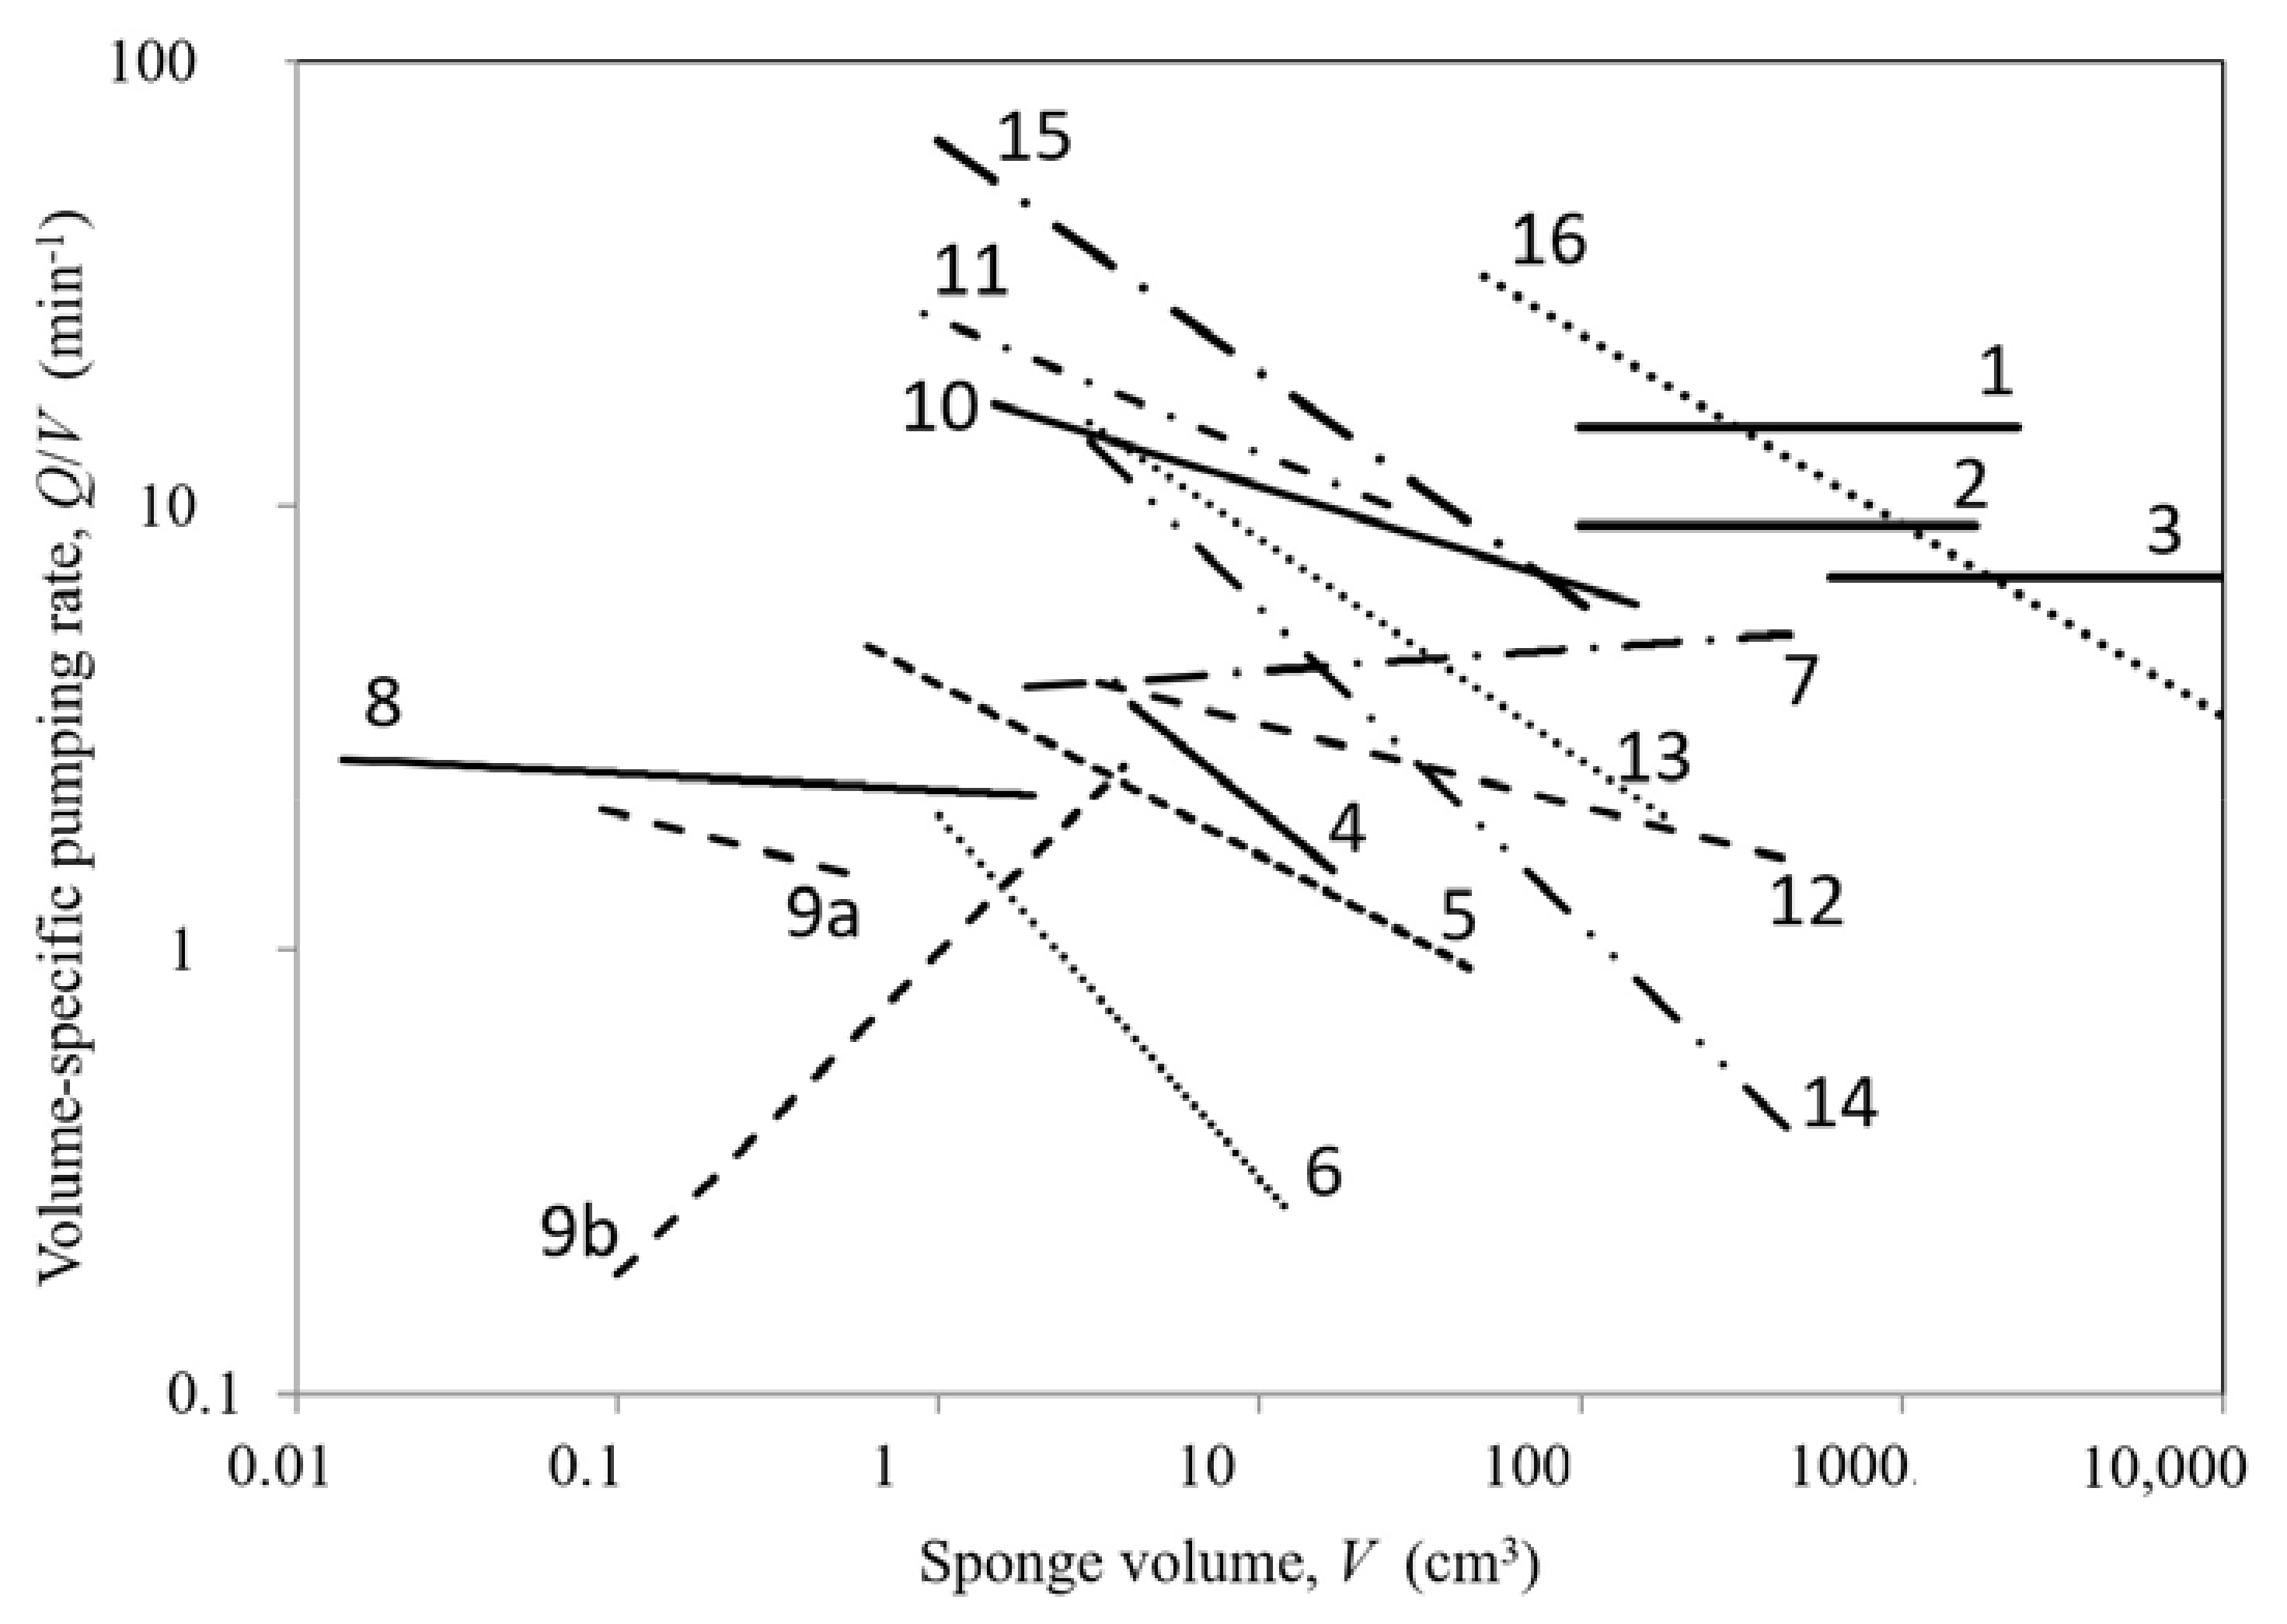
Table 1 and
Figure 1 for representative data. Reiswig Figure 1 in [
2] found
Q/
V to be essentially constant for increasing size of three specimens, likely because of constant density of choanocytes delivering the same volumetric flow rate, but specimens also showed a reduction of activity in largest sized individuals. For
Halichondria panicea and
Haliclona urceolus, Tables 1 and 2 in [
19] measured a declining
Q/
V with increasing size characterized by the negative power-law exponents of
b = −0.6 and −0.39 of the correlation
Q/
V =
aVb, similar to
b = −0.35 for large
Xestospongia muta by [
20]. The average of data from 14 species [
21] and five species [
16], on the other hand, showed
Q/
V to be nearly constant (
b = −0.045 and 0.051, respectively). Similar nearly constant
Q/V trends are seen in the data [
17] for singe-osculum explants of
H. panicea (
b = −0.038,
b1 = 1.45 and
b2 = 0.974), and in the data [
22] for
Cinachyrella cf.
cavernose (
b = −0.071,
b2 = 0.929) where
b2-values (Equation (1)) near unity suggest constant pumping rate and density of choanocytes. Smaller single- and multi-oscular explants [
15] showed different behaviors (
b = −0.19 and 0.726, respectively, and
b1 = 1.22), while the data of five Mediterranean species [
6] showed consistent negative power-law exponents (
b = −0.19 to −0.49) over large ranges of increasing size and
b1 = 0.75. For 15 tropical species Figures S7 and 3 in [
7], average values are suggested to be
b = −0.52 and −0.43, and
b1 = 1.07 and 0.67, respectively. While it appears that other investigators based their data on total sponge volume, [
13] explicitly used sponge tissue volume in arriving at an average volume-specific pumping rate of 0.06 ± 0.04 l (s l tissue)
−1 = 3.6 ± 2.4 min
−1 for 274 large
X. muta specimens, and the linear increase of pumping rate with size (
b2 = 1.1) suggests
b~0.
Data on other allometric scaling correlations in Equation (1), as well as growth forms of species, are given by Table 4 in [
7].
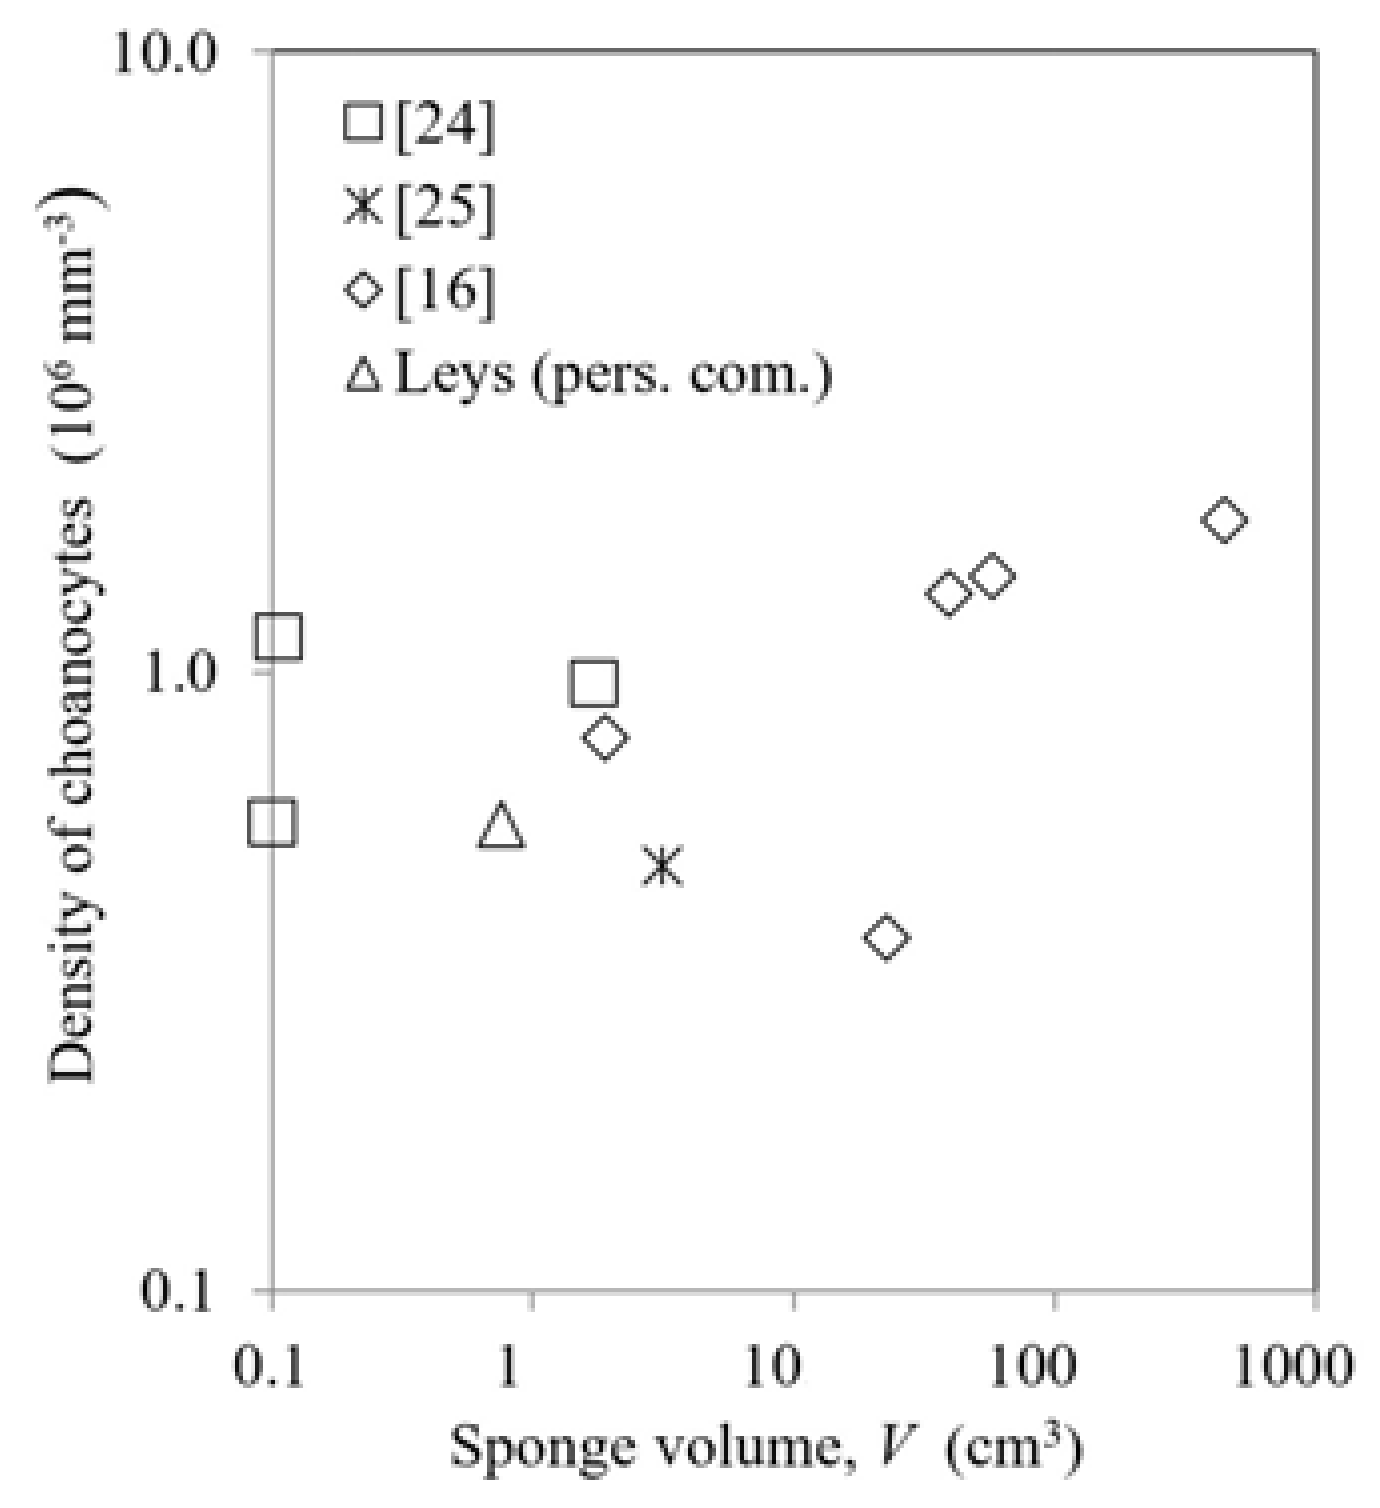
From the available data, it appears that the most fundamental feature of scaling laws of pumping rate is associated with the performance of the choanocyte pumps driving the flow against the pressure losses determined by the morphological structure of the aquiferous system of canals and restrictions, which are determined by several characteristic length scales [
16]. Data on choanocyte density (
Figure 2) show no clear trend for increasing sponge size, but all appear to be of the order of 10
6 mm
−3 within a factor of about 2. Therefore, the modelling in next section provisionally assumes density of choanocytes to be constant.
3. Modelling
The purpose of the present modelling is to determine how pumping rate changes when pressure losses in the aquiferous system changes for increasing size of a demosponge due to various changes of morphological length scales (diameter, height, etc.) on the assumption of constant choanocyte density and to compare the results to available data. For a given configuration, the total pressure loss versus flow rate defines the so-called system characteristic. Furthermore, the pumping rate depends on how the basic pump unit, the choanocyte, or the group of these in a choanocyte chamber, responds to a given pressure to be delivered, which is given by the so-called pump characteristic [
26]. Intersection of the system and pump characteristics determines the actual pumping rate and pump pressure.
Demosponges exhibit, according to [
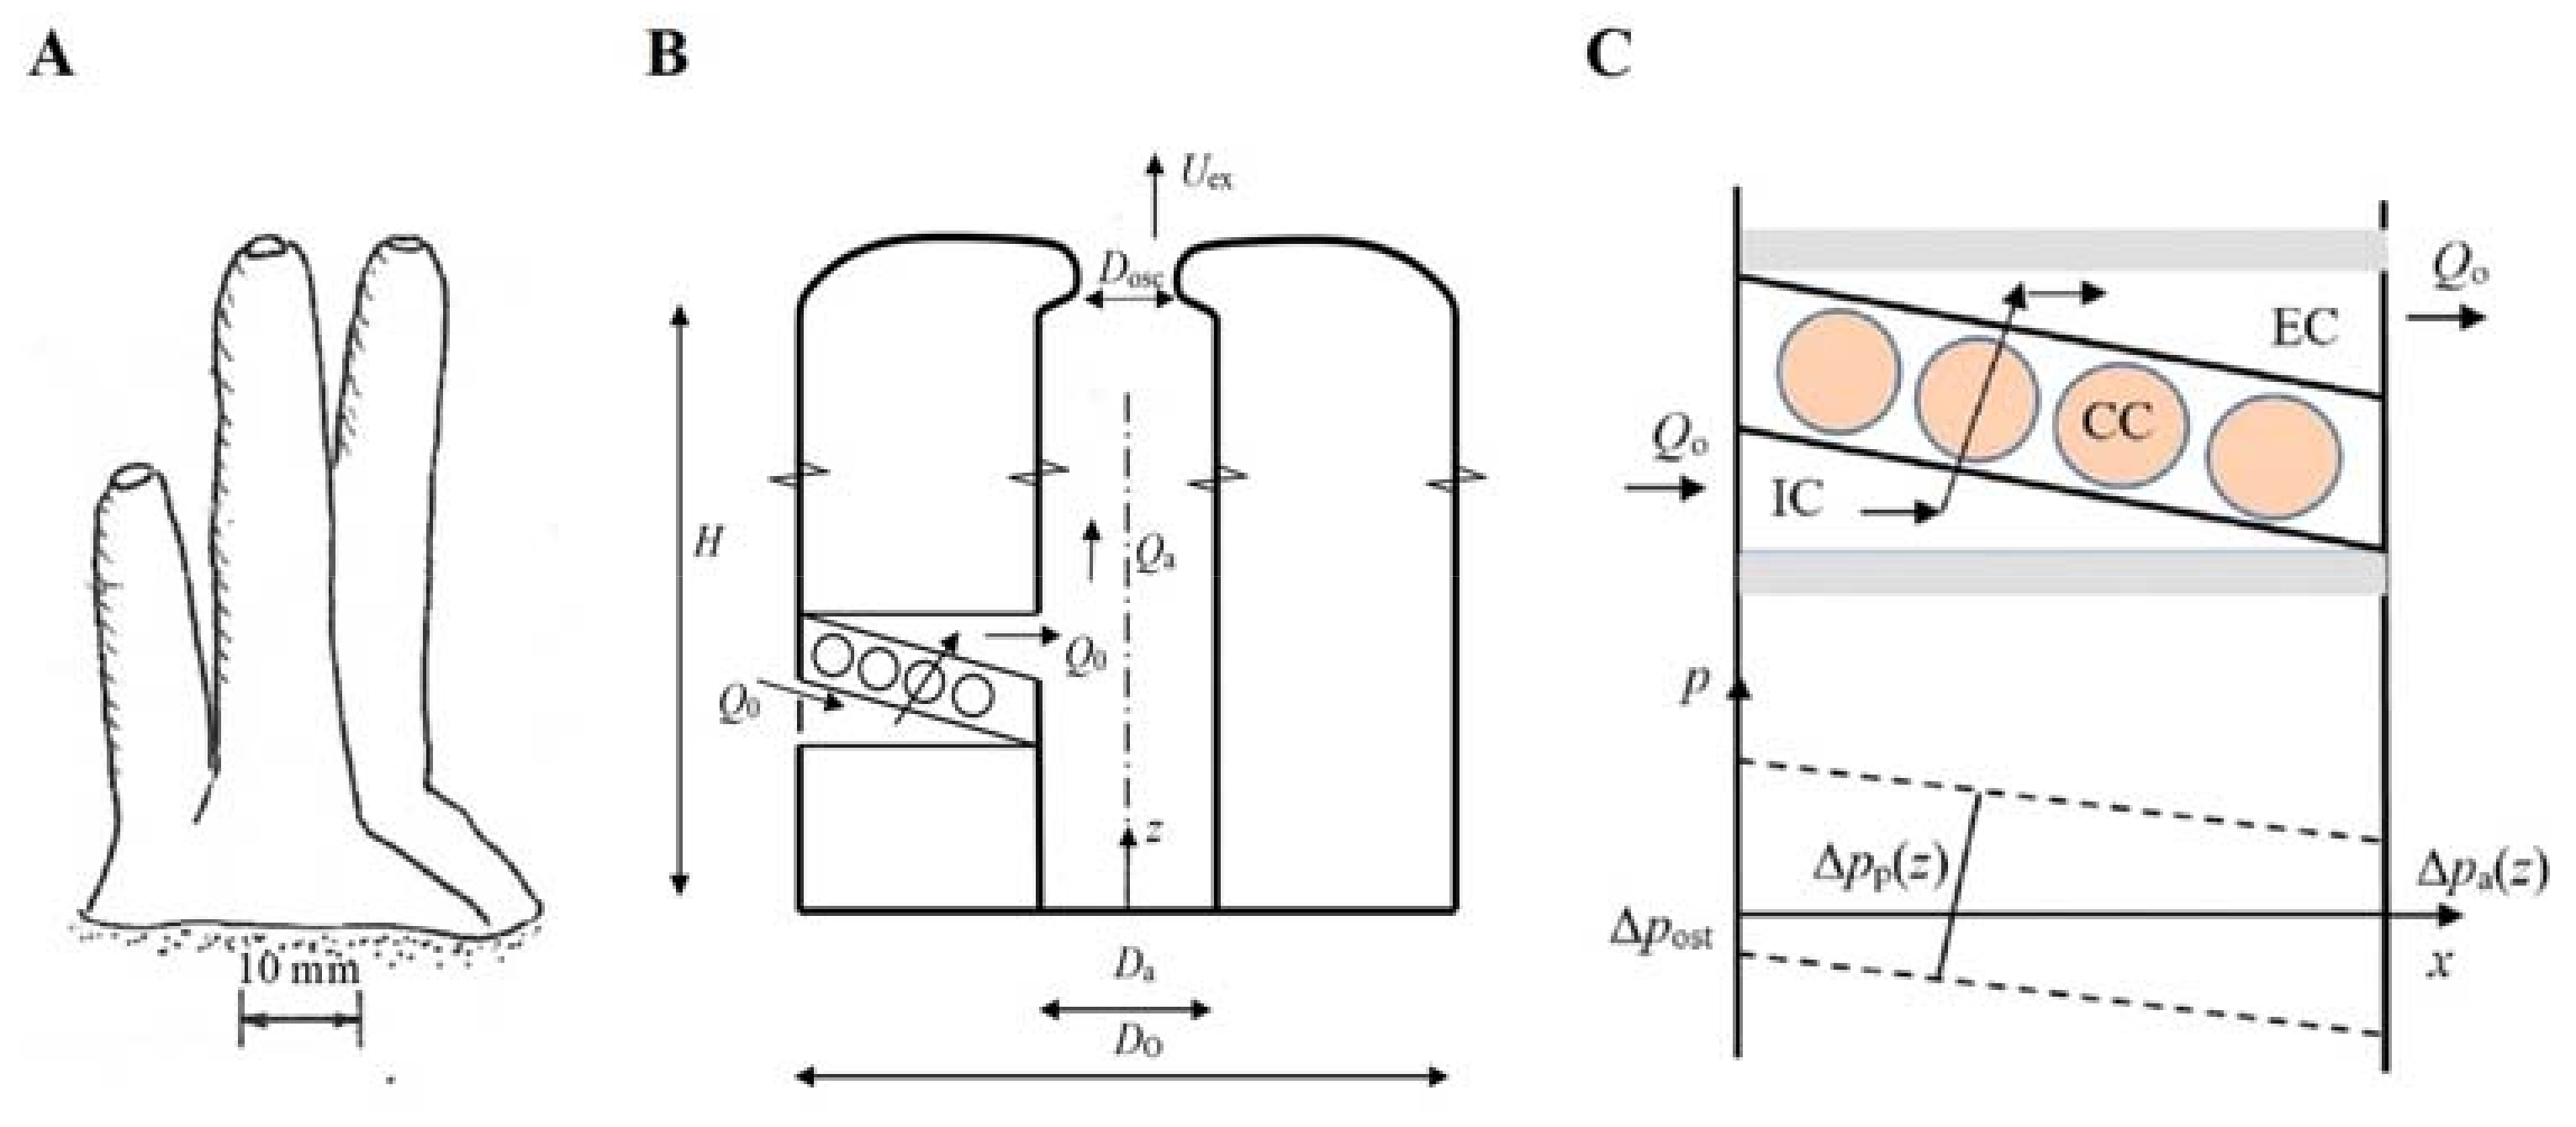
24], two extremes of external morphology: A low, solid, or encrusting form and an upright, hollow, or tubular form, and “all other types of habitus can be viewed as either slight modifications of these two dominant patterns or intermediates between these extremes.” In the present study, we focus on the tubular sponge form to illustrate basic features and hydraulic consequences of increasing various morphological length scales. However, by suitable choice of model length scales, a tubular form may degenerate to a low and wide form with long incurrent and excurrent canals and thus imitate a massive or encrusting form.
For the model of a tubular sponge (
Figure 3), whose morphology and size are given by four geometric length scales, model calculations give pumping rate as a function of sponge volume. Size increase in a sponge is determined by a genetically controlled ground plan (Bauplan) of morphological features common to each sponge species for how the individual length scales increase. One feature of this plan, for example, is revealed in the recorded data on the correlation Table 4 in [
7]
OSA =
a4Vb4, which relates geometric dimensions. Later we shall use this as a constraint in the study of model performance. For each ground plan, the model calculations will show a trend of the volume-specific pumping rate versus size. Among possible scaling trends, we seek to identify the most likely ones to match a given observed trend.
Recognizing the structural differences in the geometrical form of different sponges, we consider three basic variants defined by the same four length scales,
H,
DO,
Da,
Dosc: (i) The slender tubular form (
Figure 3A) where increasing size is due to increase primarily in height and less in diameter; (ii) the massive or encrusted form Figure S1H–L in [
7], represented by a cylindrical form where increasing size is due to increase primarily in diameter and less in height, e.g., due to new aquiferous modules growing next to existing ones in multi-oscula sponges; (iii) the small cone-shaped single-osculum explants Figure 1 in [
17] where increasing size is probably due to increase of both height and diameter. The individual modules of explants Figure 1 in [
15] may be treated as the slender tubular form. For the tubular cases, volume and canal length are defined in
Figure 3 as
V = (π/4)
DO2 H and
L = (
DO −
Da)/2, respectively. For the cone-shaped case,
V = (π/12)
DO2 H and the average canal length is approximated by
L = (
DO −
Da)/4 and the outer surface area by
As = π (
H2 +
DO2/4)
1/2 DO/2.
3.1. Materials and Methods
The model calculations are based on use of the computer modeled pump characteristic for a leucon-type demosponge Equation (2.13) for
C1 = 0 in [
27] which leads to the nonlinear characteristic equation,
where
Q denotes the pumping rate for a given delivered pressure rise Δ
p against and equal to the sum of pressure losses of the system represented by the flow through the sponge. The constants Δ
pmax and
Qmax were determined from the data for morphological dimensions and pumping rate of the reference sponge
Haliclona urceolus [
19] as explained in
Appendix A where
Table A1 and
Table A2 summarize sponge parameters.
The pressure losses are calculated according to a previous model [
19] now accounting also for the pressure loss of the atrium flow. In the model, choanocyte chambers (
CCs) are imbedded in wall structures between incurrent (
IC) and excurrent (
EC) canals such that these pump units act in parallel (
Figure 3C). In the annular tissue structure of the tubular sponge, ambient water is drawn through ostia restriction into an
IC canal by a row of
CCs that discharge the flow into an
EC canal that empties into the atrial cavity where the upward volume flow
Qa cumulates to leave ultimately through the osculum as an exhalant jet. There are several inlets (prosopyles) to a
CC but only one outlet (apopyle). As part of the model, we assume that the observed decrease of diameter of
ICs with length and with branching of
ICs implies an approximately constant pressure gradient along the canal (see
Appendix A.2 for a discussion). If
CCs of the same pumping rate draw flow from points uniformly distributed over an
IC inner surface (d
Q/d
x~−
D) and the pressure gradient due to friction is constant (
Q~
D4), the diameter of the
IC would decrease as
D/
D0 = (1 −
x/
L)
1/3, where
L is the total length. Note also that a constant pressure gradient along
IC and
EC would imply that each one of the
CCs in a row (
Figure 3C) would face the same length of flow path, hence same total pressure drop and thus provide the same volume flow. The equations of the various pressure losses are detailed in
Appendix A.
3.2. Results
First, let us ignore the effect that pressure losses have on reducing the pumping rate. In the search of scaling relations for volume-specific pumping rate versus volume (size) of a tubular sponge (
Figure 3) we note that
V~
DO2H and
Q~(
DO2 −
Da2)
H provided the pumping rate and density of choanocytes were constant in the structural annular volume. This scaling leads to the expression
Q/
V~1 − (
Da/
DO)
2, which for increasing
V implies a decrease, an increase, or no change depending on how
Da/
DO changes with increasing
V, irrespective of how
H changes. However, including the effect of flow reduction due to pressure losses will change the outcome, in most cases leading to decreasing pumping rate with increasing volume, as illustrated in the following examples. First, however, a simple matching of a linear pump characteristic with the pressure loss in a canal [
28] leads to the relation
Q/
V~1/(
c +
V2/3) which gives
Q/
V~
V−2/3 for
c <<
V and approaches
Q/
V~constant for large values of the constant
c (see
Appendix A.4 for the analysis). These results correspond to the range of trends shown by much of the data reported in
Table 1.
Using the flow model described in
Appendix A we first study isometric scaling of the geometry given by the four length scales
H,
DO,
Da,
Dosc defined in
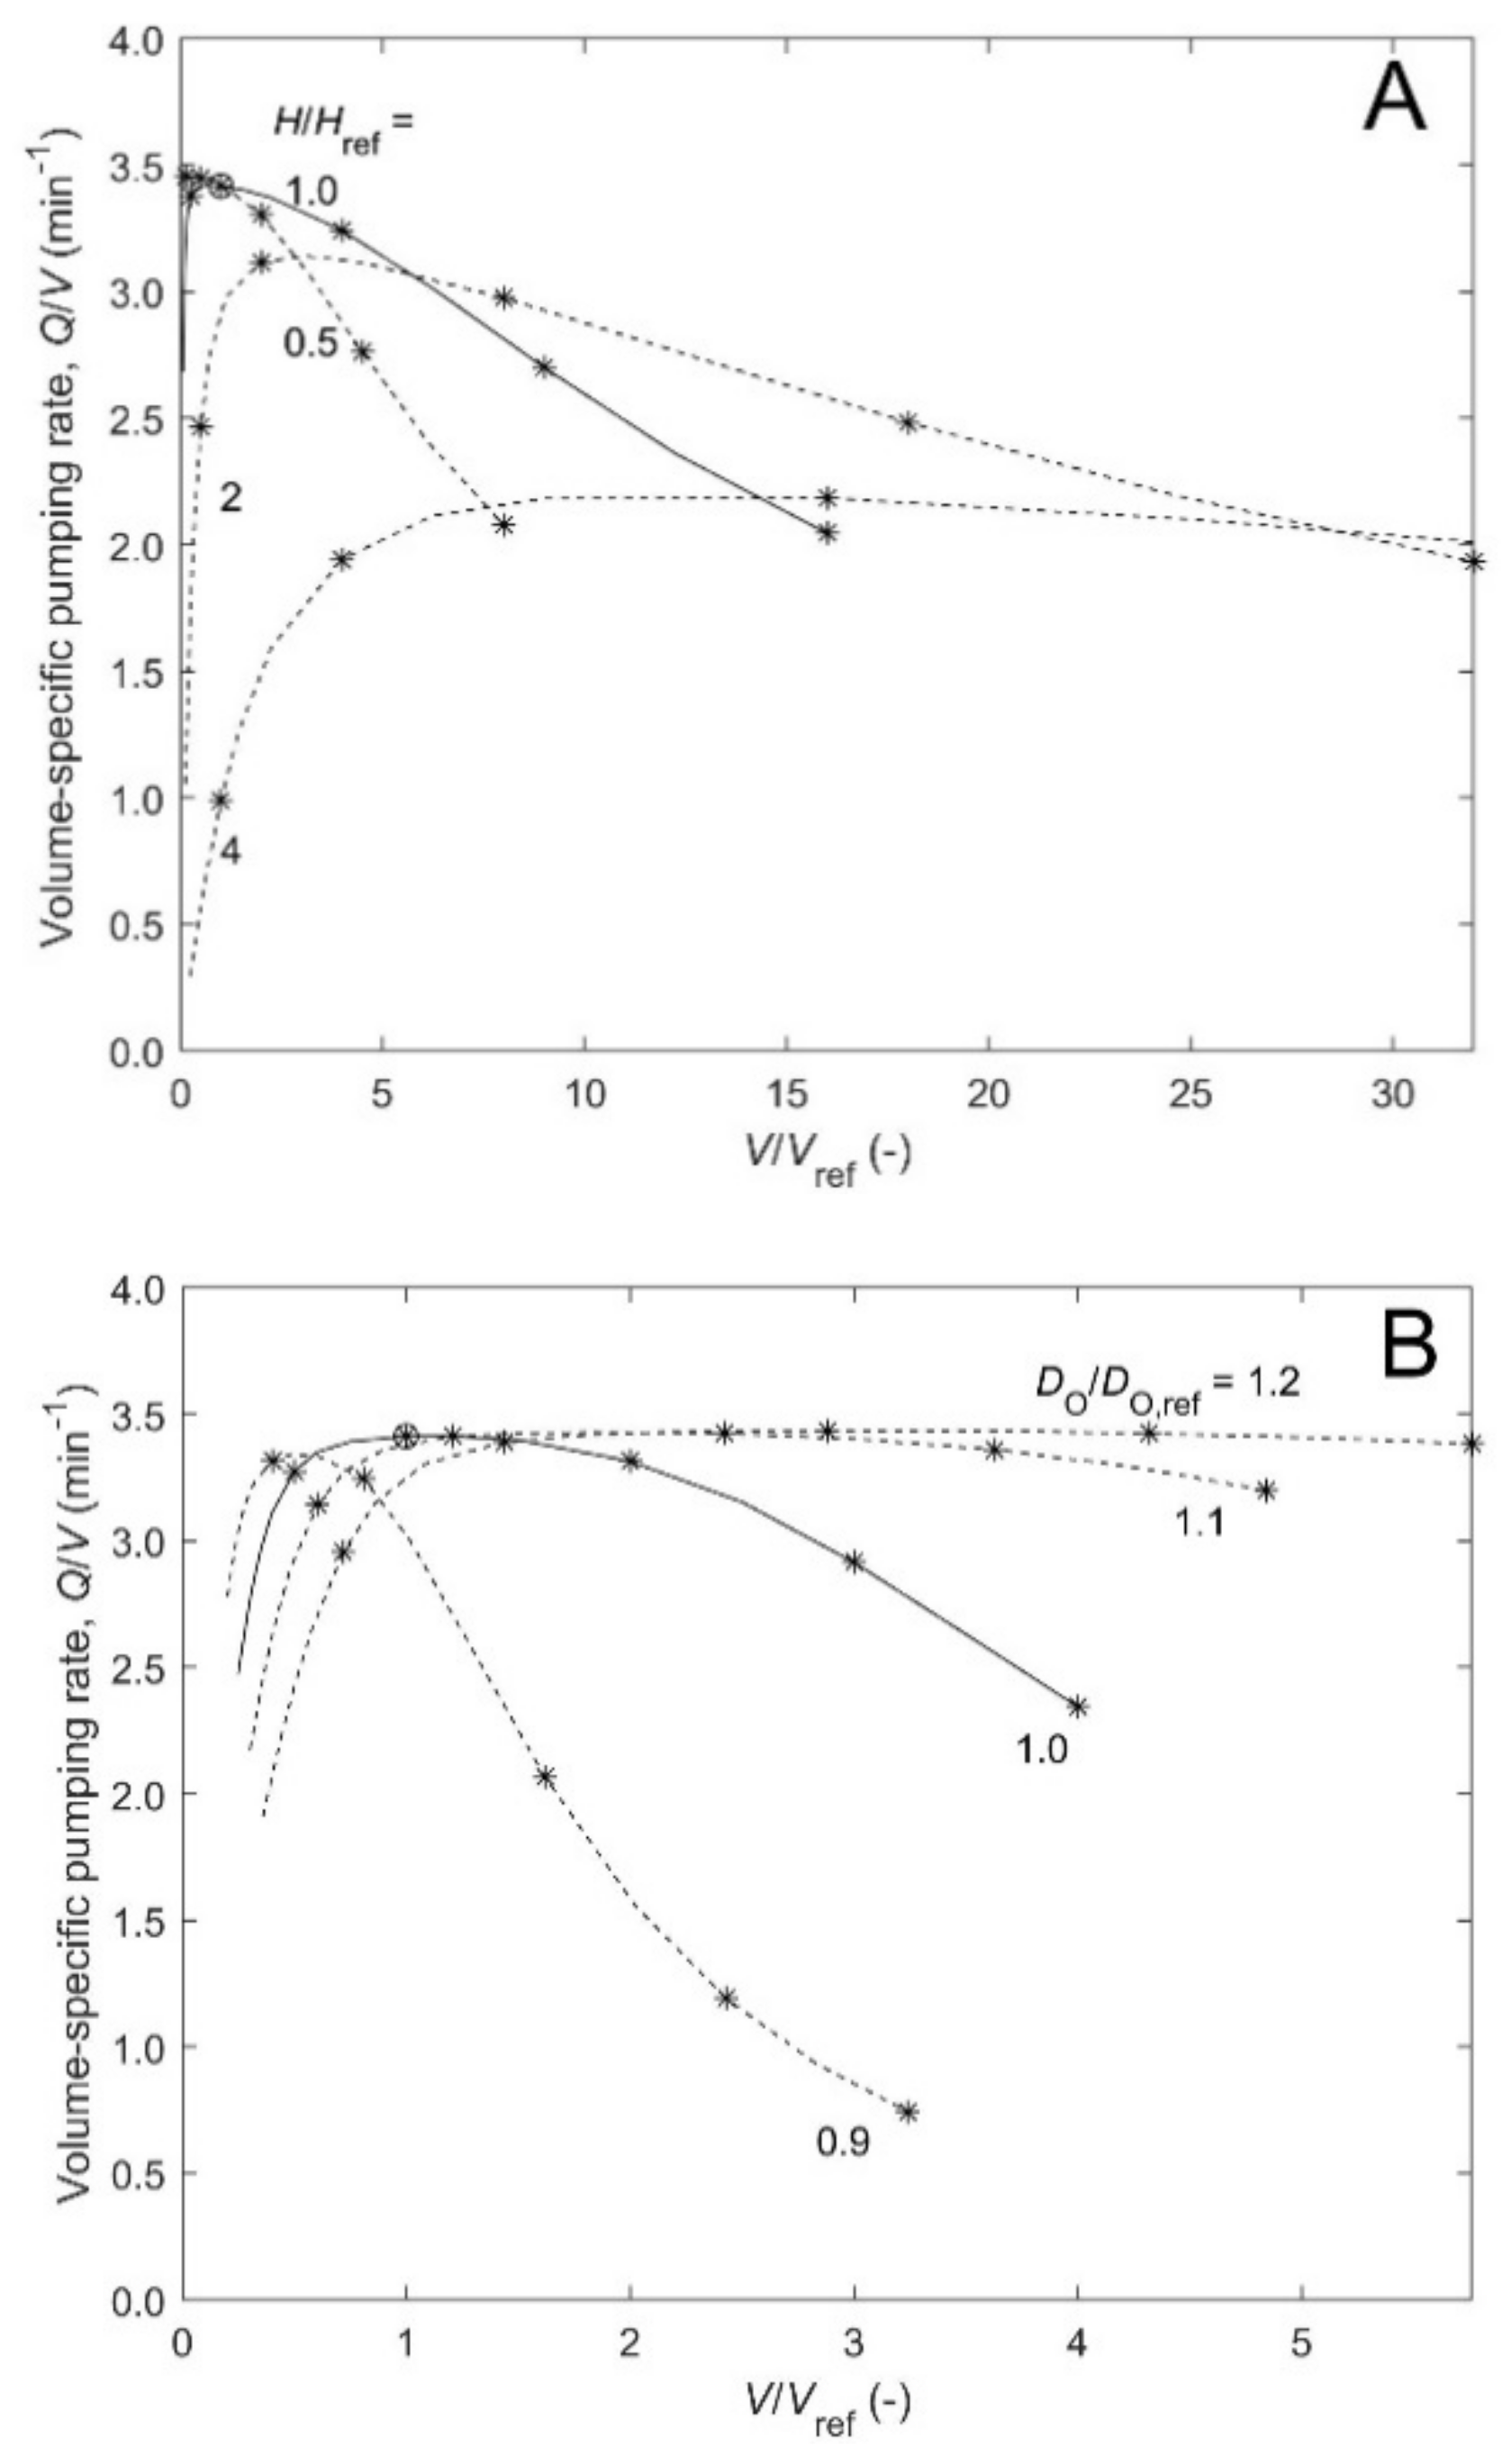
Figure 3. Introducing a scale factor
sf that takes values from 0.25 to 4, we calculate how the volume-specific pumping rate
Q/
V changes with the relative sponge volume (
V/
Vref) as the four length scales are changed by the factor
sf (
Figure 4 upper curve). The volume given in
Figure 3 will increase as
sf3, but the pumping rate will increase less (even though the choanocyte density is constant) because increased length of various canals increases pressure losses and thus reduce flow rate as dictated by the pump characteristic. Here, this implies a negative power-law exponent
b = −0.29 which is similar to values displayed by some data in
Table 1. Next, reducing the scaling of the osculum diameter to
Dosc~
sf1/2 changes the power-law exponent to
b = −0.57 and
b1 = 1.3 (
Figure 4 lower curve). These values should be compared to
b = −0.6 and −0.39 for
Halichondria panicea and
Haliclona urceolis, respectively, of
Table 1 (#4 and #5) and
b1 = 1.45 of the correlations of
Q =
a1 OSAb1 (not shown).
To see the effect of keeping some length scales constant,
Figure 5A,B shows in detail how constant values of height or diameter, respectively, affects pumping rate for increasing sponge size when the remaining parameters are scaled. The figures show the existence of regions of increase, no change, and decrease in volume-specific pumping rate, corresponding to positive, zero, and negative values of the power-law exponent
b. Increase occurs, for example, when diameters of atrium and osculum of a smaller sponge increase despite increasing size. Decrease occurs when length of canals and size increase.
To model single-osculum explants, we choose as reference ID#21 of Table 1 in [
17] for which
Q/
V = 1.77 min
−1,
b = −0.38 (see
Table 1), and
b1 = 1.45. For this reference, values of the four length scales are
H =13 mm,
DO = 15.6 mm,
Da = 1.1 mm, and
Dosc = 15.6 mm. Model results in
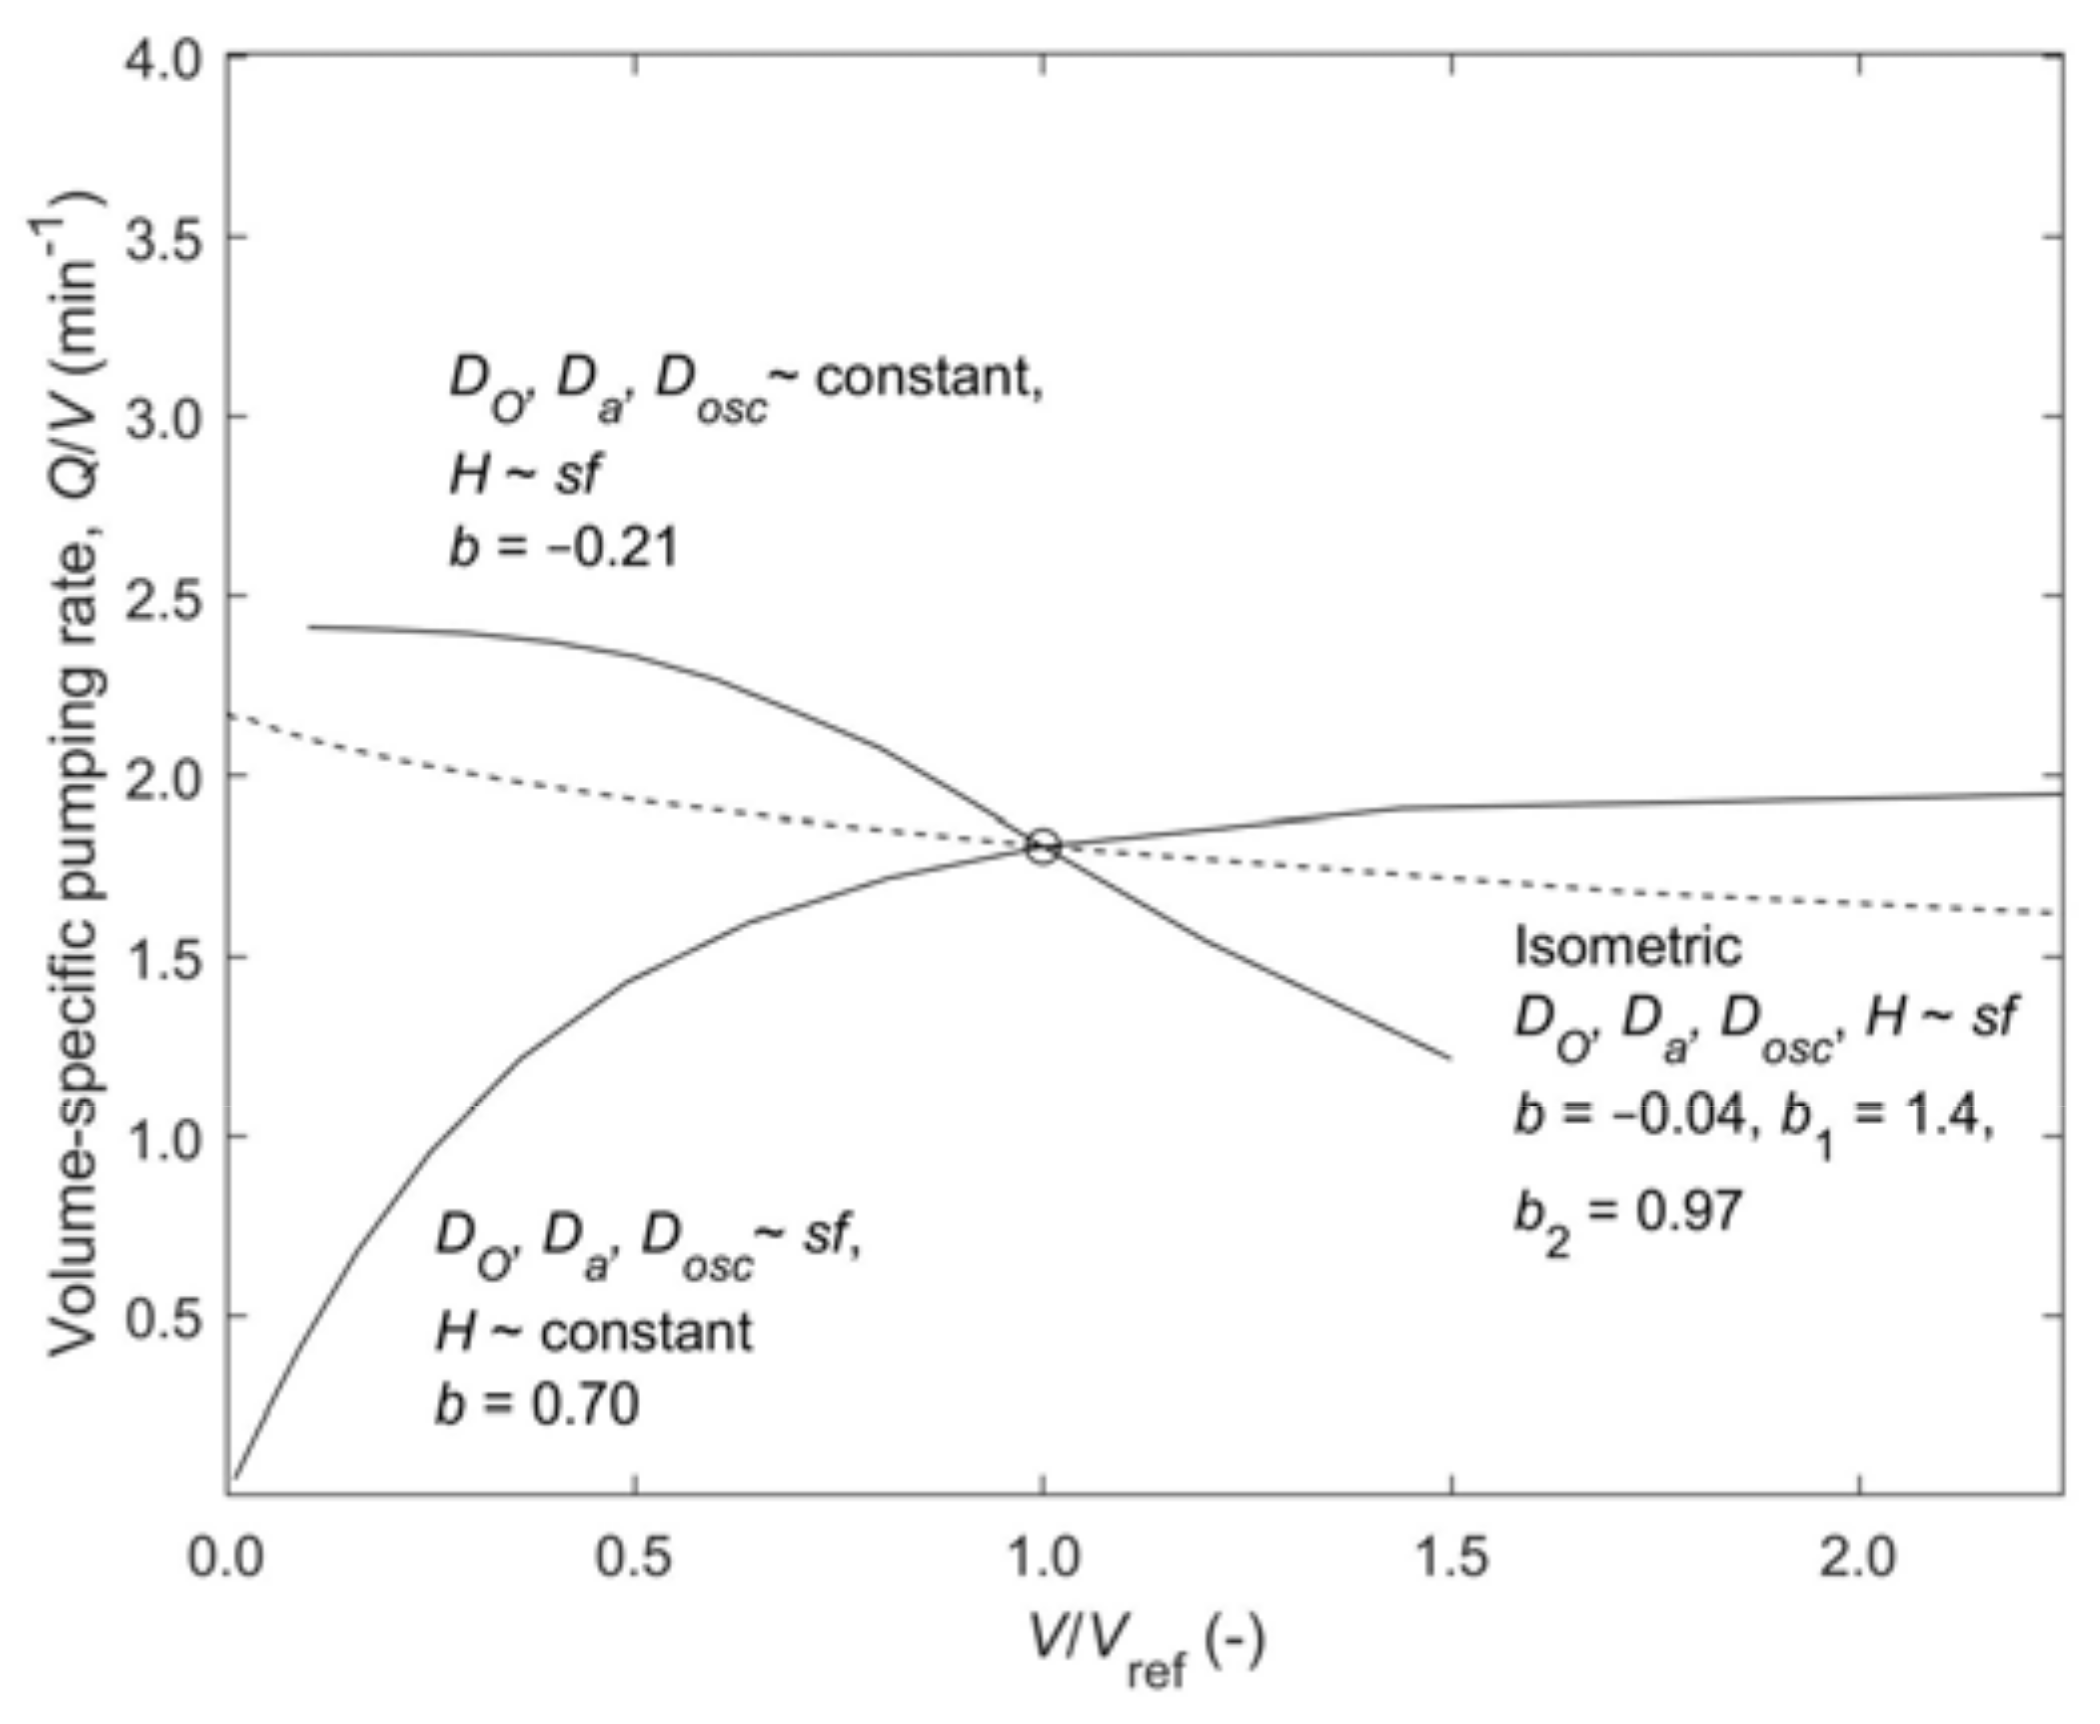
Figure 6 suggest that isometric scaling, giving
b = −0.04 and
b1 = 1.4, is in fair agreement with measured values. Single-osculum explants #9a of Table 1 in [
15] are of about the same size but with lower
Q/
V and show somewhat stronger decrease with increasing size,
b = −0.19 and
b1 = 1.22.
The individual modules of multi-oscula explants of
Halichondria panicea are tubular Figure 1 in [
15] rather than cone-shaped, and the data show a strong increase in pumping rate versus size (#9b of
Table 1,
b = 0.726) that is difficult to interpret. Size increase is probably associated with increase in both height and outer diameter, and if canal length (
L = (
DO −
Da)/2) does not increase appreciably, pumping rate would tend to increase with size.
For demosponges of massive or encrusting form with several oscula, hence composed of several aquiferous modules, such as many of the species #10–14 of
Table 1, the structure and canal system is not well known. During growth, we imagine a first module can be treated as tubular until it reaches its maximal size and a new module starts to grow adjacent to the first one. Ref. [
10] states that “Among encrusting demosponges new modules arise at the periphery and often result in the formation of very large sheets bearing more than 50 oscula”. As new modules are added, the free surface area available to each module for inflow through ostia and incurrent canals is steadily being reduced which may imply that canals become longer which in turn causes a relative reduction in pumping rate of all modules such that
b < 0. Such volume increase during growth may be approximated by the tubular model in a phenomenological way by a scaling with little increase in height, large increase of outer diameter and canal lengths, and with an increase in osculum diameter, that reflects increasing number of oscula and pumping rate.
Finally, it is of interest to see how the model performs when using some experimentally determined scaling data relating to morphology. Here we consider the correlation
OSA =
a4Vb4 with
a4 = 9.42 and
b4 = 0.6 from Figure 5A in [
7] for low-microbial-abundance, LMA, as constraint on the model parameters. Using the
OSA-relation and the relations
V = (π/4)
DO2H and
Dosc = (4
OSA/π)
1/2, determines
Dosc as a function of
DO and
H, leaving the three remaining length scales
H,
DO,
Da free to be scaled. As shown in
Appendix A Figure A1A, sample results for three scaling cases (scaling
H, or diameters
DO,
Da) or all three parameters give resulting values of exponents
b,
b1, and
b2. Values of
b (=−0.16, −0.2 and −0.3) are comparable to those of Table 5 in [
6] for LMA species, also listed as #10–11 in
Table 1 of the current paper. Similar calculations (
Appendix A,
Figure A1B) for high microbial-abundance HMA species (
a4 = 3.81 and
b4 = 0.56) give
b = −0.2, −0.26 and −0.37. These results suggest that some or all observed trends of reduced
Q/
V with increased
V could be explained almost entirely by the hydrodynamic effects of increasing pressure losses in aquiferous structures of increasing size. For more detail,
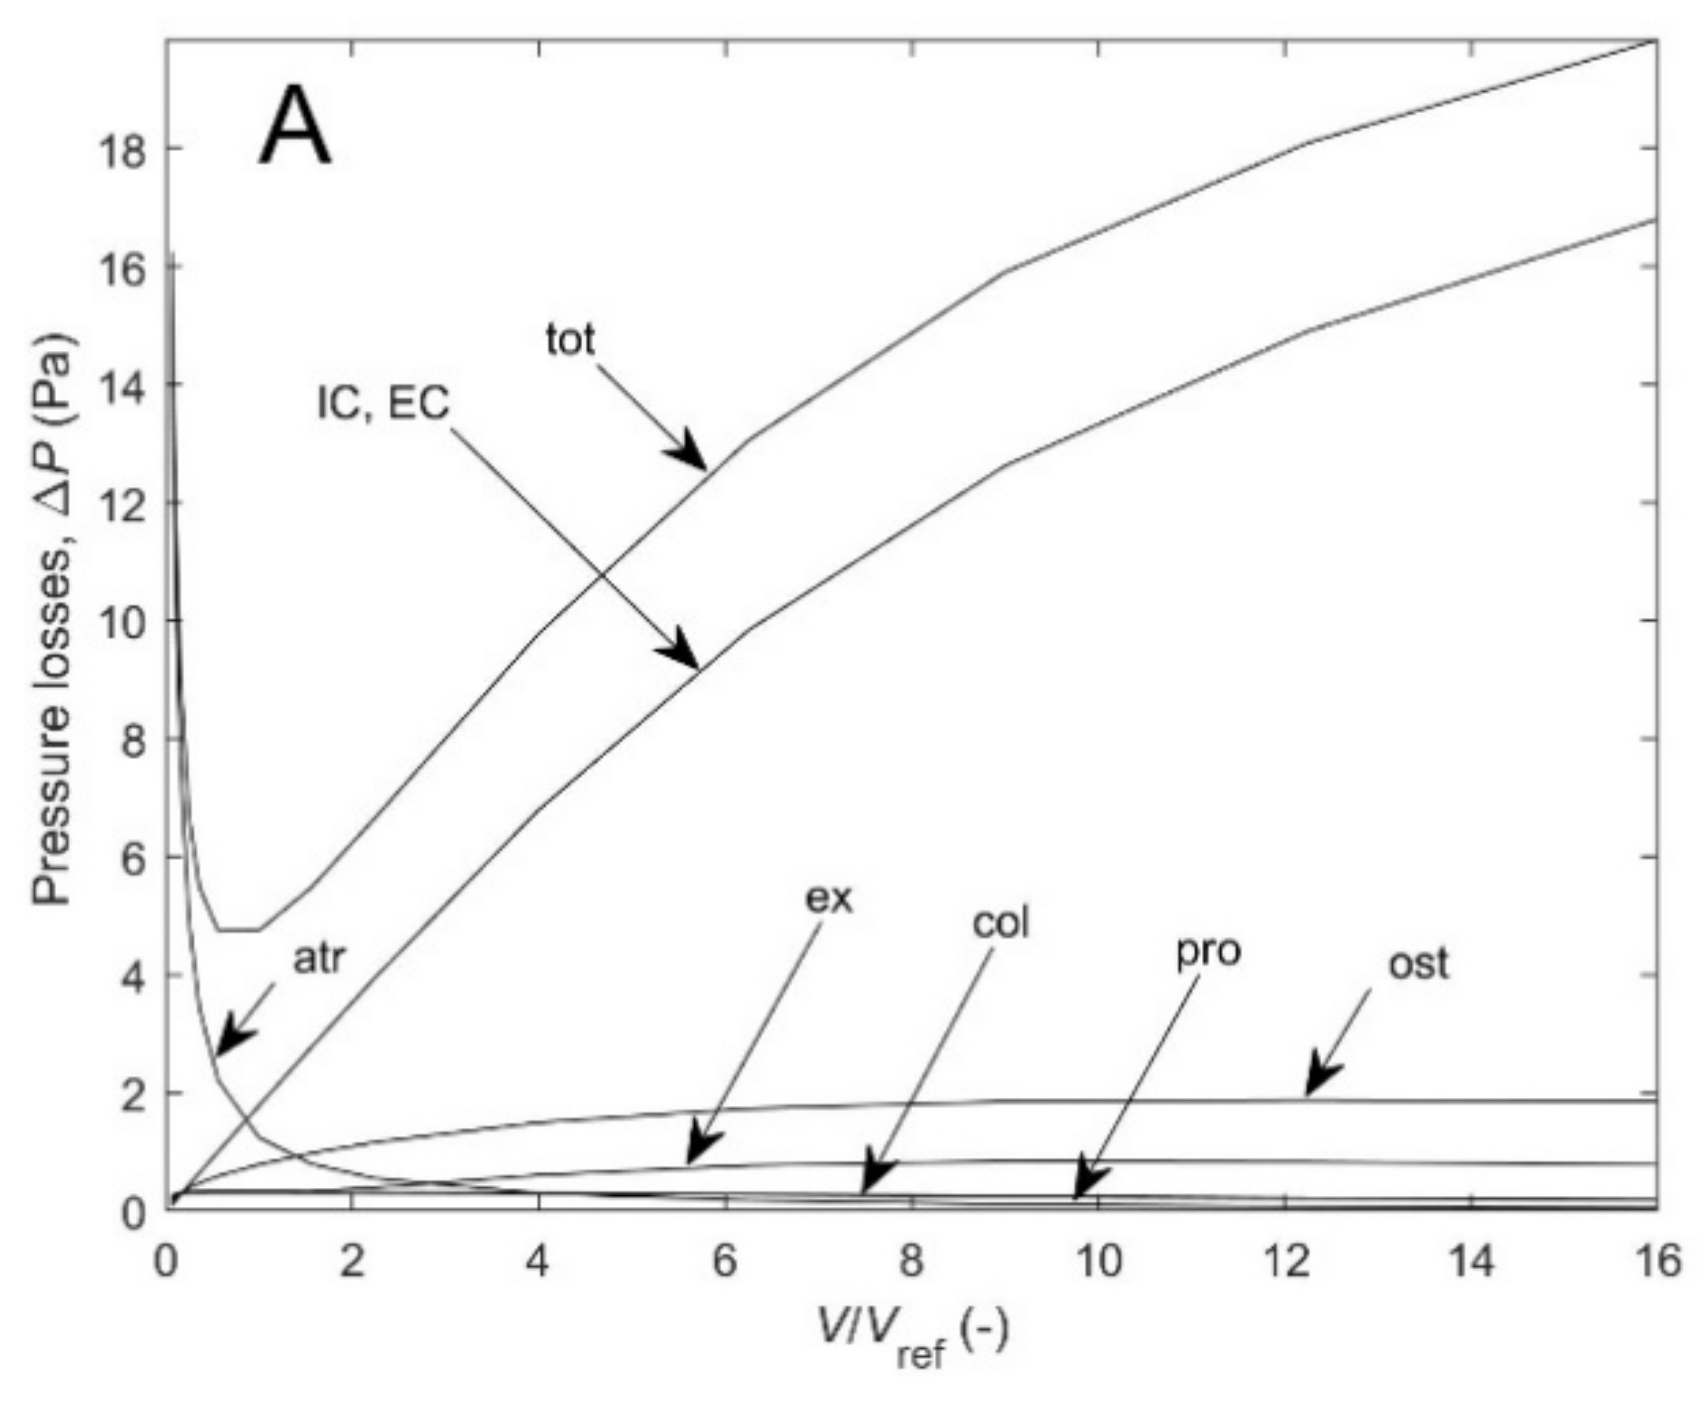
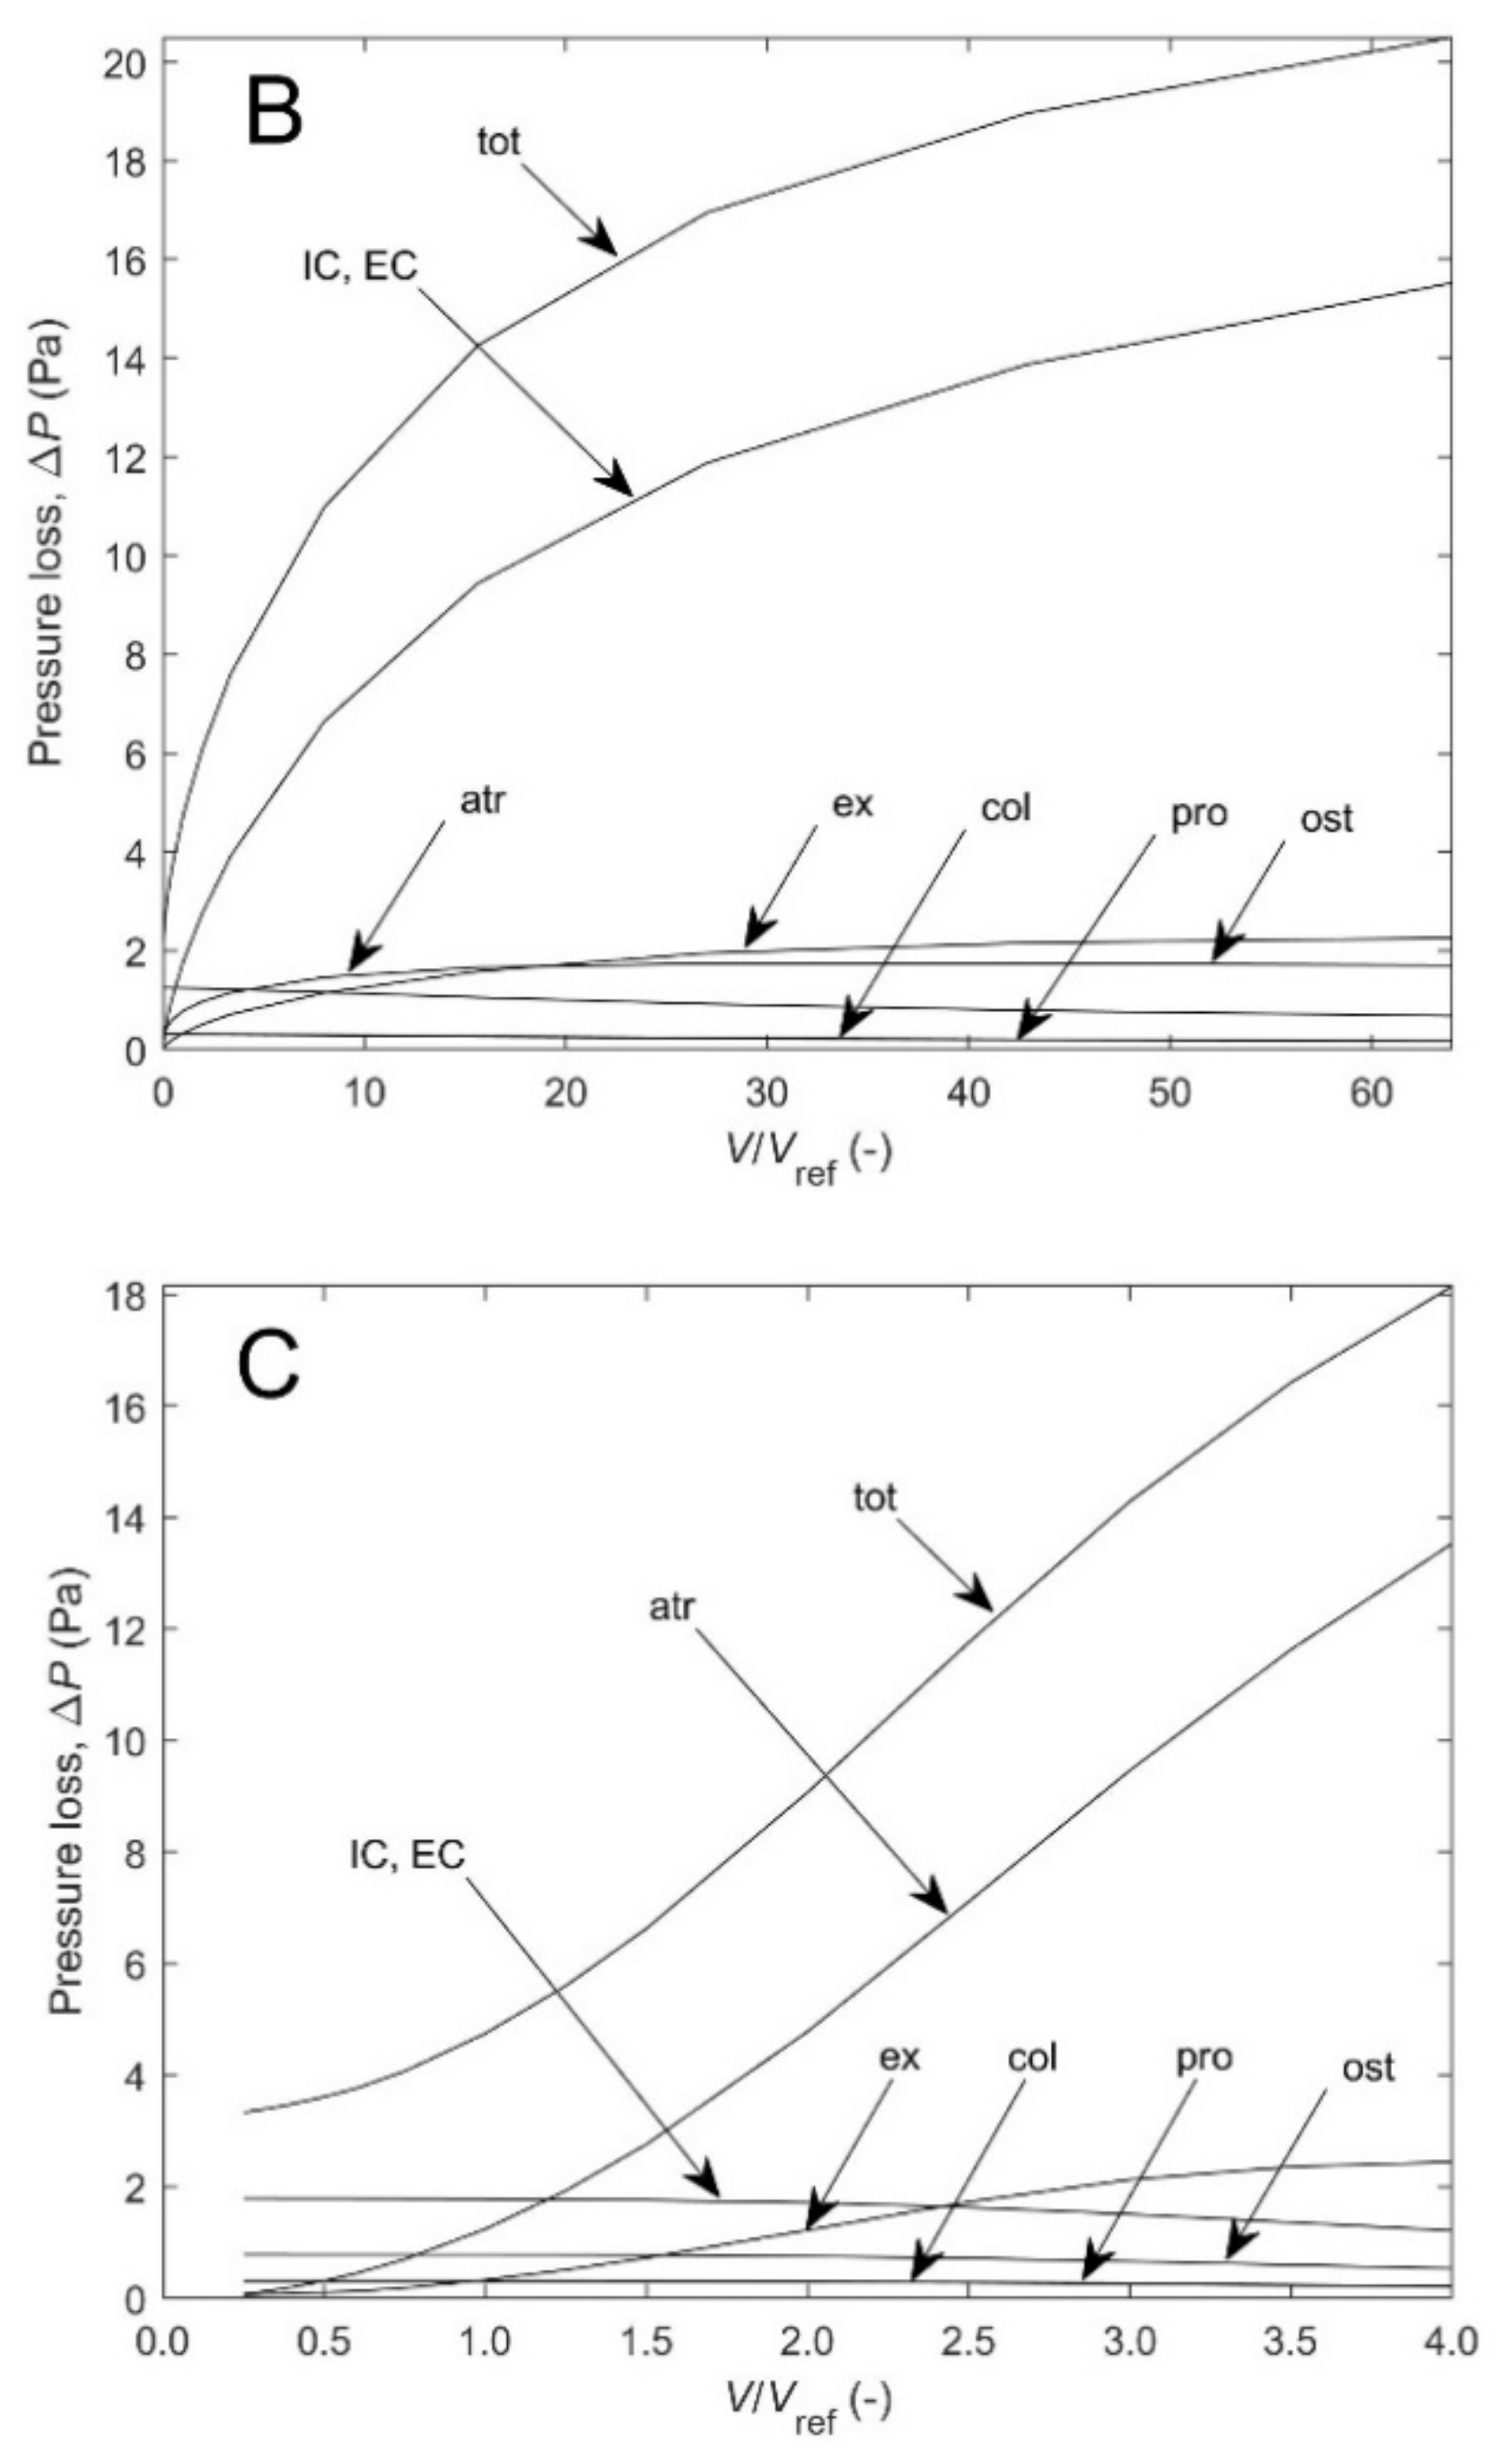
Figure A2A–C shows the different contributions to the total pressure loss for the three cases of
Figure A1A. As expected, according the model, as canal length increases for scaled diameters at constant height, pressure losses in incurrent and excurrent canals is the dominant contribution (by 50–85% of the total) which could represent encrusted and massive growth forms, but also for isometric scaling of height and diameter (by 20–75%). For scaled height at constant diameter, on the other hand, pressure losses in the atrium flow dominate (by 26–75%), which could represent the slender tubular growth form.
4. Discussion
The available literature data on pumping rate versus size of demosponges covers six decades of volumes from small single- and multi-oscula explants to large temperate and tropical sponges of various forms (
Table 1). The morphological scaling is presented in terms of power-law regressions of volume-specific pumping rate versus volume (
Q/
V =
aVb), which shows a variety of trends of positive, near-zero and—most often—negative exponents
b (
Figure 1). Alternative scaling involving the parameters pumping rate
Q, sponge volume
V, osculum cross-sectional area
OSA, and exhalant jet speed at osculum
U (Equation (1)) are summarized in [
7].
Available data show that scaling laws of pumping rate appear to depend on species, temperate or tropical habitat, high or low microbial abundance (HMA or LMA) and growth form (tubular, vase, encrusting, massive). Possible other factors include density of choanocytes, seasonal variation in food availability and thus variation of the condition index (ratio of organic to inorganic matter [
29], and height of sponge modules above the sea floor, as well as the morphological structure. The latter aspect is the focus of the present study because it is obvious that, for example, increased canal lengths with increased sponge size leads to increased pressure losses, hence to reduced pumping rate as dictated by the characteristic of the flagellum pump of choanocytes. To illustrate such effects, we developed a computation model that calculates the pumping rate as function of sponge size as specified by four length scales for a tubular model (
Figure 3).
The model assumes a constant density of choanocytes because there is no clear trend in available data for its possible size dependence (
Figure 2), but it could readily be modified to include any specified variation of density with size. The model (see
Appendix A for details) also accounts for the pressure losses of the upward flow in the atrial cavity, which implies a decreasing pressure with increasing height facing the choanocyte pumps. However, to facilitate an algebraic solution we approximate the pressure in the atrium by its mean value such that all pumps deliver the same pressure rise and same volume flow. It is estimated that the error of this approximation amounts to a few percent for short atrial canals.
For realistic results, the model is based on the data for the “standard sponge”
Haliclona urceolus [
19] which is used as the reference sponge and for which the equation of pump characteristic was developed [
27]. Reference values appearing in results are
Vref = 1.86 cm
3, (
Q/
V)
ref = 3.41 min
−1 and
Qref = 6.34 mL min
−1, and an isometric scaling with
sf = 0.25 to 4 will cover a range of sponge sizes from 0.029 to 119 cm
3. The model results in
Figure 4 for isometric scaling (
H,
DO,
Da,
Dosc~
sf) and a modified scaling (
H,
DO,
Da, ~
sf,
Dosc~
sf1/2, i.e.,
OSA~
sf) are compared to the scarce experimental results for
Halichondria panicea and
H. urceolus (
b = −0.6 and −0.39, respectively, of #4 and #5 of
Table 1). The case of modified scaling implies a reduced
OSA, hence increased exit pressure loss and thus reduced pumping rates that seem to fit the data better, hence supporting the credibility of the model.
To help understand the response of model prediction to changes of the four length scales,
Figure 5A shows results for four values of constant height (
H) as diameters are scaled (
DO,
Da,
Dosc~
sf), and
Figure 5B shows results for four values of constant outer diameter (
DO) as other parameters are scaled (
H,
Da,
Dosc~
sf). The results show regions in which scaled increase of sponge volume may involve increase (
b > 0), essentially no change (
b~0), or decrease (
b < 0) of volume-specific pumping rate. First, for some constant value of height
H (
Figure 5A), scaled increase of all diameters implies
V~
DO2H and
Q~(
DO2 −
Da2)
H, hence
Q/
V~1 − (
Da/
DO)
2~constant if no pressure losses. This is consistent with an assumption of constant pumping rate and density of choanocyte pumps. However, for small diameters and large heights, such pressure losses are large primarily due to the flow along the atrial cavity and through osculum and these contributions decrease with increasing diameters such that
Q/
V increases at first. Later, for larger diameters, the pressure loss in canals of increasing length,
L = (
DO −
Da)/2, becomes important and
Q/
V levels off and begins to decrease, particularly for the smaller values of height. Such situations may represent encrusting or massive growth forms. Secondly, for some constant outer diameter
DO and constant width of the annular structure of a tubular sponge, which equals the canal length
L = (
DO −
Da)/2 (
Figure 5B), scaled increase of height
H implies again
Q/
V~constant, if there are no pressure losses. However, for small height, the pressure loss is primarily due to flow through the small osculum and this contribution decreases with increasing height of sponge and diameter of the osculum such that
Q/
V increases at first. Later, for increasing height the increasing pressure loss in the atrium flow causes
Q/
V to level off and begin to decrease, particularly at the smaller values of outer diameter. Such situations may represent slender tubular growth forms.
To study single-osculum explants, the tubular model was changed such that the four length scales could represent a cone-shaped geometry. The results in
Figure 6 for three strategies show that scaled height at constant diameters leads to decreasing pumping rate during growth (
b < 0), while scaled diameters at constant height gives increasing pumping rate (
b > 0). Isometric scaling of height and diameters gives a weakly decreasing, almost constant pumping rate (
b = −0.041) that is close to the observation [
17] (
b = −0.038). The correlation of the data on
OSA versus volume [
17] shows
Dosc~
V0.34 which is in good agreement with the isometric scaling, which implies
Dosc~
fs and
V~
fs3, hence
Dosc~
V1/3. For the correlation
Q =
a2Vb2, the experiment and the model give almost identical trends,
b2 = 0.97 and 0.96, respectively, supporting the hypothesis of constant choanocyte density. However, for magnitudes we should compare the complete correlations, which for the pumping rate of the experiment and the model are
Qexp = 2.3
V0.97 and
Qmodel = 4.5
V0.96, respectively, and for the volume-specific pumping rate, (
Q/
V)
exp = 2.3
V−0.038 and (
Q/
V)
model = 1.79
V−0.041. The discrepancies in magnitude could be due to underestimation of the model pressure losses, overestimation of the choanocyte pump performance, and the power-law fit to model results that show significant variation over the scaling range. Nevertheless, results strongly suggest that observed dependence of pumping rate on size of demosponges might primarily be governed by the hydraulics of pump and pressure losses of the aquiferous system.
We also explored the effect of constraining the scaling strategy by the geometrical correlation
OSA =
a4Vb4 obtained from experiments, leaving the three length scales
H,
DO,
Da free to be scaled (see
Figure A1 in
Appendix A). For both an LMA-type (e.g.,
Dysidea avara) and an HMA-type (e.g.,
Agelas oriodes), the best agreement of trend in terms of
b-values appeared to be for scaled height at constant diameters, which would be expected for a tubular growth form. The two specimens are classified as encrusting and massive, but images in the literature (e.g. Figure S1 in [
7]) show specimens and colonies with tubular growth form.


