Article

Three-Dimensional Surface Crack Growth of Maraging Steel Spherical Pressure Shell

School of Mechanical Engineering, Jiangsu University of Science and Technology, Zhenjiang 212003, China
*
Author to whom correspondence should be addressed.
J. Mar. Sci. Eng. 2021, 9(11), 1280; https://doi.org/10.3390/jmse9111280
Submission received: 18 October 2021 / Revised: 5 November 2021 / Accepted: 8 November 2021 / Published: 17 November 2021
(This article belongs to the Section Ocean Engineering)

Abstract

:
This study focused on the three-dimensional surface crack growth of a spherical pressure shell. Eight maraging steel 18Ni (250) samples were fabricated and tested, and the fatigue crack growth rate curves were obtained. Considering the influence of plastic closure effect and sample thickness on crack growth, the fitting formula of fatigue crack growth only related to materials was obtained. Based on the three-dimensional crack closure theory and the strip yield model, a three-dimensional surface crack growth model of spherical pressure shell was established. By using a self-written program and FRANC3D, the three-dimensional surface crack growth simulations of the spherical shell were completed. The influence of the initial shape ratio and initial depth of the crack on the crack growth and the fatigue life of the spherical shell was analyzed.

1. Introduction

Deep-sea manned submersibles are high-end marine equipment used for deep-sea exploration and scientific research, as well as the development of ocean mineral resources. The pressure hull is an important part of the deep-sea submersible. Existing large-depth manned submersibles adopt spherical pressure shells, which have the advantages of simple structure, uniform force, good bulk density, and bearing capacity, and which play a role in ensuring the normal operation of internal equipment and personnel safety during the dive [1,2]. The spherical shell is a medium-thickness shell formed by hemisphere stamping and welding along the equator. Under the combined action of the alternating external pressure of seawater and the welding residual stress, the surface welding toe is prone to cracks and growth, resulting in structural fatigue damage and even failure. Therefore, the spherical shell made of maraging steel 18Ni (250) at 11,000 m deep is taken as the research object to study the three-dimensional (3D) surface fatigue crack growth behavior.
At present, many scholars have conducted theoretical research, numerical analyses, and experimental research on the 3D fatigue crack growth. For example, Luo et al. [3] analyzed the fatigue crack growth of 7050 aluminum alloy flat plates. They found that the crack growth under the standard test strongly depends on the test conditions, and the material parameters obtained were only applicable to the straight-through crack growth under a specific thickness and loading mode. Shlyannikov [4,5] analyzed the crack growth of a semi-elliptical surface under tensile, bending, and multiaxial loads, and studied the influence of the sample thickness on the crack growth and the variation of the out-of-plane constraint factor with the creep time. Wang et al. [6] established the effective stress intensity factor formula based on the crack closure effect, studied the growth characteristics of 30NCD material under three stress ratios, and showed that crack closure is the main cause of the correlation between the stress ratio and the crack growth rate. Guo et al. [7,8,9,10] has focused on the 3D constraint effect of the crack tip, stress intensity factor, and other parameters in the past 30 years. In the study of the 3D fatigue fracture theory and application, the theory and model of straight-thought cracks have been developed for complex 3D crack structures, and the propagation of various typical cracks have been simulated by computer-aided technology. The crack growth analysis and fatigue life prediction of various aviation metal materials were realized. Ngoula [11] analyzed the fatigue crack growth of cross welded joints by using the node release technology and considering the effects of structural residual stress and weld toe geometry. Chakherlou [12] effectively predicted the fatigue process of crack initiation and propagation of a bolted plate by using the prestress and stress concentration factor simulated by a finite element and AFGROW. Ai et al. [13] verified the accuracy of the theoretical calculation of fracture mechanics by FRANC3D software and the reliability of crack growth life prediction through calculation examples of embedded elliptical cracks and semi-elliptical surface cracks in thin plates. Wang et al. [14] combined ABAQUS and Zencrack software to carry out a numerical simulation analysis of the dwell-fatigue crack growth process, and the simulation results obtained were in good agreement with the test results.
In summary, although the research on fatigue crack growth behavior and theory has been relatively mature, there are few studies on the surface crack growth of the spherical pressure shell of deep submersibles. The surface crack at the weld toe of the spherical shell weld is a 3D crack that has not been penetrated. The 3D stress state of the crack tip is different from the standard test, so the fatigue performance parameters measured by the 18Ni (250) sample under the standard test were directly used to analyze the growth of the 3D cracks on the surface of the spherical shell and predict the life. The results are very uncertain.
In this study, eight maraging steel 18Ni (250) samples were fabricated and tested, and the fatigue crack growth rate curves were obtained. Based on the 3D fatigue crack closure theory, the fatigue crack growth rate curve of the 18Ni (250) samples under the standard test were fitted as the fatigue crack growth rate reference curve of the material, and the fatigue performance parameters independent of the test conditions were obtained. Based on the 3D strip yield model, a 3D crack growth model on the surface of spherical pressure shell was established. By using self-written program and FRANC3D, the three-dimensional surface crack growth simulations of spherical shell were completed. The influence of the initial shape ratio and initial depth of the crack on the crack growth and the fatigue life of the spherical shell was analyzed.

2. Materials Test

2.1. Design and Manufacturing

According to the Chinese Standard (GB/T 6398-2017) [15], which is in line with ASTM E647-2013a [16], the fatigue crack growth rate test under cyclic tensile load was carried out on the sample of 18Ni (250). The sample used in this test is a standard compact tensile sample, and the specific size requirements are as follows: the thickness B of the C(T) sample should satisfy W/20 ≤ BW/2; the minimum width W cannot be less than 25 mm; the notch length an should satisfy 0.1 Wan ≤ 0.15 W; and the minimum pre-crack length should be ap ≥ 0.2 W.
The size was selected according to the requirements of the above specifications. The thickness B of the C(T) sample of the 18Ni (250) is designed to be 12.5 mm; the sample width W is 60 mm; the length L is 62.5 mm. The sample sizes are shown in Figure 1.
To ensure the accuracy of the test results, the 8 samples were grouped in pairs, and tested twice under each group of stress ratio. The 8 samples were numbered 1-1#, 1-2#, 2-1#, 2-2#, 3-1#, 3-2#, 4-1#, and 4-2#. The test scheme is shown in Table 1. First, a 2-mm-length pre-crack was prefabricated on the sample, then the fatigue crack growth rate test was carried out by sinusoidal wave loading at a loading frequency of 5 Hz, and the stress ratios R were 0.1, 0.3, 0.5, and 0.7, respectively.

2.2. Material Properties

The performance parameters of the material are very important for numerical model solving, crack growth analysis, and the fatigue life prediction of structures. The chemical composition of 18Ni (250) is shown in Table 2. According to the Chinese Standard (GB/T228.1-2010) [17], which is in line with ISO 6892-1:2009 [18], the coupons were designed and tested, and its mechanical properties are shown in Table 3.
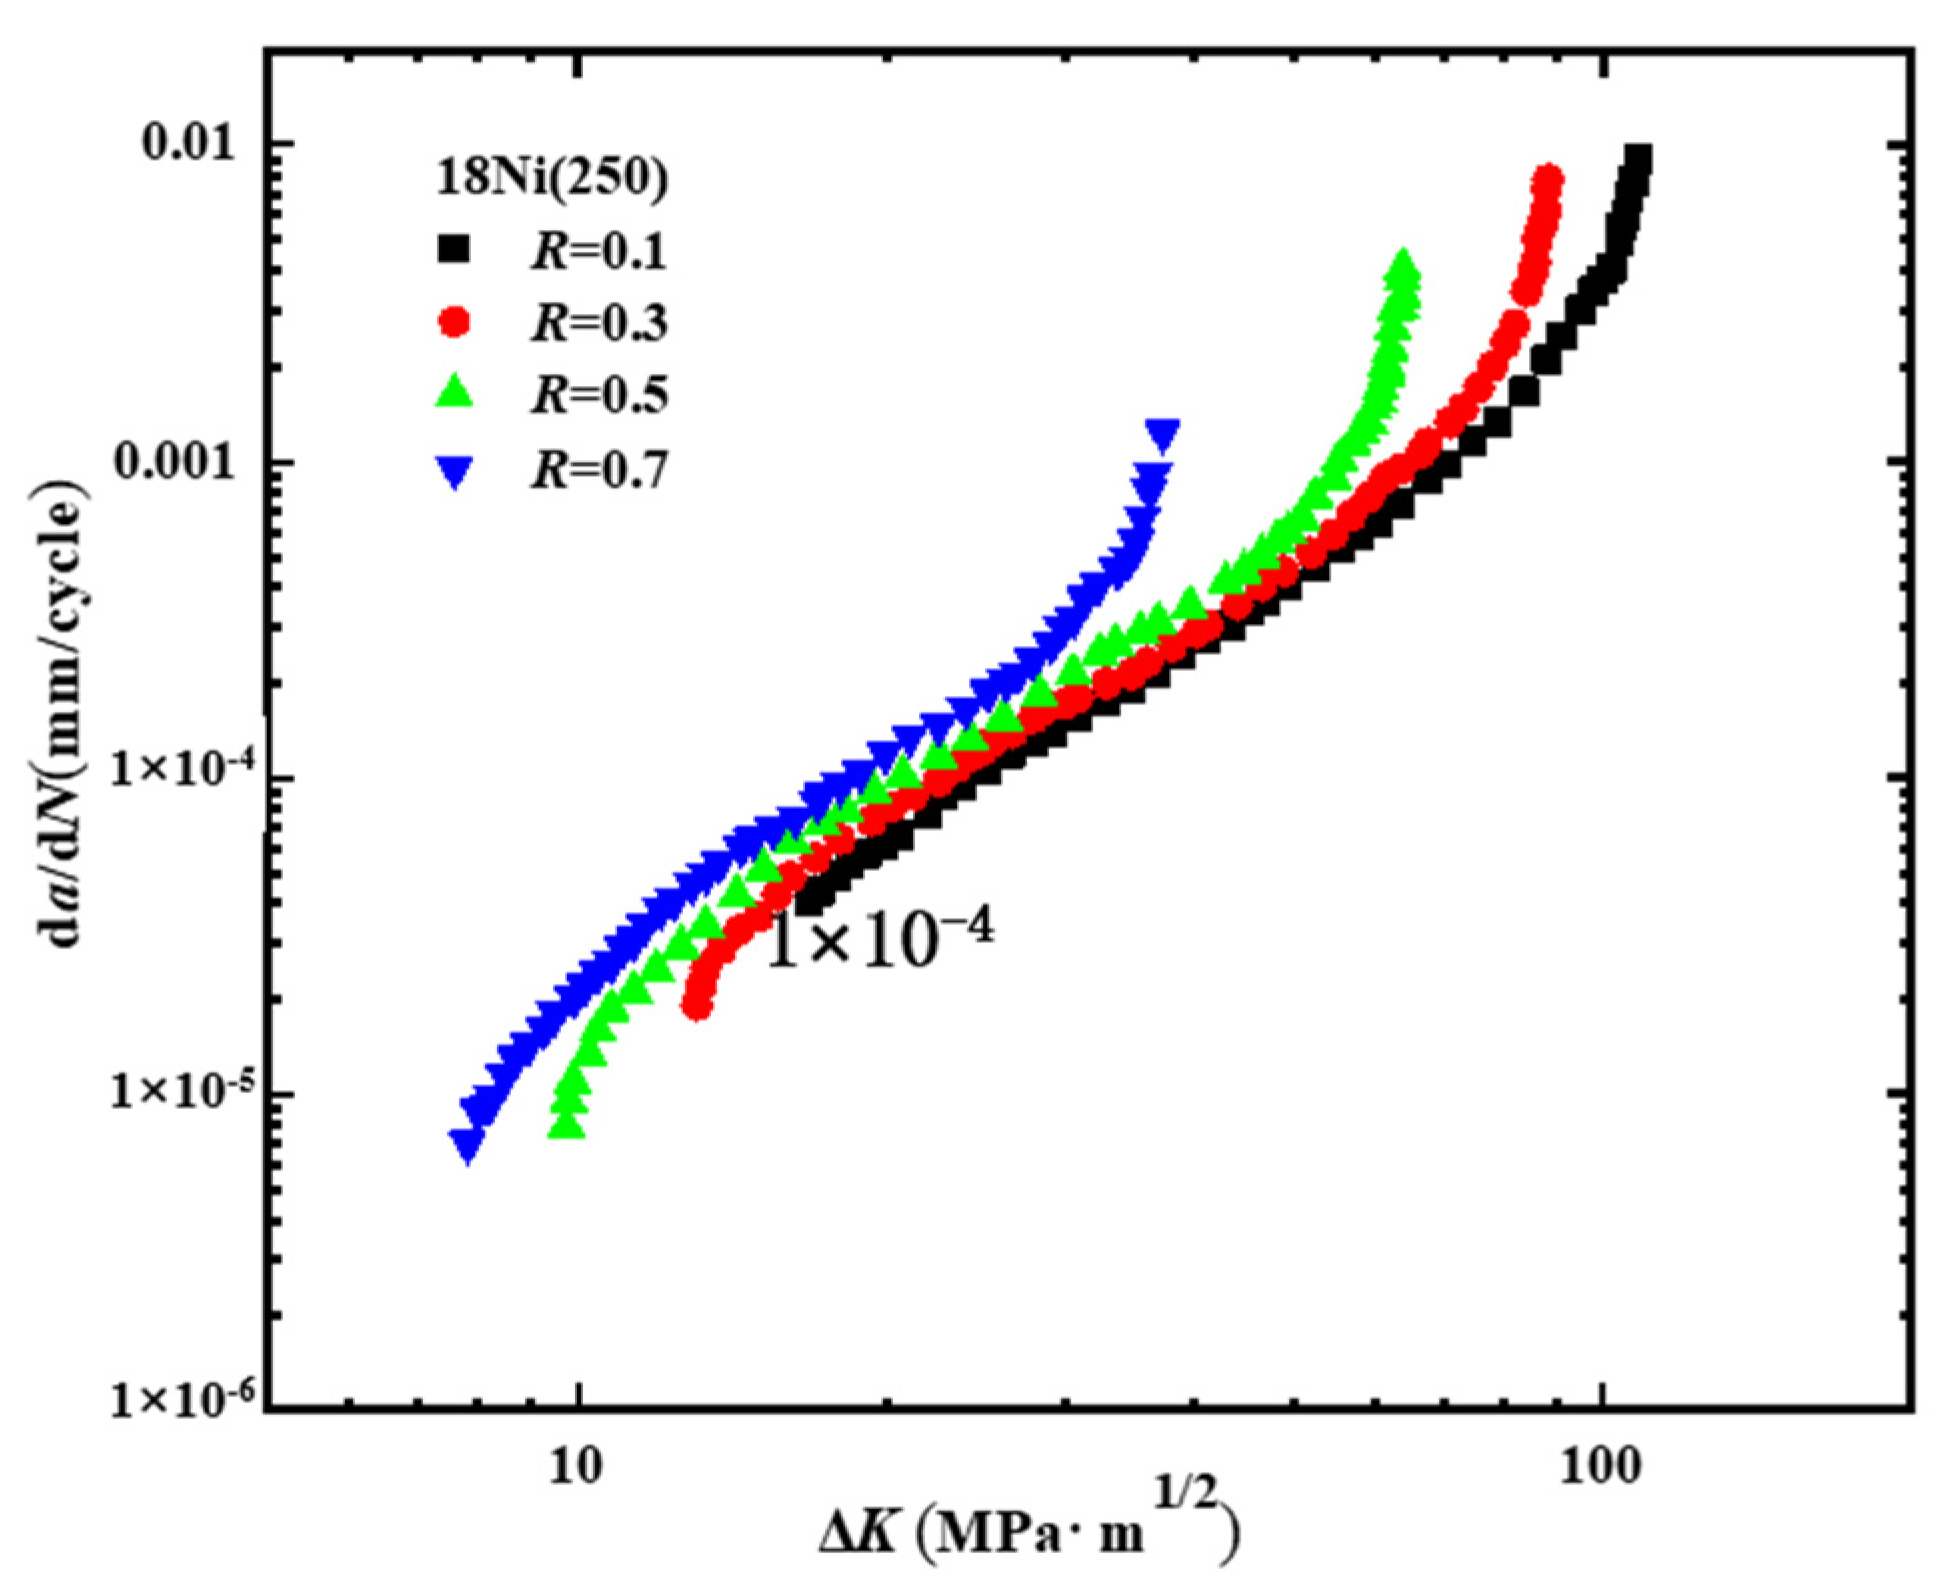
The fatigue crack growth rate test of the 18Ni (250) material sample under cyclic tensile load was carried out to obtain the fatigue performance parameters of the material. The electro-hydraulic servo thermal fatigue testing machine MTS810-250KN was used for the test. The load stress ratio, waveform, and frequency were all controlled and recorded through host input. In the test, the crack opening displacement (COD) of the sample was measured by an MTS632.03F-30 extensometer, and the changes of load and crack tip opening displacement during the test were recorded. The test system was equipped with a standard cyclic calculation device, and the fatigue crack growth test results and data were given by the computer supporting the testing machine. The fitted fatigue crack growth rate curves corresponding to the test results were unified, as shown in Figure 2.
It can be found from Figure 2 that the stress ratio has a significant effect on the fatigue crack growth rate of the 18Ni (250) material sample. The fatigue crack growth rate curves of materials under different stress ratios present a relatively scattered state. Under the same stress intensity factor amplitude, the fatigue crack growth rate under high-stress ratio and low-stress ratio loads were about 2-10 times different. Moreover, since the two-dimensional through crack flat sample was used in the standard fatigue test, the crack growth rate curve and the material parameters it fits were also significantly affected by the thickness of the sample [9]. To accurately predict the surface crack growth rate and fatigue life of 18Ni (250) spherical shells, it is necessary to obtain the fatigue performance parameters that are only related to the material.

2.3. Simplified Strip Model of Plastic Zone

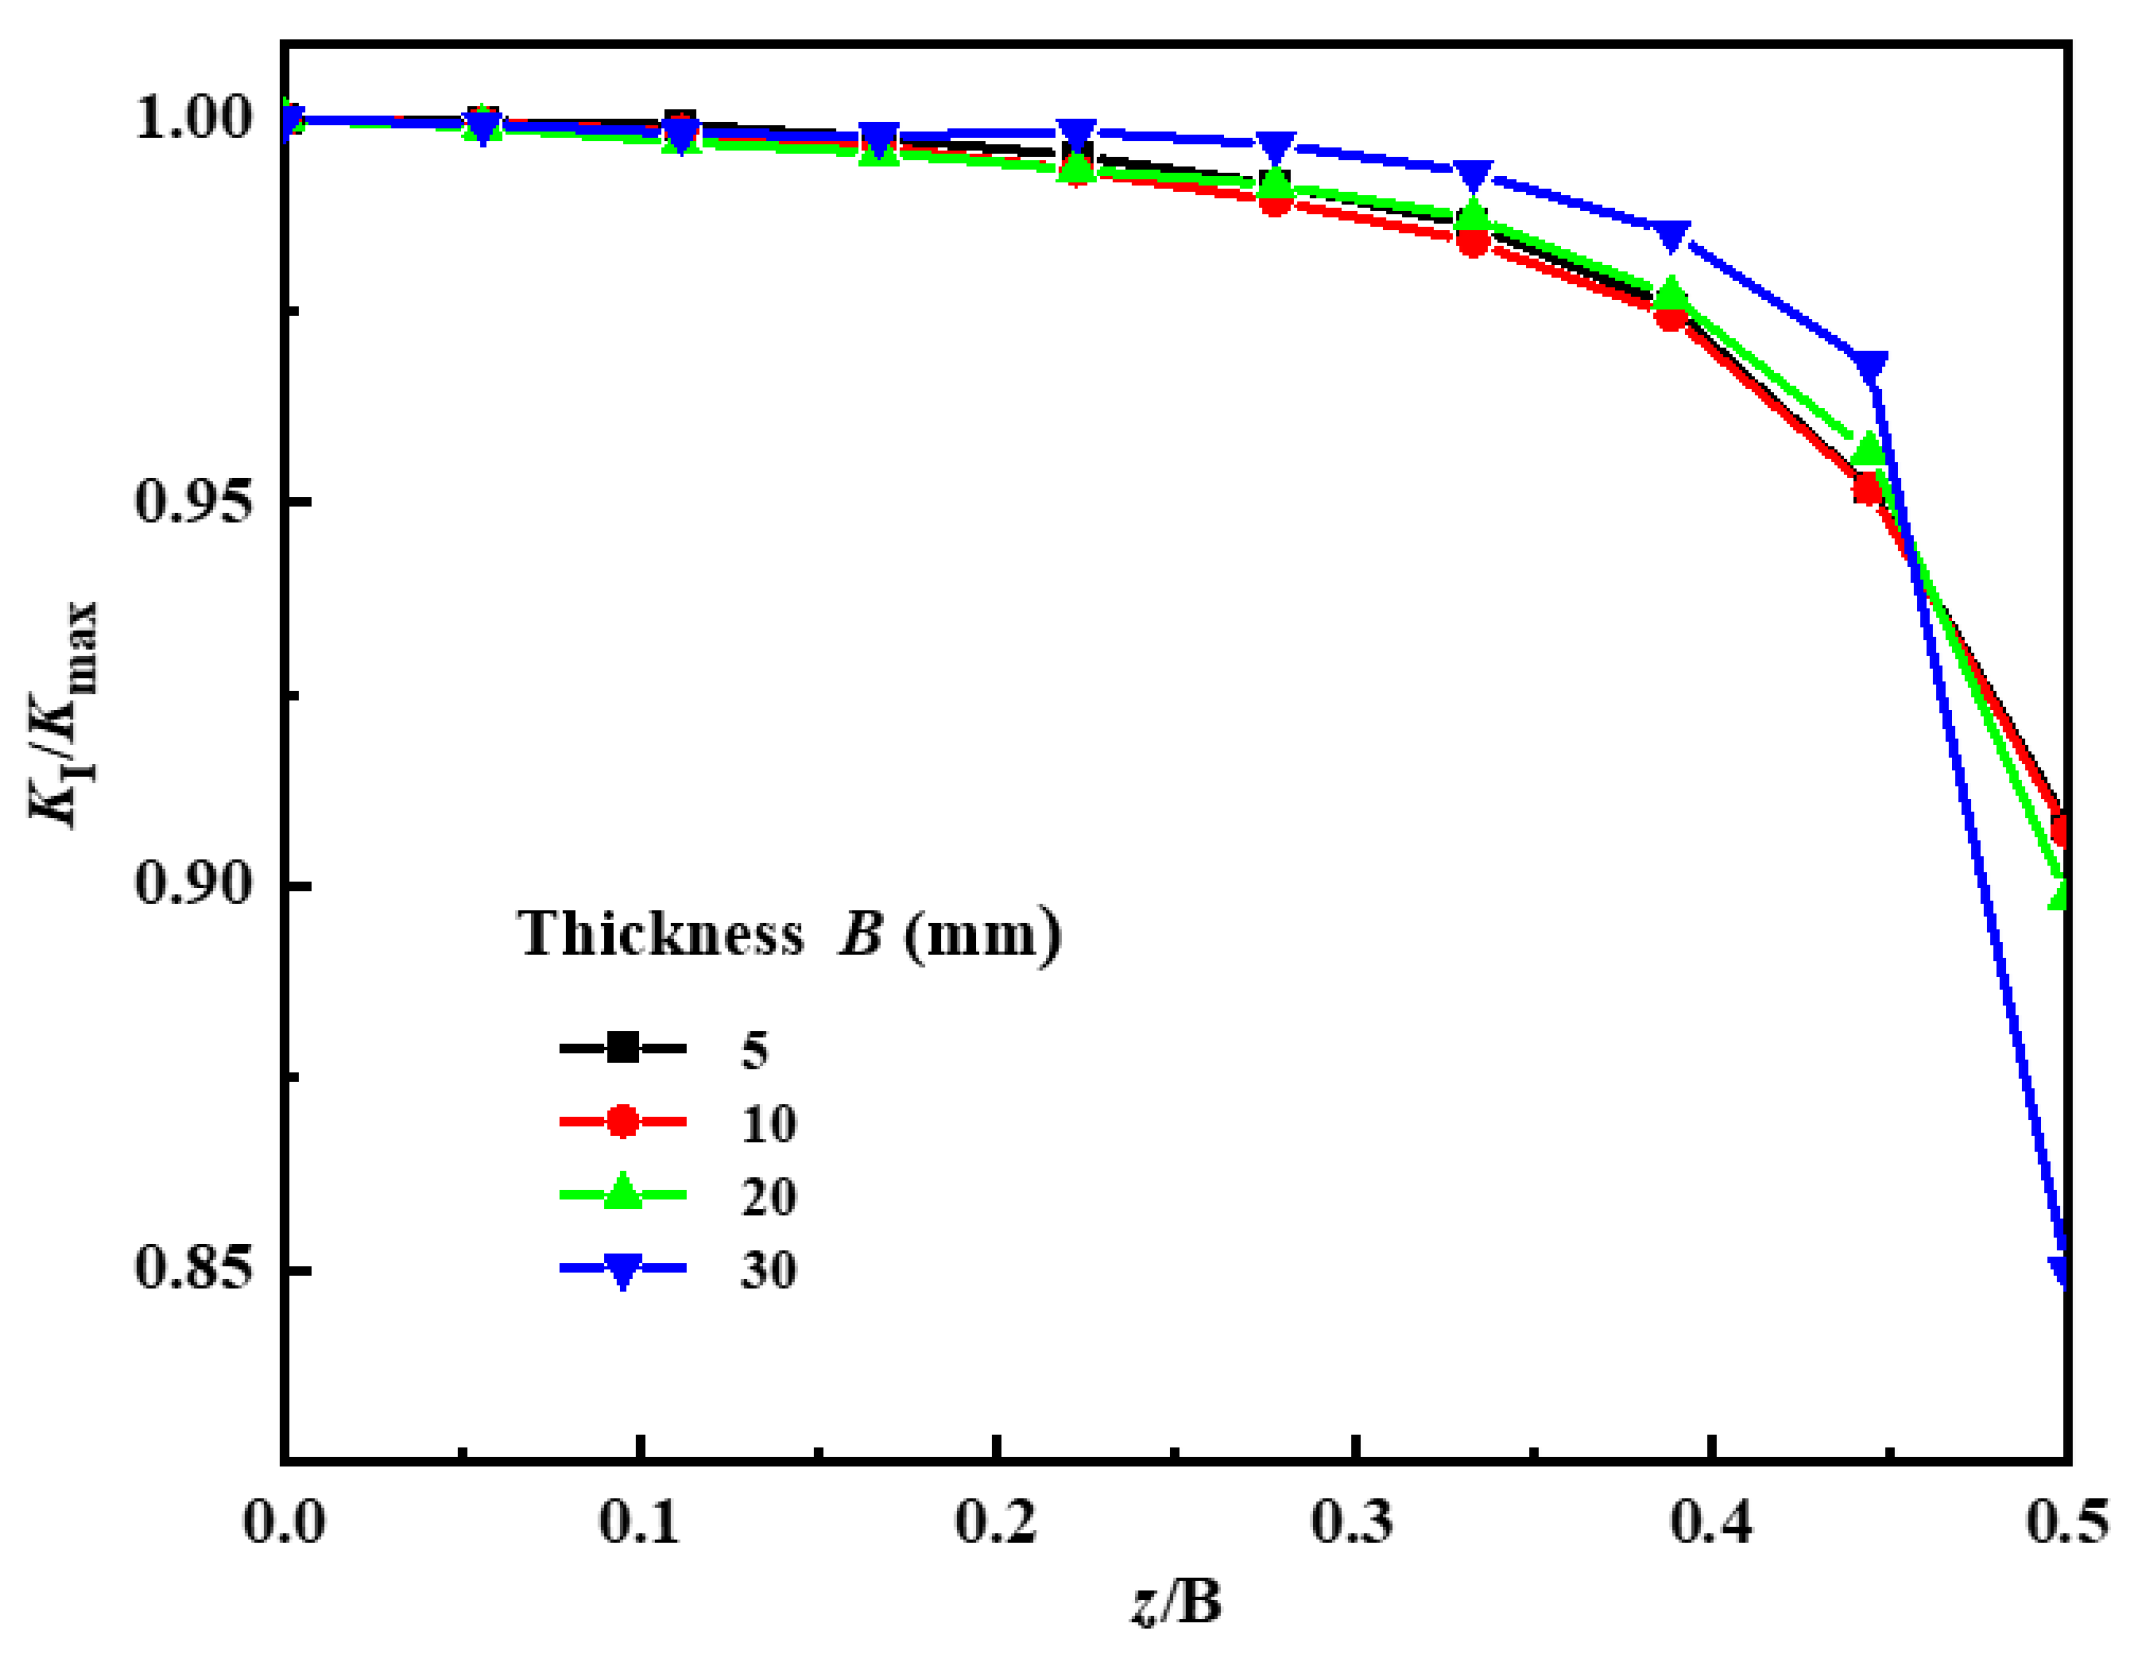
For maraging steel 18Ni (250), due to the singularity of the stress-strain field at the crack front, the stress in the region close to the crack tip tends to infinity, and it is inevitable that the material near the crack tip will yield into plasticity. For a finite width plate (width of 40 mm) with a central penetrating crack (length of 8 mm), the Dugdale model can be established by decomposing the model into a finite width plate model subjected to uniaxial tension and a finite width plate model under yield stress in the crack plastic zone. The crack front stress intensity factors were calculated for the plates with a thickness of 5 mm, 10 mm, 20 mm and 30 mm, respectively. Considering its symmetric distribution along the thickness of the plate, the variation of stress intensity factor from the middle surface to the surface of the plate is shown in Figure 3.
It can be seen from Figure 3 that the stress intensity factor gradually decreases from the midplane to the surface and reaches its maximum value at the midplane. With the increase of the plate thickness, the amplitude of the stress intensity factor increases, so it can be seen that the stress intensity factor distribution of the crack front has a certain thickness effect.
In the two-dimensional fracture theory, the thin plate is assumed to be the plane stress state, and the thick plate is assumed to be the plane strain state, but it is often inadequate in solving three-dimensional practical problems. Bellet [19] et al. proved that the two-dimensional or planar methods were inaccurate or even gave wrong conclusions in predicting fatigue fracture of three-dimensional cracked body by tests. Therefore, in this paper, the solution of the three-dimensional crack front stress intensity factor is studied considering the thickness effect.
The effective stress intensity factor amplitude ∆Keff of the crack front was expressed as follows:
Δ K eff = K max - K open = Δ K ( 1 - K open / K max 1 - R ) ,
where Kmax is the maximum stress intensity factor of the crack front, Kopen is the opening stress intensity factor of crack front, and Kopen/Kmax is the crack surface opening stress ratio considering the crack closure.
Chang and Guo [20] proposed a three-dimensional strip yield model that could reflect both in-plane constraints and out-of-plane constraints, and comprehensively considered the influence of the fatigue crack plastic closure and the thickness effect on propagation. By integrating the constraints of a thin plastic zone along the plate thickness direction, the overall constraint factor αg was fitted, which can reflect the constraint effect of the whole straight crack, as follows:
α g = 1 + 0.2088 ( r po / B ) 0.5 + 1.5046 ( r po / B ) 1 2 v + 0.2088 ( r po / B ) 0.5 + 1.5046 ( r po / B )
where,
r po = π 8 ( K max σ flow ) 2 ,
σ flow = ( σ s + σ b ) / 2 ,
where rpo is the size of the crack tip plastic zone calculated according to the strip yield model [9], B is the thickness of the through cracked plate, v is Poisson’s ratio of material, and σflow is the flow stress of the material.
The opening stress ratio under the action of crack closure is the key to solving the effective stress intensity factor amplitude. The expression of the opening stress ratio at the front edge of the straight-through crack based on the global constraint factor αg is as follows [20]:
K open K max = 1 - η 3 ,  
η = ( 1 R 2 ) 2 ( 1 + 10.34 R 2 ) ( 1 + 1.67 R 1.61 + 1 0.15 π α g ) 4.6 .
Combined with Equation (1), the effective stress intensity factor amplitude ∆Keff was calculated as the parameter driving fatigue crack growth instead of ∆K in the Paris formula [21], which controls the crack growth rate, where a fatigue crack growth model considering both plate thickness effect and plastic closure effect in the process of straight-through crack growth can be obtained. Its expression is as follows:
d a / d N = C eff ( Δ K eff ) n eff ,
where Ceff and neff represent the objective fatigue performance parameters of the material.
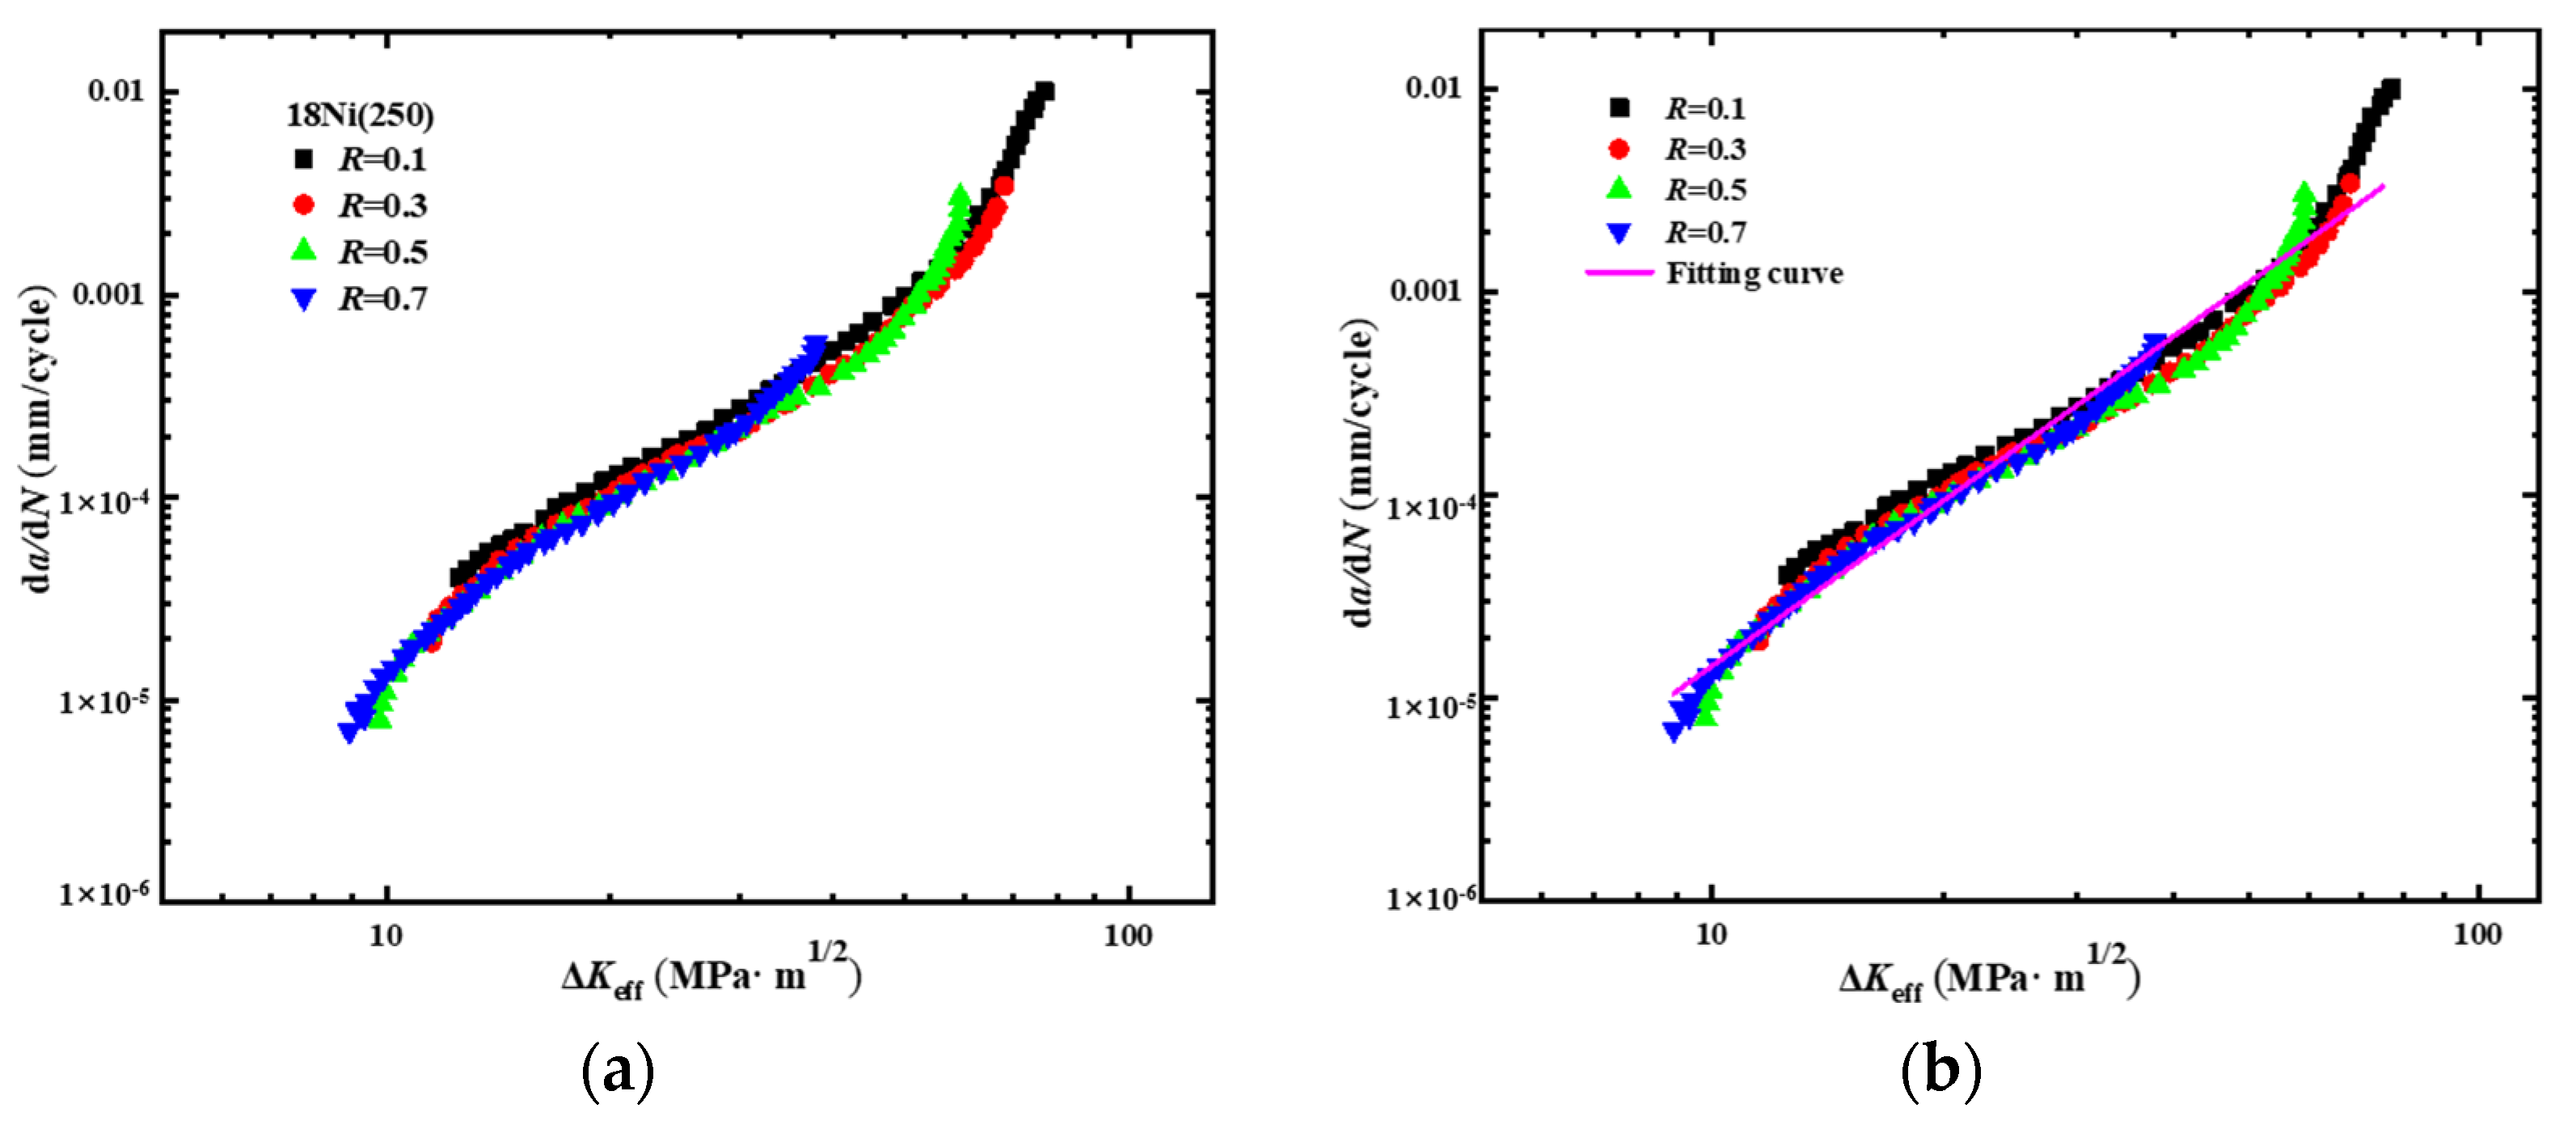
The fatigue crack growth data in Figure 2 are processed by Equations (1)–(6), and it can be found that they are nearly unified on a curve, as shown in Figure 4a. Then, linear fitting is performed on the coordinates to obtain the 18Ni (250) fatigue crack growth rate reference curve, as shown in Figure 4b, and its expression is as follows:
d a d N = 2.89 e 8 ( Δ K eff ) 2.7 ,
where Ceff = 2.89 × 10⁻⁸, neff = 2.7 are the objective fatigue performance parameters of 18Ni (250) material, which are independent of the test conditions and can be used for 18Ni (250) fatigue crack growth analysis.

3. Three-Dimensional Surface Crack Growth on Spherical Shell

3.1. The Finite Element Model of a Spherical Shell with Surface Crack

The spherical pressure hull of the deep-sea manned submersible researched was made of 18Ni (250), with a diving depth of 11,000 m, a spherical shell thickness t of 0.052 m, and an inner diameter D of 2.1 m. The shell was welded along the equator by hemispherical stamping. In the finite element model, three-point constraints were used to impose boundary conditions, which can be seen in previous literature [22]. Three layers of the grids were divided along the thickness of the shell, and the average size of the surrounding elements was 0.06 times the inner diameter [23], and 17,928 nodes and 13,440 C3D8R volume element mesh models were obtained. Using the pressure formula recommended by the German Lloyd’s Register [24], the uniform pressure load P on the outer surface was calculated to be 111.1 MPa.
The semi-elliptical surface crack was introduced near the equator as the weld toe, as shown in Figure 5, and the mesh of the local model of the cracked spherical shell was re-divided (Figure 5a,b). Before the submersible dives, the cracks at the weld toes are subjected to the welding residual stress perpendicular to the crack surface. Assuming that the residual stress σR is linearly distributed along the thickness of the spherical shell, the specific solution formula of its distribution is as follows. The residual stress can be added to the crack surface through FRANC3D (Figure 5c).
{ σ R ( x ) = σ R ( 1 4 x / t ) ( 0 x t / 2 ) σ R ( x ) = σ R ( 4 x / t 3 ) ( t / 2 x t ) ,
where x = 0 represents the outer surface of the weld toe, the structure thickness is t, and the maximum residual stress σR = 0.3 σs.
After the finite element model of the spherical shell with surface cracks was established, the distribution of stress intensity factors (KI, KII, KIII) at the crack front was calculated by the M-Integral method.

3.2. Three-Dimensional Surface Crack Growth Model of Spherical Shell

The out-of-plane constraint effect of the crack front is the key to studyign the 3D fatigue crack growth, and it is also the focus of analyzing the 3D stress and strain field of the crack tip. She et al. [7] conducted a large number of studies on the out-of-plane stress confinement factor (TZ) of various typical cracks and found that the TZ distribution at different crack front points was highly consistent with the TZ distribution on the middle plane of a straight-through crack plate under a certain thickness. Therefore, the equivalent thickness based on the out-of-plane constraint effect was proposed, and the constraint effect solution method for straight-through cracks was extended to non-through curved cracks. Among them, the equivalent thickness Beq,i of each point on the front edge of the semi-elliptical surface crack was solved as follows:
B eq , i = c [ 1 φ u , i 6 Y ] ,
φ u , i = π / 2 φ i π / 2 , 0 < φ i < π / 2 ,
where i represents the point on the crack front and φi represents the angle of each point at the crack front. Due to the symmetry of the semi-ellipse, φi chooses 1/4 of the ellipse angle, namely 0 < φ i < π / 2 , and Y is the crack shape ratio, that is, the ratio of crack depth a to the semi-major axis c, Y = a/c.
Therefore, the constraint effect on the surface crack of the spherical shell can be solved equivalent to the straight-through crack. That is, the overall constraint factor based on equivalent thickness αg can be written as:
α g = 1 + 0.2088 ( r po / B eq ) 0.5 + 1.5046 ( r po / B eq ) 1 2 v + 0.2088 ( r po / B eq ) 0.5 + 1.5046 ( r po / B eq ) ,
The 3D crack growth simulation on the surface of the spherical shell can be regarded as the advancing propagation and fitting process of each point at the crack front. The stress intensity factor at point i of the crack front edge on the spherical shell surface was obtained by the finite element method. According to Equations (5) and (10), the opening stress ratio Kopen/Kmax of the semi-elliptical crack front can be obtained, and then the effective stress intensity factor amplitude ∆Keff at point i of the front edge, according to Equation (1), can be calculated. The 3D crack growth model on the surface of the 18Ni (250) spherical shell is:
d a i d N = 2.89 e 8 ( Δ K eff , i ) 2.7 .

3.3. Simulation of Three-Dimensional Surface Crack Growth of Spherical Shell

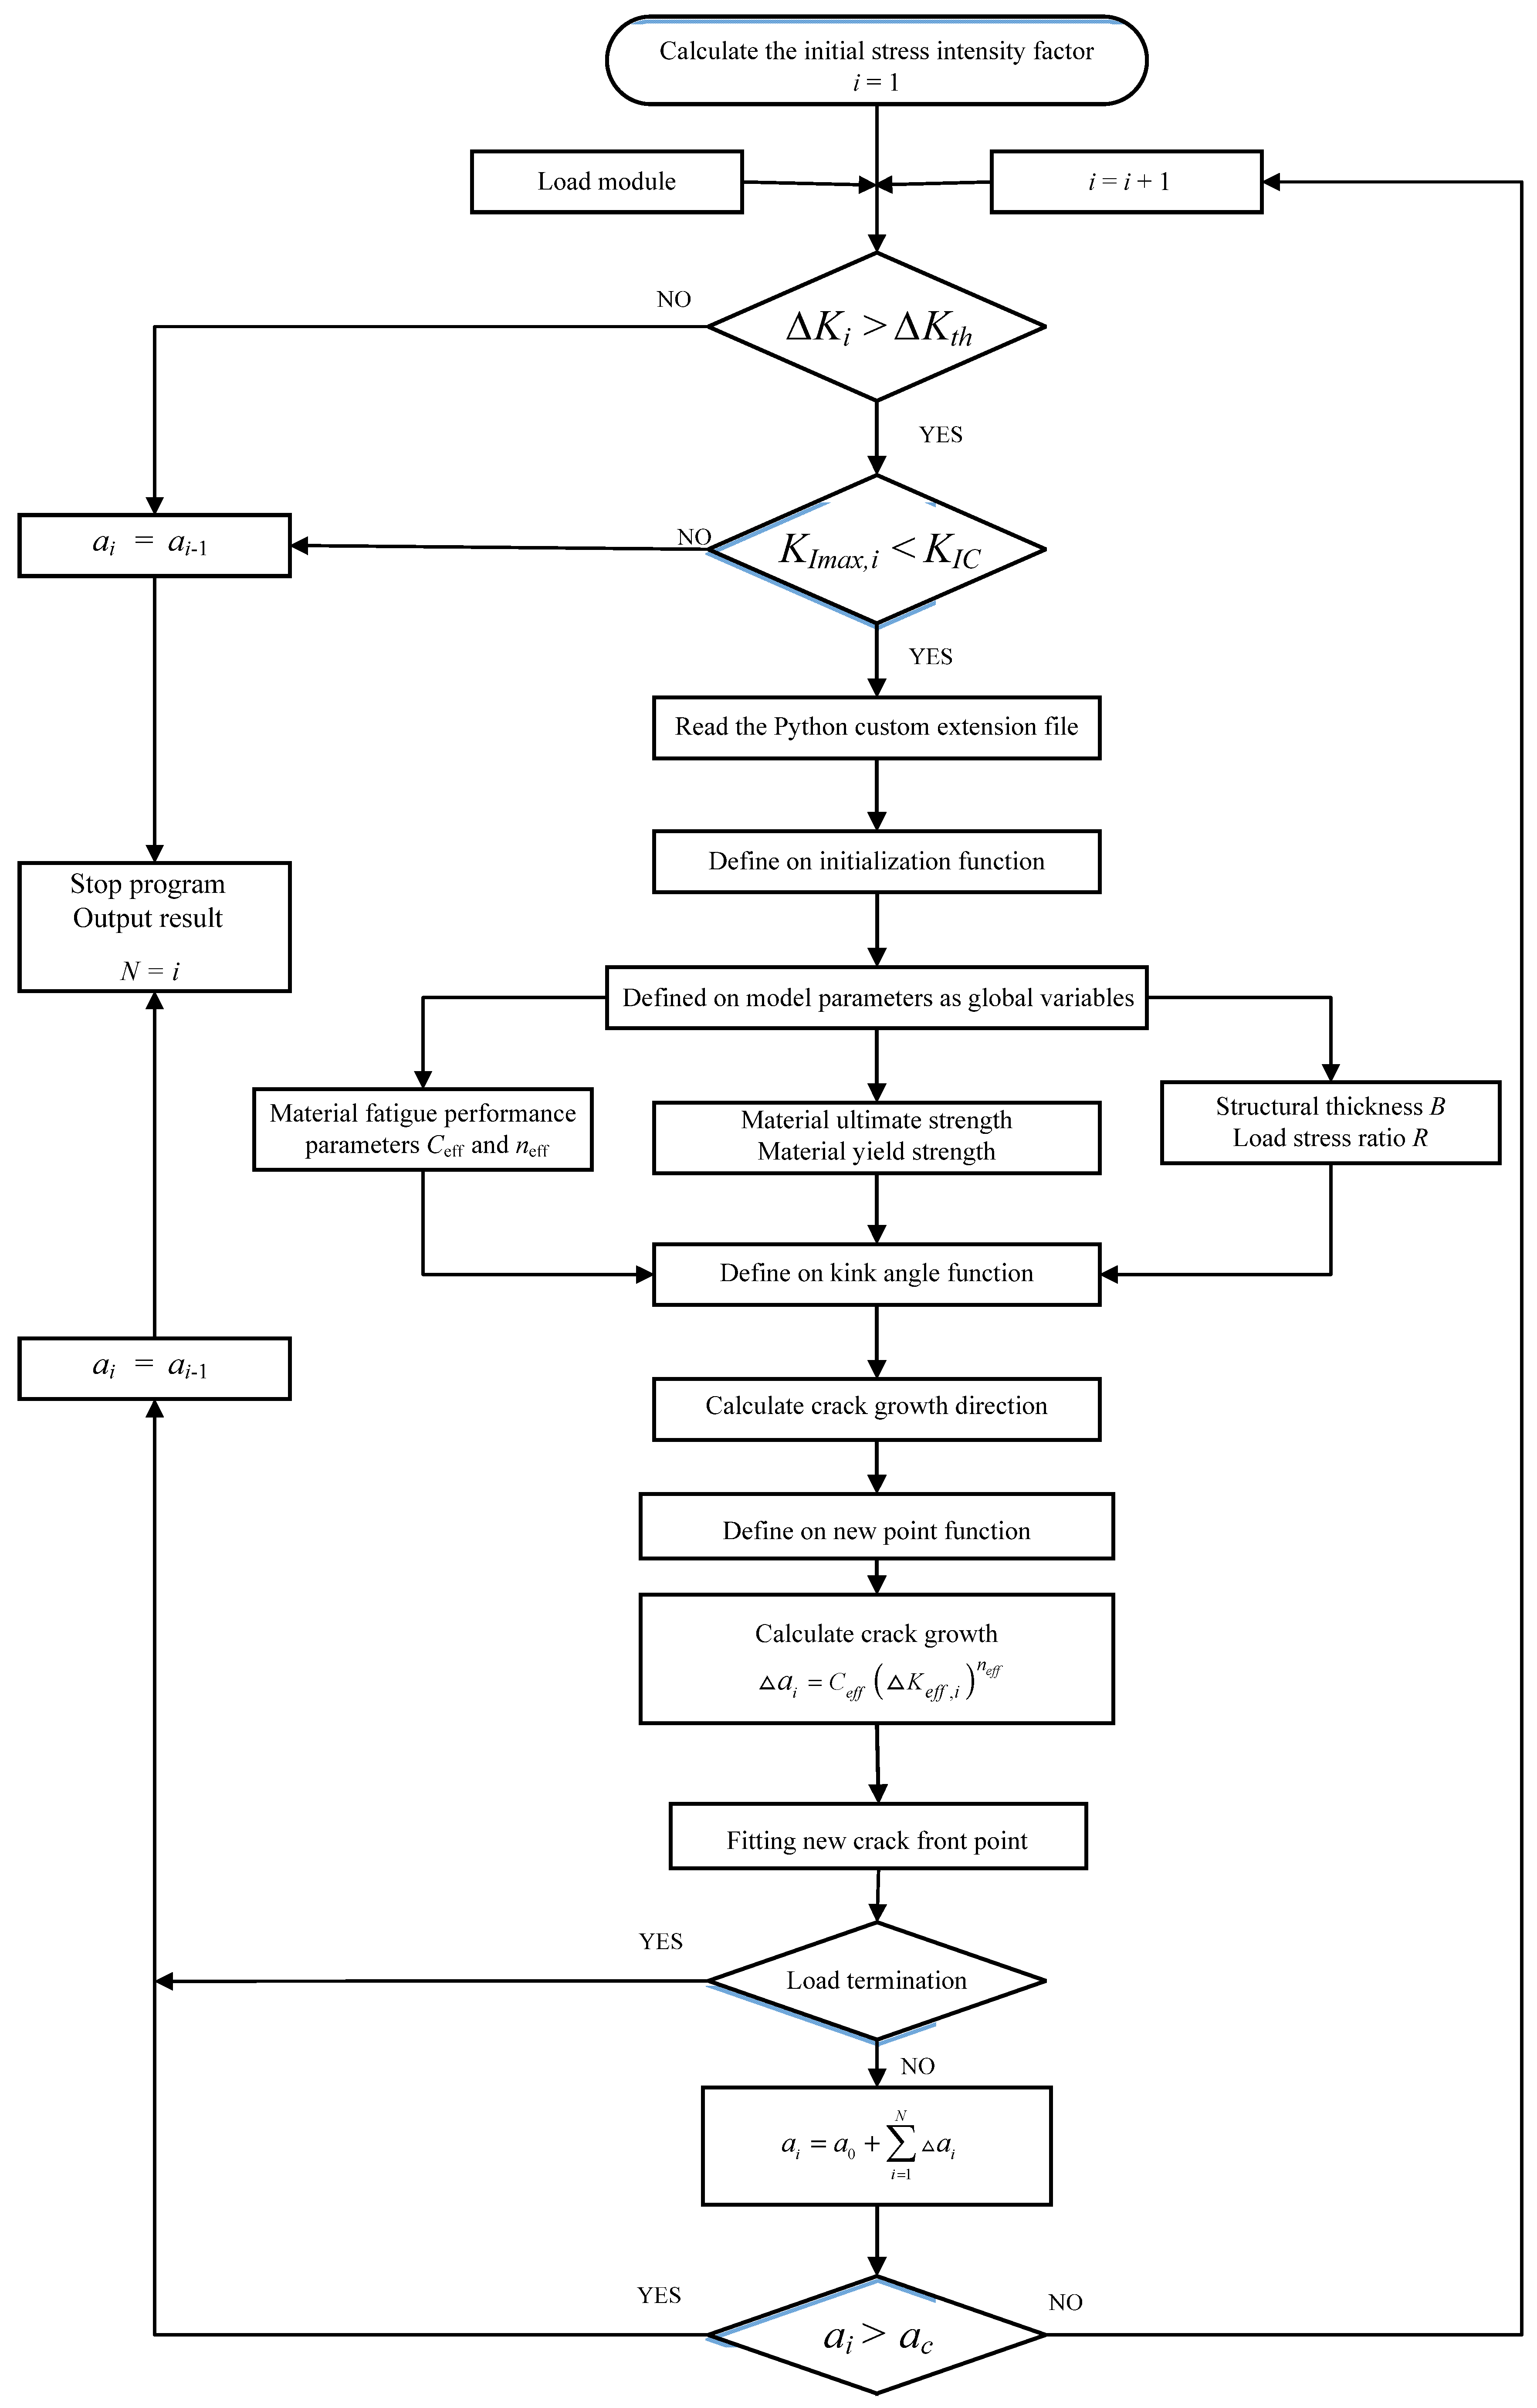
The 3D crack growth model on the surface of a spherical shell was programmed by Python language and was read into the FRANC3D software for 3D fracture mechanics calculation and analysis. The propagation model (Equation (13)) at each point i of the 3D crack front is taken as the fitting function of the new crack front point in the crack growth simulation. The maximum tensile stress criterion was used to determine the direction of the crack growth, and the kink angle function of crack growth was defined. According to the fracture parameters of the material, the crack growth at any point of the 3D crack front was obtained, and the new crack front was simulated by adding the current crack length at the point. By repeating this calculation process, the fatigue propagation of the 3D crack on the surface of the spherical pressure shell can be simulated. The detailed propagation process is shown in Figure 6.
According to the diving data analysis of the current in-service deep-sea submersibles, the allowable crack growth depth ac was defined as 1/10 of the spherical shell thickness [25], that is, when the shell surface crack expands to 5.2 mm, the shell fails, and the simulation stops. At this time, the number of cycles under the combined action of seawater alternating external pressure and welding residual stress was calculated, which is the fatigue life of the spherical shell.

4. Crack Growth Results and Analysis

4.1. The Effect of Crack Initial Shape Ratio on Crack Growth

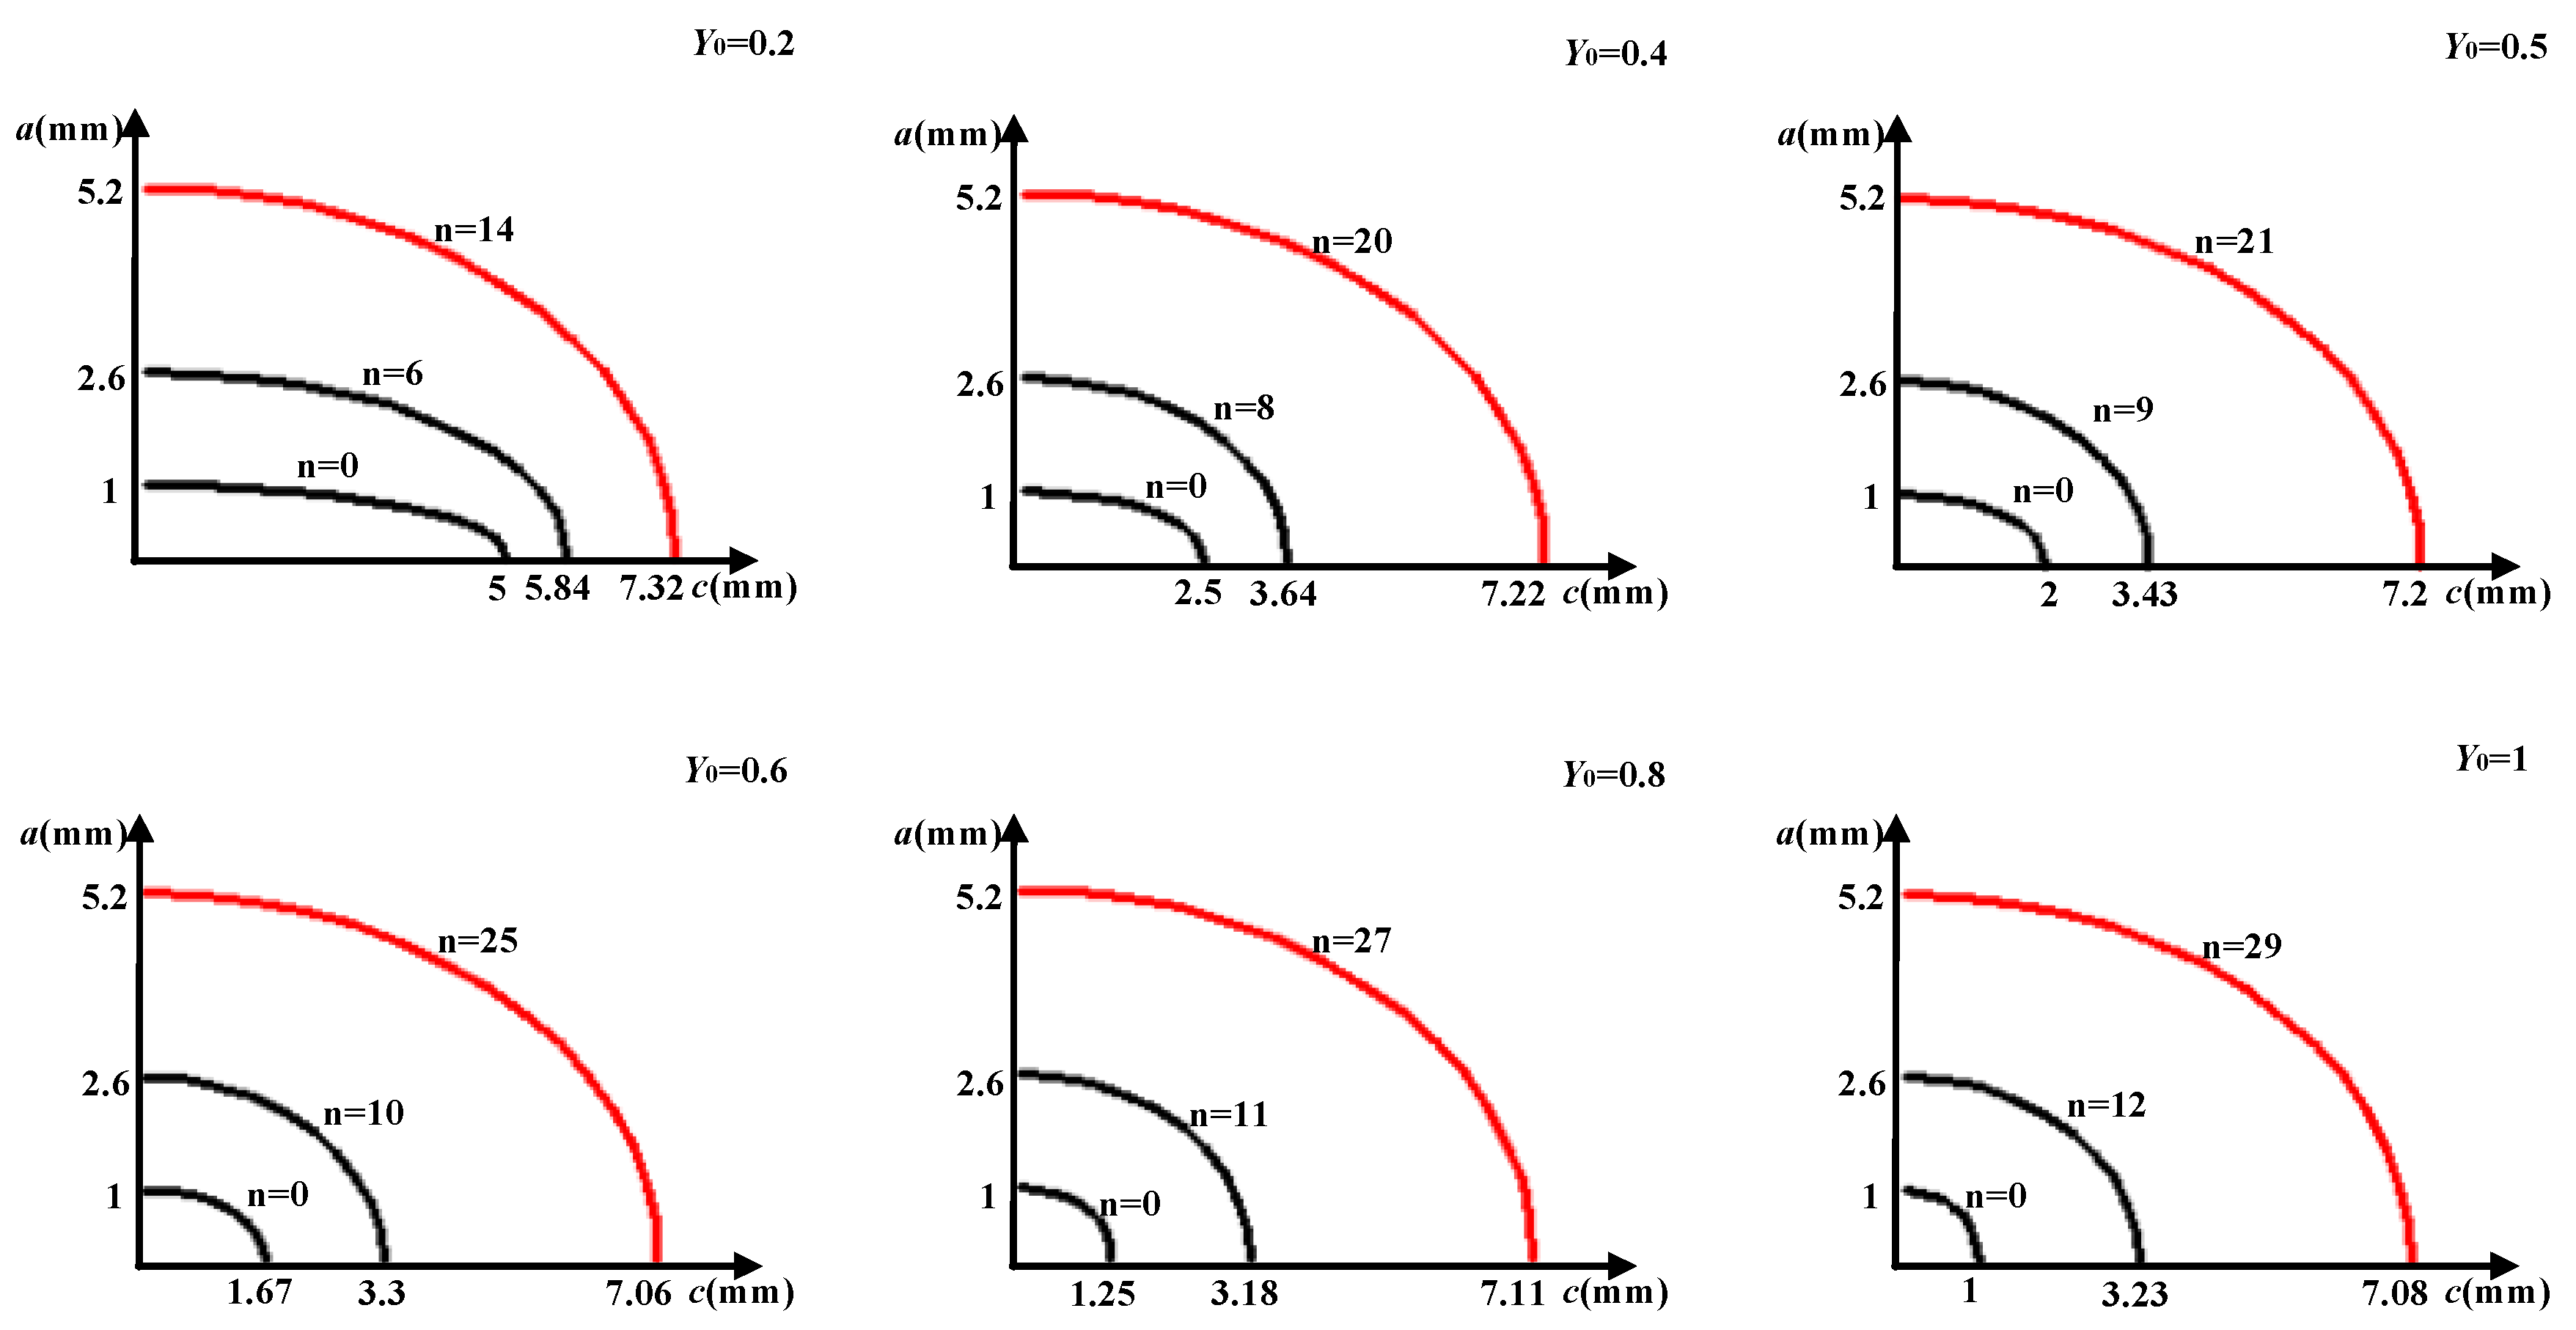
The crack shape ratio determines the shape of the crack surface. The semi-elliptic surface crack becomes flat as Y decreases. Taking the initial crack depth a0 as 1 mm and the initial crack shape ratio Y0 as 0.2, 0.4, 0.5, 0.6, 0.8, and 1, respectively, six groups of semi-elliptical surface cracks were simulated and analyzed according to the above 3D crack growth process.
Taking the critical size of the spherical shell surface crack ac = 5.2 mm, the semi-elliptical surface crack growth process under different initial shape ratios Y0 was obtained. Since the crack growth is a symmetrical model, half of this was used to describe the propagation path of the spherical shell surface crack and the shape change of the crack front, as shown in Figure 7. The red curve is the final shape of the crack front when the crack extends to the critical dimension ac = 5.2 mm in the depth direction.
According to the shape of the crack front at each propagation step, the ratio of the crack depth a to the critical dimension ac was taken as the abscissa, and the shape ratio change trend of the initial semi-elliptical surface crack during the propagation process was obtained, as shown in Figure 8. The crack depth development speed is higher than the lateral development when Y0 = 0.2. When Y0 is between 0.4 and 0.8, the transverse crack growth rate is higher than that in depth, and it develops very fast first and then tends to level off. The trend of cracks is also that the lateral development speed is higher than the depth development when Y0 = 1. As the semi-elliptical surface cracks with different shape ratios propagate to the critical size, the final shape ratio of the cracks tends to a constant at about 0.7. This shows that when the semi-elliptical surface crack with different initial shape ratios propagates to the critical size, the crack shape tends to be consistent.
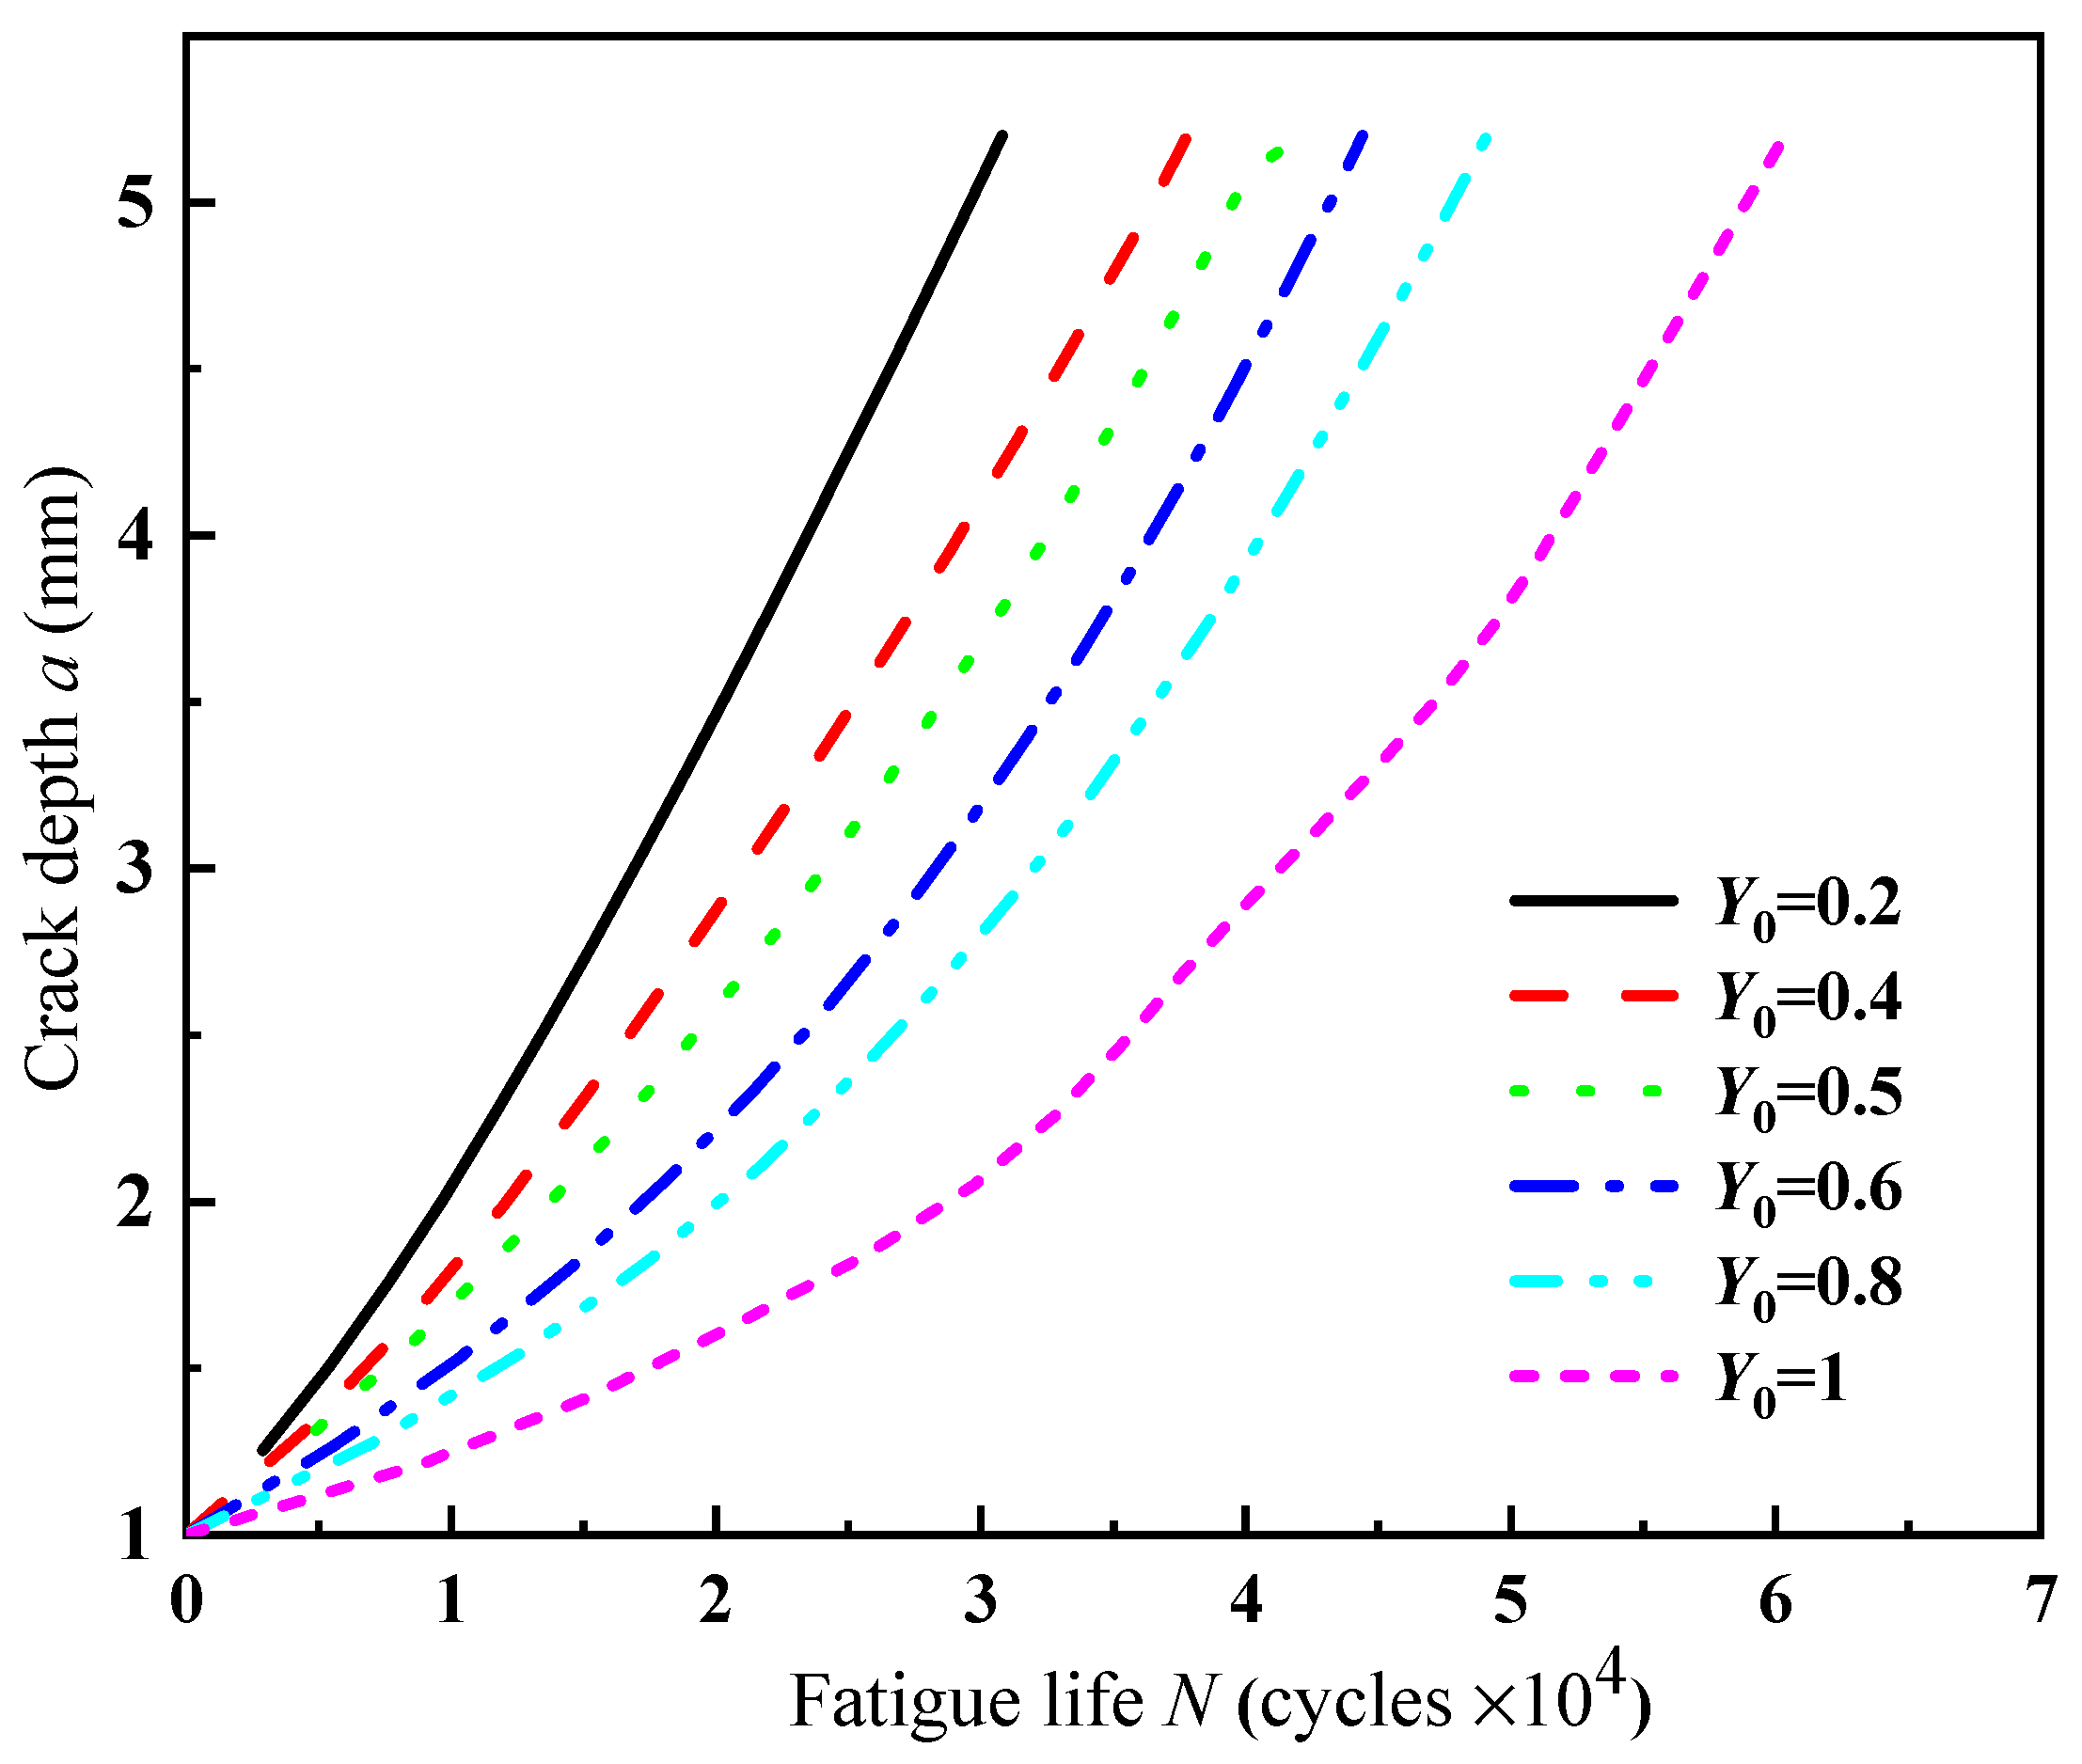
Since the slopes of the a-N curves of different initial cracks can be used to illustrate the growth speed of cracks in the depth direction, the crack growth law can also be illustrated by the a-N curve in Figure 9. Combining the crack growth simulation results data and the fatigue performance parameters of the material, the fatigue life of the spherical shell was further solved. The corresponding values are shown in Table 4.
It can be seen from Figure 9 that the fatigue life of the spherical shell increases significantly with the increase of the initial shape ratio when the initial crack depth is the same. When Y0 = 0.2, the fatigue life of the spherical shell is about 30,800 times, and when Y0 = 1, the fatigue life of the spherical shell reaches 60,300 times, which is 1.96 times the life of the spherical shell with Y0 = 0.2 and 1.23 times the life of the spherical shell with Y0 = 0.8. Accordingly, at the same initial crack depth, the smaller the crack shape ratio, the shorter the life of the spherical shell, that is, the long and narrow crack has the greatest potential safety hazard.

4.2. Effect of Initial Crack Depth on Crack Growth

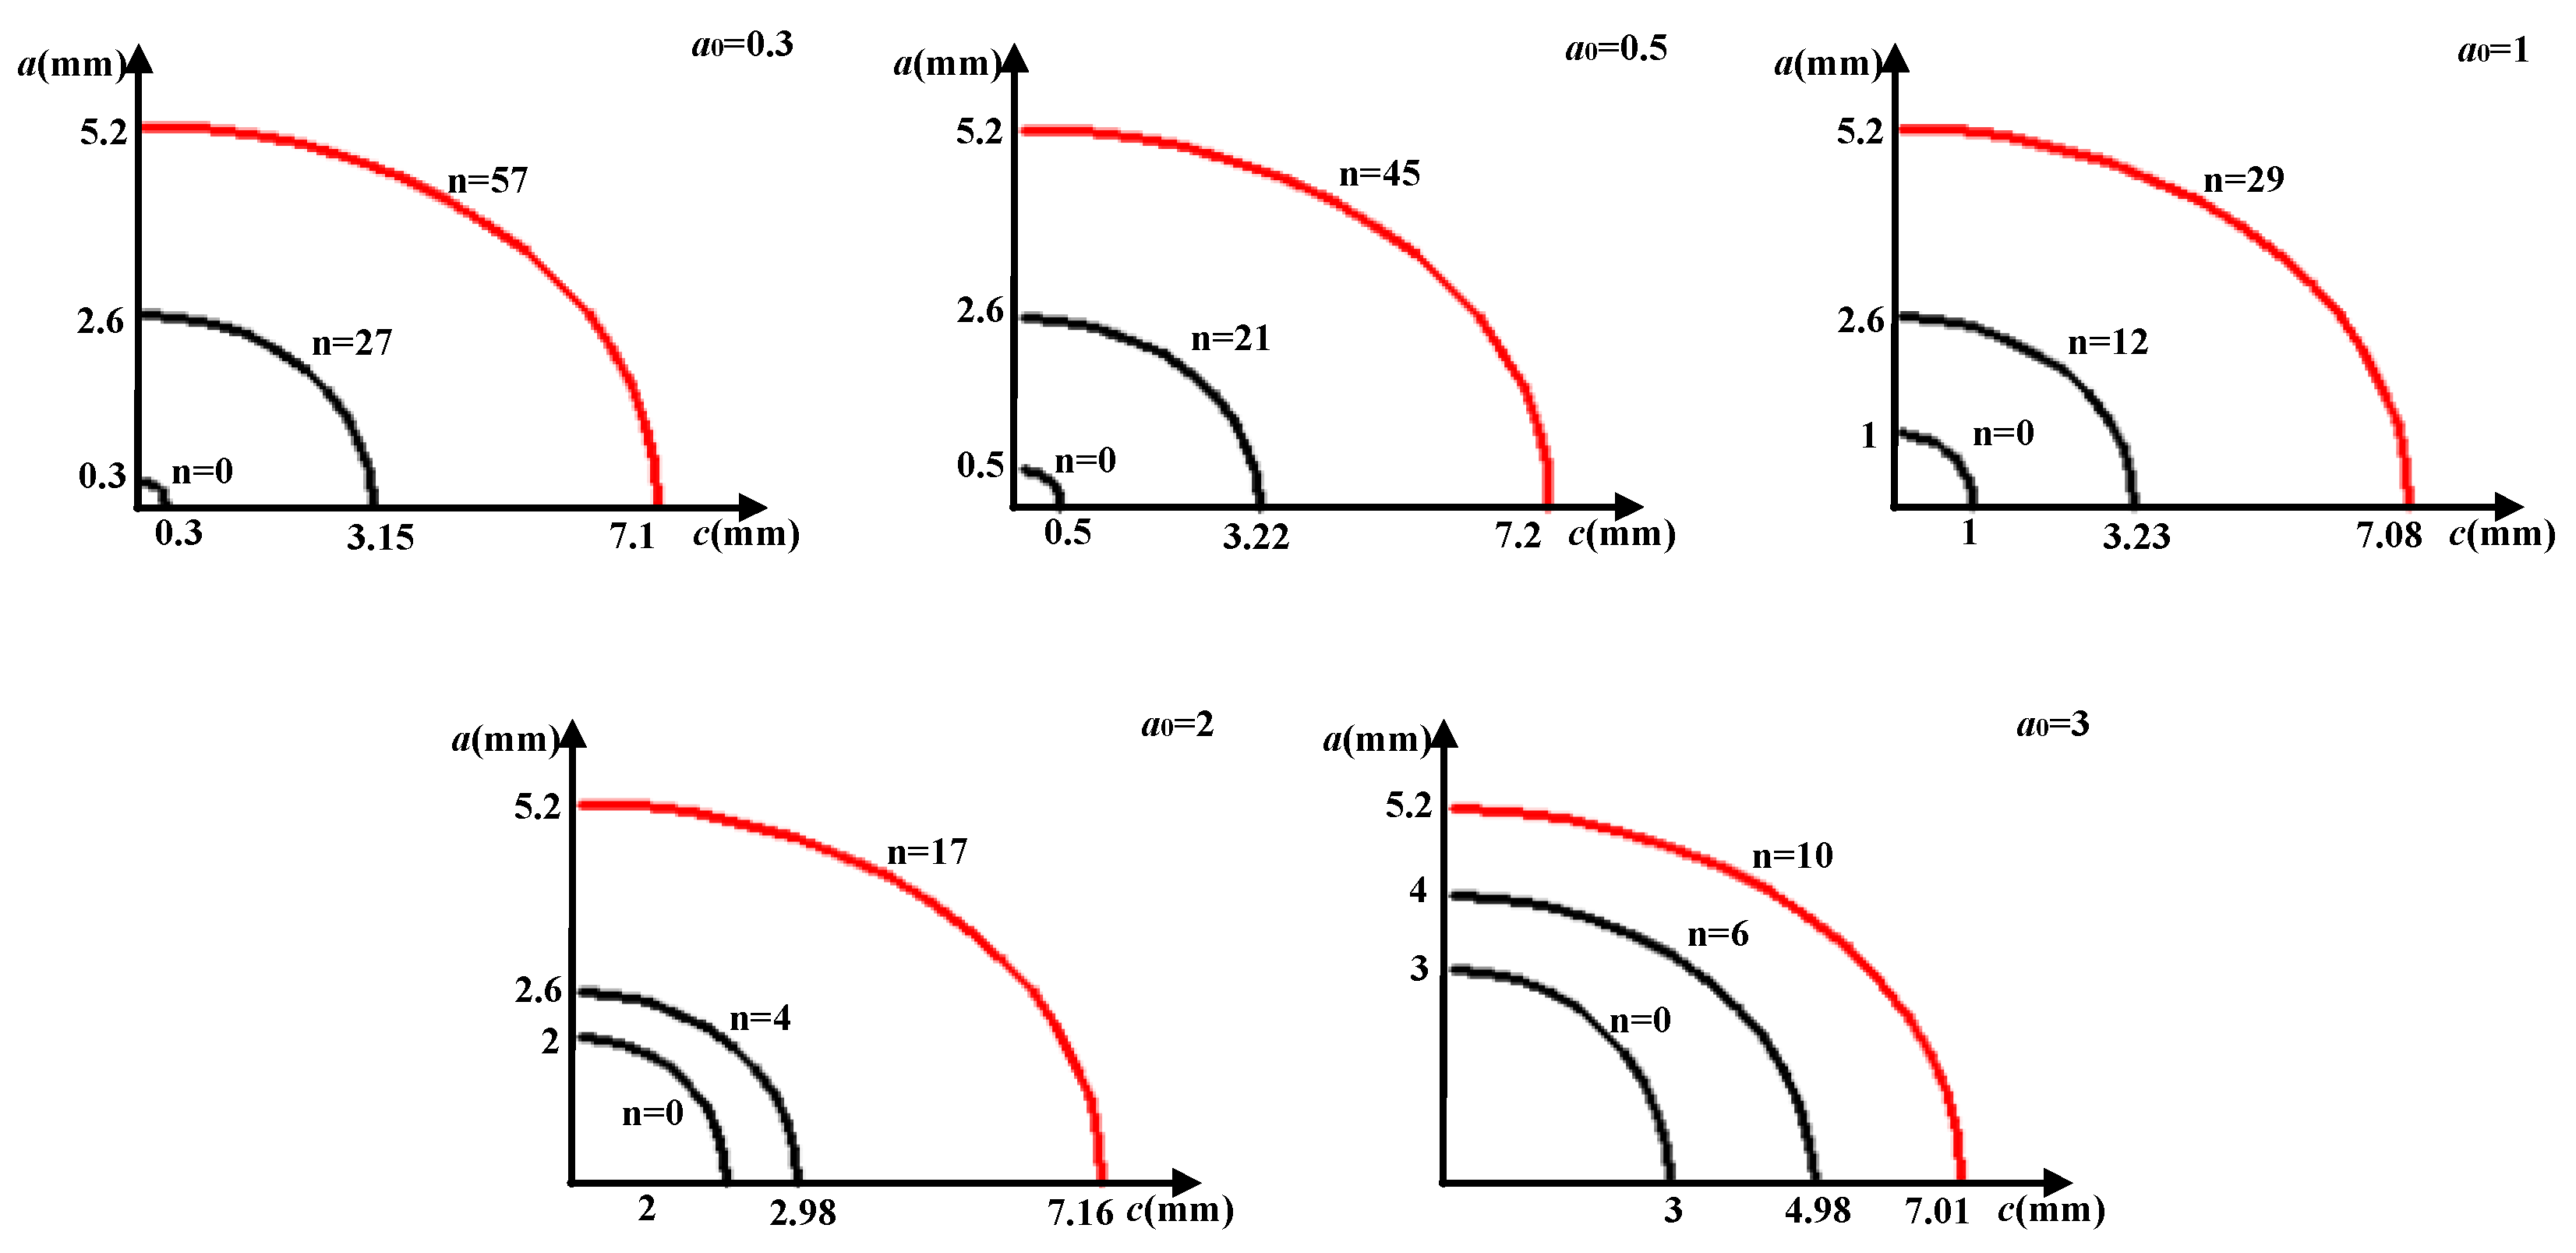
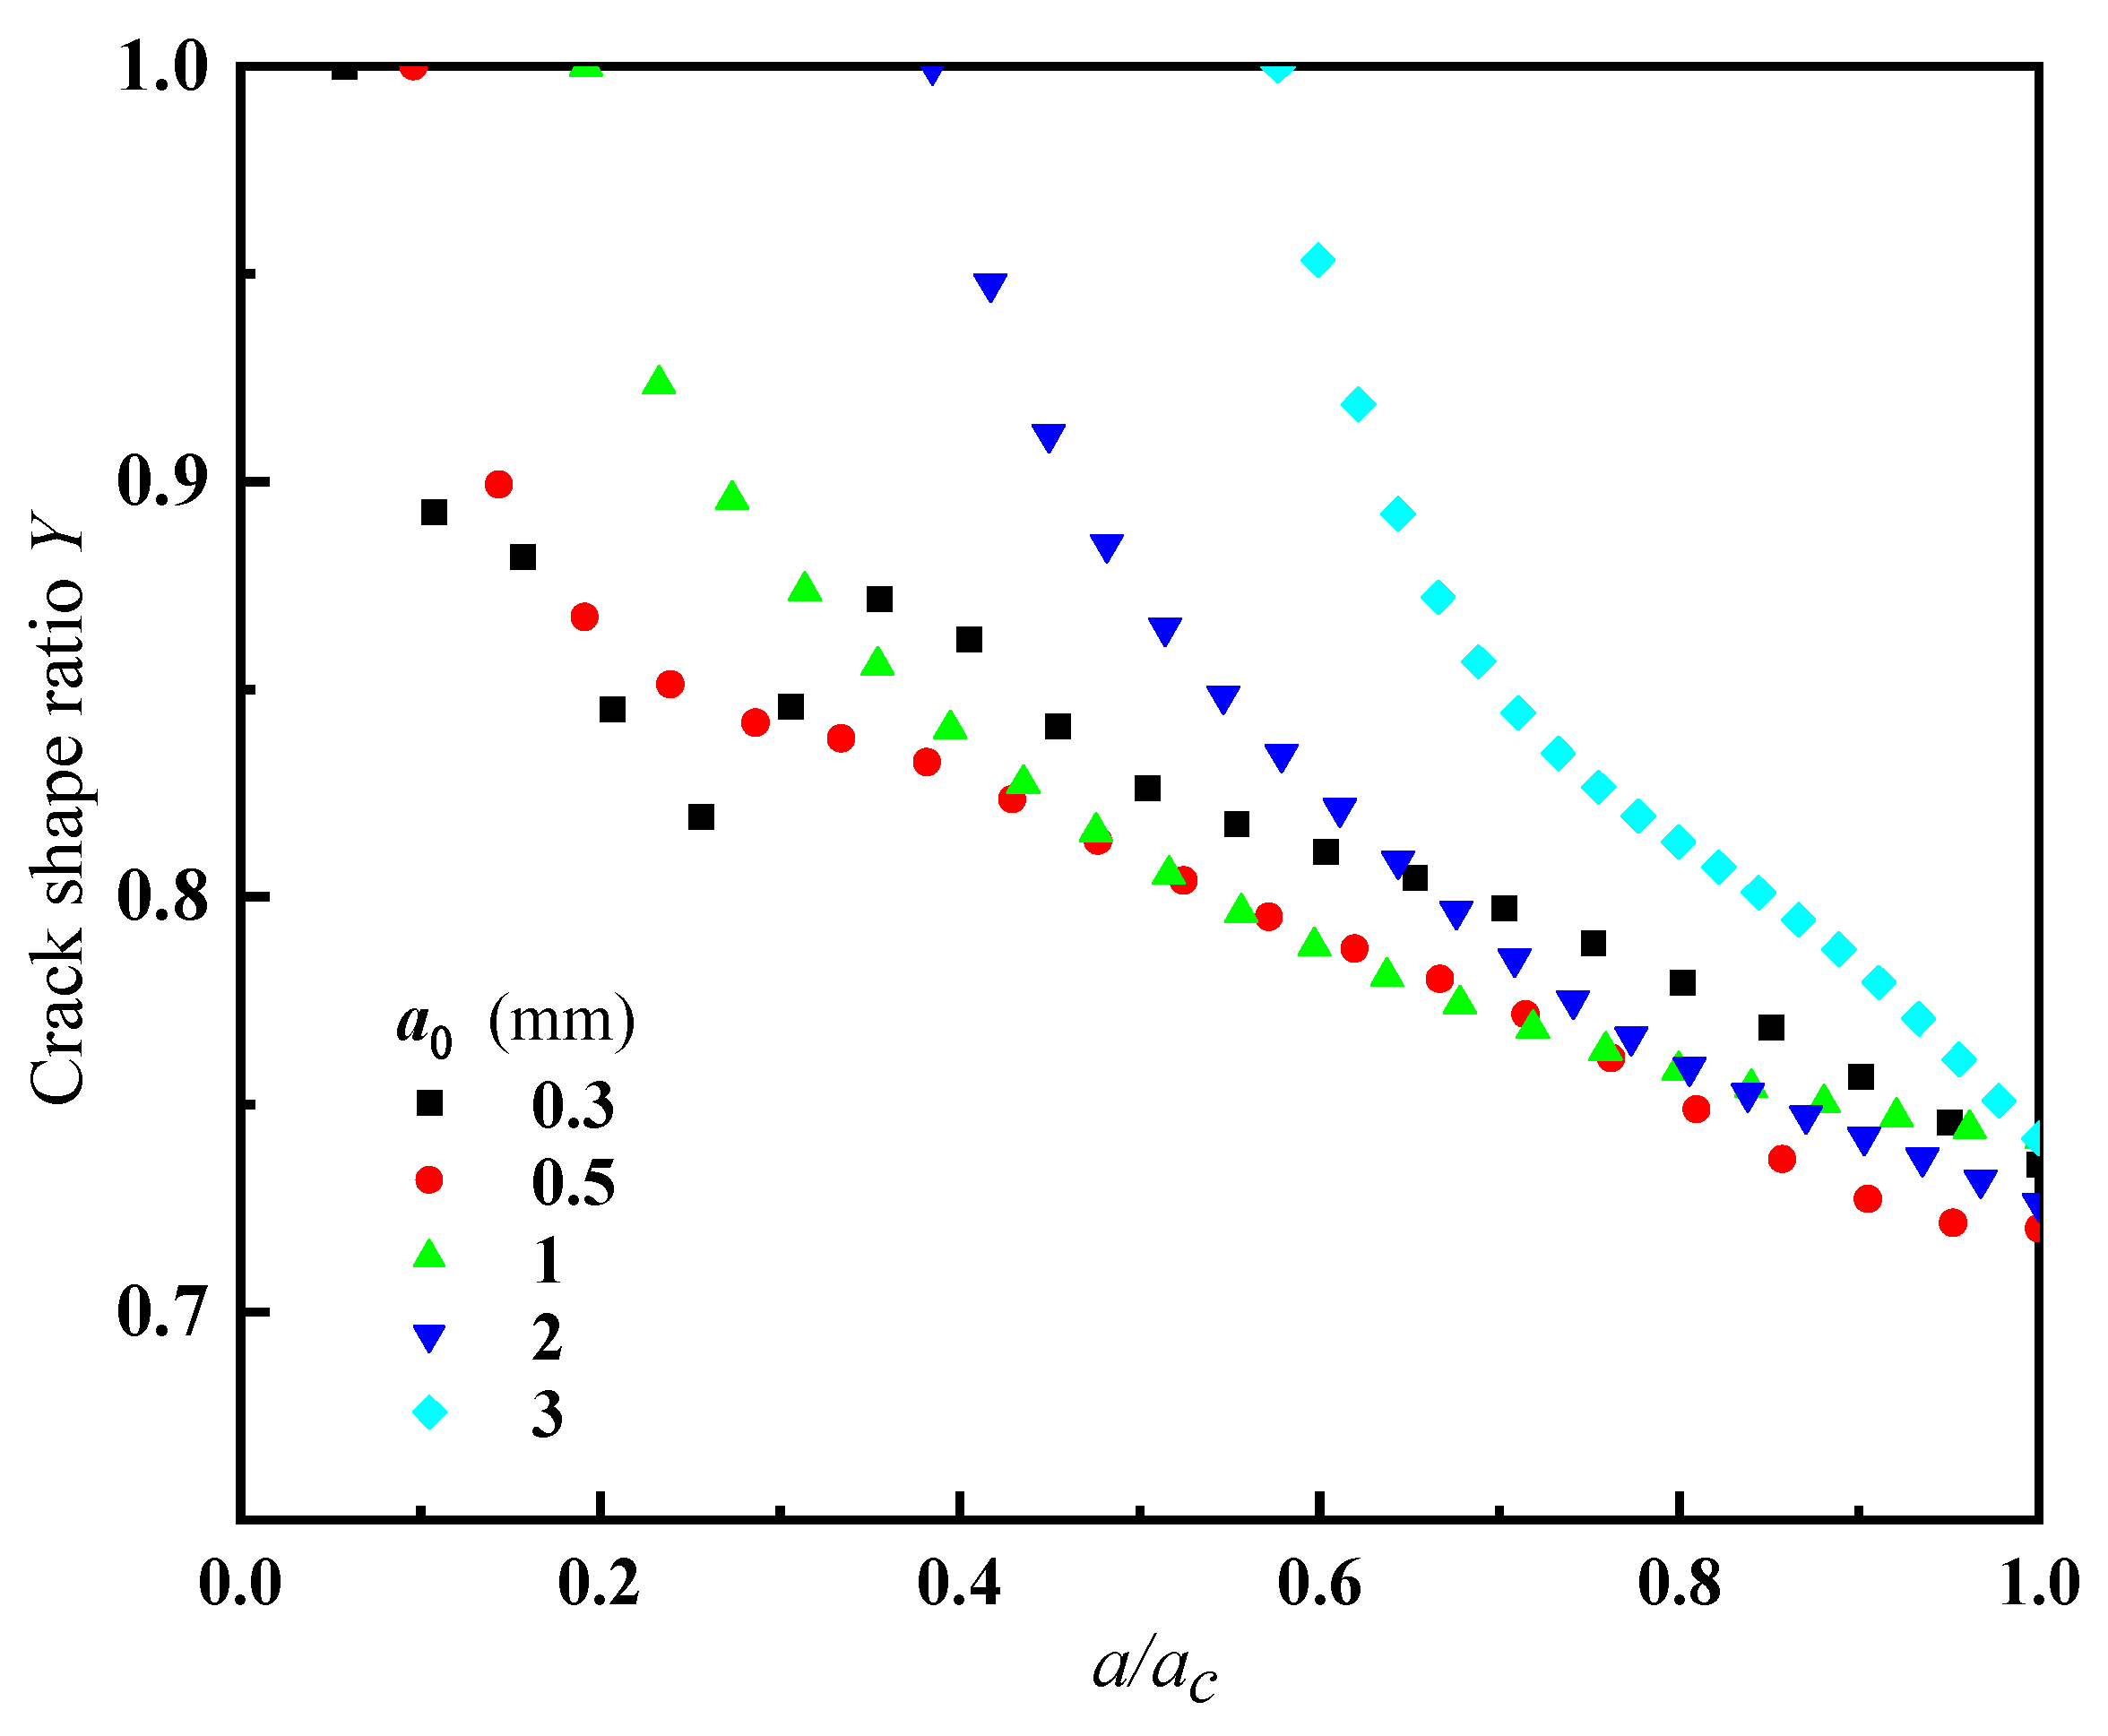
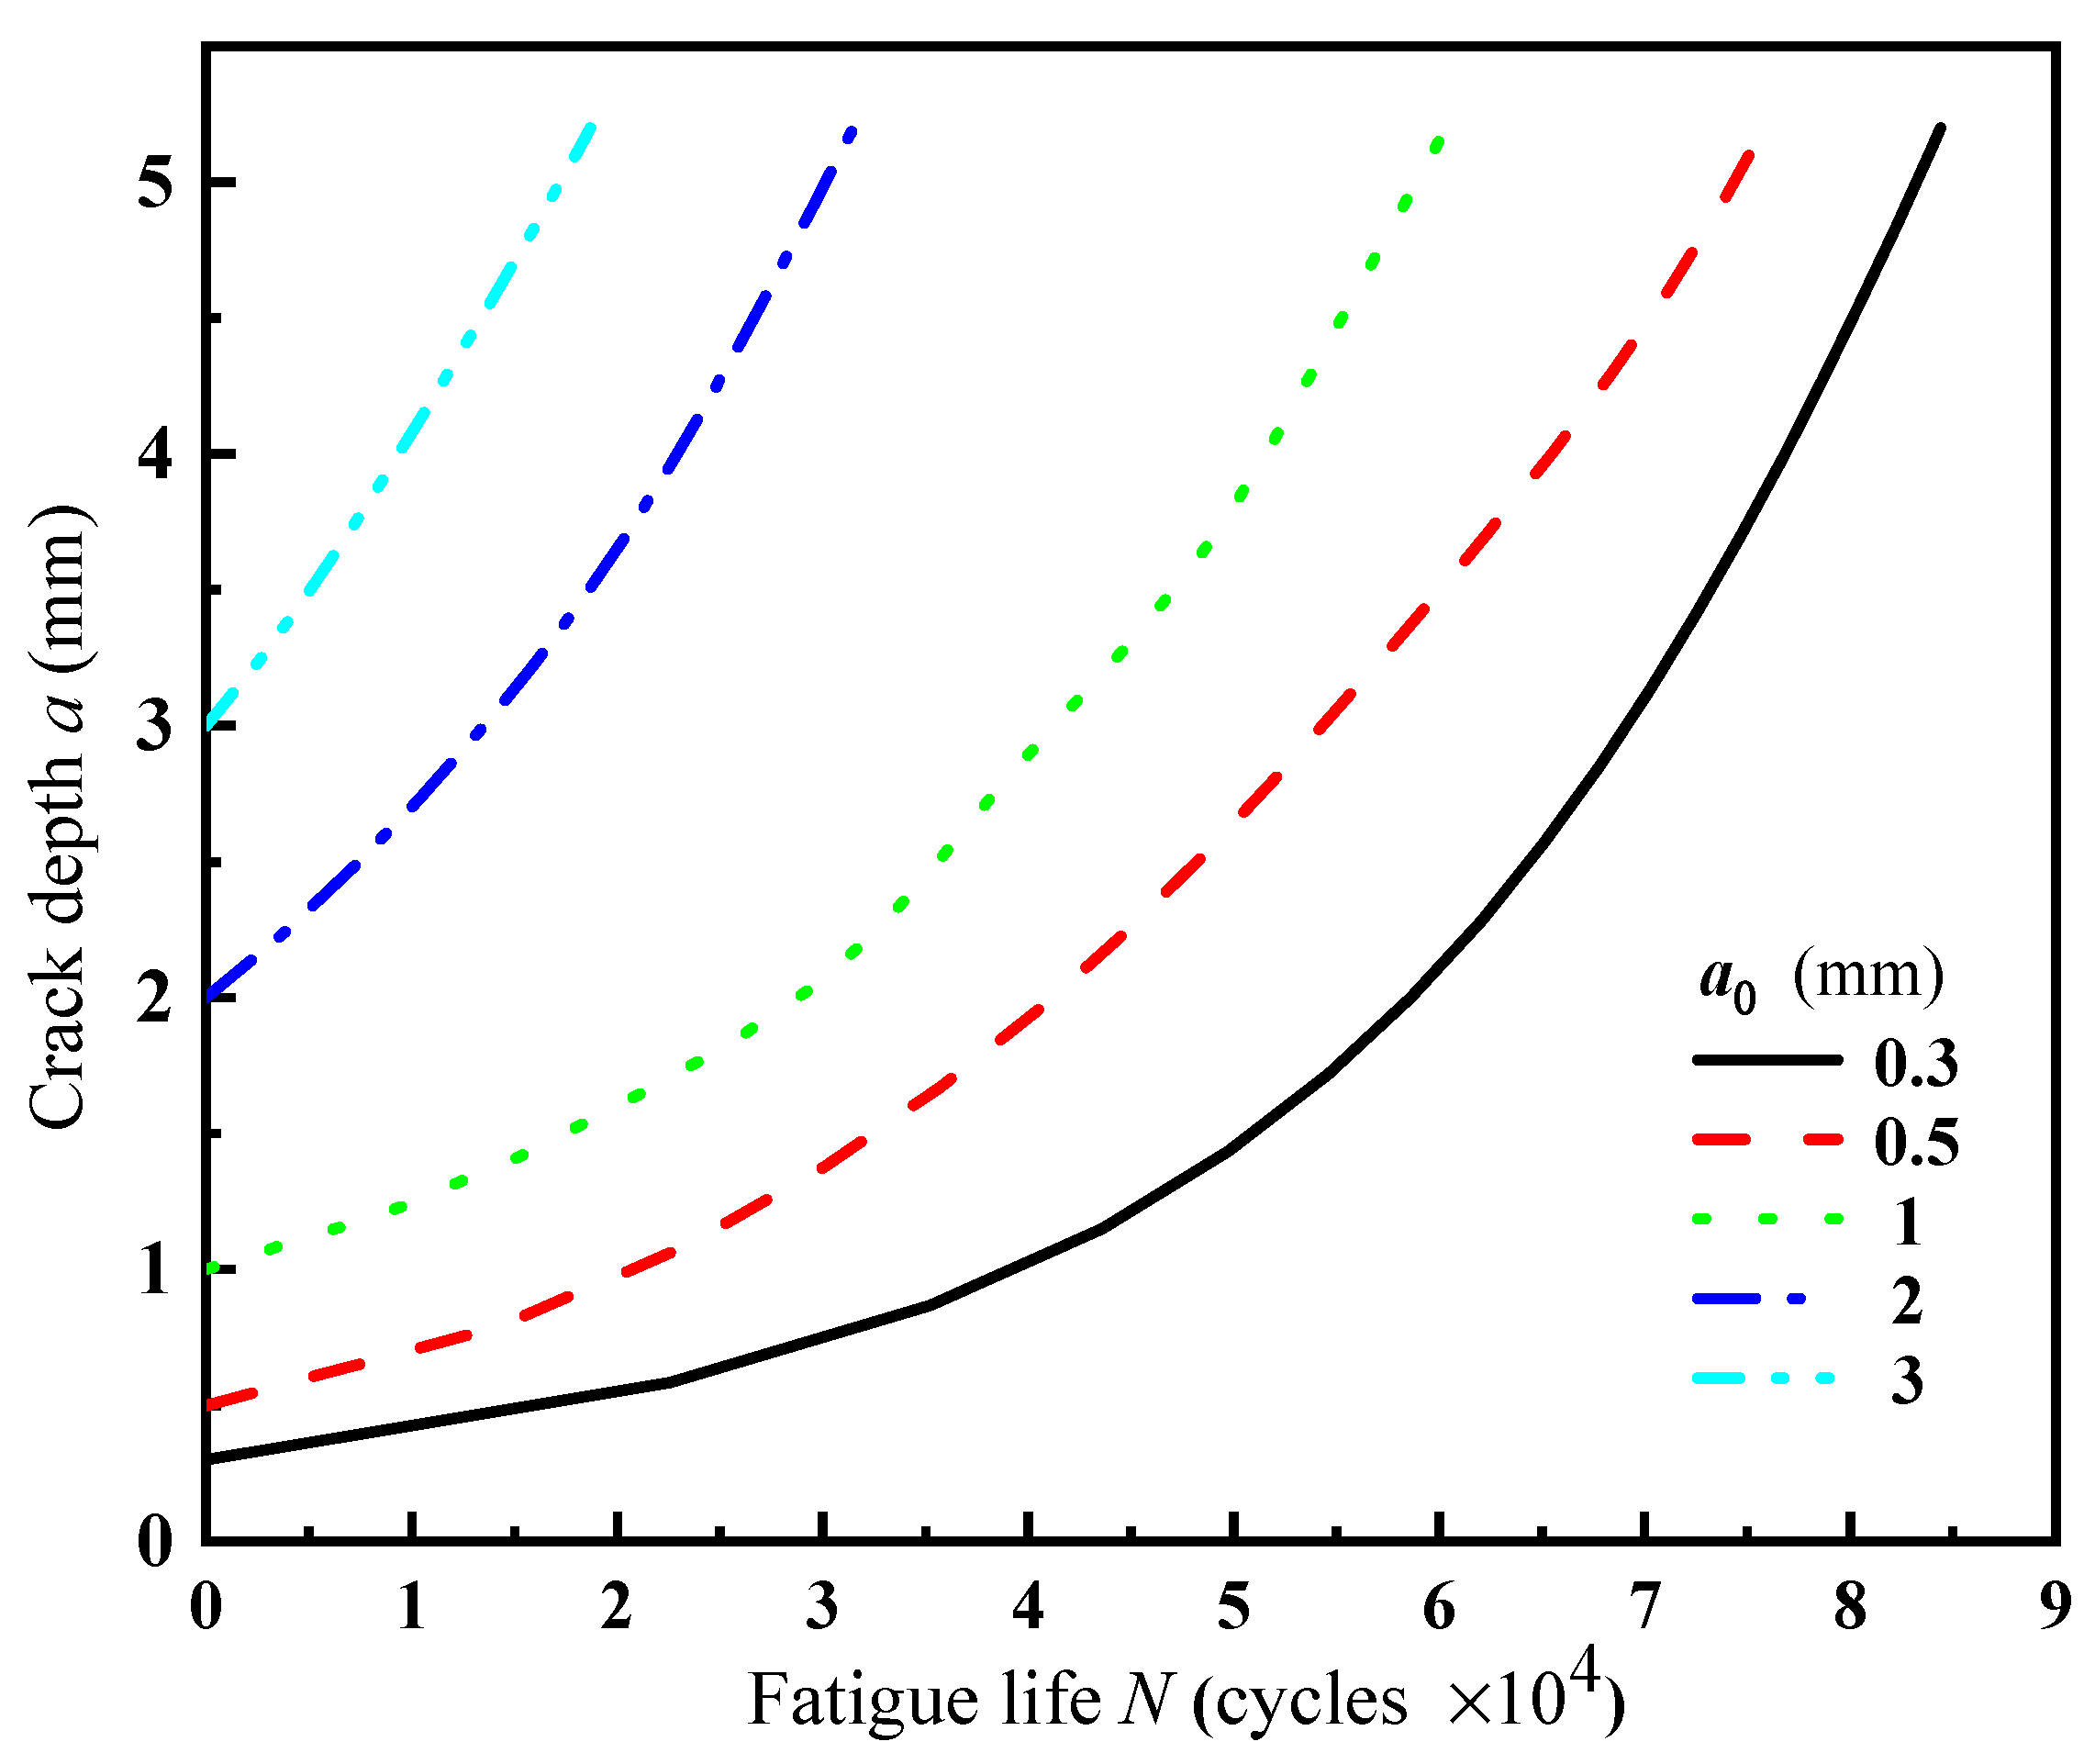
Taking the crack shape ratio Y0 = 1, the initial crack depth a0 is 0.3, 0.5, 1, 2, and 3 mm, and the effect of the initial crack size on the growth rate and structural fatigue life was analyzed. The results are shown in Figure 9 and Table 5. The shape evolution of the semi-elliptical surface crack growth with different initial sizes is shown in Figure 10. According to the shape of the crack front at each propagation step, the shape ratio change trend of the initial semi-elliptical surface crack during the propagation process was obtained, as shown in Figure 11.
When the initial semi-elliptical cracks of different sizes with Y0 = 1 growth are on the surface of the spherical shell, the tendency of the crack is that the transverse development speed is higher than the depth development, and the depth direction is slow first, but then it will accelerate. When it extends to the critical size of the spherical shell, the final shape ratio of the crack tends to a constant at about 0.7.
It can be seen from Table 5 that the fatigue life of the spherical shell is lower for cracks with a larger initial size. The fatigue life of the spherical shell with the initial crack action of a0 = 1 mm is 60,300 times, and when the initial crack depth a0 is 2 mm and 3 mm, the fatigue life is obviously very low at 31,500 times and 18,700 times, respectively, which is about 0.52 times and 0.31 times that under the initial crack of a0 = 1 mm. When the minimum crack is a0 = 0.3 mm, the fatigue life reaches 84,400 times, which is about 2.68 times and 4.51 times higher than that under the initial crack of a0 = 2 mm and a0 = 3 mm, respectively. For the crack with a small initial size, the fatigue life of the spherical shell is different, but the variation range is small. The fatigue life under the initial crack with a0 = 0.5 mm is 0.9 times of that under initial crack of a0 = 0.3 mm. It shows that when the initial depth of the crack is less than 1% of the wall thickness of the spherical shell, the impact on its fatigue life is small.
The initial crack growth a-N curves of different sizes are shown in Figure 12. The growth of initial cracks of different sizes in the depth direction changes from slow to fast under the same crack shape ratio. The speed of the small crack changes obviously and tends to be flat in the early stage of propagation, and then increases gradually. The size of the large crack itself is no longer negligible relative to the failure thickness of the spherical shell, and the structure has failed in the process of increasing the growth rate; thus, the fatigue life is relatively low.

5. Conclusions

In this study, based on the fatigue growth test data of an 18Ni (250) straight-through crack sample, the propagation model of a non-through 3D crack on the surface of a spherical shell was established. The propagation analysis of multiple groups of cracks was simulated and the fatigue life prediction of the spherical shell was carried out. The effects of typical crack characteristics on the propagation of a spherical shell and structural fatigue life were analyzed. The conclusions are as follows:
(1)
When the initial semi-elliptical surface crack propagated on the spherical shell, the shape ratio of the crack was not constant. It is shown that the final shape of the crack tended to be stable when the crack propagated to the critical size of the spherical shell, and the final shape ratio of the crack was around 0.7.
(2)
For semi-elliptical surface cracks with the same initial depth and different shape ratios, the propagation rate of each point on the front edge was very different. The smaller the initial shape ratio (Y0 ≤ 0.2), that is, the narrower and longer the crack was, the rate of its development in depth was significantly higher than that in its transverse direction. The transverse crack growth rate was higher than that in depth when the initial shape ratio was between 0.4 and 0.8, and it developed very fast at first, and then tended to be gentle.
(3)
At the same initial crack depth, the smaller the crack shape ratio, the shorter the life of the spherical shell. The fatigue life of the spherical shell with a shape ratio of 0.2 was only 51.08% of that with a shape ratio of 1. That is, the narrower and longer the crack shape on the spherical shell surface, the greater the potential safety hazard of the spherical shell.
(4)
For semi-elliptical surface cracks with the same shape ratio (Y0 = 1), the fatigue life of the spherical shell caused by the crack with a larger initial size was lower. The fatigue life of the spherical shell with an initial crack depth of 3 mm was only 31.01% of that with an initial depth of 1 mm. There were some differences in the fatigue life of spherical shells with small initial size cracks, but the variation range was very small. When the initial depth of the crack was less than 1% of the wall thickness, it had little effect on the fatigue life.
(5)
The initial crack growth of different sizes changed from slow to fast. The growth rate of the small crack changed obviously, where the rate was gentle in the early stage of growth, and the speed was very fast when it reached the critical size.

Author Contributions

Conceptualization, Y.Z. and R.L.; methodology, Y.Z.; software, R.L.; validation, Y.Z., R.L. and J.Y.; formal analysis, Y.Z.; investigation, R.L.; resources, Y.Z.; data curation, Y.Z. and R.L.; writing—original draft preparation, R.L.; writing—review and editing, Y.Z. and J.Y.; visualization, J.Y.; supervision, Y.Z.; project administration, Y.Z.; funding acquisition, Y.Z.; All authors have read and agreed to the published version of the manuscript.

Funding

This work was supported by the Natural Science Foundation of Jiangsu Province (Grant No. BK20211343), The Natural Science Foundation of the Jiangsu Higher Education Institutions of China (Grant No. 19KJA530002), and the State Key Laboratory of Ocean Engineering (Shanghai Jiao Tong University) (Grant No. GKZD010081).

Institutional Review Board Statement

Not applicable.

Informed Consent Statement

Not applicable.

Acknowledgments

We are especially grateful to all those who participated in this research. We also thank the editors and the anonymous reviewers for their constructive suggestions on improving the paper.

Conflicts of Interest

The authors declare no conflict of interest.

References

  1. Moorhouse, P. A modern history of the manned submersible. Mar. Technol. Soc. J. 2015, 49, 65–78. [Google Scholar] [CrossRef]
  2. Yongmei, Z. Opening reinforcement design and buckling of spherical shell subjected to external pressure. Int. J. Press. Vessel. Pip. 2017, 158, 29–36. [Google Scholar] [CrossRef]
  3. Luo, H.; Chen, C.; Liu, J. Prediction of Fatigue Crack Growth Life of 7050 Aluminum Alloy with Different Thicknesses under Various Load Ratios by Genetic Programming. J. Mater. Sci. Eng. 2017, 35, 26–31. [Google Scholar]
  4. Matvienko, Y.G.; Shlyannikov, V.; Boychenko, N. In-plane and out-of-plane constraint parameters along a three-dimensional crack-front stress field under creep loading. Fatigue Fract. Eng. Mater. Struct. 2013, 36, 14–24. [Google Scholar] [CrossRef]
  5. Shlyannikov, V.; Tumanov, A.; Zakharov, A. Surface flaws behavior under tension, bending and biaxial cyclic loading. Int. J. Fatigue 2016, 92, 557–576. [Google Scholar] [CrossRef]
  6. Wang, A.; Luan, C. Research on Crack Growth Characteristics Based on Crack Closure Effect. Coal Mine Mach. 2018, 39, 37–39. [Google Scholar]
  7. Yu, P.; She, C.; Guo, W. Equivalent thickness conception for corner cracks. Int. J. Solids Struct. 2010, 47, 2123–2130. [Google Scholar] [CrossRef] [Green Version]
  8. Guo, W.; Xu, L.; Zhou, Z. Computational mechanics of three-dimensional fracture. Chin. J. Comput. Mech. 2016, 33, 431–440. [Google Scholar]
  9. Yu, P.; Guo, W. An equivalent thickness conception for prediction of surface fatigue crack growth life and shape evolution. Eng. Fract. Mech. 2012, 93, 65–74. [Google Scholar] [CrossRef]
  10. Wei, G.; Jiacai, Z.; Wanlin, G. Equivalent thickness-based three dimensional stress fields and fatigue growth of part-through cracks emanating from a circular hole. Eng. Fract. Mech. 2020, 228, 106927. [Google Scholar] [CrossRef]
  11. Ngoula, D.T.; Beier, H.T.; Vormwald, M. Fatigue crack growth in cruciform welded joints: Influence of residual stresses and of the weld toe geometry. Int. J. Fatigue 2016, 101 Pt 2, 253–262. [Google Scholar] [CrossRef]
  12. Chakherlou, T.N.; Mirzajanzadeh, M.; Vogwell, J. Investigation of the fatigue life and crack growth in torque tightened bolted joints. Aerosp. Sci. Technol. 2010, 15, 304–313. [Google Scholar] [CrossRef]
  13. Ai, S.; Yu, M.; Cheng, X. Analysis and application of three-dimensional crack growth based on FRANC3D. J. Mech. Strength 2018, 40, 251–254. [Google Scholar]
  14. Wang, Z.; Yue, Y.; Li, Y. Prediction of Dwell-Fatigue Crack Growth for Titanium Alloys Based on Zencrack. China Offshore Platf. 2018, 33, 22–28. [Google Scholar]
  15. GB/T 6398: Metallic Materials Fatigue Testing Fatigue Crack Growth; Chinese Standard Institute: Beijing, China, 2017.
  16. ASTM E647: Standard Test Method for Measurement of Fatigue Crack Growth Rates; American Society for Testing and Materials: West Conshohocken, PA, USA, 2013.
  17. GB/T 228.1: Metallic Materials—Tensile Testing-Part 1: Method of Test at Room Temperature; Chinese Standard Institute: Beijing, China, 2010.
  18. ISO 6892-1: Metallic Materials—Tensile Testing-Part 1: Method of Test at Room Temperature; International Organization for Standardization: Geneva, Switzerland, 2009.
  19. Bellett, D.; Taylor, D.; Marco, S.; Mazzeo, E.; Guillois, J.; Pircher, T. The fatigue behaviour of three-dimensional stress concentrations. Int. J. Fatigue 2005, 27, 207–221. [Google Scholar] [CrossRef]
  20. Chang, T.; Guo, W. A model for the through-thickness fatigue crack closure. Eng. Fract. Mech. 1999, 64, 59–65. [Google Scholar] [CrossRef]
  21. Paris, P.; Erdogan, F. A Critical Analysis of Crack Propagation Laws. J. Basic Eng. 1963, 85, 528–533. [Google Scholar] [CrossRef]
  22. Zhu, Y.; Yao, X.; Yang, L. Effect of stress intensity factor on surface crack of deep-sea spherical shell. J. Ship Mech. 2020, 5, 476–484. [Google Scholar]
  23. Zhang, J.; Gao, J.; Wang, W. Investigation on mechanical properties of deep sea spherical pressure hull. Shipbuild. China 2015, 4, 129–140. [Google Scholar]
  24. Germanischer Lloyd Group. Rules for Classification and Construction; Germanischer Lloyd: Hamburg, Germany, 2009. [Google Scholar]
  25. Zhang, S. Analysis on the Effects of Material and Structural Defects on the Property of Deep-Sea Manned Spherical Hull; Jiangsu University of Science and Technology: Zhenjiang, China, 2018. [Google Scholar]
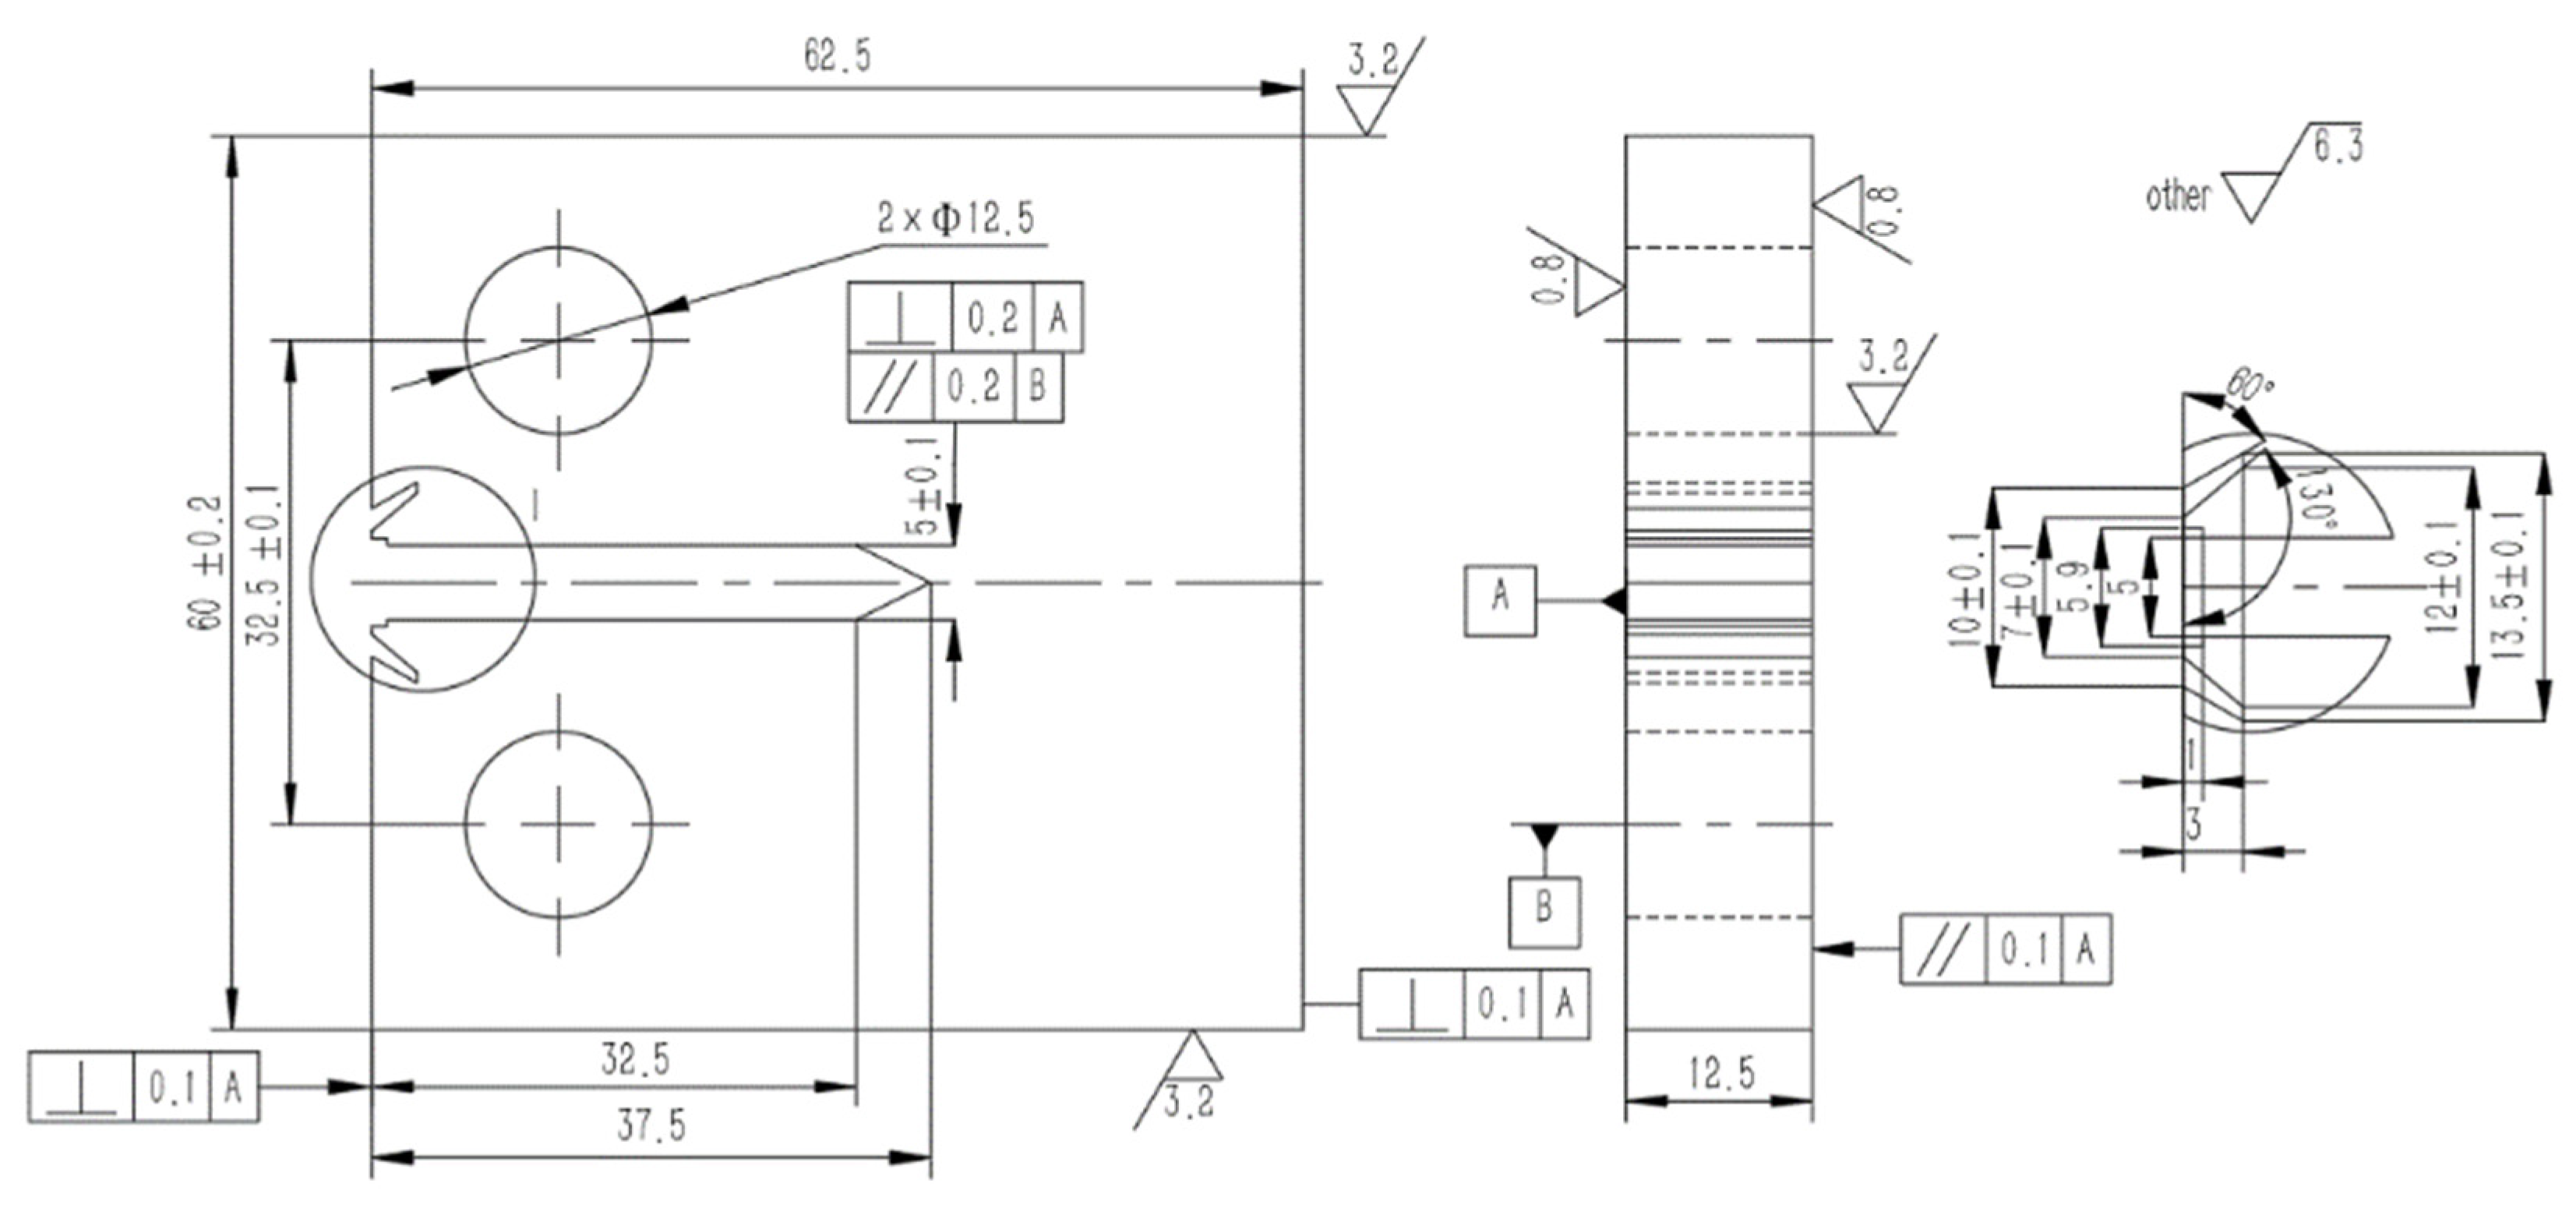
Figure 1. Sample size diagram.
Jmse 09 01280 g001
Figure 2. The 18Ni (250) fatigue crack growth rate curve.
Jmse 09 01280 g002
Figure 3. Variation of stress intensity factor (SIF) along straight crack thickness direction.
Jmse 09 01280 g003
Figure 4. The 18Ni (250) fatigue crack growth rate reference curve. (a) Processed curve; (b) Fitted curve.
Jmse 09 01280 g004
Figure 5. Finite element model of a spherical shell with semi-elliptical surface crack. (a) Cracked spherical shell model; (b) Semi-elliptical surface crack; (c) Distribution of welding residual stress.
Jmse 09 01280 g005
Figure 6. Simulation flow of surface crack growth of the spherical shell.
Jmse 09 01280 g006
Figure 7. The shape evolution of the semi-elliptical surface crack growth under different initial shape ratios.
Jmse 09 01280 g007
Figure 8. The changing trend of shape ratio during initial semi-elliptical surface crack growth.
Jmse 09 01280 g008
Figure 9. The a-N curve of initial crack growth with different shape ratios.
Jmse 09 01280 g009
Figure 10. The shape evolution of a semi-elliptical surface crack growth with different initial sizes.
Jmse 09 01280 g010
Figure 11. The changing trend of shape ratio during initial semi-elliptical surface crack growth.
Jmse 09 01280 g011
Figure 12. The a-N curve of initial crack growth with different sizes.
Jmse 09 01280 g012
Table 1. Test scheme.
Sample NumberStress RatioLoading Frequency (Hz)Load (KN)
MaximumMinimum
1-1#0.1550.5
1-2#
2-1#0.3551.5
2-2#
3-1#0.5552.5
3-2#
4-1#0.7553.5
4-2#
Table 2. Chemical composition of maraging steel 18Ni (250).
Chemical Specific Gravity (wt.%)
CSiMnSPNiCoMoAlTi
0.0080.020.030.0010.00517.867.935.250.140.48
Table 3. Mechanical properties of maraging steel 18Ni (250).
Elastic Modulus
E (GPa)
Poisson’s Ratio
ν
Yield Strength
σs (MPa)
Ultimate Strength
σb (MPa)
Reduction of Area
Z (%)
Elongation
A (%)
1820.31833190064.510.3
Table 4. Crack growth results with different initial shape ratios.
Initial Crack Shape Ratio Y0
0.20.40.50.60.81
2c (mm)14.6414.4414.414.1214.2214.16
Y0.7100.7200.7220.7370.7310.734
N (cycle)30,80037,80040,80044,40049,10060,300
Table 5. Growth results of cracks with different initial sizes.
Initial Crack Depth a0 (mm)
0.30.5123
2c (mm)14.214.414.1614.3214.02
Y0.7320.7200.7340.7260.741
N (cycle)84,40075,80060,30031,50018,700
Publisher’s Note: MDPI stays neutral with regard to jurisdictional claims in published maps and institutional affiliations.