Article

Ecological Constraints of Plankton Bio-Indicators for Water Column Stratification and Productivity: A Case Study of the Holocene North Aegean Sedimentary Record

by
Christina Giamali
1,*,
George Kontakiotis
2,
Assimina Antonarakou
2 and
Efterpi Koskeridou
2
1
The Goulandris Natural History Museum, Levidou 13, 14562 Kifissia, Greece
2
Department of Historical Geology and Palaeontology, Faculty of Geology and Geoenvironment, National and Kapodistrian University of Athens, Panepistimiopolis, 15784 Athens, Greece
*
Author to whom correspondence should be addressed.
J. Mar. Sci. Eng. 2021, 9(11), 1249; https://doi.org/10.3390/jmse9111249
Submission received: 15 October 2021 / Revised: 5 November 2021 / Accepted: 6 November 2021 / Published: 11 November 2021
(This article belongs to the Special Issue Recent Advances in Geological Oceanography)

Abstract

:
This study presents novel findings on the drivers of the calcitic planktonic foraminiferal and aragonitic pteropod Holocene assemblages of the North Aegean Trough (northeastern Mediterranean), an area recording the interaction between dynamic water masses as they exchange between the northern and southern Mediterranean sub-basins. Both of these groups of microorganisms are the major producers of calcium carbonate in the ocean, and are particularly sensitive to climate and oceanographic changes over the late Quaternary. Downcore micropaleontological data from the gravity core AEX-15, supplemented with multivariate statistical Q-mode cluster and principal component analyses (PCA) results, provide significant insights on the water column dynamics during the Holocene. Focusing on the last ~10 calibrated thousands of years before the present day (ka cal BP), our integrated study reveals that primary productivity is the dominant factor controlling the planktonic foraminifera distribution in the North Aegean Sea, whereas water column stratification, and particularly the intensity of the oxygen minimum zone, seems to be the major driver on the pteropod distribution. Besides productivity and thermal stratification, which show the highest explanatory power for planktonic foraminifera and pteropod communities, respectively, though they affect both groups to a different extent, upwelling seems to further affect both faunal groups. Overall, our findings are consistent with those derived by published late Quaternary eastern Mediterranean records, highlighting in parallel a useful additional dimension on planktonic foraminiferal and pteropod ecology, which is inextricably linked with the factors of primary productivity and vertical stratification of the warm Holocene water column.

1. Introduction

The Aegean Sea is a physical laboratory to investigate climatic oscillations at both a global and local scale due to its intermediate position between the higher- (i.e., North Atlantic-influenced) and lower-latitude (i.e., monsoonally-influenced) climate systems [1,2,3], high sedimentation rate marine records compared to the open Mediterranean Sea [4,5,6], and its latitudinal and land-locked configuration [7]. The recent Holocene subdivision (Greenlandian, Northgrippian, and Meghalayan) confirms the traditional understanding of an evolution from wetter (Greenlandian) to gradually drier (Northgrippian and Meghalayan) climatic conditions. Moreover, Holocene sediments of the Aegean Sea include the most recent sapropel S1 that was deposited during the Holocene Climatic Optimum (10.8–6.1 ka cal BP; [8,9]) under reduced oxygen and productive conditions [10,11,12,13,14,15,16,17,18]. Therefore, the sedimentary archive corresponding to this time interval can be considered as a natural “experiment” in order to investigate the plankton response to such severe paleoenvironmental changes. In particular, the basin’s limited communication with the open ocean implies that any paleoceanographic signals will be recorded in an amplified fashion, and, therefore, this heightened sensitivity to the effects of climate variability further underlies the prominent role of such marginal basins in the understanding of the global climatic evolution.
Plankton indicators have long been used as a biomonitoring tool [19,20] and/or for investigating modern [21,22,23,24,25] and past [26,27,28,29,30,31] environments because of their rapid response to environmental changes. Two distinct communities of plankton bio-indicators are used in this study: planktonic foraminifera and pteropods. Planktonic foraminifera are excellent bio-eco-stratigraphic [32,33,34,35], paleoceanographic [31,36,37,38,39,40], and paleoclimatic [41,42,43,44,45,46] indicators, due to their wide distribution in the world oceans, the good fossilization potential for their calcitic shells, their long geological record, their upper water column habitat, and their preservation in the deep-sea sedimentary record [47,48]. Pteropods are holoplanktonic aragonitic molluscs, widespread and abundant in the world’s oceans, [49,50,51] which play an important role in the direct export of organic carbon (12% of the carbon flux worldwide [52]) to the deep ocean [25]. Several studies (e.g., [28,29,53,54,55,56,57,58,59]) have shown an enhanced sensitivity of late Quaternary pteropod assemblages to environmental changes, particularly of temperature, oxygen concentration, and salinity, making them valuable for paleoenvironmental and paleoclimatic reconstructions.
The objective of the present work is to determine the plankton assemblages of the North Aegean Sea during the last 10 ka BP, and further assess the environmental factors that control their distributional pattern, based on marine sediments retrieved by a gravity core (AEX-15). In order to advance the understanding of the temporal variability of observed climatic and oceanographic changes and elucidate forcing mechanisms, this study aims at achieving high-resolution sediment core at a sub-centennial to centennial scale. The faunal distribution pattern of both planktonic foraminiferal and pteropod species identified in AEX-15 core, supplemented by the ecological interpretation obtained through multivariate statistical analyses, provide significant insights on the unraveling of the paleoclimatic history, the determination of the surface conditions, and the orbital configuration of the climatic changes recorded on Holocene sediments.

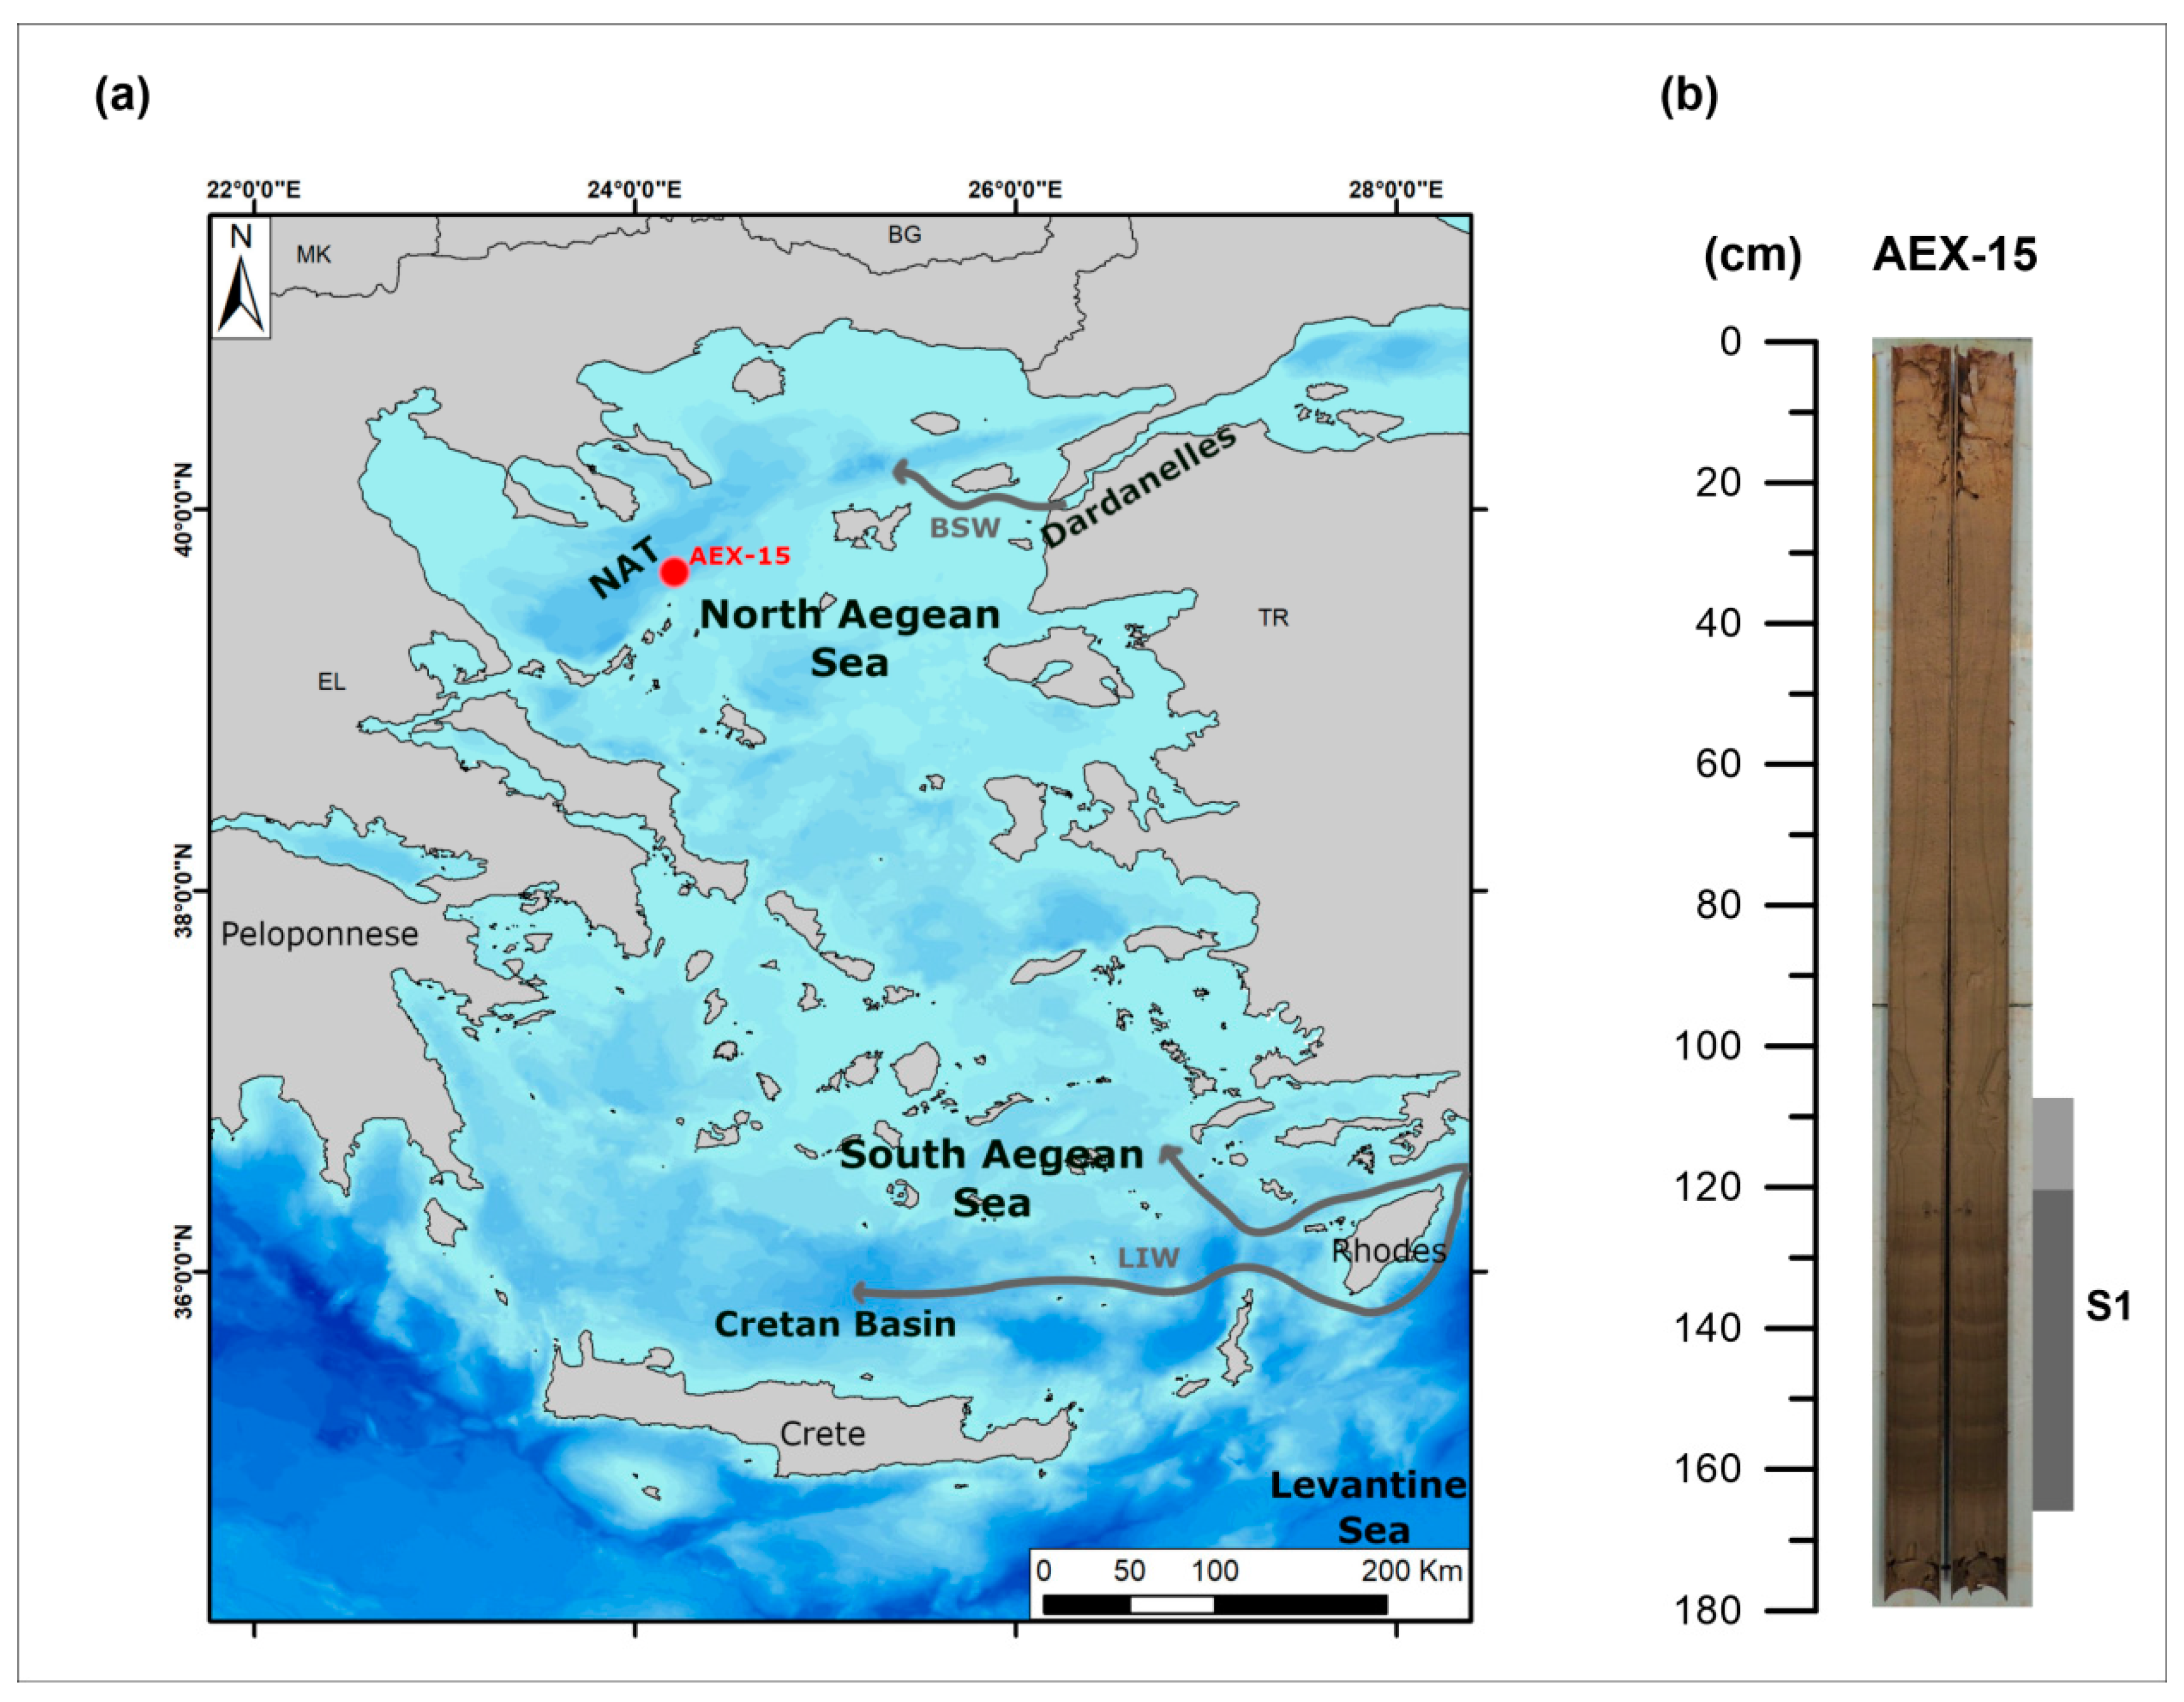
2. Oceanographic and Geologic Setting

The Aegean Sea is in the northern sector of the eastern Mediterranean, between the Turkish coastline to the east, the Greek mainland to the north and west, and bounded on the south by the island of Crete and the Cretan Arc. It is connected to the Black Sea through the Straits of Bosphorus and Dardanelles, and to the Levantine Sea through several larger and deeper straits between the Peloponnese, the islands of Crete and Rhodes, and south-western Turkey (Figure 1a). It is separated into two major sub-basins with different climatic conditions: the “north” and the “south” Aegean Sea. The north is more humid than the semiarid south basin [60]. The studied core comes from the North Aegean Trough (NAT; Figure 1a), a northeast–southwest (NE–SW) elongated depression with a depth range between 800 and 1590 m that includes several interconnected sub-basin depressions, separated from each other by 100- to 350-m-deep intervening shoals and associated islands [5,61].
The hydrography of the Aegean Sea is characterized, in general, by a cyclonic surface water circulation, although the most active dynamic features are the mesoscale permanent and/or recurrent cyclonic and anticyclonic eddies [60], which form as a consequence of the Etesian winds [62]. In the study area, the water column structure comprises three major water masses: the superficial nutrient-rich and less saline Black Sea Water (BSW; 9–22 °C and 22–23 psu), the warmer and saline Levantine Intermediate Water (LIW; 16–25 °C and 39.2–39.5 psu), and the North Aegean Deep Water (NADW; 13–14 °C and 39.1–39.2 psu) [63,64]. The surface and intermediate waters follow the general counterclockwise circulation of the Aegean Sea and progressively mix as they flow southward along the east coast of Greece [65]. The main characteristic of the north Aegean is the fluvial freshwater inputs that discharge from the Black Sea and the river runoff from the Greek and Turkish mainland, which dilute the highly saline waters from the Levantine and south–central Aegean. The lateral and diapycnal mixing of warm subsurface intermediate waters with low salinity surficial waters leads to strong near-surface thermal stratification, which is a dominant feature of the north Aegean water column during the summer. During the winter, upwelling nutrient-rich waters seem to create favorable conditions for primary production [66]. Such seasonal upwelling pathways are very important for the low-chlorophyll and phosphorus-controlled oceanic system of the eastern Mediterranean basin [67,68,69], highlighting the importance of small-scale hydrographic dynamics in controlling primary productivity of this mesotrophic to oligotrophic setting.

3. Materials and Methods

3.1. Material

The study core was recovered from the NAT (39°39.900′ N, 24°15.369′ E; 1242 m water depth, length 178 cm), with R/V Aegaeo in October 2013 (Figure 1a,b). The planktonic foraminiferal and pteropod assemblages derived from 115 downcore samples, were picked from 10 cm3 of wet sediment after washing through a 125 µm mesh sieve and cleaning using the HyPerCal protocol of [70]. All shells (300 individuals for each group) were handpicked, identified, and counted in each sample and then converted into percentages (Table S1; Supplementary Material). Detailed micropaleontological procedures, along with the time stratigraphic framework of the analyzed core are described in [30]. Based on the published age model of the study core, which is based on a combination of accelerator mass spectrometry (14C AMS) radiocarbon date measurements, additional control points, and bioevents of planktonic foraminifera, its sediments cover the last 10.1 ka BP with an average sedimentation rate of 17.32 cm/ka.

3.2. Multivariate Statistical Analyses

The number of planktonic foraminifera and pteropods (Euthecosomata) counted is statistically reliable for both paleoceanographic and paleoclimatic reconstructions [71]. To determine the overall statistical similarity between samples, Q-mode cluster analysis was used, following the algorithms of [72] using the correlation coefficient matrix. In the case of planktonic foraminifera, the totality of the samples was used, whereas for pteropods, cluster analysis was carried out in 105 out of 115 samples. This was due to the lack of pteropod fauna in samples 1.5, 47, 51, 57, 59, 107, 122.5, 141.5, 142.5, and 143.5 cm. For paleoenvironmental reconstructions, multivariate statistical analyses have been performed on the data set, after exclusion of rare species (<3%) and grouping of species that have a discontinuous, scattered distribution at generic level. The results of cluster analysis were reported as Morisita similarity and arranged in two-dimensional hierarchical dendrograms, wherein locations were presented along the Y-axis while similarity level was plotted on the X-axis. Q-mode cluster analysis was performed in both faunal groups (planktonic foraminifera and pteropods) in order to investigate the differences or correlations among the biotopes identified within plankton communities.
Furthermore, principal component analysis (PCA) was applied to reduce the dimensionality of a multivariate data set to a few principal factors that determine the distributions of species. Raw data were processed using PAST (2.17) multivariate statistical software package of [73]. The factors obtained were rotated using a varimax-normalized algorithm, which allows more straightforward interpretation of the loadings of the principal components and maximization of the variances explained by the factors extracted. The resulting factor scores show the contribution of each factor in every sample and, therefore, the downcore contribution of each factor. The total number of factors was defined by minimizing the remaining “random” variability, and by the possibility to relate the factors to modern hydrographic conditions, and planktonic foraminiferal and pteropod ecology.

4. Results

Both faunal groups are abundant and well preserved in the samples of the studied core. In particular, 17 species of planktonic foraminifera lumped in 12 groups and 11 species of pteropods were identified (Table S1; Supplementary Materials). The most abundant planktonic foraminiferal species are Globigerina bulloides, Turborotalita quinqueloba, and Globigerinoides ruber alba, whereas the species Globorotalia inflata and Neogloboquadrina pachyderma present sporadic peaks. Pteropod species in abundance with a continuous distributional pattern are Heliconoides inflatus and Boasia chierchiae, whereas the rest of them present a scattered distributional pattern. More details on the distributional patterns of both planktonic groups are given in [30].

4.1. Q-Mode Cluster Analysis

The Q-mode hierarchical cluster analysis represents the grouping of samples based on the downcore abundance of the species higher than at least 3% in one sample. Three distinct assemblages of planktonic foraminifera and pteropods were identified by Q-mode cluster analysis in the studied core, reflecting different biotopes during the Holocene. Each assemblage is characterized by the dominant species and named accordingly after it.

4.1.1. Planktonic Foraminifera

Cluster I (T. quinqueloba assemblage): it contains 47 samples (samples 61 cm, 97 cm, and samples between 120 and 166 cm; Figure 2). Apart from samples 61 and 97, the remaining 45 samples correspond to the most recent sapropel S1. This assemblage is dominated by T. quinqueloba (up to 65%), an eutrophic species preferring low salinities [74]. In this assemblage, G. bulloides also occurs with high percentages (up to 50%), as well as the warm oligotrophic Globigerinoides ruber rosea (25%) and SPRUDTS group.
Cluster II (G. inflata assemblage): this assemblage groups three samples (115 cm, 117 cm, and 119 cm; Figure 2), which belong to the oxidized part of sapropel S1. The dominant component of this assemblage is G. inflata (up to 32%), which is a temperate species indicative of a homogenous water column that prefers to live at the bottom of thermocline depths [47]. Additional components of this assemblage are the species N. pachyderma, G. ruber alba, G. ruber rosea, T. quinqueloba, and G. bulloides. Neogloboquadrina pachyderma thrives in cool water close to or below the thermocline [75]. Its abundance is related to the development of the deep chlorophyll maximum (DCM) [75].
Cluster IIΙ (G. ruber alba assemblage): it includes 65 samples (from 113 to 1.5 cm, and between 166.5 and 173.5 cm; Figure 2) that correspond to the post-sapropel S1 interval, apart from the samples 166.5–173.5 cm, which derive from the pre-sapropel interval. This assemblage is characterized by the predominance of the warm, oligotrophic G. ruber alba (average 40%). Next in abundance are the eutrophic N. pachyderma (17%), G. bulloides (16%), and T. quinqueloba (13%). Globigerinoides ruber rosea and Globoturborotalita rubescens are also present but with significantly lower percentages (average 13% and 5%, respectively).

4.1.2. Pteropods

Cluster I (Diacria trispinosa assemblage): it contains six samples (samples 6.25 cm, 165.5 cm, and from 168 cm to 173.5 cm; Figure 3) that mainly correspond to the pre-sapropel interval. This assemblage is characterized by the high relative abundance of the mesopelagic D. trispinosa (up to 60%) along with the epipelagic Creseis acicula (up to 50%). Additional components are the species B. chierchiae (25%), Clio pyramidata (20%), and H. inflatus (15%).
Cluster II (H. inflatus assemblage): this cluster includes 50 samples (from 99 to 166.5 cm) the majority of which correspond to the sapropel S1 interval (exceptions are samples 99–105 cm and 166.5 cm) (Figure 3). Dominant component of the fauna is the warm oligotrophic H. inflatus (72%), followed by the epipelagic B. chierchiae (66%). The rest of the pteropod species in these samples present low relative abundances (e.g., Cavolinia spp. ~10%, C. pyramidata ~6%).
Cluster III (Limacina trochiformis assemblage): it groups the rest of the samples (49; Figure 3) corresponding to the post-sapropel S1 interval (3 cm–4.5 cm, 8 cm–97 cm), with the exception of the sample 119 cm, which corresponds to the oxidized part of S1. This assemblage is dominated by the typical upwelling species L. trochiformis (76%). Additional components of the fauna are the B. chierchiae (29%), H. inflatus (28%), C. pyramidata (26%), Styliola subula (28%), C. acicula (20%), and Cavolinia spp. (17%).

4.2. Principal Component Analysis

Principal component analysis is a commonly used method for multivariate statistical analysis, mainly because of its simple algebra and direct interpretation. The application of this statistical analysis yielded a three-factor model for both planktonic foraminiferal and pteropod communities. The interpretation of the three components in each case was based on the screen plots of eigen values, and the factor loadings of the planktonic foraminiferal and pteropod species, respectively. The distinguished factors account for 90.94% and 79.46%, of the total variance for the planktonic foraminiferal and pteropod, respectively (Table 1 and Table 2), with their factor loadings showing the contribution of each factor in every sample and, therefore, the downcore contribution of each factor (Table 3 and Table 4, Figure 4). In the case of a bipolar factor, which has extremes of positive and negative loadings, high positive factor scores are related to the positive pole and high negative scores to the negative pole, respectively.

4.2.1. Planktonic Foraminifera

The first varimax factor (PCA1) accounts for 67.95% of the total variance (Table 1) and exhibits a bipolar character with the negative pole to be dominated by the eutrophic species T. quinqueloba and the positive pole by the oligotrophic G. ruber alba (Table 3) [76,77,78]. Therefore, this factor is interpreted as a productivity indicator (Figure 4a). The second factor (PCA2) explains 15.58% of the total variance (Table 1). It is characterized by positive values of the surface dwellers G. ruber alba and T. quinqueloba [78]. Negative loadings are dominated mainly by the species G. bulloides, which is highly dependent on enhanced food levels, upwelling, strong seasonal mixing, or freshwater inputs [79,80,81,82]. Thus, the PCA2 factor is referred to as the stratification factor (Figure 4b). The third varimax factor (PCA3) accounts for the 7.41% of the total variance (Table 1) and is interpreted as an upwelling indicator (Figure 4c) since its main positive representative species, G. bulloides (Table 3), is strongly associated with the seasonal upwelling [83,84,85,86]. On the other hand, the negative loadings are represented mainly by the species G. ruber rosea, a warm subtropical species, whose abundance is mainly controlled by the thermal stratification of the upper water column [21,22,78].

4.2.2. Pteropods

The first varimax factor (PCA1) explains 37.76% of the total variance (Table 2), with the positive loadings expressed by the mesopelagic H. inflatus, tolerant to a low oxygen concentration of the oxygen minimum zone (OMZ), [57] and the epipelagic B. chierchiae (Table 4). In contrast, negative loadings are expressed mainly by species indicative of a well-ventilated water column (L. trochiformis and C. pyramidata) [57,87]. Thus, PCA1 can be explained as a stratification factor (Figure 4d). The second factor (PCA2) explains the 27.66% of the total variance (Table 2). Its positive pole is represented mainly by the mesopelagic oligotrophic H. inflatus and the negative pole by the epipelagic B. chierchiae, which proliferates in nutrient-enriched waters (Table 4) [29,57]. Therefore, PCA2 is interpreted as a productivity factor (Figure 4e). The third factor (PCA3) describes 14.04% of the total variance (Table 2). The main representative of the positive pole, L. trochiformis (Table 4), is characterized as a typical upwelling species [87,88]; thus, PCA3 can be interpreted as an upwelling factor (Figure 4f).

5. Discussion

5.1. Biotopes of the North Aegean

The main assemblages identified in core AEX-15 through the cluster analysis, represent the sapropel S1 or the pre- and/or post-sapropel interval. Based on the ecological characteristics of the species participating in each assemblage, a unification of some of them into biotopes was made. Thus, each biotope is indicative of paleoenvironmental processes that affect both faunal groups.
More explicitly, the assemblage of T. quinqueloba, which corresponds to the sapropel S1 interval in the north Aegean, represents a biotope with low salinity and increased food availability in the surface waters [6,74,89,90]. This is explained by the larger river inflows draining the surrounding land [5,89] and supplying nutrients that fuel the productivity. In addition, the warm oligotrophic G. ruber rosea, and the SPRUDTS group that are also abundant in this assemblage, suggest enhanced thermal stratification of the upper water column [47,79,82]. This is further reinforced by the increased percentages of H. inflatus (H. inflatus assemblage) and the reduction/absence of mesopelagic species typical of a well-ventilated water column (e.g., Clio cuspidata, C. pyramidata, D. trispinosa) in pteropod’s fauna. Although Heliconoides inflatus is a mesopelagic species, its presence in this biotope is explained by its habitat. This species adopts a variable depth habitat during its growth stages and is also tolerant to low oxygen concentration levels [57]. The presence of low salinity surface waters, as inferred from the planktonic foraminifera, is also enhanced by the high relative abundance of the epipelagic pteropod B. chierchiae. This species is known to proliferate in low, as well as high, salinity shallow waters [29,91,92]. Thus, both plankton assemblages (T. quinqueloba and H. inflatus) that correspond to the sapropel S1 represent a biotope with a strongly stratified water column characterized by intense OMZ, with low salinity and high fertility of the surficial waters.
The next biotope includes the G. ruber alba and L. trochiformis assemblages that correspond to the post-sapropel interval (Northgrippian and Meghalayan stages). In this biotope, oligotrophic (G. ruber alba, G. ruber rosea, and G. rubescens) and eutrophic (G. bulloides, T. quinqueloba, and N. pachyderma) species simultaneously occur, indicating a seasonal contrast in primary productivity probably related to the food availability. Seasonality is also reinforced by the continuous presence of Globigerinita glutinata since this species can survive, both in the oligotrophic surface and in more eutrophic waters, by changing its diet from diatoms to chrysophytes [47]. Moreover, the findings suggest a seasonal contrast in temperature as warm-characteristic species (G. ruber alba, G. ruber rosea, and G. rubescens) coexist with cold-indicative species (T. quinqueloba and N. pachyderma). On the other hand, the occurrence of mesopelagic pteropods along with epipelagic, suggests a well-ventilated water column [93]. The high relative abundance of L. trochiformis is indicative of local upwellings [87], whereas its reduction at ~3.0 ka BP, along with the increased relative abundance of S. subula, is suggestive of an increase in sea surface salinity [56,57,94]. Thus, our findings suggest a high seasonal biotope indicative of a well-ventilated and high saline water column as a result of the reduction in freshwater inputs. This interpretation is in accordance with clay mineral data derived from north Aegean sediments [5,95] that point to particularly dry conditions in the north Aegean catchment as well as the reduction in the surface water Black Sea outflow at ~4.5 ka BP [10,96].
The biotope characteristic of the G. inflata assemblage corresponds to the oxidized part of S1. The occurrence of the deep mixing species G. inflata and N. pachyderma in this assemblage reflects the prevalence of horizontally and/or vertically homogenized conditions in the water column [78,79,97]. Moreover, the biotope characteristic of the D. trispinosa assemblage corresponds to the pre-sapropel interval. Diacria trispinosa is a species typical of Atlantic-influenced waters [94,98], reflecting the influence of Atlantic-modified waters into the eastern Mediterranean basin prior to the S1 deposition. The epipelagic euryhaline species C. acicula is also precent in this assemblage. Its distribution pattern in the Holocene record of the Aegean sea was described for the first time in this gravity core (AEX-15; [30]), and is negatively affected by the water column stratification. Similar observations are recorded from the western continental shelf of India [57], where it appears to be related to the conspicuous differences in water column stratification linked with the vertical salinity gradient. Thus, our findings reflect a biozone with homogenized conditions in the water column influenced by Atlantic waters.

5.2. Factors Controlling Planktonic Fauna Distribution

Both faunal groups seem to be reliable indicators for past paleoenvironmental changes in this setting. The differences relay the extent to which each factor affects the fauna. In particular, the productivity factor is expressed as being more intensified in planktonic foraminifera fauna (68%) than in pteropods (28%) (Table 1 and Table 2). In the case of planktonic foraminifera, this can be explained by the species T. quinqueloba and G. bulloides that render the role of productivity as the main factor, especially in the more humid and eutrophicated north Aegean region [6,60,89]. In contrast, the pteropod distribution pattern does not respond in the same way as planktonic foraminifera to changes in productivity. It is known that nutrient concentration is not a limited factor for their distribution [99], though our data suggest that fluctuations in nutrients and salinity due to the increased freshwater inputs, especially during the sapropel S1 deposition, favor the flourishment of the species B. chierchiae [29]. The stratification factor, on the contrary, affects the pteropod fauna (38%) more than the planktonic foraminifera (16%) (Table 1 and Table 2). Our data suggest that the pteropod distribution pattern is controlled primarily by the oxygen concentration of the water column and, thus, the extent and intensity of the OMZ [29,56], which is related to the stratification of the entire water column. OMZ alterations are climatically controlled, with humid and milder climates favoring a strong and well developed OMZ, whereas cooler and/or arid periods are characterized by a more aerated OMZ [93,100]. In particular, mesopelagic species that are affected negatively by low oxygen concentration and intensified OMZ, are absent or present with very low percentages during the stratified conditions of the sapropel S1 layer. In contrast, such intense changes in species abundances of planktonic foraminifera, are not observed.
Finally, the third factor affecting equally both faunal groups’ distribution in the north Aegean Sea seems to be upwelling. Upwellings control food availability and foraminifera reproductive cycles [47,101]. The participation of this factor in Holocene records of the north Aegean is explained by the presence of cyclonic and anticyclonic eddies and, thus, to the development of down and upwellings of the organic matter [60,89].

6. Conclusions

Plankton foraminiferal and pteropod faunas have been studied in core AEX-15, from the North Aegean Trough (northeastern Mediterranean), to evaluate their relationship with surface water dynamics, and to decipher the control of the Holocene productivity and stratification changes coupled with the impact of the regional eastern Mediterranean climate regime. The ecological interpretation of both of these planktonic groups, integrated with the multivariate statistical analysis data, has provided an accurate interpretation of the changes in surface water properties prior, during, and after the deposition of the most recent sapropel S1. The Q-mode cluster and principal component analyses performed in the planktonic fauna of core AEX-15 revealed three distinct assemblages in the north Aegean Sea that can be summarized into relevant biotopes, each one representative of different hydrological and climatic conditions. These biotopes correspond to the sapropel S1 and its oxidized part, pre- and, post-sapropel intervals. The PCA performed in both fauna groups, suggested that primary productivity, stratification of the water column, and upwelling are the main drivers of the planktonic foraminifera distribution. The same factors are recognized for the pteropod fauna but with a different order, indicating stratification as the primary factor controlling their distribution. Overall, the observed high-resolution water column variability allows a detailed palaeoecological reconstruction for the Holocene archive in the Aegean Sea and, furthermore, provides a notable contribution to paleoclimatic studies, facilitating intercorrelations between similar oceanographic basins and offering a better comprehension of the paleoceanographic history of these basins.

Supplementary Materials

The following are available online at https://www.mdpi.com/article/10.3390/jmse9111249/s1. Table S1: Raw data of the percentages of planktonic foraminifera and pteropod species in downcore samples.

Author Contributions

Conceptualization, C.G. and G.K.; methodology, C.G., G.K. and A.A.; software, C.G.; validation, C.G., G.K. and A.A.; formal analysis, C.G.; investigation, C.G., G.K. and A.A.; resources, C.G., G.K. and A.A.; data curation, C.G. and G.K.; writing—original draft preparation, C.G.; writing—review and editing, C.G., G.K. and A.A.; visualization, G.K.; supervision, A.A. and E.K.; project administration, C.G.; funding acquisition, G.K. All authors have read and agreed to the published version of the manuscript.

Funding

This research received no external funding.

Institutional Review Board Statement

Not applicable.

Informed Consent Statement

Not applicable.

Data Availability Statement

The data presented in this study are available in Supplementary material [Table S1].

Acknowledgments

We wish to thank the Hellenic Survey of Geology and Mineral Exploration (H.S.G.M.E.) and especially Chr. Ioakim, for permitting the use of the material retrieved in the frame of “YPOTHER” project. This project was supported by the National Strategic Development Program EE (NSRF 2007–2013) and was realized at the H.S.G.M.E. in collaboration with the Institute of Oceanography of the Hellenic Centre for Marine Research (HCMR). We also thank Leonidas Giannatos for his assistance during the preparation of Figure 2 and Figure 3.

Conflicts of Interest

The authors declare no conflict of interest.

References

  1. Zervakis, V.; Georgopoulos, D.; Karageorgis, A.P.; Theocharis, A. On the response of the Aegean Sea to climatic variability: A review. Int. J. Climatol. 2004, 24, 1845–1858. [Google Scholar] [CrossRef]
  2. Giorgi, F.; Lionello, P. Climate change projections for the Mediterranean region. Global Planet. Chang. 2008, 63, 90–104. [Google Scholar] [CrossRef]
  3. Rohling, E.J.; Grant, K.; Bolshaw, M.; Roberts, A.; Siddall, M.; Hemleben, C.; Kucera, M. Antarctic temperature and global sea level closely coupled over the past five glacial cycles. Nat. Geosci. 2009, 2, 500–504. [Google Scholar] [CrossRef]
  4. Aksu, A.E.; Yaşar, D.; Mudie, P.J. Paleoclimatic and paleoceanographic conditions leading to development of sapropel layer S1 in the Aegean Sea. Palaeogeogr. Palaeoclim. Palaeoecol. 1995, 116, 71–101. [Google Scholar] [CrossRef]
  5. Rousakis, G.; Karageorgis, A.; Conispoliatis, N.; Lykousis, V. Last glacial-Holocene sediment sequences in N. Aegean basins: Structure, accumulation rates and clay mineral distribution. Geo-Mar. Lett. 2004, 24, 97–111. [Google Scholar] [CrossRef]
  6. Kontakiotis, G. Late Quaternary paleoenvironmental reconstruction and paleoclimatic implications of the Aegean Sea (eastern Mediterranean) based on paleoceanographic indexes and stable isotopes. Quatern. Int. 2016, 401, 28–42. [Google Scholar] [CrossRef] [Green Version]
  7. Poulos, S.E. The Mediterranean and Black Sea Marine System: An overview of its physico-geographic and oceanographic characteristics. Earth-Sci. Rev. 2020, 200, 103004. [Google Scholar] [CrossRef]
  8. De Lange, G.J.; Thomson, J.; Reitz, A.; Slomp, C.P.; Principato, M.S.; Erba, E.; Corselli, C. Synchronous basin-wide formation and redox-controlled preservation of a Mediterranean sapropel. Nat. Geosci. 2008, 1, 606–610. [Google Scholar] [CrossRef]
  9. Triantaphyllou, M.V.; Gogou, A.; Dimiza, M.D.; Kostopoulou, S.; Parinos, C.; Roussakis, G.; Geraga, M.; Bouloubassi, I.; Fleitmann, D.; Zervakis, V. Holocene climatic optimum centennial-scale paleoceanography in the NE Aegean (Mediterranean Sea). Geo-Mar. Lett. 2016, 36, 51–66. [Google Scholar] [CrossRef]
  10. Kuhnt, T.; Schmiedl, G.; Ehrmann, W.; Hamann, Y.; Hemleben, C. Deep-sea ecosystem variability of the Aegean Sea during the past 22 kyr as revealed by Benthic Foraminifera. Mar. Micropaleontol. 2007, 64, 141–162. [Google Scholar] [CrossRef]
  11. Schmiedl, G.; Kuhnt, T.; Ehrmann, W.; Emeis, K.-C.; Hamann, Y.; Kotthoff, U.; Dulski, P.; Pross, J. Climatic forcing of eastern Mediterranean deep-water formation and benthic ecosystems during the past 22,000 years. Quat. Sci. Rev. 2010, 29, 3006–3020. [Google Scholar] [CrossRef]
  12. Louvari, M.A.; Drinia, H.; Kontakiotis, G.; Di Bella, L.; Antonarakou, A.; Anastasakis, G. Impact of latest-glacial to Holocene sea-level oscillations on central Aegean shelf ecosystems: A benthic foraminiferal palaeoenvironmental assessment of South Evoikos Gulf, Greece. J. Mar. Syst. 2019, 199, 103181. [Google Scholar] [CrossRef]
  13. Vadsaria, T.; Ramstein, G.; Dutay, J.C.; Li, L.; Ayache, M.; Richon, C. Simulating the occurrence of the last sapropel event (S1): Mediterranean basin ocean dynamics simulations using Nd isotopic composition modeling. Paleoceanogr. Paleocl. 2019, 34, 237–251. [Google Scholar] [CrossRef]
  14. Le Houedec, S.; Mojtahid, M.; Bicchi, E.; de Lange, G.J.; Hennekam, R. Suborbital Hydrological Variability Inferred From Coupled Benthic and Planktic Foraminiferal-Based Proxies in the Southeastern Mediterranean During the Last 19 ka. Paleoceanogr. Paleocl. 2020, 35, e2019PA003827. [Google Scholar] [CrossRef]
  15. Rohling, E.J.; Marino, G.; Grant, K.M. Mediterranean climate and oceanography, and the periodic development of anoxic events (sapropels). Earth-Sci. Rev. 2015, 143, 62–97. [Google Scholar] [CrossRef]
  16. Zirks, E.; Krom, M.D.; Zhu, D.; Schmiedl, G.; Goodman-Tchernov, B.N. Evidence for the Presence of Oxygen-Depleted Sapropel Intermediate Water across the Eastern Mediterranean during Sapropel S1. ACS Earth Space Chem. 2019, 3, 2287–2297. [Google Scholar] [CrossRef]
  17. Tachikawa, K.; Vidal, L.; Cornuault, M.; Garcia, M.; Pothin, A.; Sonzogni, C.; Bard, E.; Menot, G.; Revel, M. Eastern Mediterranean Sea circulation inferred from the conditions of S1 sapropel deposition. Clim. Past 2015, 11, 855–867. [Google Scholar] [CrossRef] [Green Version]
  18. Grimm, R.; Maier-Reimer, E.; Mikolajewicz, U.; Schmiedl, G.; Müller-Navarra, K.; Adloff, F.; Grant, K.M.; Ziegler, M.; Lourens, L.J.; Emeis, K.-C. Late glacial initiation of Holocene eastern Mediterranean sapropel formation. Nat. Commun. 2015, 6, 7099. [Google Scholar] [CrossRef] [Green Version]
  19. Antonarakou, A.; Kontakiotis, G.; Zarkogiannis, S.; Mortyn, P.G.; Drinia, H.; Koskeridou, E.; Anastasakis, G. Planktonic foraminiferal abnormalities in coastal and open marine eastern Mediterranean environments: A natural stress monitoring approach in recent and early Holocene marine systems. J. Mar. Syst. 2018, 181, 63–78. [Google Scholar] [CrossRef]
  20. Pallacks, S.; Ziveri, P.; Martrat, B.; Mortyn, P.G.; Grelaud, M.; Schiebel, R.; Incarbona, A.; Garcia-Orellana, J.; Anglada-Ortiz, G. Planktic foraminiferal changes in the western Mediterranean Anthropocene. Global Planet. Change 2021, 204, 103549. [Google Scholar] [CrossRef]
  21. Avnaim-Katav, S.; Herut, B.; Rahav, E.; Katz, T.; Weinstein, Y.; Alkalay, R.; Berman-Frank, I.; Zlatkin, O.; Almogi-Labin, A. Sediment trap and deep sea coretop sediments as tracers of recent changes in planktonic foraminifera assemblages in the southeastern ultra-oligotrophic Levantine Basin. Deep Sea Res. Part II Top. Stud. Oceanogr. 2020, 171, 104669. [Google Scholar] [CrossRef]
  22. Zarkogiannis, S.; Kontakiotis, G.; Antonarakou, A. Recent planktonic foraminifera population and size response to Eastern Mediterranean hudrography. Rev. De Micropaleontol. 2020, 69, 100450. [Google Scholar] [CrossRef]
  23. Kontakiotis, G.; Efstathiou, E.; Zarkogiannis, S.D.; Besiou, E.; Antonarakou, A. Latitudinal Differentiation among Modern Planktonic Foraminiferal Populations of Central Mediterranean: Species–Specific Distribution Patterns and Size Variability. J. Mar. Sci. Eng. 2021, 9, 551. [Google Scholar] [CrossRef]
  24. Ofstad, S.; Zamelczyk, K.; Kimoto, K.; Chierici, M.; Fransson, A.; Rasmussen, T.L. Shell density of planktonic foraminifera and pteropod species Limacina helicina in the Barents Sea: Relation to ontogeny and water chemistry. PLoS ONE 2021, 16, e0249178. [Google Scholar] [CrossRef]
  25. Manno, C.; Bednaršek, N.; Tarling, G.A.; Peck, V.L.; Comeau, S.; Adhikari, D.; Bakker, D.C.E.; Bauerfeind, E.; Bergan, A.J.; Berning, M.I.; et al. Shelled pteropods in peril: Assessing vulnerability in a high CO2 ocean. Earth-Sci. Rev. 2017, 169, 132–145. [Google Scholar] [CrossRef]
  26. Casford, J.S.L.; Rohling, E.J.; Abu-Zied, R.H.; Fontanier, C.; Jorissen, F.J.; Leng, M.J.; Schmiedl, G.; Thomson, J. A dynamic concept for eastern Mediterranean circulation and oxygenation during sapropel formation. Palaeogeogr. Palaeoclim. Palaeoecol. 2003, 190, 103–119. [Google Scholar] [CrossRef]
  27. Kontakiotis, G.; Antonarakou, A.; Zachariasse, W.J. Late Quaternary palaeoenvironmental changes in the Aegean Sea: Interrelations and interactions between north and south Aegean Sea. Bull. Geol. Soc. Gr. 2013, 47, 167–177. [Google Scholar] [CrossRef] [Green Version]
  28. Wall-Palmer, D.; Smart, C.W.; Hart, M.B.; Leng, M.J.; Borghini, M.; Manini, E.; Aliani, S.; Conversi, A. Late Pleistocene pteropods, heteropods and planktonic foraminifera from the Caribbean Sea, Mediterranean Sea and Indian Ocean. Micropaleontology 2014, 60, 557–578. [Google Scholar]
  29. Giamali, C.; Kontakiotis, G.; Koskeridou, E.; Ioakim, C.; Antonarakou, A. Key Environmental Factors Controlling Planktonic Foraminiferal and Pteropod Community’s Response to Late Quaternary Hydroclimate Changes in the South Aegean Sea (Eastern Mediterranean). J. Mar. Sci. Eng. 2020, 8, 709. [Google Scholar] [CrossRef]
  30. Giamali, C.; Koskeridou, E.; Antonarakou, A.; Ioakim, C.; Kontakiotis, G.; Karageorgis, A.P.; Roussakis, G.; Karakitsios, V. Multiproxy ecosystem response of abrupt Holocene climatic changes in the northeastern Mediterranean sedimentary archive and hydrologic regime. Quat. Res. 2019, 92, 665–685. [Google Scholar] [CrossRef]
  31. Checa, H.; Margaritelli, G.; Pena, L.D.; Frigola, J.; Cacho, I.; Rettori, R.; Lirer, F. High resolution paleo-environmental changes during the Sapropel 1 in the North Ionian Sea, central Mediterranean. Holocene 2020, 30, 1504–1515. [Google Scholar] [CrossRef]
  32. Casford, J.S.L.; Abu-Zied, R.; Rohling, E.J.; Cooke, S.; Fontanier, C.; Leng, M.; Millard, A.; Thomson, J. A stratigraphically controlled multiproxy chronostratigraphy for the eastern Mediterranean. Paleoceanography 2007, 22, PA4215. [Google Scholar] [CrossRef]
  33. Siani, G.; Paterne, M.; Colin, C. Late glacial to Holocene planktic foraminifera bioevents and climatic record in the South Adriatic Sea. J. Quat. Sci. 2010, 25, 808–821. [Google Scholar] [CrossRef]
  34. Drinia, H.; Antonarakou, A.; Tsourou, T.; Kontakiotis, G.; Psychogiou, M.; Anastasakis, G. Foraminifera eco-biostratigraphy of the southern Evoikos outer shelf, central Aegean Sea, during MIS 5 to present. Cont. Shelf Res. 2016, 126, 36–49. [Google Scholar] [CrossRef]
  35. Antonarakou, A.; Kontakiotis, G.; Karageorgis, A.P.; Besiou, E.; Zarkogiannis, S.; Drinia, H.; Mortyn, G.P.; Tripsanas, E. Eco-biostratigraphic advances on late Quaternary geochronology and palaeoclimate: The marginal Gulf of Mexico analogue. Geol. Q. 2019, 63, 178–191. [Google Scholar] [CrossRef] [Green Version]
  36. Zarkogiannis, S.D.; Antonarakou, A.; Tripati, A.; Kontakiotis, G.; Mortyn, P.G.; Drinia, H.; Greaves, M. Influence of surface ocean density on planktonic foraminifera calcification. Sci. Rep. 2019, 9, 533. [Google Scholar] [CrossRef]
  37. Mojtahid, M.; Manceau, R.; Schiebel, R.; Hennekam, R.; de Lange, G.J. Thirteen thousand years of southeastern Mediterranean climate variability inferred from an integrative planktic foraminiferal-based approach. Paleoceanography 2015, 30, 402–422. [Google Scholar] [CrossRef]
  38. Zachariasse, W.J.; Kontakiotis, G.; Lourens, L.J.; Antonarakou, A. The Messinian of Agios Myron (Crete, Greece): A key to better understanding of diatomite formation on Gavdos (south of Crete). Palaeogeogr. Palaeoclim. Palaeoecol. 2021, 581, 110633. [Google Scholar] [CrossRef]
  39. Antonarakou, A.; Kontakiotis, G.; Mortyn, P.G.; Drinia, H.; Sprovieri, M.; Besiou, E.; Tripsanas, E. Biotic and geochemical (δ18O, δ13C, Mg/Ca, Ba/Ca) responses of Globigerinoides ruber morphotypes to upper water column variations during the last deglaciation, Gulf of Mexico. Geochim. Cosmochim. Acta 2015, 170, 69–93. [Google Scholar] [CrossRef]
  40. Vasiliev, I.; Karakitsios, V.; Bouloubassi, I.; Agiadi, K.; Kontakiotis, G.; Antonarakou, A.; Triantaphyllou, M.; Gogou, A.; Kafousia, N.; de Rafélis, M.; et al. Large Sea Surface Temperature, Salinity, and Productivity-Preservation Changes Preceding the Onset of the Messinian Salinity Crisis in the Eastern Mediterranean Sea. Paleoceanogr. Paleocl. 2019, 34, 182–202. [Google Scholar] [CrossRef]
  41. Kontakiotis, G.; Karakitsios, V.; Mortyn, P.G.; Antonarakou, A.; Drinia, H.; Anastasakis, G.; Agiadi, K.; Kafousia, N.; De Rafelis, M. New insights into the early Pliocene hydrographic dynamics and their relationship to the climatic evolution of the Mediterranean Sea. Palaeogeogr. Palaeoclim. Palaeoecol. 2016, 459, 348–364. [Google Scholar] [CrossRef]
  42. Kontakiotis, G.; Besiou, E.; Antonarakou, A.; Zarkogiannis, S.D.; Kostis, A.; Mortyn, P.G.; Moissette, P.; Cornée, J.J.; Schulbert, C.; Drinia, H.; et al. Decoding sea surface and paleoclimate conditions in the eastern Mediterranean over the Tortonian-Messinian Transition. Palaeogeogr. Palaeoclim. Palaeoecol. 2019, 534, 109312. [Google Scholar] [CrossRef]
  43. Margaritelli, G.; Cisneros, M.; Cacho, I.; Capotondi, L.; Vallefuoco, M.; Rettori, R.; Lirer, F. Climatic variability over the last 3000 years in the central-western Mediterranean Sea (Menorca Basin) detected by planktonic foraminifera and stable isotope records. Global Planet. Chang. 2018, 169, 179–187. [Google Scholar] [CrossRef]
  44. Margaritelli, G.; Cacho, I.; Català, A.; Barra, M.; Bellucci, L.G.; Lubritto, C.; Rettori, R.; Lirer, F. Persistent warm Mediterranean surface waters during the Roman period. Sci. Rep. 2020, 10, 10431. [Google Scholar] [CrossRef]
  45. Margaritelli, G.; Vallefuoco, M.; Di Rita, F.; Capotondi, L.; Bellucci, L.G.; Insinga, D.D.; Petrosino, P.; Bonomo, S.; Cacho, I.; Cascella, A. Marine response to climate changes during the last five millennia in the central Mediterranean Sea. Global Planet. Chang. 2016, 142, 53–72. [Google Scholar] [CrossRef]
  46. Thirumalai, K.; Richey, J.N.; Quinn, T.M. Holocene evolution of sea-surface temperature and salinity in the Gulf of Mexico. Paleoceanogr. Paleocl. 2021, 36, e2021PA004221. [Google Scholar] [CrossRef]
  47. Hemleben, C.; Spindler, M.; Anderson, O. Modern Planktic Foraminifera; Springer-Verlag: New York, NY, USA, 1989; Volume 22. [Google Scholar]
  48. Kucera, M. Chapter six planktonic foraminifera as tracers of past oceanic environments. Dev. Mar. Geol. 2007, 1, 213–262. [Google Scholar]
  49. Lalli, C.M.; Gilmer, R.W. Pelagic Snails: The Biology of Holoplanktonic Gastropod Mollusks; Stanford University Press: Redwood City, CA, USA, 1989. [Google Scholar]
  50. Pierrot-Bultsa, A.C.; Peijnenburga, K.T.C.A. Pteropods. In Encyclopedia of Marine Geosciences; Harff, J., Meschede, M., Petersen, S., Thiede, J., Eds.; Springer: Dordrecht, The Netherlands, 2015. [Google Scholar] [CrossRef]
  51. Hunt, B.; Pakhomov, E.; Hosie, G.W.; Siegel, V.; Ward, P.; Bernard, K. Pteropods in Southern Ocean ecosystems. Prog. Oceanogr. 2008, 78, 193–221. [Google Scholar] [CrossRef]
  52. Berner, R.A.; Honjo, S. Pelagic sedimentation of aragonite: Its geochemical significance. Science 1981, 211, 940–942. [Google Scholar] [CrossRef]
  53. Herman, Y. Evidence of climatic changes in Red Sea cores. In Proceedings of the VII Congress International Association for Quaternary Research; University of Utah Press: Salt Lake City, UT, USA, 1968; pp. 325–348. [Google Scholar]
  54. Herman, Y. Vertical and horizontal distribution of pteropods in Quaternary sequences. In The Micropalaeontology of Oceans; Funnell, B.M., Reidel, W.R., Eds.; Cambridge University Press: Cambridge, UK, 1971; pp. 463–486. [Google Scholar]
  55. Chen, C. Pteropods in the Hot Brine Sediments of the Red Sea; Springer: Berlin/Heidelberg, Germany, 1969. [Google Scholar] [CrossRef]
  56. Almogi-Labin, A.; Edelman-Furstenberg, Y.; Hemleben, C. Variations in the biodiversity of thecosomatous pteropods during the Late Quaternary as a response to environmental changes in the Gulf of Aden-Red Sea-Gulf of Aqaba ecosystem. In The Improbable Gulf. Environment, Biodiversity and Preservation; Por, D.e.A.-E., Ed.; The Hebrew University Magnes Press: Jerusalem, Israel, 2008; pp. 31–48. [Google Scholar]
  57. Singh, A.; Nisha, N.R.; Joydas, T.; Joydas, V. Distribution patterns of Recent pteropods in surface sediments of the western continental shelf of India. J. Micropalaeontol. 2005, 24, 39. [Google Scholar] [CrossRef] [Green Version]
  58. Wall-Palmer, D.; Smart, C.W.; Hart, M.B. In-life pteropod shell dissolution as an indicator of past ocean carbonate saturation. Quat. Sci. Rev. 2013, 81, 29–34. [Google Scholar] [CrossRef]
  59. Wall-Palmer, D.; Jones, M.T.; Hart, M.B.; Fisher, J.K.; Smart, C.W.; Hembury, D.J.; Palmer, M.R.; Fones, G.R. Explosive volcanism as a cause for mass mortality of pteropods. Mar. Geol. 2011, 282, 231–239. [Google Scholar] [CrossRef] [Green Version]
  60. Lykousis, V.; Chronis, G.; Tselepides, A.; Price, N.B.; Theocharis, A.; Siokou-Frangou, I.; Van Wambeke, F.; Danovaro, R.; Stavrakakis, S.; Duineveld, G.; et al. Major outputs of the recent multidisciplinary biogeochemical researches undertaken in the Aegean Sea. J. Mar. Syst. 2002, 33, 313–334. [Google Scholar] [CrossRef]
  61. Papanikolaou, D.; Alexandri, M.; Nomikou, P.; Ballas, D. Morphotectonic structure of the western part of the North Aegean Basin based on swath bathymetry. Mar. Geol. 2002, 190, 465–492. [Google Scholar] [CrossRef]
  62. Poulos, S.E.; Drakopoulos, P.G.; Collins, M.B. Seasonal variability in sea surface oceanographic conditions in the Aegean Sea (Eastern Mediterranean): An overview. J. Mar. Syst. 1997, 13, 225–244. [Google Scholar] [CrossRef]
  63. Theocharis, A.; Georgopoulos, D. Dense water formation over the Samothraki and Limnos Plateaux in the north Aegean Sea (Eastern Mediterranean Sea). Cont. Shelf Res. 1993, 13, 919–939. [Google Scholar] [CrossRef]
  64. Velaoras, D.; Lascaratos, A. Deep water mass characteristics and interannual variability in the North and Central Aegean Sea. J. Mar. Syst. 2005, 53, 59–85. [Google Scholar] [CrossRef]
  65. Karageorgis, A.P.; Kaberi, H.G.; Tengberg, A.; Zervakis, V.; Hall, P.O.J.; Anagnostou, C.L. Comparison of particulate matter distribution, in relation to hydrography, in the mesotrophic Skagerrak and the oligotrophic northeastern Aegean Sea. Cont. Shelf Res. 2003, 23, 1787–1809. [Google Scholar] [CrossRef]
  66. Androulidakis, Y.S.; Krestenitis, Y.N.; Psarra, S. Coastal upwelling over the North Aegean Sea: Observations and simulations. Cont. Shelf Res. 2017, 149, 32–51. [Google Scholar] [CrossRef]
  67. Krom, M.D.; Kress, N.; Brenner, S.; Gordon, L.I. Phosphorus limitation of primary productivity in the eastern Mediterranean Sea. Limnol. Oceanogr. 1991, 36, 424–432. [Google Scholar] [CrossRef]
  68. Stergiou, K.I.; Christou, E.D.; Georgopoulos, D.; Zenetos, A.; Souvermezoglou, C. The Hellenic Seas: Physics, chemistry, biology and fisheries. Oceanogr. Mar. Biol. 1997, 35, 415–538. [Google Scholar]
  69. Kontakiotis, G.; Antonarakou, A.; Mortyn, P.G.; Drinia, H.; Anastasakis, G.; Zarkogiannis, S.; Möbius, J. Morphological recognition of Globigerinoides ruber morphotypes and their susceptibility to diagenetic alteration in the eastern Mediterranean Sea. J. Mar. Syst. 2017, 174, 12–24. [Google Scholar] [CrossRef]
  70. Zarkogiannis, S.D.; Kontakiotis, G.; Gkaniatsa, G.; Kuppili, V.S.C.; Marathe, S.; Wanelik, K.; Lianou, V.; Besiou, E.; Makri, P.; Antonarakou, A. An Improved Cleaning Protocol for Foraminiferal Calcite from Unconsolidated Core Sediments: HyPerCal—A New Practice for Micropaleontological and Paleoclimatic Proxies. J. Mar. Sci. Eng. 2020, 8, 998. [Google Scholar] [CrossRef]
  71. Patterson, R.T.; Fishbein, E. Re-examination of the statistical methods used to determine the number of point counts needed for micropaleontological quantitative research. J. Paleontol. 1989, 63, 245–248. [Google Scholar] [CrossRef]
  72. Davis, J.C.; Sampson, R.J. Statistics and Data Analysis in Geology; Wiley New York: New York, NY, USA, 1986; Volume 646. [Google Scholar]
  73. Hammer, Ø.; Harper, D.A.T.; Ryan, P.D. PAST: Paleontological Statistics software package for education and data analysis. Palaeontol. Electron. 2001, 4, 9. [Google Scholar]
  74. Rohling, E.; Jorissen, F.; Stigter, H. 200 Year interruption of Holocene sapropel formation in the Adriatic Sea. J. Micropalaeontol. 1997, 16, 97–108. [Google Scholar] [CrossRef]
  75. Fairbanks, R.; Wiebe, P. Foraminifera and Chlorophyll Maximum: Vertical Distribution, Seasonal Succession, and Paleoceanographic Significance. Science 1980, 209, 1524–1526. [Google Scholar] [CrossRef]
  76. Lourens, L.; Hilgen, F.; Gudjonsson, L.; Zachariasse, W.J. Late Pliocene to early Pleistocene astonomically forced sea surface productivity and temperature variations in the Mediterranean. Mar. Micropaleontol. 1992, 19, 49–78. [Google Scholar] [CrossRef]
  77. Thunell, R. Distribution of recent planktonic foraminifera in surface sediments of the Mediterranean Sea. Mar. Micropaleontol. 1978, 3, 147–173. [Google Scholar] [CrossRef]
  78. Pujol, C.; Vergnaud-Grazzini, C. Distribution patterns of live planktic foraminifers as related to regional hydrology and productive systems of the Mediterranean Sea. Mar. Micropaleontol. 1995, 25, 187–217. [Google Scholar] [CrossRef]
  79. Rohling, E.J.; Jorissen, F.; Grazzini, C.V.; Zachariasse, W.J. Northern Levantine and Adriatic Quaternary planktic foraminifera; Reconstruction of paleoenvironmental gradients. Mar. Micropaleontol. 1993, 21, 191–218. [Google Scholar] [CrossRef]
  80. Jonkers, L.; Kučera, M. Global analysis of seasonality in the shell flux of extant planktonic Foraminifera. Biogeosciences 2015, 12, 2207–2226. [Google Scholar] [CrossRef] [Green Version]
  81. Weinkauf, M.F.G.; Kunze, J.G.; Waniek, J.J.; Kučera, M. Seasonal variation in shell calcification of planktonic foraminifera in the NE Atlantic reveals species-specific response to temperature, productivity, and optimum growth conditions. PLoS ONE 2016, 11, e0148363. [Google Scholar] [CrossRef] [PubMed] [Green Version]
  82. Schiebel, R.; Hemleben, C. Planktic Foraminifers in the Modern Ocean; Springer: Berlin/Heidelberg, Germany, 2017. [Google Scholar]
  83. Naidu, P.D. Distribution patterns of Recent planktonic foraminifera in surface sediments of the western continental margin of India. Mar. Geol. 1993, 110, 403–418. [Google Scholar] [CrossRef]
  84. Peterson, L.C.; Overpeck, J.T.; Kipp, N.G.; Imbrie, J. A high-resolution Late Quaternary upwelling record from the anoxic Cariaco Basin, Venezuela. Paleoceanography 1991, 6, 99–119. [Google Scholar] [CrossRef]
  85. Prell, W.L.; Curry, W.B. Faunal and isotopic indices of monsoonal upwelling-western arabian sea. Oceanol. Acta 1981, 4, 91–98. [Google Scholar]
  86. Cullen, J.L.; Prell, W.L. Planktonic foraminifera of the northern Indian Ocean: Distribution and preservation in surface sediments. Mar. Micropaleontol. 1984, 9, 1–52. [Google Scholar] [CrossRef]
  87. Bé, A.W.H.; Gilmer, R.W. A zoogeographic and taxonomic review of euthecosomatous Pteropoda. Oceanic Micropaleontol. 1977, 1, 733–808. [Google Scholar]
  88. Almogi-Labin, A.; Hemleben, C.; Deuser, W.G. Seasonal variation in the flux of euthecosomatous pteropods collected in a deep sediment trap in the Sargasso Sea. Deep Sea Res. Part I Oceanogr. Res. Pap. 1988, 35, 441–464. [Google Scholar] [CrossRef]
  89. Geraga, M.; Ioakim, C.; Lykousis, V.; Tsaila-Monopolis, S.; Mylona, G. The high-resolution palaeoclimatic and palaeoceanographic history of the last 24,000years in the central Aegean Sea, Greece. Palaeogeogr. Palaeoclim. Palaeoecol. 2010, 287, 101–115. [Google Scholar] [CrossRef]
  90. Zachariasse, W.; Jorissen, F.; Perissoratis, C.; Rohling, E.; Tsapralis, V. Late quaternary foraminiferal changes and the nature of sapropel S1 in Skopelos Basin. In Proceedings of the 5th Hellenic Symposium of Oceanography and Fisheries, Kavala, Greece, 15–18 April 1997; pp. 391–394. [Google Scholar]
  91. Almogi-Labin, A.; Hemleben, C.; Meischner, D.; Erlenkeuser, H. Paleoenvironmental events during the last 13,000 years in the central Red Sea as recorded by pteropoda. Paleoceanography 1991, 6, 83–98. [Google Scholar] [CrossRef]
  92. Rottman, M.L. Net tow and surface sediment distributions of pteropods in the South China Sea region: Comparison and oceanographic implications. Mar. Micropaleontol. 1980, 5, 71–110. [Google Scholar] [CrossRef]
  93. Sijinkumar, A.V.; Bejugam, N.; Guptha, M.V.S. Late Quaternary record of pteropod preservation from the Andaman Sea. Mar. Geol. 2010, 275, 221–229. [Google Scholar] [CrossRef] [Green Version]
  94. Buccheri, G.; Capretto, G.; Di Donato, V.; Esposito, P.; Ferruzza, G.; Pescatore, T.; Russo Ermolli, E.; Senatore, M.R.; Sprovieri, M.; Bertoldo, M.; et al. A high resolution record of the last deglaciation in the southern Tyrrhenian Sea: Environmental and climatic evolution. Mar. Geol. 2002, 186, 447–470. [Google Scholar] [CrossRef]
  95. Ehrmann, W.; Schmiedl, G.; Hamann, Y.; Kuhnt, T.; Hemleben, C.; Siebel, W. Clay minerals in late glacial and Holocene sediments of the northern and southern Aegean Sea. Palaeogeogr. Palaeoclim. Palaeoecol. 2007, 249, 36–57. [Google Scholar] [CrossRef]
  96. Sperling, M.; Schmiedl, G.; Hemleben, C.; Emeis, K.C.; Erlenkeuser, H.; Grootes, P.M. Black Sea impact on the formation of eastern Mediterranean sapropel S1? Evidence from the Marmara Sea. Palaeogeogr. Palaeoclim. Palaeoecol. 2003, 190, 9–21. [Google Scholar] [CrossRef]
  97. Casford, J.S.L.; Rohling, E.J.; Abu-Zied, R.; Cooke, S.; Fontanier, C.; Leng, M.; Lykousis, V. Circulation changes and nutrient concentrations in the late Quaternary Aegean Sea: A nonsteady state concept for sapropel formation. Paleoceanography 2002, 17, 1024–1034. [Google Scholar] [CrossRef] [Green Version]
  98. Rampal, J. Biodiversité et biogéographie chez les Cavoliniidae (Mollusca, Gastropoda, Opisthobranchia, Euthecosomata). Régions faunistiques marines. Zoosystema 2002, 24, 209–258. [Google Scholar]
  99. Johnson, R.; Manno, C.; Ziveri, P. Spring distribution of shelled pteropods across the Mediterranean Sea. Biogeosci. Discuss. 2020, 2020, 1–23. [Google Scholar] [CrossRef] [Green Version]
  100. Almogi-Labin, A.; Hemleben, C.; Meischner, D. Carbonate preservation and climatic changes in the central Red Sea during the last 380 kyr as recorded by pteropods. Mar. Micropaleontol. 1998, 33, 87–107. [Google Scholar] [CrossRef]
  101. Thunell, R.; Reynolds, L.S. Planktonic Foraminifera faunal and stable isotopic indices of upwelling: A sediment trap study in the San Pedro Basin, Southern California Bight. In Upwelling Systems: Evolution Since the Early Miocene; Summerhayes, C.P., Prell, W.L., Emeis, K.C., Eds.; Geological Society London: London, UK, 1992; Volume 64, pp. 77–91. [Google Scholar]
Figure 1. (a) Map of the Aegean Sea; inset shows location of the north Aegean sediment core AEX-15 (39°39.900′ N, 24°15.369′ E; 1242 m water depth, length 178 cm), gray arrows show the Black Sea Water (BSW) inflow and the Levantine Intermediate Water (LIW) that enters the Aegean Sea from the Levantine Sea; (b) lithological log of core AEX-15.
Jmse 09 01249 g001
Figure 2. Dendrogram resulting from Q−mode cluster analysis on planktonic foraminifera and the clusters identified in core AEX−15: T. quinqueloba assemblage with pink color (Cluster I), G. inflata assemblage with yellow color (Cluster II), and G. ruber alba assemblage with green color (Cluster III).
Jmse 09 01249 g002
Figure 3. Dendrogram resulting from Q−mode cluster analysis in pteropods and the clusters identified in core AEX−15: D. trispinosa assemblage with blue color (Cluster I), H. inflatus assemblage with pink color (Cluster II), and L. trochiformis assemblage with green color (Cluster III).
Jmse 09 01249 g003
Figure 4. Environmental factors controlling planktonic foraminifera and pteropod distribution resulting from the PCA. (a) PCA1 of planktonic foraminifera was interpreted as a productivity factor; (b) PCA2 of planktonic foraminifera was interpreted as a stratification factor; (c) PCA3 of planktonic foraminifera was interpreted as an upwelling factor; (d) PCA1 of pteropods was interpreted as a stratification factor; (e) PCA2 of pteropods was interpreted as a productivity factor; (f) PCA3 of pteropods was interpreted as an upwelling factor. Gray and light gray bands correspond to the sapropel S1 and its oxidized part, respectively.
Jmse 09 01249 g004
Table 1. Principle component analysis (PCA) factors based on planktonic foraminifera and their percentages of the total variability for core AEX-15.
PCA FactorsEigenvalue% VarianceCumulative % of the Total Variance
1622.45867.94967.949
2142.71715.57983.528
367.93867.41690.944
427.0392.95293.896
522.78852.48896.384
617.8521.94998.333
76.217080.67999.011
83.399220.37199.382
92.748320.30099.682
101.761440.19299.875
110.7840010.08699.960
120.3421340.03799.998
130.01723970.00299.999
Table 2. Principle component analysis (PCA) factors based on pteropods and their percentages of the total variability for core AEX-15.
PCA FactorsEigenvalue% VarianceCumulative % of the Total Variance
1494.86237.76437.764
2362.47627.66265.426
3183.95614.03879.464
495.07157.25586.719
578.88956.02092.739
635.63372.71995.459
729.40562.24497.703
824.01611.83399.536
93.75090.28699.822
102.331090.17899.999
Table 3. Ranking of the planktonic foraminifera species and their factor loadings along the PCA factors. Bold data indicate the most important factor loadings in each factor.
SpeciesFactor 1Factor 2Factor 3
Orbulina universa−0.084−0.170−0.137
Globigerinoides ruber alba0.6700.5690.256
Globigerinoides ruber rosea0.077−0.209−0.515
Globigerinoides sacculifer0.0270.033−0.027
Globorotalia inflata0.002−0.044−0.183
Globigerina bulloides−0.024−0.5360.734
Globoturborotalita rubescens0.011−0.158−0.155
Globigerinella siphonifera gr.0.0040.034−0.023
Neogloboquadrina pachyderma0.050−0.004−0.155
Neogloboquadrina dutertrei−0.003−0.006−0.001
Turborotalita quinqueloba−0.7310.5360.159
Globigerinita glutinata0.008−0.0050.063
Table 4. Ranking of the pteropod species and their factor loadings along the PCA factors. Bold data indicate the most important factor loadings in each factor.
SpeciesFactor 1Factor 2Factor 3
Heliconoides inflatus0.8660.3800.162
Limacina retroversa−0.0060.006−0.011
Limacina trochiformis−0.3640.3000.733
Boasia chierchiae0.218−0.8420.244
Creseis acicula−0.1330.071−0.448
Styliola subula−0.1010.062−0.017
Clio cuspidata−0.0150.0100.028
Clio pyramidata−0.1900.166−0.088
Diacria trispinosa−0.0110.035−0.394
Cavolinia spp.−0.079−0.1370.109
Publisher’s Note: MDPI stays neutral with regard to jurisdictional claims in published maps and institutional affiliations.

