
Potential Applications of a Novel Ballast Water Pretreatment Device: Grinding Device

 and
and
Abstract
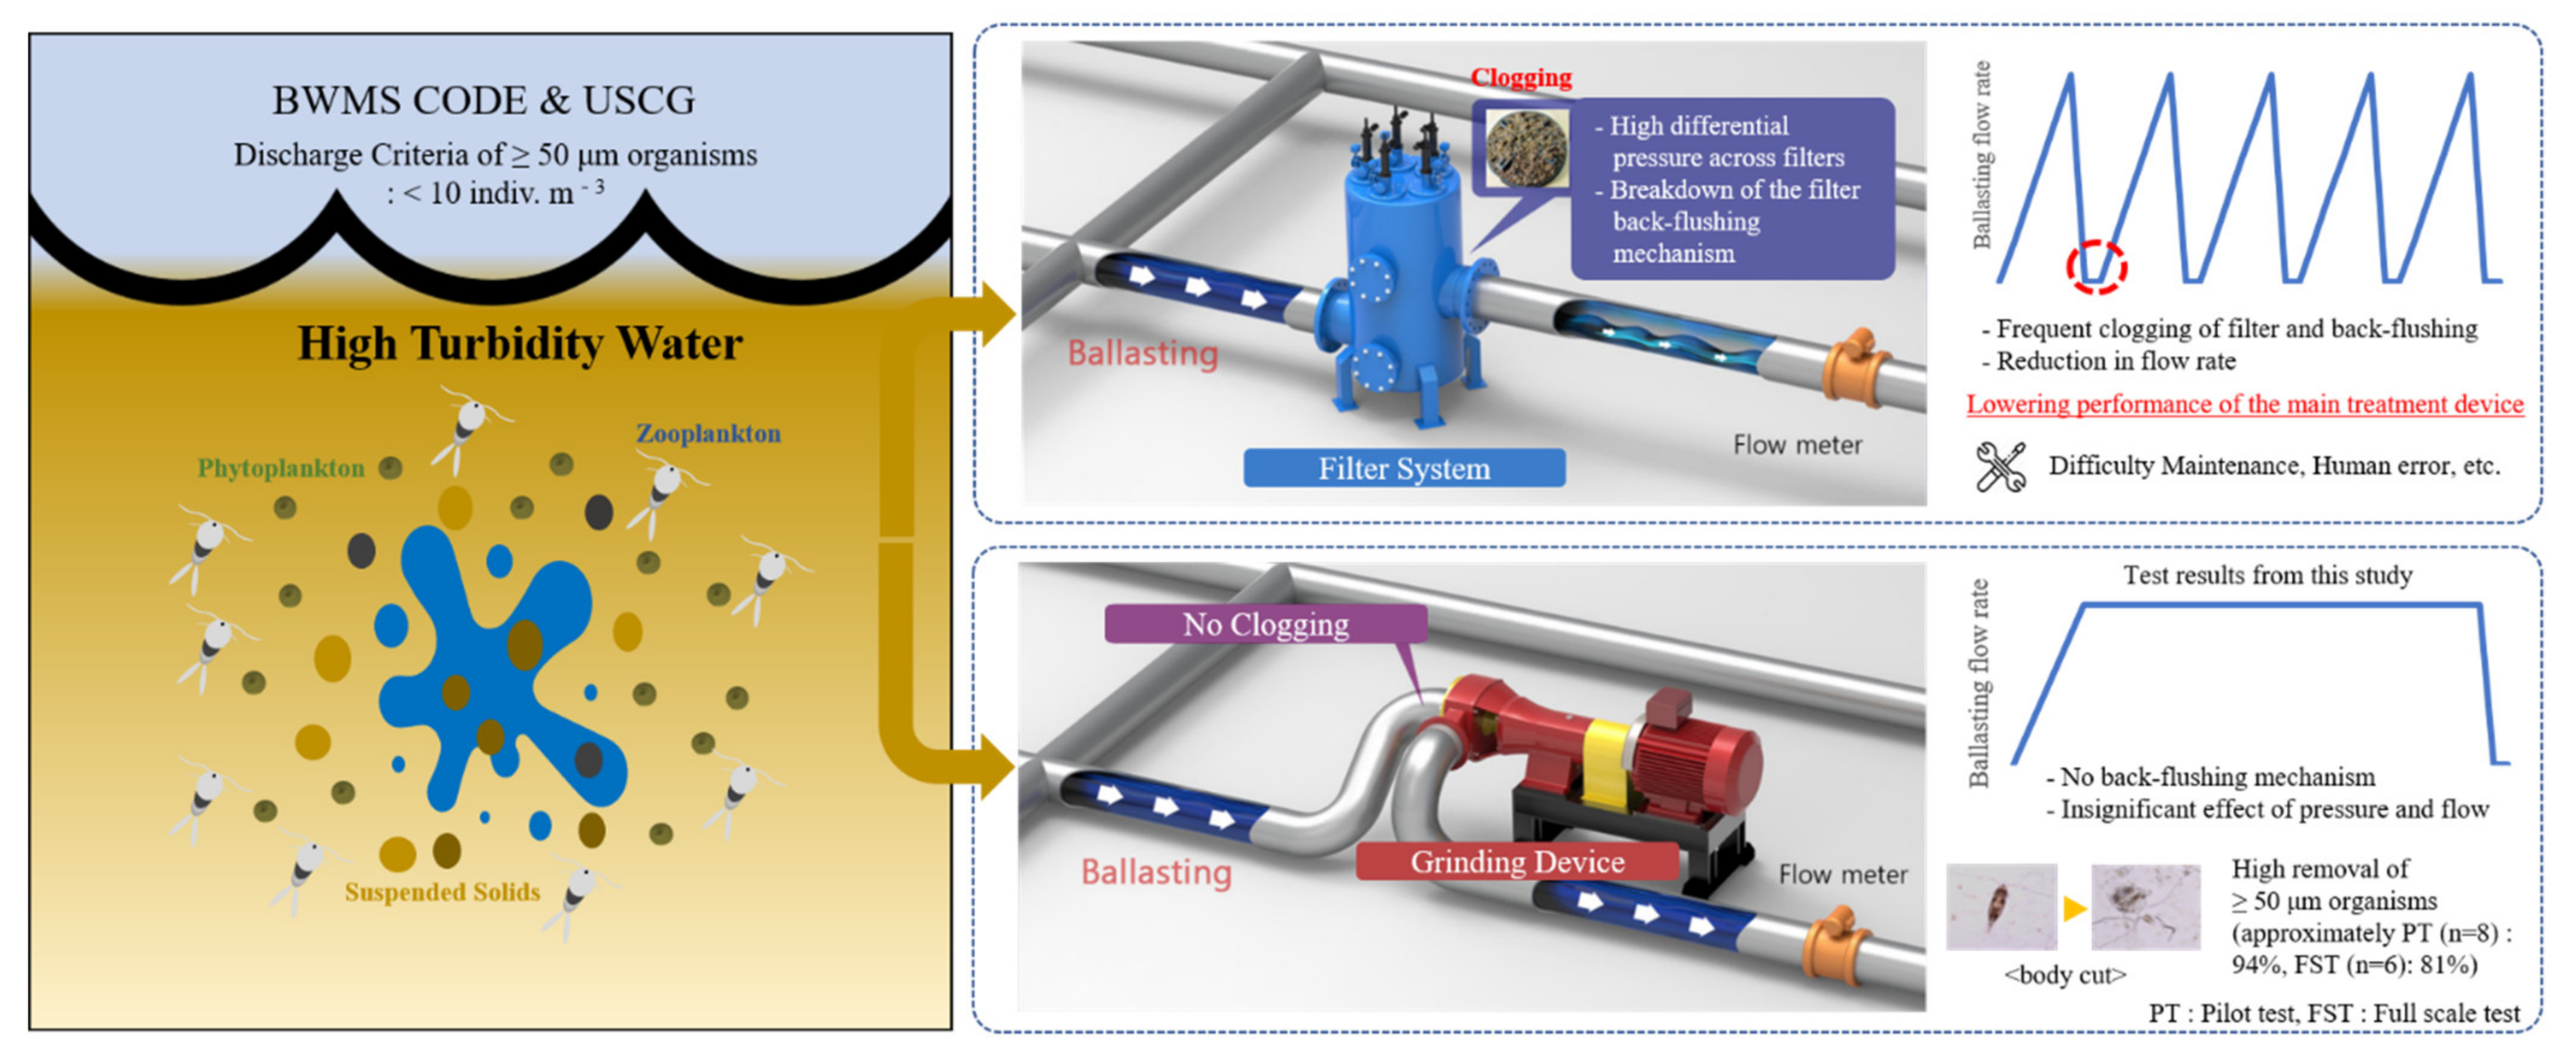
:1. Introduction
2. Materials and Methods
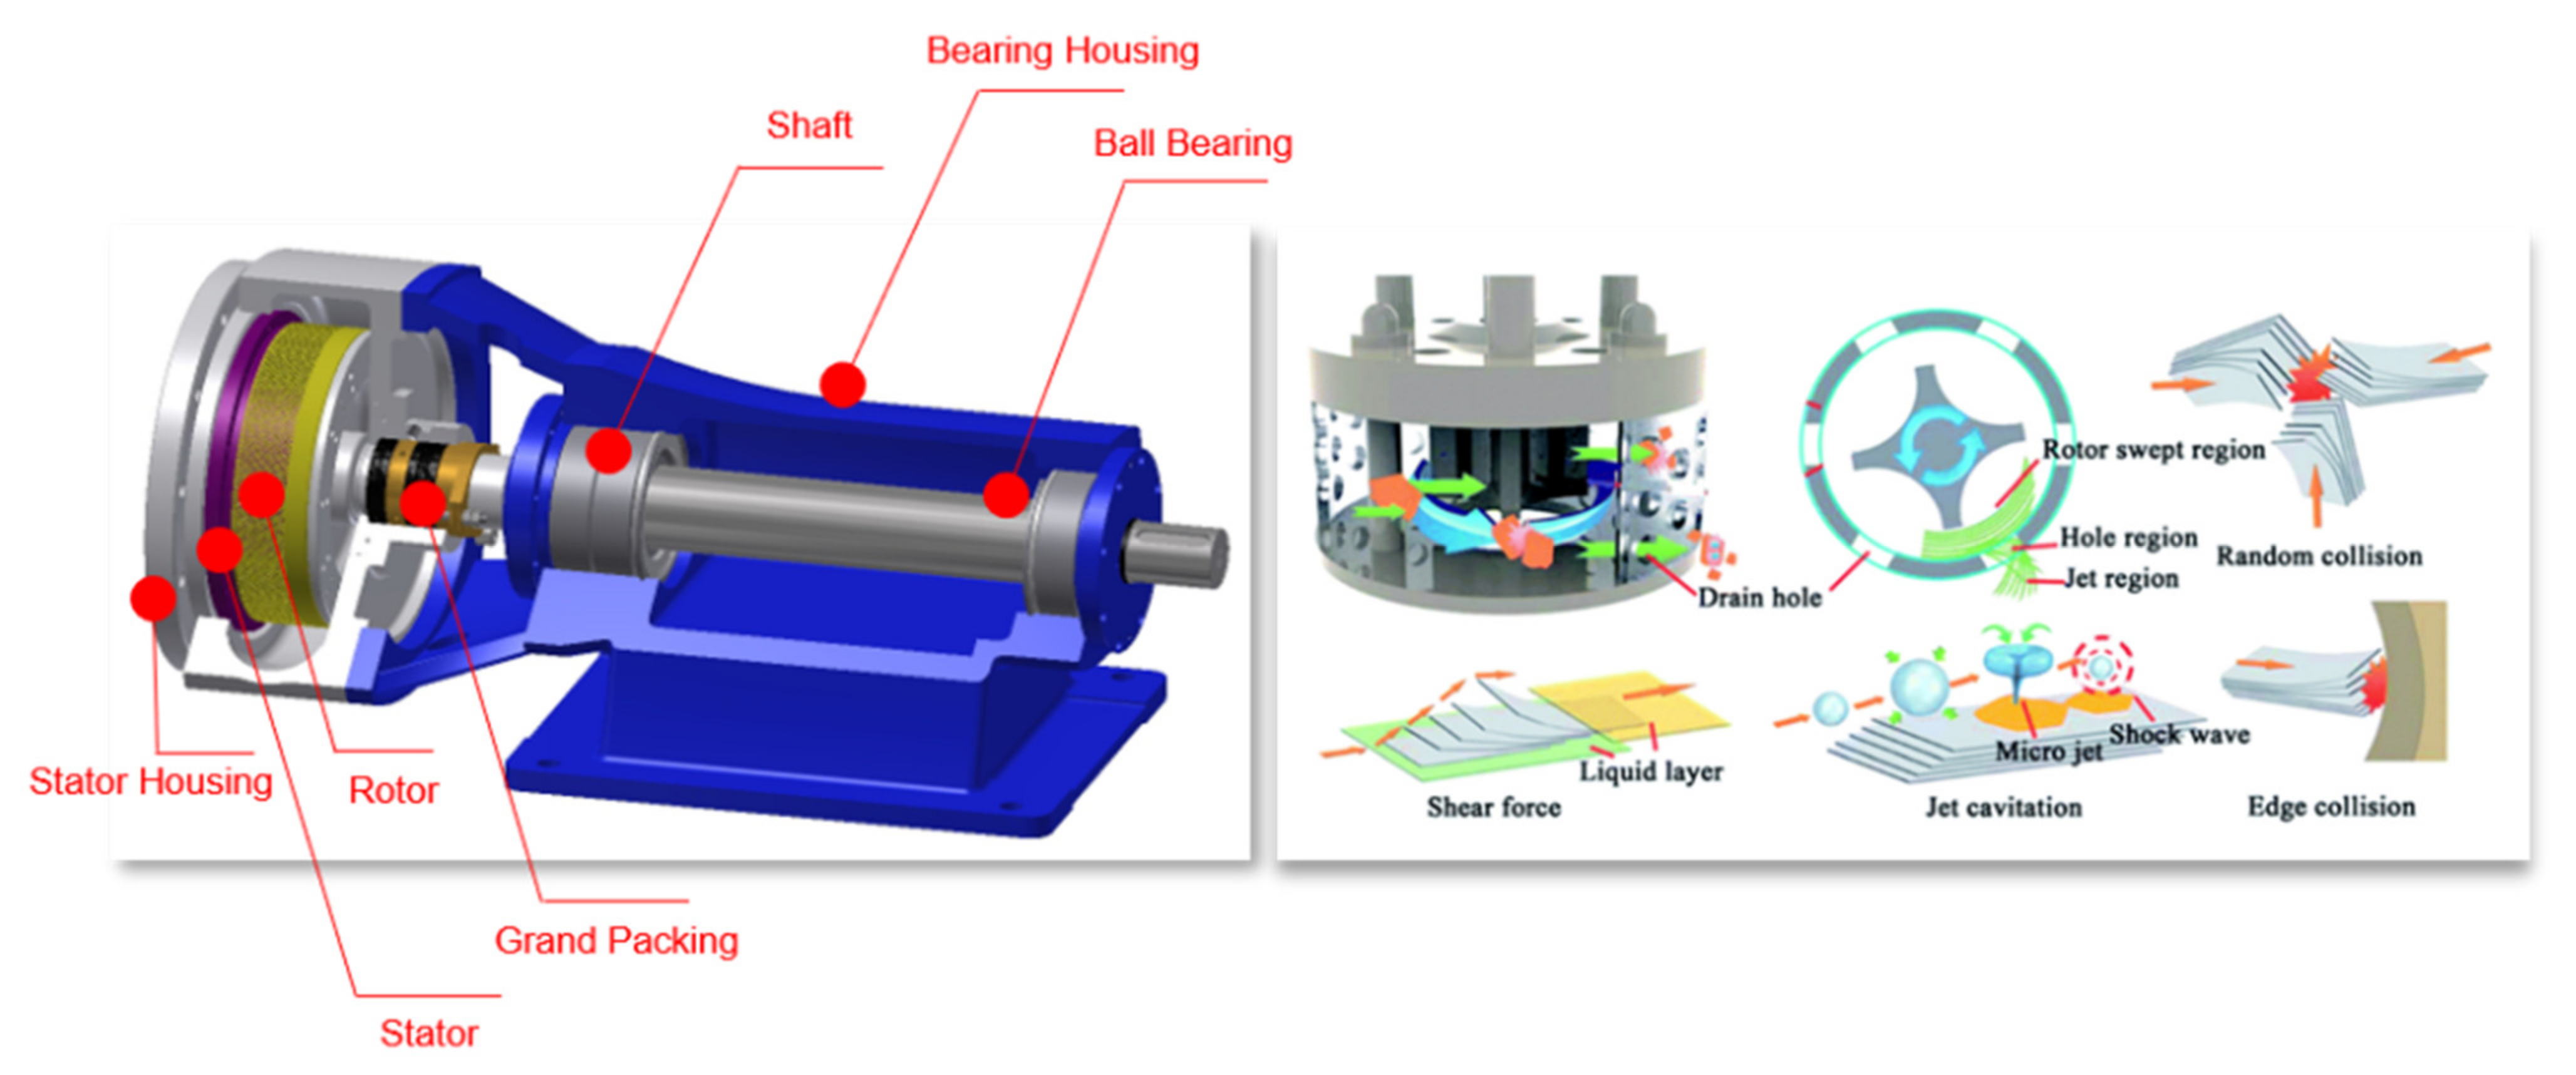
2.1. Principle of GD
2.2. Evaluation of Solid Grinding Efficiency
2.3. Removal Efficiency on ≥50 μm Zooplankton Species
2.3.1. Pilot Test
2.3.2. Full-Scale Test
2.4. Data Analysis
3. Results
3.1. Evaluation of Solid Grinding Efficiency
3.2. Evaluation of Removal Efficiency on ≥50 μm Zooplankton Species
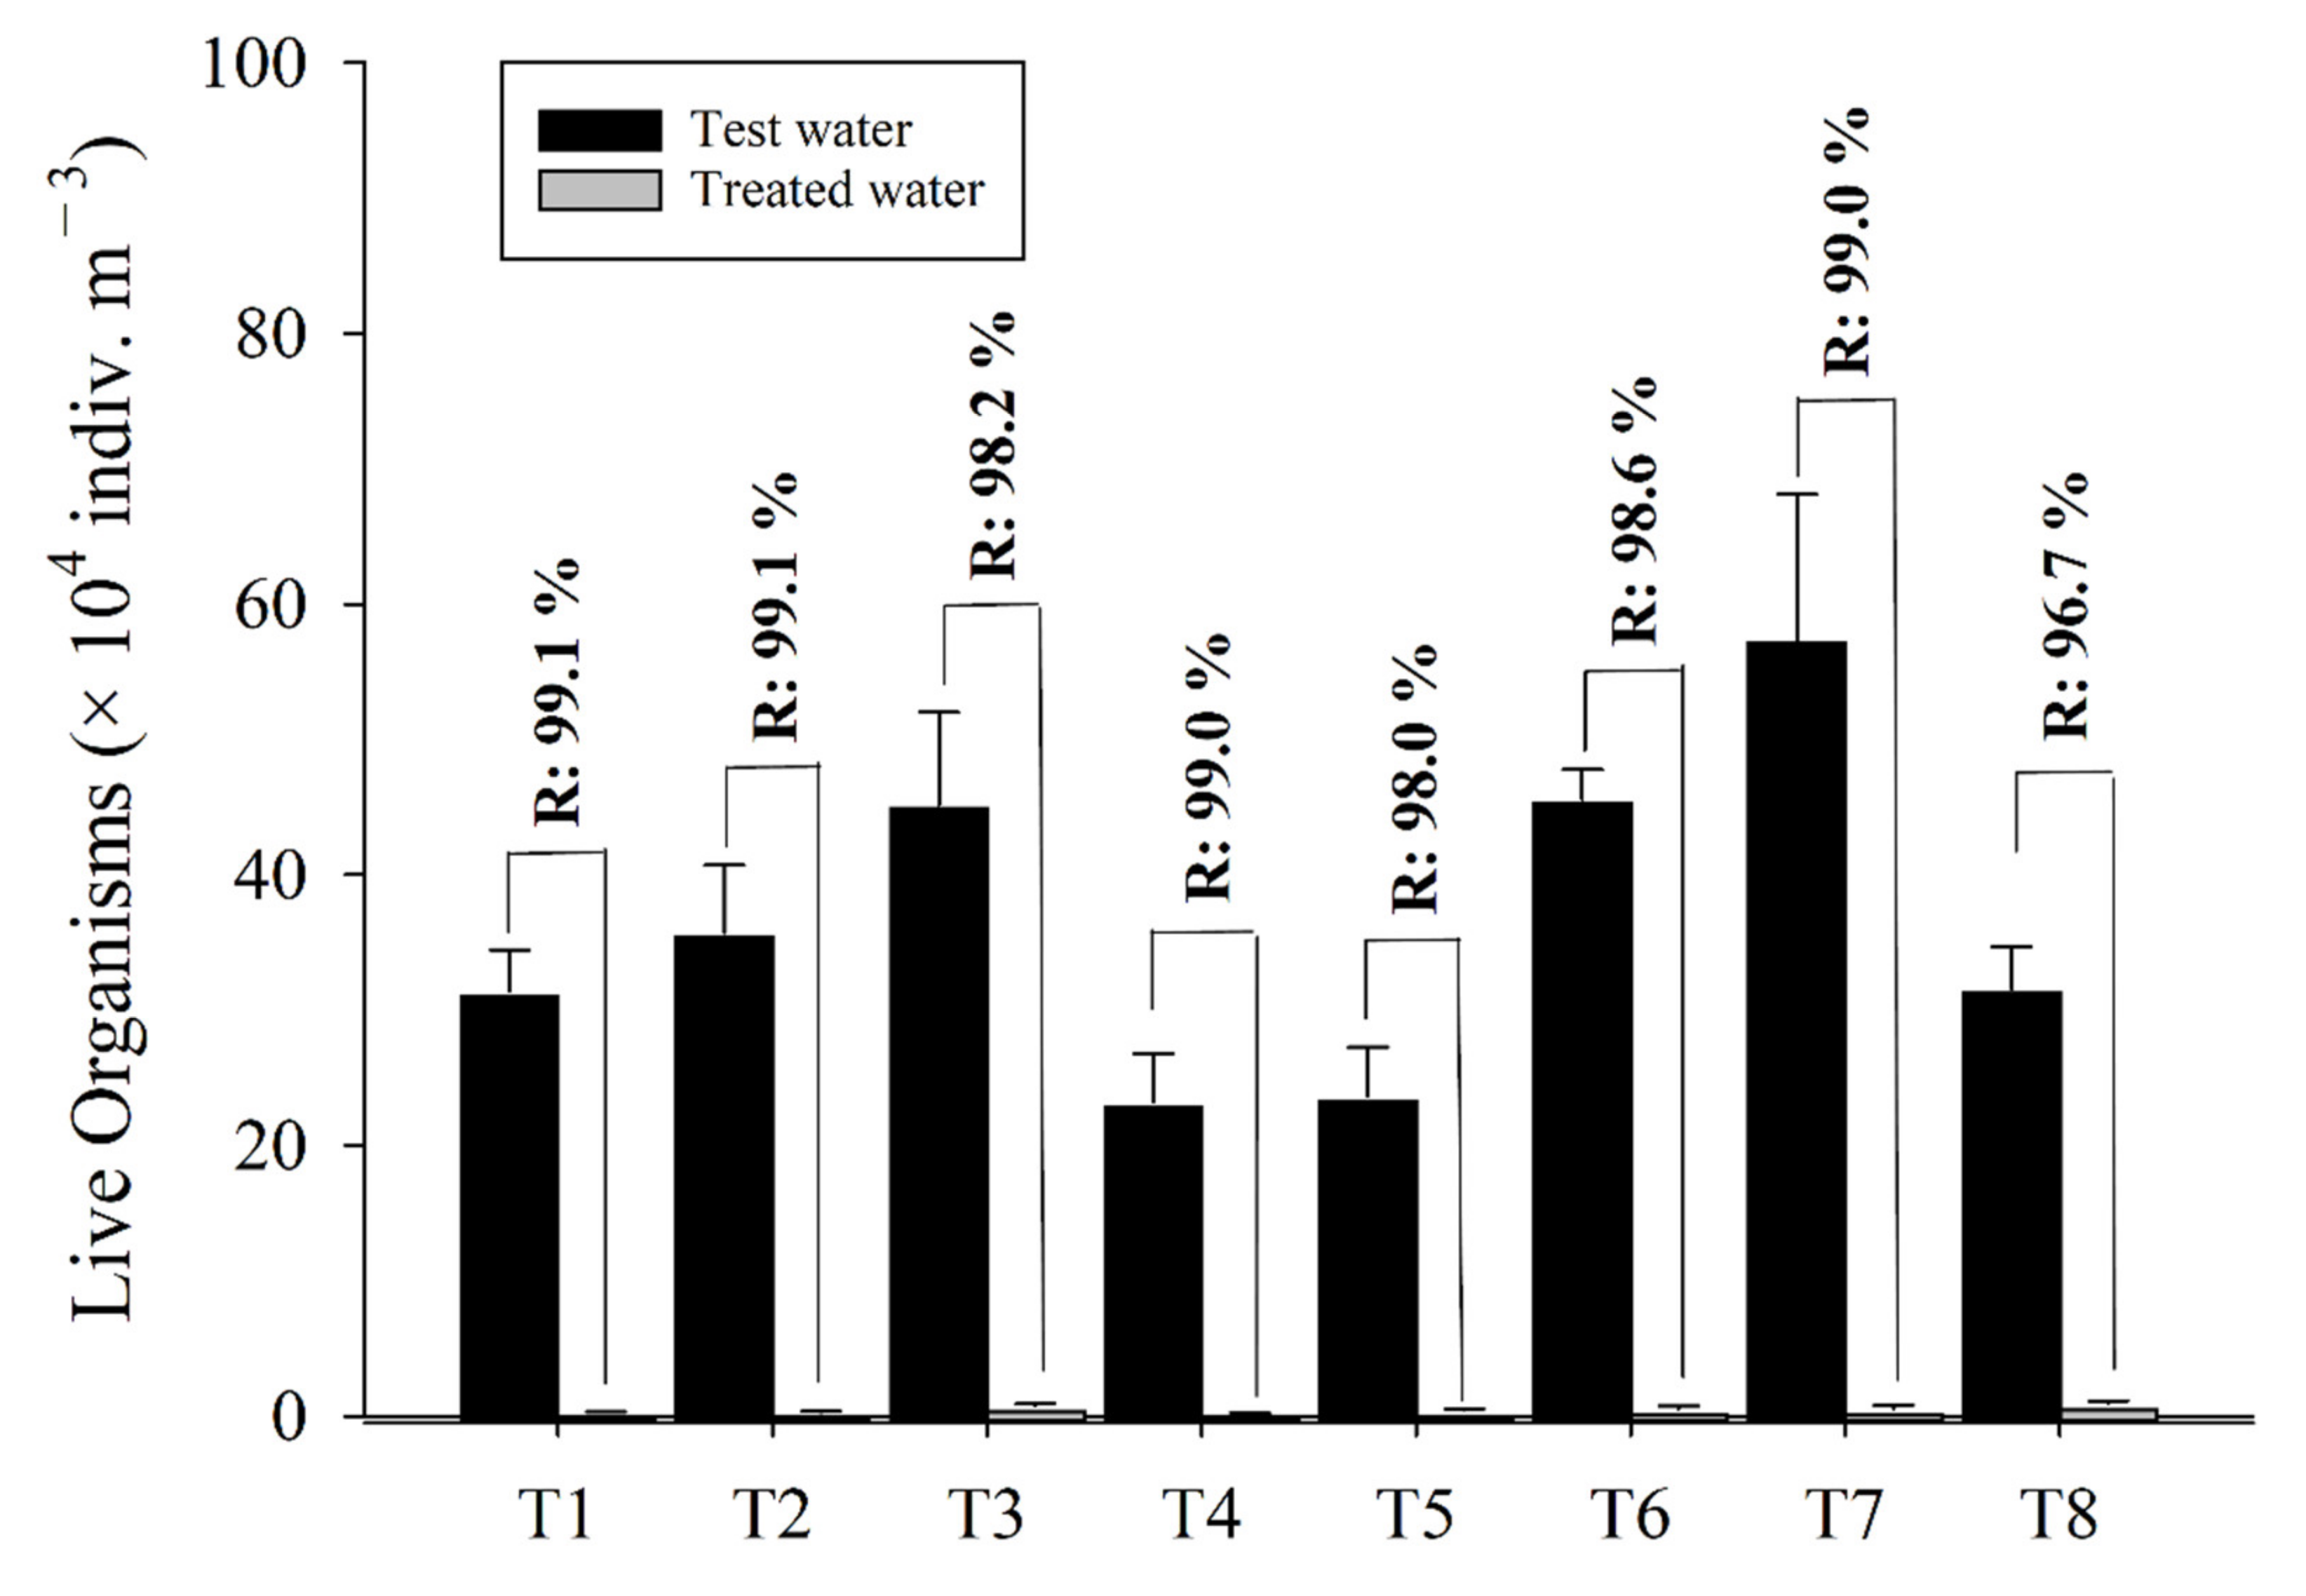
3.2.1. Pilot Test
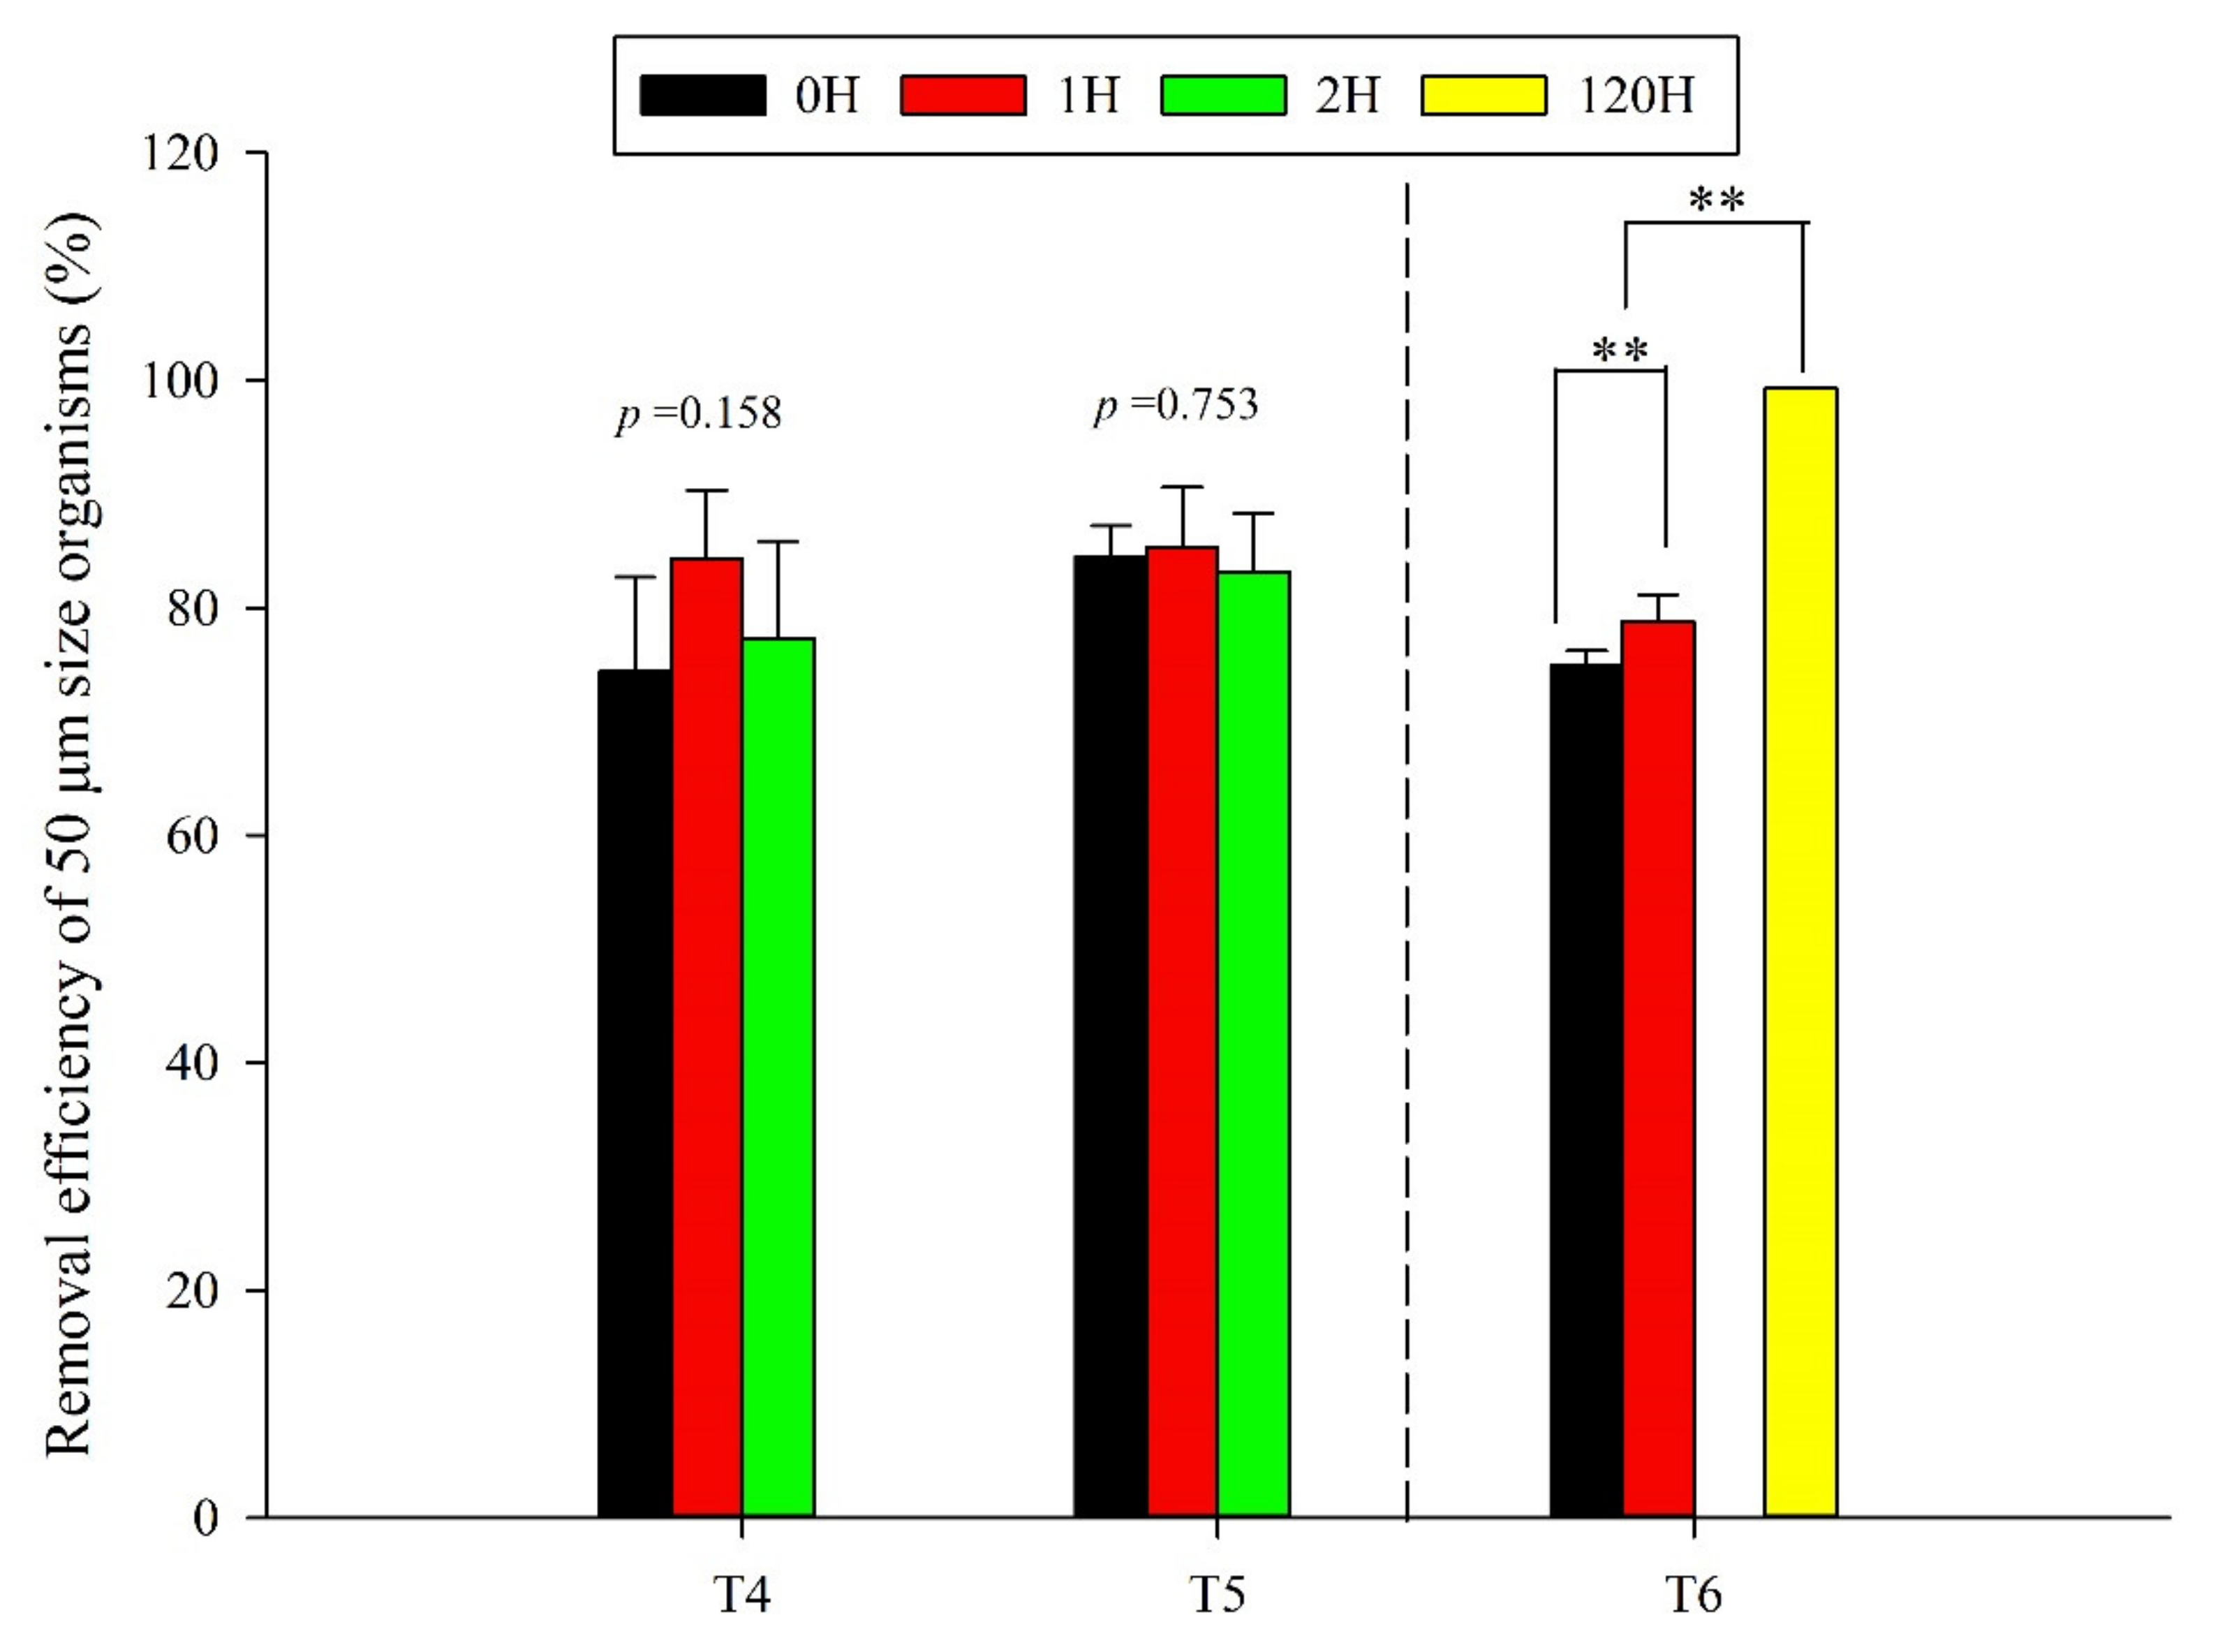
3.2.2. Full-Scale Test
4. Discussion
Author Contributions
Funding
Institutional Review Board Statement
Informed Consent Statement
Data Availability Statement
Acknowledgments
Conflicts of Interest
References
- Roy, S.; Parenteau, M.; Casas-Monroy, O.; Rochon, A. Coastal Ship Traffic: A Significant Introduction Vector for Potentially Harmful Dinoflagellates in Eastern Canada. Can. J. Fish. Aquat. Sci. 2012, 69, 627–644. [Google Scholar] [CrossRef]
- Hyun, B.; Baek, S.H.; Shin, K.; Choi, K.-H. Assessment of Phytoplankton Invasion Risks in the Ballast Water of International Ships in Different Growth Conditions. Aquat. Ecosyst. Health Manag. 2017, 20, 423–434. [Google Scholar] [CrossRef]
- Endresen, Ø.; Behrens, H.L.; Brynestad, S.; Andersen, A.B.; Skjong, R. Challenges in Global Ballast Water Management. Mar. Pollut. Bull. 2004, 48, 615–623. [Google Scholar] [CrossRef] [PubMed]
- Cha, H.-G.; Seo, M.-H.; Lee, H.-Y.; Lee, J.-H.; Lee, D.-S.; Shin, K.; Choi, K.-H. Enhancing the Efficacy of Electrolytic Chlorination for Ballast Water Treatment by Adding Carbon Dioxide. Mar. Pollut. Bull. 2015, 95, 315–323. [Google Scholar] [CrossRef] [PubMed]
- Kang, J.-H.; Hyun, B.-G.; Shin, K. Phytoplankton Viability in Ballast Water from International Commercial Ships Berthed at Ports in Korea. Mar. Pollut. Bull. 2010, 60, 230–237. [Google Scholar] [CrossRef] [PubMed]
- Takahashi, C.; Lourenço, N.; Lopes, T.; Rall, V.L.M.; Lopes, C. Ballast water: A Review of the Impact on the World Public Health. J. Venom. Anim. Toxins Incl. Trop. Dis. 2008, 14, 393–408. [Google Scholar] [CrossRef]
- Padilla, D.K.; Williams, S.L. Beyond Ballast Water: Aquarium and Ornamental Trades as Sources of Invasive Species in Aquatic Eco-Systems. Front. Ecol Env. 2004, 2, 131–138. [Google Scholar] [CrossRef]
- International Maritime Organization. International Convention for the Control and Management of Ship’s Ballast Water and Sediments-(BWM).aspx. 2004. Available online: http://www.imo.org/en/About/Conventions/ListOfConventions/Pages/International-Convention-for-the-Control-and-Management-of-Ships%27-Ballast-Water-and-Sediments- (accessed on 8 August 2020).
- IMO. Ballast Water Management Under the Ballast Water Management Convention. In Global Maritime Transport and Ballast Water Management; David, M., Gollasch, S., Eds.; Springer: Dordrecht, Neatherlands, 2015; Volume 8. [Google Scholar]
- International Maritime Organization. Guidance on Ballast Water Sampling and Analysis for Trial Use in Accordance with BWM Convention and Guidelines (G2). (BWM.2/Circ.42). 2013. Available online: https://docs.imo.org/Search.aspx?keywords=BWM.2%2FCirc.42 (accessed on 8 August 2020).
- Jang, P.-G.; Hyun, B.; Shin, K. Ballast Water Treatment Performance Evaluation under Real Changing Conditions. J. Mar. Sci. Eng. 2020, 8, 817. [Google Scholar] [CrossRef]
- Briski, E.; Linley, R.D.; Adams, J.; Bailey, S. Evaluating Efficacy of a Ballast Water Filtration System for Reducing Spread of Aquatic Species in Freshwater Ecosystems. Manag. Biol. Invasions 2014, 5, 245–253. [Google Scholar] [CrossRef] [Green Version]
- American Bureau of Shipping (ABS). 2019 Best Practices for Operations of Ballast Water Management Systems Report. Available online: https://ww2.eagle.org/en/Products-and-Services/environmental-performance/ballast-water-management/best-practices-bwm-report.html (accessed on 8 August 2020).
- Tsolaki, E.; Diamadopoulos, E. Technologies for Ballast Water Treatment: A Review. J. Chem. Technol. Biotechnol. 2010, 85, 19–32. [Google Scholar] [CrossRef]
- Riley, S.C.; Lemieux, E.J.; Robbins, S.H. Testing of Filter Technologies for Ballast Water Treatment. IEEE 2006, 3, 2511–2518. [Google Scholar] [CrossRef]
- Ramchander, K.; Hegde, M.; Antony, A.P.; Wang, L.; Leith, K.; Smith, A.; Karnik, R. Engineering and Characterization of Gymnosperm Sapwood toward Enabling the Design of Water Filtration Devices. Nat. Commun. 2021, 12, 1–17. [Google Scholar] [CrossRef] [PubMed]
- APHA, APHA, AWWA and WEF. Standard Methods for the Examination of Water and Wastewater, 22nd ed.; American Public Health Association: Washington, DC, USA, 2012. [Google Scholar]
- Salim, R.; Cooksey, B. The Effect of Centrifugation on the Suspended Particles of River Waters. Water Res. 1981, 15, 835–839. [Google Scholar] [CrossRef]
- Marine Environmental Protection Committee. Guidelines for Approval of Ballast Water Management Systems(G8) (MEPC58/23). 2008. Available online: https://docs.imo.org/Category.aspx?cid=47&session=58 (accessed on 8 August 2020).
- Fleming, J.M.; Coughlan, J. Preservation of Vitally Stained Zooplankton for Live/Dead Sorting. Estuaries 1978, 1, 135–137. [Google Scholar] [CrossRef]
- NSF International. Generic Protocol for the Verification of Ballast Water Treatment Technology. US EPA, Washington, DC, EPA/600/R-10/146. 2010. Available online: https://cfpub.epa.gov/si/si_public_record_Report.cfm?Lab=NRMRL&dirEntryId=230926&CFID=25387471&CFTOKEN=82327913&jsessionid=3830878cac2eed65ab65527d6e7047c54330 (accessed on 21 July 2021).
- Wright, D.A.; Dawson, R.; Orano-Dawson, C.E.; Moesel, S.M. A Test of the Efficacy of a Ballast Water Treatment System Aboard the Vessel Coral Princess. Mar. Technol. SNAME News 2007, 44, 57–67. [Google Scholar] [CrossRef]
- Stehouwer, P.P.; Fuhr, F.; Veldhuis, M. A novel Approach to Determine Ballast Water Vitality and Viability after Treatment, Emerging Ballast Water Management Systems. Proceedings of the IMO-WMU Research and Development Forum 2010, malmö, Sweden, 233–240. Available online: https://www.researchgate.net/profile/Newton-Pereira/publication/259148856_A_STUDY_OF_BALLAST_WATER_TREATMENT_APPLIED_ON_IRON_ORE_PORTS_IN_BRAZIL_USING_DISCRETE_SIMULATION/links/02e7e5275d2606f5f8000000/A-STUDY-OF-BALLAST-WATER-TREATMENT-APPLIED-ON-IRON-ORE-PORTS-IN-BRAZIL-USING-DISCRETE-SIMULATION.pdf#page=248 (accessed on 21 July 2021).


| Specification of Grinding Device | ||
|---|---|---|
| Test Name | Pilot Test | Full-Scale Test |
| Product Characteristic | ||
| Capacity | 5 m3 h−1 | 200 m3 h−1 |
| Design and Operation conditions | ||
| Design pressure | 8 bar | 10 bar |
| Design temperature | 80 °C | 110 °C |
| Suction pressure | Min. 0.5 bar | Min. 0.5 bar |
| Operating pressure | 0–4 bar | 0–2 bar |
| Operating speed | Max. 4000 rpm | Max. 1700 rpm |
| Tool and Housing materials | ||
| Tool materials (rotor and stator) | STS316Ti | STS316Ti |
| Housing materials | STS316 | STS316 |
| Stator support materials | STS316 | STS316 |
| Size (μm) | A2 Dust (% Less Than) | A4 Dust (% Less Than) |
|---|---|---|
| 0.97 | 4.5–5.5 | 0.74–0.83 |
| 1.38 | 8.0–9.5 | 1.8–2.1 |
| 2.75 | 21.3–23.3 | 5.5–6.3 |
| 5.5 | 39.5–42.5 | 11.5–12.5 |
| 11 | 57.0–59.5 | 21.0–23.0 |
| 22 | 73.5–76.0 | 36.0–38.5 |
| 44 | 89.5–91.5 | 58.0–60.0 |
| 88 | 97.9–98.9 | 85.0–86.5 |
| 124.5 | 99.0–100.0 | 93.0–94.0 |
| 176 | 100 | 97.2–98.2 |
| 248.9 | - | 99.0–100.0 |
| 352 | - | 100 |
| Test Type | Test Cycle | Flow Rate (m3 h−1) | Pressure (Mean ± SD) (kfg cm−2) | Operating Time (Minute) |
|---|---|---|---|---|
| Pilot (grinding test) | A2 | 4.93 | 0.97 (0.04) | 57 |
| A4 | 4.95 | 0.99 (0.04) | 58 | |
| Pilot | 1 | 5.13 | 1.02 (0.08) | 54 |
| 2 | 5.04 | 1.00 (0.00) | 53 | |
| 3 | 5.11 | 1.05 (0.05) | 55 | |
| 4 | 5.23 | 1.02 (0.06) | 53 | |
| 5 | 5.21 | 1.03 (0.05) | 54 | |
| 6 | 5.17 | 1.01 (0.05) | 56 | |
| 7 | 5.25 | 1.11 (0.04) | 54 | |
| 8 | 5.20 | 1.08 (0.04) | 57 | |
| Full scale | 1 | 198.6 | 1.49 | 28 |
| 2 | 201.3 | 1.44 | 31 | |
| 3 | 201.6 | 1.10 | 30 | |
| 4 | 200.6 | 1.39 | 30 | |
| 5 | 193.2 | 1.43 | 30 | |
| 6 | 196.6 | 1.57 | 30 |
| Dust Type | D20 | D50 | D90 | |||
|---|---|---|---|---|---|---|
| * TW | ** Tr | TW | Tr | TW | Tr | |
| A2 | 2.18 | 2.44 | 4.87 | 5.16 | 25.1 | 20.0 |
| A4 | 4.10 | 4.40 | 12.2 | 10.9 | 46.0 | 38.7 |
| Dust Type | Experiment | Particle Size (μm) | p-Value |
|---|---|---|---|
| A2 fine dust | Test water | <25 * | 0.36 |
| Treated water | |||
| Test water | ≥25–50 ** | + | |
| Treated water | |||
| A4 coarse Dust | Test water | <25 * | 0.35 |
| Treated water | |||
| Test water | ≥25–50 * | 0.09 | |
| Treated water | |||
| Test water | >50 * | ++ | |
| Treated water |
| Size (μm) | Organisms | Contribution Rate (%) | Removal Efficiency (%) |
|---|---|---|---|
| 50–70 | Copepoda nauplii, Bivalvia larvae | 22.1 | 87 |
| 70–100 | Copepodites, Oithona spp., Harpacticoida, Polychaeta larvae, Cirripedia larvae, Gastropoda larvae, Temora sylifera | 57 | 94 |
| >100 | Copepoda nauplii, Bivalvia larvae | 20.8 | 100 |
| Taxon | Before Treatment | After Treatment | Type |
|---|---|---|---|
| Copepoda | 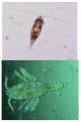 | 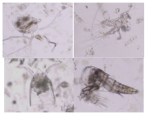 | Bodies cut |
| Cirripedia larvae |  |  | Intact bodies |
| Copepoda nauplii |  |  | |
| Bivalvia larvae |  |  |
| Size (μm) | Organisms | Contribution Rate (%) | Removal Efficiency (%) |
|---|---|---|---|
| 50–70 | Copepoda nauplii, Decapoda larvae, Bivalvia larvae | 35.2 | 85 |
| 70–100 | Polychaeta larvae, Copepodites, Oithona spp., Rotifera, Gastropoda larvae, Cirripedia larvae, Calanus sinicus | 49.5 | 87 |
| >100 | Paracalanus aculeatus, Paracalanus parvus, Eucalanus sp., Acartia steueri, Acartia omorii, Oikopleura spp., Monstrilloida, Evadne tergestina | 15.4 | 100 |
Publisher’s Note: MDPI stays neutral with regard to jurisdictional claims in published maps and institutional affiliations. |
© 2021 by the authors. Licensee MDPI, Basel, Switzerland. This article is an open access article distributed under the terms and conditions of the Creative Commons Attribution (CC BY) license (https://creativecommons.org/licenses/by/4.0/).
Share and Cite
Hyun, B.; Cha, H.-G.; An, Y.-K.; Park, Y.-S.; Jang, M.-C.; Jang, P.-G.; Shin, K. Potential Applications of a Novel Ballast Water Pretreatment Device: Grinding Device. J. Mar. Sci. Eng. 2021, 9, 1213. https://doi.org/10.3390/jmse9111213
Hyun B, Cha H-G, An Y-K, Park Y-S, Jang M-C, Jang P-G, Shin K. Potential Applications of a Novel Ballast Water Pretreatment Device: Grinding Device. Journal of Marine Science and Engineering. 2021; 9(11):1213. https://doi.org/10.3390/jmse9111213
Chicago/Turabian StyleHyun, Bonggil, Hyung-Gon Cha, Yeong-Kyu An, Yong-Seok Park, Min-Chul Jang, Pung-Guk Jang, and Kyoungsoon Shin. 2021. "Potential Applications of a Novel Ballast Water Pretreatment Device: Grinding Device" Journal of Marine Science and Engineering 9, no. 11: 1213. https://doi.org/10.3390/jmse9111213
APA StyleHyun, B., Cha, H.-G., An, Y.-K., Park, Y.-S., Jang, M.-C., Jang, P.-G., & Shin, K. (2021). Potential Applications of a Novel Ballast Water Pretreatment Device: Grinding Device. Journal of Marine Science and Engineering, 9(11), 1213. https://doi.org/10.3390/jmse9111213