Article

Density and Abundance Estimation of Amazonian River Dolphins: Understanding Population Size Variability

by
Mariana Paschoalini
1,2,3,*,
Fernando Trujillo
4,
Miriam Marmontel
3,
Federico Mosquera-Guerra
4,5,6,
Renan Lopes Paitach
7,
Heloise Pavanato Julião
3,8,
Gabriel Melo Alves dos Santos
3,9,
Paul André Van Damme
10,
André Giovanni de Almeida Coelho
3,
Mariana Escobar Wilson White
11 and
Alexandre Novaes Zerbini
1,12,13,14
1
Aqualie Institute, Avenida Doutor Paulo Japiassu Coelho, 714 Salas 201 e 202, Juiz de Fora 36033-310, Brazil
2
Laboratory of Ecological Behavior and Bioacoustics, Federal University of Juiz de Fora, Rua José Lorenço Kelmer s/n, Juiz de Fora 36036-900, Brazil
3
Research Group on Amazonian Aquatic Mammals, Mamirauá Institute for Sustainable Development, Estrada do Bexiga 2584, Tefé 69553-225, Brazil
4
Fundación Omacha, Carrera 20 No. 133-32, Bogotá 111211, Colombia
5
Laboratorio de Ecología Funcional (LEF), Departamento de Biología Facultad de Ciencias, Pontificia Universidad Javeriana, Cra. 7 No. 40-62, Bogotá 110231, Colombia
6
Grupo de Ecología del Paisaje y Modelación de Ecosistemas (ECOLMOD), Departamento de Biología, Facultad de Ciencias, Universidad Nacional de Colombia, Carrera, Bogotá 111321, Colombia
7
Laboratory of Ecology and Conservation of Marine and Coastal Tetrapods, University of the Region of Joinville, P.O. Box 110, São Francisco do Sul 89240-000, Brazil
8
Department of Mathematics & Statistics, University of Otago, 730 Cumberland Str., Dunedin 9016, New Zealand
9
Biology and Conservation of Amazonian Aquatic Mammals (BioMA), Federal Rural University of the Amazon (UFRA), Av. Tancredo Neves, 2501, Terra Firme, Belém 66077-830, Brazil
10
Faunagua, Sacaba-Cochabamba 31001, Bolivia
11
Museo de Historia Natural Noel Kempff Mercado, Avenida Irala 565, Santa Cruz 2489, Bolivia
12
Cooperative Institute for Climate, Ocean and Ecosystem Studies, University of Washington, Seattle, WA 98195, USA
13
Marine Mammal Laboratory, Alaska Fisheries Science Center, National Oceanic and Atmospheric Administration, Seattle, WA 98115-6349, USA
14
Marine Ecology and Telemetry Research, Seabeck, WA 98380, USA
*
Author to whom correspondence should be addressed.
J. Mar. Sci. Eng. 2021, 9(11), 1184; https://doi.org/10.3390/jmse9111184
Submission received: 15 August 2021 / Revised: 1 October 2021 / Accepted: 9 October 2021 / Published: 27 October 2021
(This article belongs to the Special Issue Cetaceans Ecology: Diversity, Abundance and Distribution)

Abstract

:
The dolphins Inia geoffrensis—boto and Sotalia fluviatilis—tucuxi are threatened cetaceans inhabiting river ecosystems in South America; population numbers are still lacking for many areas. This paper provides density and abundance estimations of boto and tucuxi in 15 rivers sampled during the past nine years as part of a multinational research alliance. Visual boat-survey data collection protocols and analyses have been developed since 2012 (based on Distance Sampling methods) and recently reviewed (2019) to improve robustness and comparability. Differences across the sampled rivers and the analyzed river basins (Amazon and Orinoco) pointed to a density/population size gradient with lower densities and abundances observed in the Orinoco basin (0.9–1.5 ind./km²), passing through the eastern Amazon basin (2–5 ind./km²), and the largest numbers found at the central Brazilian Amazon (lower Purus River—2012 (14.5 boto/km², N = 7672; 17.1 tucuxi/km², N = 9238)). However, in other parts of the central Amazon, the density of dolphins was smaller than expected for high productive whitewater rivers (1–1.7 ind./km² in the Japurá and Solimões rivers). We attributed these differences to specific features of the basin (e.g., hydro-geomorphology) as well as to the cumulative effects of anthropogenic activities.

1. Introduction

The Inia geoffrensis, commonly known as boto, and the tucuxi Sotalia fluviatilis are freshwater cetaceans inhabiting complex ecosystems throughout their range: the major neotropical rivers of the Amazon, Orinoco, and Tocantins-Araguaia basins in six countries (Brazil, Bolivia, Colombia, Ecuador, Peru, and Venezuela) [1,2,3,4,5,6]. These rivers have broad heterogeneity across a continuum of spatial scales that range from microhabitats to landscapes [7]. At the local level, small forest and savanna streams often show longitudinal sequences of pool and riffle habitats with a variety of substrates, depths (i.e., 11–15 m at the vertical level and hundreds of kilometers in the horizontal plane of a river), and flow speeds [8]. In the lowlands of the Amazon and Orinoco basins, floodplains typically have a patchwork of densely vegetated and open water habitats creating very dynamic micro- and macro-habitats [9,10]. Additionally, variations in the water level influence the availability of aquatic habitats and the levels of dissolved oxygen, resulting in important seasonal changes in productivity and biodiversity [11]. This heterogeneity results in constantly changing distribution patterns of prey and, consequently, of river dolphins across this complex mosaic of aquatic habitats [12,13,14].
Rivers are drivers of biodiversity and play a key role in the distributional patterns of aquatic and terrestrial fauna [15,16]. Hydrology is a predominant driver of ecological structure and function of aquatic ecosystems [17]. Therefore, providing adequate flows to support aquatic life or environmental flow is a top management priority in stream systems. Sampling for information on the richness and abundance of species that inhabit these ever-changing complex ecosystems requires careful consideration of the unique characteristics of these environments and the multiple factors that affect animal distribution, habitat use, and population parameters [17,18]. Establishing a flow–ecology relationship is complicated by several sources of correlated bias: flow regime, environmental features, ecological assemblages, and human interference.
Local or regional trends in the distribution and abundance of a species are expected to occur in highly variable ecosystems, and they can be better understood if sampling methods consider the stratification of the study site to properly address environmental variability [19]. In the case of river dolphins, methods for estimating density and population size have stratified the river into habitat types, where perceived gradients in dense-specific habitats exist [20,21]. However, seasonal variations of habitats along river courses due to the natural hydro-geomorphological evolution of a river basin [22,23] or due to human interference (e.g., dams for irrigation or hydroelectric power production, mining processes, intense fishing exploitation, cattle raising, and climate change) can change river landscapes [24,25,26,27,28] and cause shifts in patterns of dolphin distribution.
River dolphins as small cetaceans that inhabit ecosystems impacted by several human activities are considered to be at a high level of threat. The IUCN Red List of Threatened Species currently classifies all river dolphin species as either Endangered (EN) or Critically Endangered (CR) [29,30,31,32,33,34,35]. The baiji (Lipotes vexillifer) is thought to be probably Extinct (EX) in the wild due to the same conditions that still-living river dolphins face. Bycatch, direct, and intentional catches, contamination by mercury, habitat and population fragmentation by water infrastructure projects (mainly dams), water chemical pollution, acoustic pollution, intense boat traffic, poorly managed tourism, and decline of prey diversity and abundances result in substantial short-term effects with limited knowledge of impact scales at the population level [5,25,27,28,36,37].
The importance of population parameters such as the density and population size of boto and tucuxi have already been addressed by several authors as crucial information to understand their ecology, as well as the effect of anthropogenic activities on their survival [1,2,3,4,5,12,13,20,21,25,27,28,30,31]. The aggregation of boto and tucuxi in specific habitats in the river system, their seasonal movements following water level variability and prey migration, and also a preliminary investigation of population size differences across river basins were examined by such studies. However, these studies are not broad-scaled, except for those in which survey methods for abundance estimations were standardized, covering regions in the Amazon and Orinoco basins [21].
Given the complex dynamics of the ecosystems inhabited by river dolphins (boto and tucuxi) and their vulnerability to widespread threats, it is desirable to expand comprehensive estimates that take into account the specificities of each river, considering them as sample units. Information about the density and distribution of these species is necessary for guiding management and identifying opportunities for determining the ecological needs of the species and human uses of dolphin distribution range [38]. This study aimed to provide new population estimates for boto and tucuxi in 15 different rivers in the Amazon and Orinoco basins under the Program of Abundance Estimation of River Dolphins in South America (PAERDSA). The PAERDSA has been surveying rivers throughout the ranges of boto and tucuxi since 2006, compiling cross-border efforts on river dolphin studies in the six countries in which they occur. In addition to the new abundance estimations, we also provide a discussion on the distribution of the population size diversity in the Amazon and Orinoco basins, in light of the differences in the geomorphology and hydrology of the study areas.

2. Materials and Methods
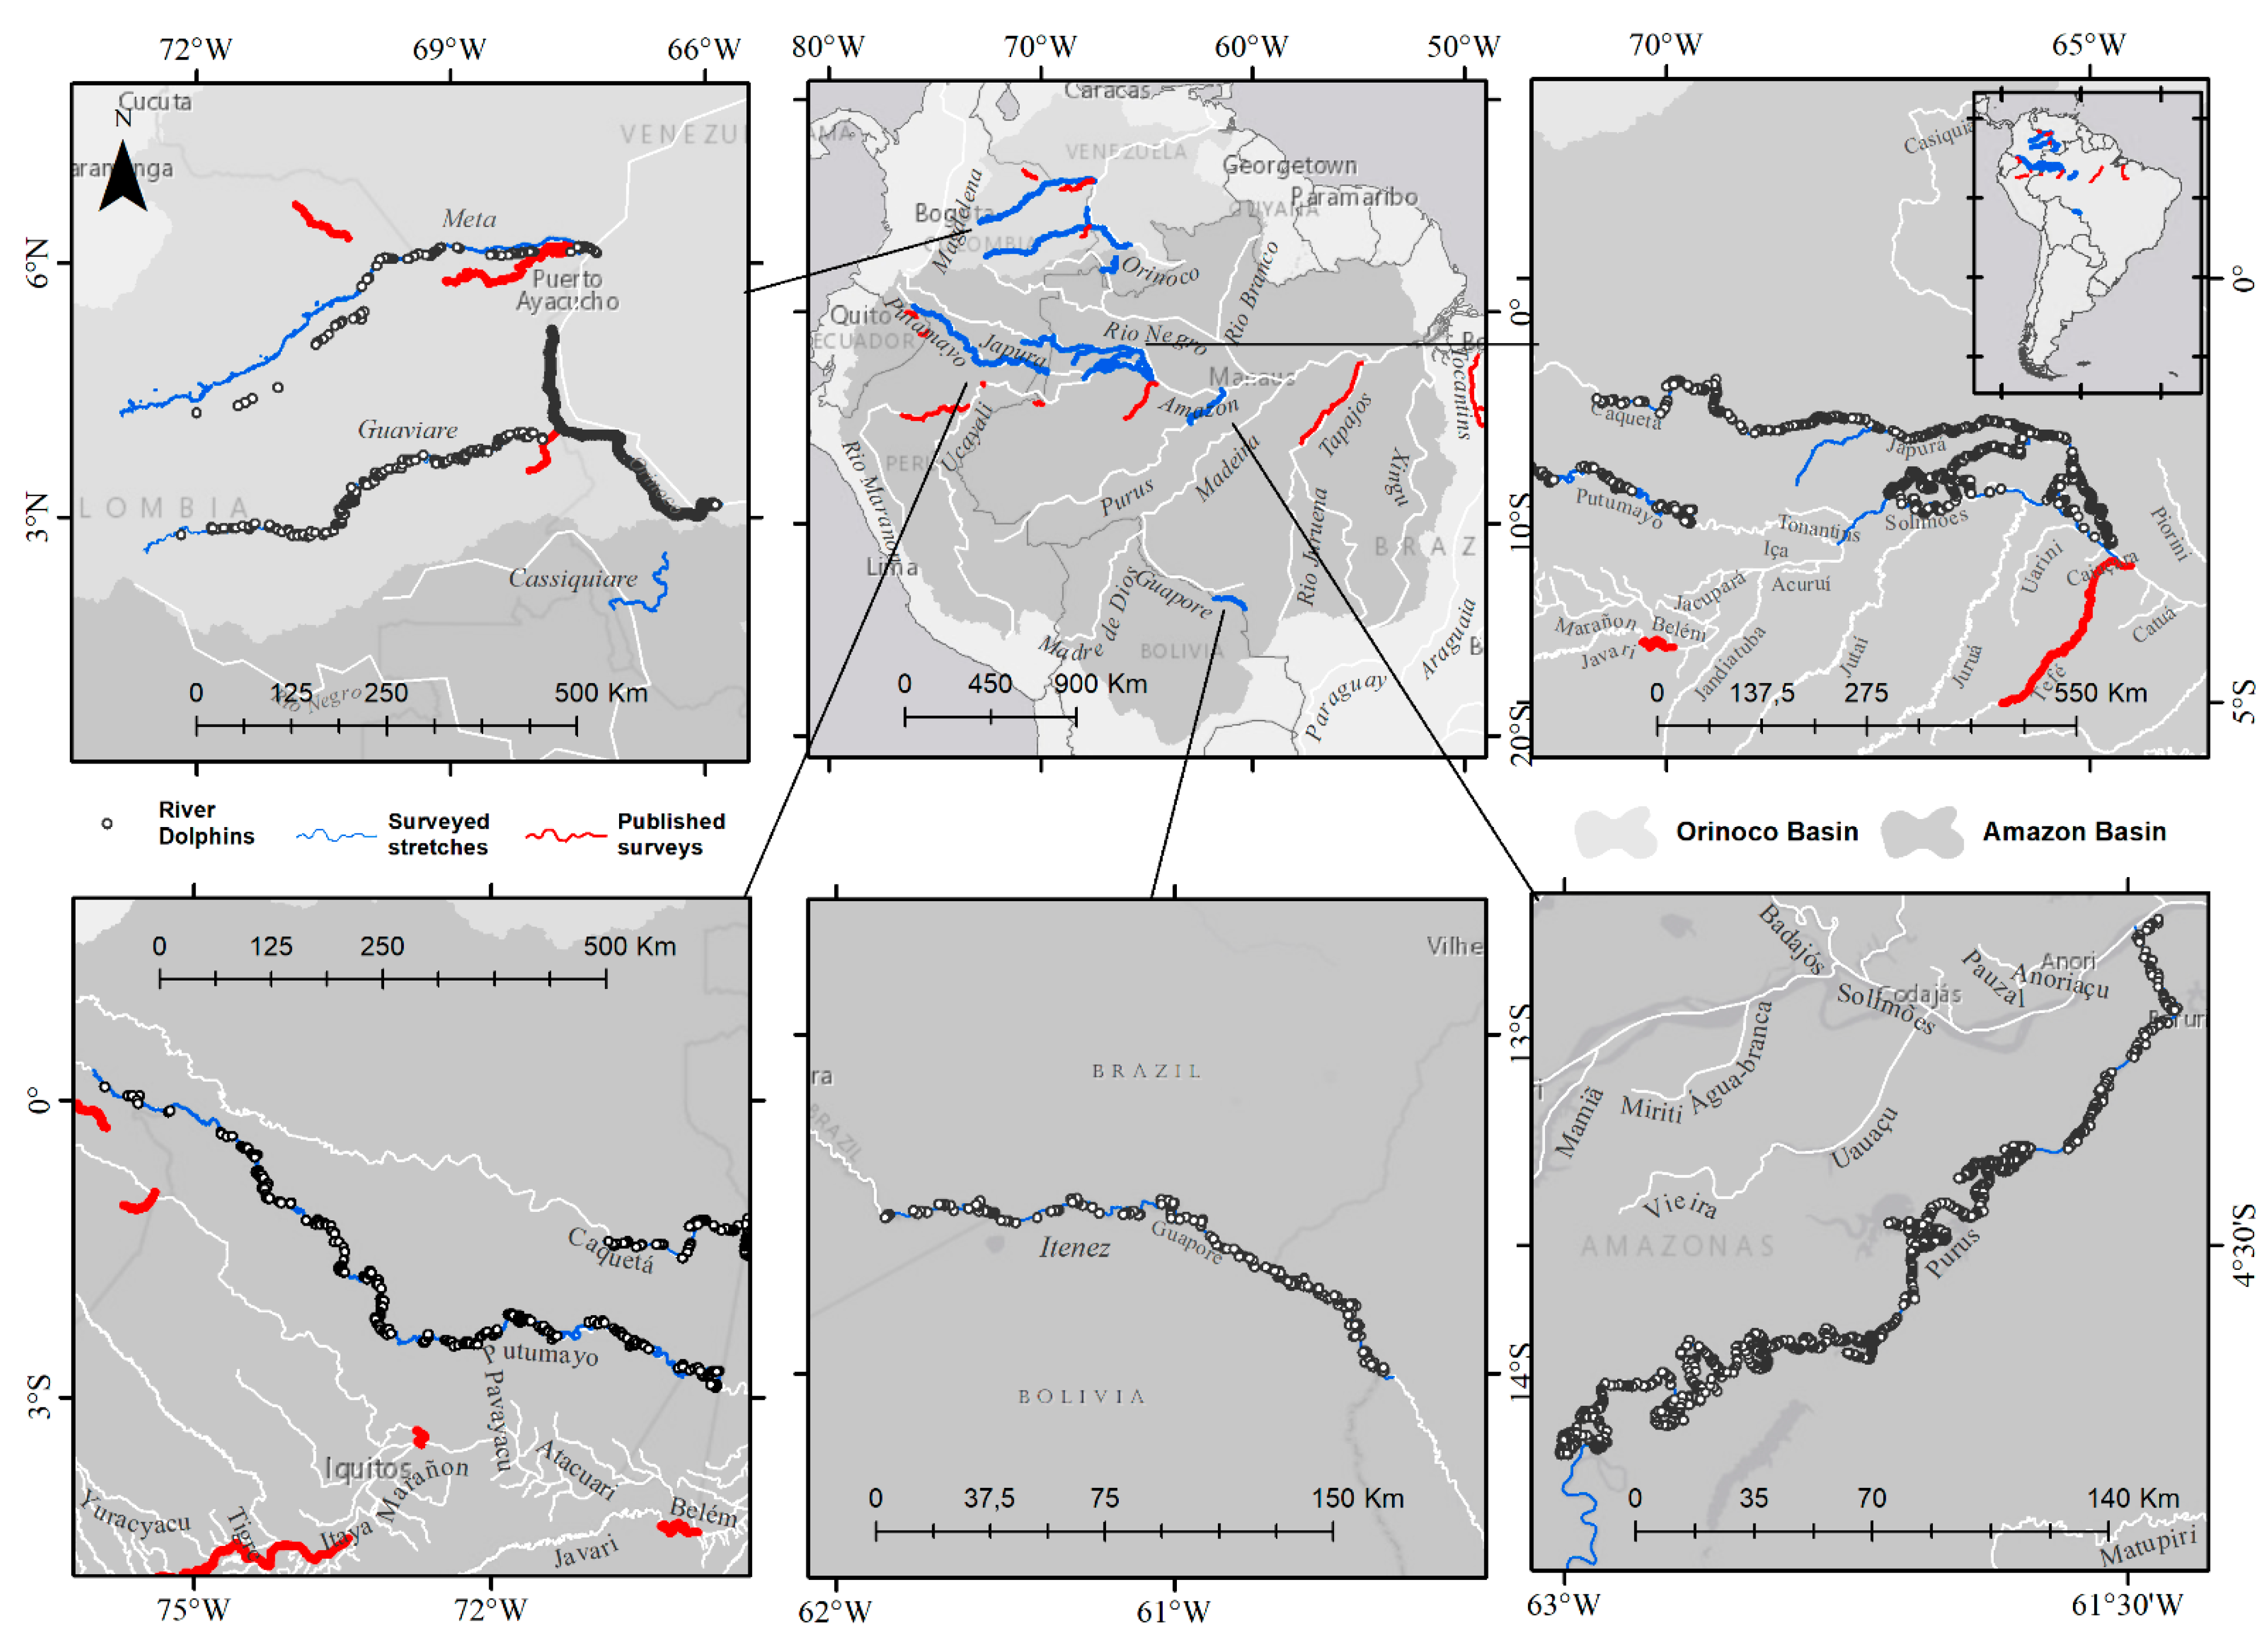
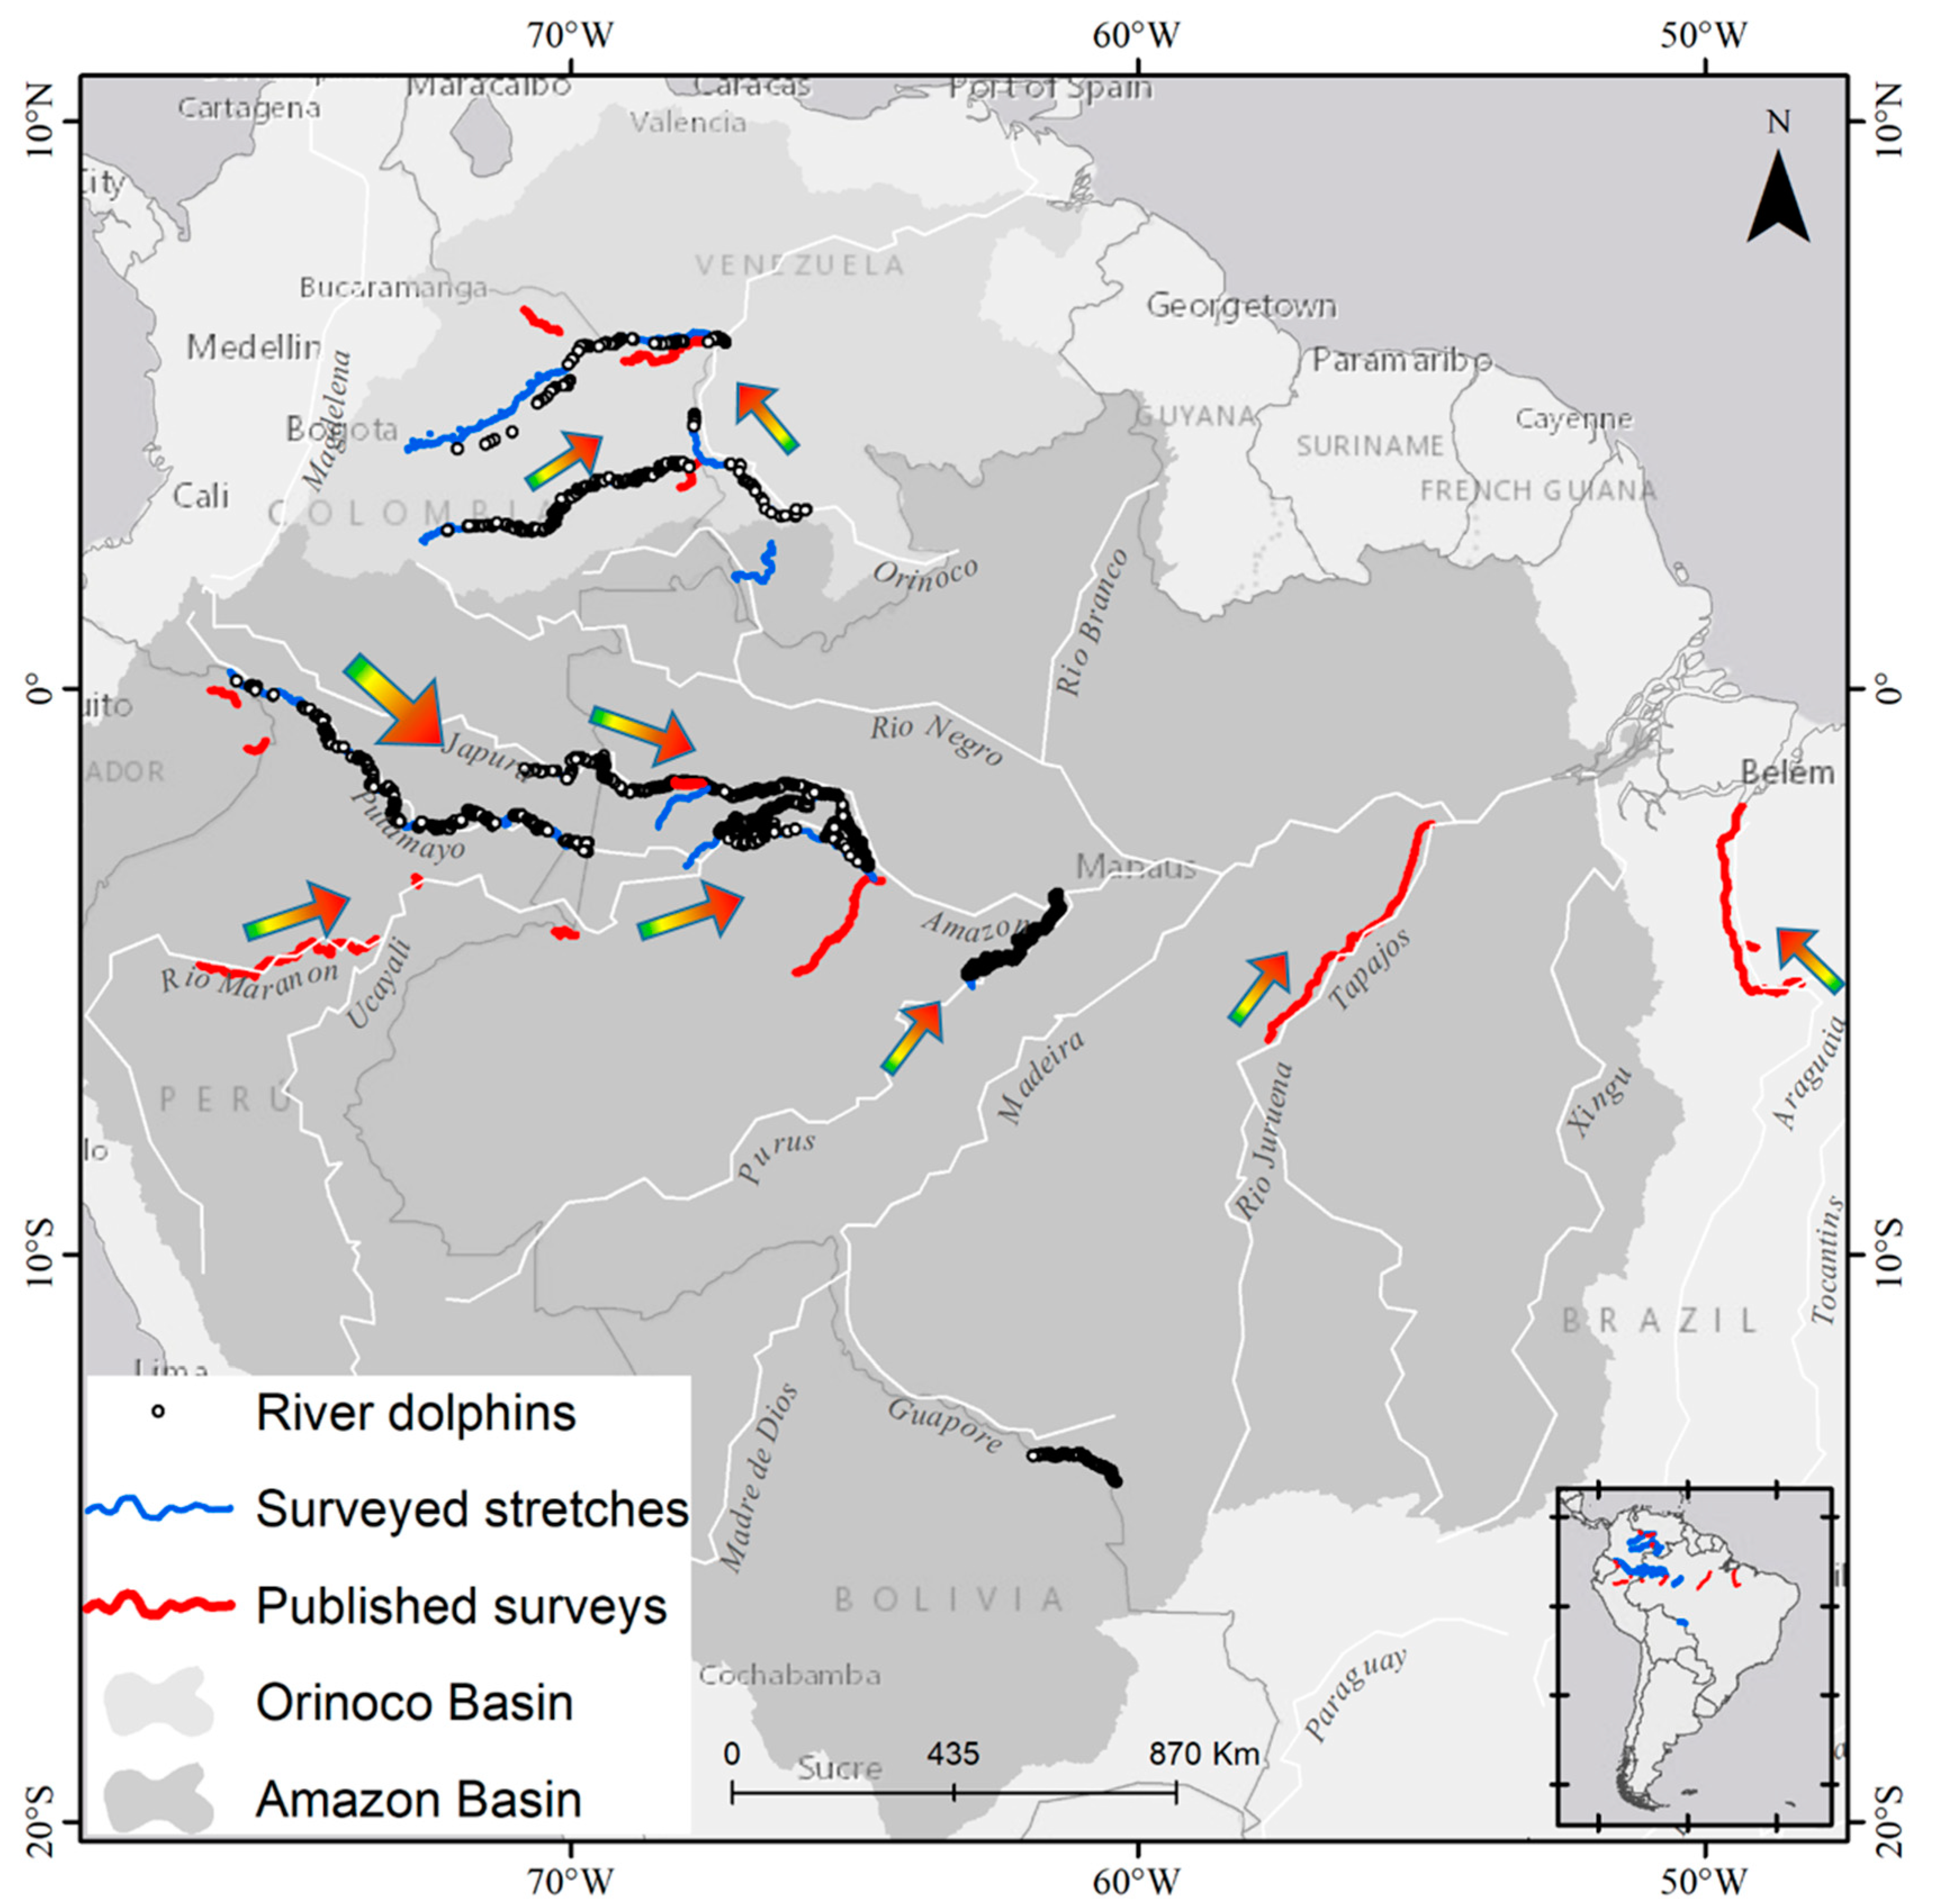
2.1. Study Area

The Amazon is the largest river in the world in terms of discharge, and the Orinoco is considered the third largest [8,39,40]. Both river systems have similar unit discharges (discharge/drainage area) and comparable sediment loads [41]. High run-offs occur from the Guyana Shield region that dominate the flow in the Orinoco River and from the Negro River in the Amazon basin [42]. The Amazon receives high discharges from Andean rivers such as the Madeira, Napo, Purus, Putumayo-Içá, and Caquetá-Japurá. The Andean mountains contribute up to 90% of the sediment load of both river systems [41,43,44]. The remaining discharge and sediment load in the Amazon basin originate from clear water rivers draining the Brazilian Shield. Both the Amazon and Orinoco rivers have extensive floodplains [45,46], but in terms of drainage areas, the Amazonian floodplains are more extensive.

2.2. Data Collection

Sampling for abundance estimates of boto and tucuxi was conducted over 8668 km of rivers across the Amazon and Orinoco basins covering 15 rivers (Figure 1). The total area sampled corresponds to more than 11,000 km2 of water surface (Table 1). Visual boat-based surveys took place during the rising and receding water seasons. These seasons were chosen to standardize the water transition periods, when most parts of the habitat types are available for the dolphins’ use [21]. The sampling protocol followed a methodology used by Gómez-Salazar et al. [21], using a combination of transects running parallel (200 m strip-width transect) and cross-channel (line transect) in a zigzag pattern at an average speed of 10 km/h (see [21] for more details).
Double-decker boats (on average 7 m high and 12 m long) were used as observation platforms in all surveys. A team of (at least) nine people were involved in the search for river dolphins, three at the bow (Platform 1) looking forward, three at the stern (Platform 2) looking backwards, and three off-effort at-rest observers. On each platform, the team alternated across three positions: portboard, data recorder, and starboard rotating every hour between platforms by replacing an active observer by an observer who had rested (see [28] for more details). The observations at each platform were assumed to be independent, considering a “one-way” configuration (i.e., the observers at the stern platform were unaware of detections made by those at the bow) to enable corrections of missed sightings and calculation of detection probability on the trackline (g(0)) using capture–recapture methods [21,47]. A sighting event from the stern platform was classified as either a resighting or a new sighting, relative to detections made by the bow platform, based on species identifications and similarities in group sizes, radial angles, and distances at first detection.
Efforts were conducted under good visibility and calm conditions (river state relative to Beaufort scale 0–2, low glare and no rain). For each sighting, the observers reported species, group size, presence of calves, radial distances between the sighting and the vessel (measured by the naked eye), the radial angle using an angle board for the bearings, and the distances from the dolphin groups to the margin of the open river, habitat type (main river, tributary, confluence, lake, channel, and island—as described in [21]), associated margin (when in strip transects), and overall sightability (low, moderate, good, or optimal).

2.3. Analysis

Densities and abundances of boto and tucuxi were estimated for all rivers separately following a stratified design (habitat types as proposed by [21]). Data analyses were performed using the open-source statistical software R (version 3.4.3, [48]).
Cross-channel (line transects) were analyzed using the packages Distance [49] and mrds [50] following distance sampling (DS) methods [51] to fit the detection functions, estimate detection probabilities, and densities and abundances for the center of the rivers. This analysis enabled the survey-specific detection function for those rivers (main rivers) where line transects were performed instead of using the general detection function provided in [21] when the number of sightings was greater than 30 groups [52]. Exploratory analyses were performed to assess appropriate truncation distances and to evaluate whether binning the data into pre-specified distance intervals would improve the fit of detection probability models for each river. Conventional distance sampling (CDS) [51] was used to test for half-normal and hazard rate models as key functions. Multiple covariate distance sampling (MCDS) [53] was used to account for the effect of covariates using the best fitted model. Proposed covariates included group size (gs), platform (pt), species (sp), and sightability (sg), and were each considered one at a time. Model selection was performed using the Akaike’s information criterion (AIC) [51].
Density in line transect data was estimated based in the Horvitz–Thompson estimator [54] for each species as follows:
D ^ = E ( s ) 2 w i L i   j = 1 n 1 g ( x , z )  
where E(s) is the expected group size, w is the maximum width by stratum, L is the transect length by stratum, and n is the number of detected groups. In MCDS, the detection function is expressed by g(x, z) and represents the probability of detecting an object given its distance x from the line with covariates z [53,55].
Parallel (strip) transects (200 m strip-width) were used to survey narrow channels and regions where typical distance sampling survey designs could not be implemented. Data from parallel transects were also analyzed considering the habitat stratification (main river, tributary, channel, confluence, lake, and island) for each river, following methods by [21]. Density in these sampling lines was estimated as follows:
D i = E i   [ n 0 50 P 2 + n 50 100 P 1 + n 100 150 P 1 + n 150 200 P 2 ] W L i g ( 0 ) ,   for   i = 1 , , n
where D i is the estimated density in the habitat type i, E i is the estimated group size for the population in habitat type i, L i is the total length of the parallel transects conducted in habitat i, W is the strip width (200 m), and g(0) is estimated in line transect analysis as g ( 0 ) = ( 1 q 2 ) where q is the equal probability of missing a group of dolphins in the bow and stern platform assuming independent sightings, P1 and P2 are the correction factors for undetected clusters of dolphins at every 50 m band of the strip width regarding distance from the trackline (investigated by [21] and recently improved by [52]) (Pk parameters for I. geoffrensis as P1 = 0.960 and P2 = 0.630 (shape = 0.37 [SE = 0.12], scale = −2.61 [SE = 0.42]) and for S. fluviatilis as P1 = 0.998 and P2 = 0.893 (shape = 0.99 [SE = 0.15], scale = −2.24 [SE = 0.41])), and n is the number of habitats surveyed.
The overall density (D) of both species in the entire study area of each river was calculated as the weighted mean obtained by dividing the estimated abundance (sum of the abundance for each habitat type) by the area in square kilometers. Variances were obtained following [21] methods, and the overall CV was calculated as follows:
CV =   ( S E i 2 )   D i
where S E i is the standard error of the density at habitat i.
Overall abundances in each river for each species were obtained by the sum of the estimated abundances ( D i × A i ) in each habitat type (i) through:
N = i = 1 n D i A i ,   for   i = 1 , , n
where n is the number of habitats surveyed and A i corresponds to the study area in km² in the habitat type i, which was calculated using satellite images obtained as close as possible to the time of survey implementation using the open access imagery repository from the Sentinel Program of the European Space Agency (ESA).
Data reported in this paper focused on overall densities and abundances for each river instead of habitat-specific densities, because the objective here was to observe variability at a basin scale. Nevertheless, to assess the importance of habitat-specific density (already described in [21]) and to support additional discussion, we present the survey-specific parameters (density and abundance) by habitat for each of the rivers sampled in the Supplementary Material Table S1. The detection probability curves and models selected for those rivers where line transects were performed (Purus, Guaviare, Putumayo, Japurá-Caquetá-Solimões, RDSM, and Meta) are available in Figures S1–S6 and in Table S2 respectively, also in the Supplementary Material.

3. Results

The highest densities and abundances for both species of river dolphins were found in the lower Purus River (Central Brazilian Amazon), 14.5 boto/km² N = 7672 (CV = 0.37), and 17.14 tucuxi/km² N = 9238 (CV = 0.49) (Table 2). Densities in the Auati-Paranã channel (Central Brazilian Amazon) were the second highest with 5–6 ind./km² accounting for both species. Similar densities were estimated for boto in the Iténez River (Brazilian/Bolivian border) with the lower abundances estimated (less than 210 animals in more than 400 km of river), where no tucuxis are found. In the Putumayo (upper Amazon basin), Guaviare (ecotone between Amazon rainforest and Orinoco savannas), Japurá River, and RDSM (Central Brazilian Amazon), densities varied from 2 to 3.5 ind./km² for both species, except for the Putumayo River where densities of tucuxi were lower (0.49 ind./km², CV = 0.95), as well as abundances (N = 546). The Orinoco River and its tributary Meta had the lowest densities of boto (Table 2) among all of the rivers surveyed.
Relatively high CVs (e.g., CVs ranged from 1.34 to 1.38) were estimated for some regions in the Cassiquiare channel (Orinoco River), Solimões River, and Juami-Japurá rivers, suggesting some of these estimates are not as reliable as those with CVs less than 0.4.
Figure 2 shows the tendency of finding the largest populations of river dolphins from the Eastern Amazon to the Central Amazon basin and at a river scale from upriver (headwaters) to the middle parts of the river’s mouth, taking into account the distribution of sightings and the calculated population parameters (density and abundance).
Survey-specific detection probabilities at zero distance from the trackline (g(0)) varied by species and across rivers (Table 3). The tucuxi had higher g(0) values than the boto in all rivers where estimates for both species were computed. The Japurá (Caquetá) river and its tributaries, the Auati-Paranã channel and Solimões River, were sampled during the same survey; thus, a single g(0) was calculated. For rivers where the numbers of sightings in line transects were insufficient for the proper calculation of g(0) (n < 30) or when only strip transects were conducted, a global g(0) was applied considering all data available from the other rivers sampled [21,52]: boto g(0) = 0.81 (CV = 0.05) and tucuxi g(0) = 0.98 (CV = 0.02).

4. Discussion

4.1. Density and Population Size

In this research, we pointed to differences in density and abundance across rivers and basins sampled throughout the range of Amazonian river dolphins. These differences are believed to be linked to unique features of each basin and the hydro-geomorphological characteristics of each river. They are also likely related to human threats such as the level of human-induced habitat modification, overfishing, pollution, direct catches that might affect prey availability and, consequently, dolphin distribution and, possibly, abundance. In this study, there was a perceived population size gradient associated with (1) river basin and water type, (2) drainage position in the river basin, and (3) level and range of human activities directly affecting river dolphin populations.

4.1.1. River Basin and Water Type

Regarding river basin and water type, the Amazon River basin has been reported as the basin with the highest density of Amazonian river dolphins [5,21,56,57,58,59,60]. In these previous studies, the density of river dolphins ranged from 2 to 6 ind./km², which is consistent with the data analyzed and presented in our results. Most parts of the rivers forming the Amazon basin are the whitewater type, which is rich in suspended sediments with high primary production including fish production and aquatic biodiversity [10,61]. The discharge of black water tributaries and marginal lakes also increases the input of organic and chemical components/nutrients, creating highly productive zones known as confluences. The confluences are hotspots for river dolphins that aggregate in these zones to access lakes and narrow channels, feed, and follow fishing migrating movements, which also affect group sizes [13]. Densities of boto and tucuxi are higher in confluences than in other habitats, usually up to 28 ind./km² [21,27,62,63], which is consistent with the findings of our results for almost all the rivers sampled, where densities in confluences for boto was on average 23 ind./km² (±9.18) and 16 ind./km² (±11.81) for tucuxi, with the highest values of 64 ind./km² of boto in the confluences of the Mamirauá Reserve—RDSM (Table S1).
The Orinoco basin, despite being whitewater, has lower boto densities and abundances when compared to the Amazon. Estimates in this basin (0.9 to 1.49 ind./km²) provide further strength for the hypothesis that the overall densities and abundances of boto in the Orinoco River basin are lower than in the Amazon basin [21]. These differences are thought to be associated mainly with watershed features and productivity [5,8,64] in addition to evolutionary aspects of river dolphin occupancy in freshwater ecosystems [65]. The Orinoco basin has low nutrient availability, low sediment load, and coarse substrate [41,66,67]. During river rising and high water, there is a drastic reduction of phytoplankton biomass, which is possibly due to the high concentration of suspended solids transported during these periods [68]. The aquatic fauna, mainly fishes, are distributed from the middle toward the lower river course, where aquatic habitat is more suitable [69]. The clearwater river basins such as the Tocantins-Araguaia and Tapajós, characteristically deprived of nutrients, ions, and sediments [42,70], have the lowest densities of boto (Tocantins D = 0.75 ind./km², Tapajós D = 0.40 ind./km²) [28,59]. For the Tocantins River, it is important to mention that it is dammed and the ecosystem is heavily transformed, and this may also have resulted in changes in dolphin habitat use, movements, and density [28]. Clearwater rivers commonly flow from shield formations, and they have rapids and falls in their upper and middle reaches, representing not highly suitable areas for river dolphins; however, this does not restrict their presence. The exception seems to be the Iténez River on the Bolivian/Brazilian border, where bufeo—the Bolivian river dolphin—density was 5.07 ind./km². The Itenéz River has a relatively extensive floodplain, with various dead river arms that seem to create a very suitable hydroscape for Bolivian river dolphins Inia boliviensis (under consideration as a separate species from Inia geoffrensis) [71]. These bays or “dead river arms” seem to create a very specific habitat in the middle of the Iténez River, favoring an aggregation of river dolphins in that zone, currently under investigation (Adriana Salinas et al. in preparation, and Paul André Van Damme personal comment).

4.1.2. Drainage Position in the River Basin

A second factor that may affect dolphin abundance is the drainage position of the river basins. The flow–ecology relationship predicts nonlinear biological responses (population numbers, population dynamics and structure, movements, survival, community structure) to the physical attributes of watersheds along their course such as temperature, dissolved oxygen, available habitat, depth, altitude, and sinuosity [72]. As one moves from the central Brazilian Amazon, where the core discharge flow of the Amazon River basin occurs (receiving hundreds of tributary rivers from Bolivia, Peru, Ecuador, and Colombia), to the middle-upper reaches of the river, in Eastern Amazonia, the population sizes of river dolphins decrease. This seems to be also true when looking at a single river as a unit of biodiversity. Rivers are unique units that play a key role in the estimation of population size given their unique intra-specific features and the preference of dolphins in specific habitats. We can see this “tendency” when looking at the data presented in Table 2 and translated in Figure 2.
In the Guaviare River, a river full of meanders and with rapids in its middle course, river dolphins were distributed in greater density from the middle third to the river mouth at the confluence with its tributary Inírida. In the upper Japurá River, where it is known as the Caquetá River, sightings of river dolphins became more sparsed as rocks and rapids started to appear, and the density of both species of dolphins (in relation to population size) decreased. This variability can be also compared to the study conducted by Mosquera-Guerra et al. [62] where the density of river dolphins in the middle Caquetá River was smaller than in the entire Japurá River. The presence of rocky margins and rapids is not a restriction for boto movements, as already discussed by Gravena et al. [73], but it is for tucuxi. Botos manage to cross these barriers, although upstream habitats might not be as suitable as those downstream.
Density estimates for the Purus River are the highest reported (14.5 boto/km² and 17.1 tucuxi/km²) so far for these species in the literature [5,21]. A small-scale study (50 km effort) in the Mamirauá reserve, Central Brazilian Amazon, between the rivers Japurá and Solimões estimated 18 boto/km² and population sizes around 13,000 individuals [20] for the entire reserve. However, the study adopted an extrapolation approach using a small area within the Mamirauá reserve to compute abundance for the entire protected area, hindering comparisons, given that river dolphins are not homogeneously distributed.
The Purus River is located in the most central portion of the Amazon Basin and is characterized by a high density of meanders and muddy water [10]. Surrounded by the Amazon rainforest, it also has large-scale hydrologic characteristics and hydrodynamics that stimulate the flow and renewal of nutrients, fertilizing the ecosystem with each water-level variation [74]). In the Purus, we might expect that river margins and confluences have similar conditions (e.g., high productivity) that could explain the relatively homogenous distributions of dolphins along the margins (clearly perceived in the field). In addition, in this region, prey migration occurs near the river margins [1,5,70].

4.2. Level and Range of Human Activities

The level and range of human activities may also influence dolphin densities and population sizes. Despite being located in the central Brazilian Amazon, the Solimões River and the stretch of Japurá River plus its tributary, the Juami River, had lower densities of both river dolphin species (1–1.77 ind./km²) compared to the other Amazonian rivers sampled. In these areas, there are historical reports of dolphin–fishermen conflicts of indirect catches or bycatch, and also piracatinga fishery (active fishing practice that uses dolphin flesh and blubber as bait to catch the catfish species Calophysus macropterus). A recent analysis, looking at specific sub-areas in the Mamirauá Reserve has shown a substantial record of fishing gear (n = 234), where monofilament nets (gillnets) were the most frequently used (n = 124) [63]. This type of fishing gear is recognized worldwide as the major cause of cetacean incidental catches, and still today, this is not fully quantified in the Amazon region.
The piracatinga fishery is considered a great threat to the boto in the Central Amazon [5,75,76,77]. Declines in dolphin populations are attributed to this practice, mainly in the lower Solimões and Japurá rivers [30]. In the Purus River, a survey conducted in 2017 in the same area covered by this study estimated densities of 9 boto/km² and 16 tucuxi/km² (Centro de Estudos e Pesquisas da Amazônia—CEPAM unpublished data). The estimates here and those computed by CEPAM are five years apart, and the surveys reported here were conducted in 2012 during a period of intensive fishing for the piracatinga. Since the survey conducted by CEPAM in 2017 followed the same sampling and analytical methods, estimates produced by the two studies are comparable and suggest a decline in the density of boto (from 14.5 ind./km² in 2012 to 9 ind./km² in 2017) and tucuxi (17 ind./km² in 2012 to 16 ind./km² in 2017). However, CVs of the estimates are not provided in the CEPAM analysis; therefore, no conclusions can be made. Nevertheless, these findings suggest that a longer time series is needed to assess population trends reliably, and new surveys in the lower Purus River are recommended as well. The inclusion of the Purus River in a monitoring program to estimate impacts of the piracatinga moratorium—a Brazilian regulation that prohibits fishing of Calophysus since 2015—and the effect of overfishing in the area are recommended because unmanaged fishing practices are major threats to river dolphins [37].
The low densities and population sizes found in the Orinoco (already noticed by [21]) may also be a result of cumulative effects of human exploitation in this river basin, which is heavily pressured by oil and mining companies, the Orinoco Mining Arc [78]. According to [27], summing the different types of human stressors in the Orinoco River basin reaches an overall score index of human impact of about 4.25 on a scale of low = index < 3, medium ≥ 3 and <4, and high ≥ 4. In this analysis, four main categories of human stressors were considered: water quality, habitat modification, exploitation of species, and human settlements, including cities.
In Bolivia, the infrastructure for water diversion in agriculture irrigation has been altered for the entire upper course of the Grande River, resulting in shifts of river dolphin distributions and habitat in this river (Mariana Escobar-WW personal comment). The stranding of Bolivian river dolphins is reported by [79], and it is attributed to habitat degradation. In addition to the cited threats, the Bolivian river dolphin is affected by the hydroelectric dams placed on the Madeira River in Brazil that caused population fragmentation, habitat degradation, and loss of river connectivity. Furthermore, currently, the Bolivian river dolphin faces the presence of an invasive fish, the Arapaima gigas (pirarucu), which is known as a competitor, and the trophic effects of competition for space or resources are unknown (Mariana Escobar-WW personal comment).
Population size estimates in this study can be used for conservation, fostering discussions about the need for an ecosystem approach to conserve a species. Based on flow–ecology, it is important to emphasize that although dolphins tend to aggregate in habitats with higher productivity, generating higher population densities, the entire river ecosystem is essential to ensure the supply of nutrients necessary for such an aggregation. Thus, the conservation of river dolphin populations depends on the connectivity of the entire river ecosystem. Increased knowledge about the potential impacts of anthropogenic activities on Amazonian river dolphin populations will be essential to guide the development of public policies for the conservation of the species. Important threats warrant further research, such as bycatch levels [80], mercury and other contaminants [26], and habitat modification and degradation (e.g., hydroelectric dams [25,28,59], Caldas et al. in review process). Studies focusing on identifying and quantifying the direct and indirect threats to river dolphins in South America are the way to understand how, where, and for how long we must act to ensure the conservation of dolphins and their habitats.

4.3. Survey-Specific g(0) and Variances in Estimates of Density

The survey-specific g(0) estimates computed in this study represent an improvement on attempts to estimate densities of river dolphins in the Amazon. In the past, a single estimate was used to correct for estimates of density and abundance [21] throughout the dolphins´ range. However, because conditions change for different surveys (i.e., type of vessel used, observer team, environmental conditions, the behavior of the local river dolphins, as well as river features), survey-specific estimates of g(0) are desirable to improve the accuracy of abundance estimates.
A survey-specific g(0) embodies perception bias using the double platform sighting for a single abundance estimation, since it is more precise regarding error accounting. Although not accounted for, availability bias is likely to occur. Boto and tucuxi diving patterns are poorly known and may vary during different behaviors (e.g., foraging, displacement, socializing) and in different habitat types. To account for availability bias, specifically designed experiments should be formulated in order to assess the effect of such an error in the final estimates. When assessed, the availability bias could be used as a correction factor to be applied for previous data.
The CVs associated with density/abundance estimates (ranging from 0.32 to 1.38) were high; however, they resulted from a high variation in encounter rates due to dolphin distribution in specific habitats (Table S1) and river sub-regions [47]. Acceptable CV values to be taken under consideration for population management purposes should be less than 0.4. However, abundance estimations for most of the marine and freshwater cetaceans are difficult and provide high CVs that often do not meet management objectives [81]. If CVs can be reduced, this might lead to an improved assessment of the population. The post-stratification of survey efforts produced more robust and precise estimates of abundance for a region with high variation in density. The Tocantins River [28] is affected by the Tucuruí dam in its lower course, which likely affects dolphins with substantial alteration of habitat and river connectivity. In this study, the overall CV was reduced by as much as 70%. However, the post-stratification of the Solimões and Japurá rivers and the Auati-Paranã channel (surveyed during the same expedition and analyzed as separate units), did not show such improvement in CV reduction, emphasizing the intra-river variability perceived in the encounter rates (Table S1). Nevertheless, it is difficult to reduce CVs, and therefore, threatened, endangered, or depleted populations may be managed poorly or even not be considered for management [81]. Although our results showed high CVs for most parts of the data analyzed, we consider that these CVs can be used as primary information until a more robust method is developed (e.g., passive acoustic monitoring—PAM).

5. Conclusions

Estimating the densities and abundances of river dolphins in South America is challenging. Computing the overall abundances of these species for the entire area of Amazonia and Orinoquia is unfeasible due to their extensive distribution. The limited or scarce information available on animal movements and population structure, logistical limitations, and the unique and complex environmental features of the Amazon require a high financial investment and long periods of data collection. Despite these difficulties, the extensive effort across many river basins in South America to estimate the densities and abundances of river dolphins has substantially improved with the PAERDSA (Program of Abundance Estimation of River Dolphins in South America).
The data presented in this paper contribute to a better understanding of the dolphin population size distribution and their concentrations throughout different river basins, sub-basins, and intra-river variations. The discussion raised here provides insights into the correlations between environmental characteristics and the human-induced impacts on dolphin densities and abundances in rivers from the Amazon and Orinoco basins. This is essential for identifying rivers as unique units so as to develop specific conservation actions. Nevertheless, the surveys from this study did not cover the total area of occurrence of Amazon river dolphins, and therefore, they do not represent overall population estimates of the species regarding total area. We highlight that additional and continued studies are necessary for refining our knowledge of population dynamics, addressing population structure and population trends.
Density estimates at fine scales might be good indicators of ecosystem transformation or degradation. Changes in density over time may reflect the effect of anthropogenic activities such as overfishing, deforestation, and water development projects, as well as climate change. Large-scale changes in the Amazonian ecosystem are fast approaching, and shifts in population parameters (e.g., trends) may not be detected before populations are at dangerously low levels. We strongly recommend the continuity of studies at large and small scales and consideration of new methods that could improve estimates of abundance and trends for river dolphins in the Amazon in order to provide sufficient information to stimulate and establish structured management programs and policy actions.

Supplementary Materials

The following are available online at https://www.mdpi.com/article/10.3390/jmse9111184/s1, Table S1: Density and abundance stratification by habitat type for each river/river stretch, Figures S1 to S8: Detection probability curves of models selected for those rivers where line transects were performed (Purus, Guaviare, Putumayo, Japurá-Caquetá-Solimões, RDSM and Meta), Table S2: Distance sampling output for fitted models selected.

Author Contributions

Conceptualization, M.P., F.T., M.M. and A.N.Z.; methodology, M.P., F.T. and A.N.Z.; validation, M.P., F.T., M.M. and A.N.Z.; formal analysis, M.P. and A.N.Z.; investigation, M.P., F.T., M.M., F.M.-G., R.L.P., H.P.J., G.M.A.d.S., P.A.V.D., A.G.d.A.C. and M.E.W.W.; resources, F.T. and M.M.; data curation, M.P.; writing—original draft preparation, M.P., F.T., M.M. and A.N.Z.; writing—review and editing, M.P., F.T., M.M., F.M.-G., R.L.P., H.P.J., G.M.A.d.S., P.A.V.D., A.G.d.A.C., M.E.W.W. and A.N.Z.; visualization, M.P., F.T., M.M., A.G.d.A.C. and A.N.Z.; supervision, F.T. and A.N.Z.; project administration, F.T.; funding acquisition, F.T. and M.M. All authors have read and agreed to the published version of the manuscript.

Funding

This research benefited from funds from many agencies: Whitley Fund for Nature (WFN), Petrobras Ambiental (grant number 6000.006355.10.2), ICMBio (Instituto Chico Mendes de Biodiversidade) and CEPAM (Centro de Pesquisas da Amazônia) through the FUNBIO (Fundo Brasileiro para Biodiversidade) (grant number 038598), WWF (World Wildlife Fund), Fundación Omacha, Instituto de Desenvolvimento Sustentável Mamirauá (IDSM). MP was granted a PhD scholarship (2015–2019) by Coordenação de Aperfeiçoamento de Pessoal de Nível Superior (CAPES) (grant number 1571839). The South American River Dolphins Initiative gave financial support to publish this work.

Institutional Review Board Statement

Not applicable. This study did not involve human or animal manipulation.

Informed Consent Statement

Not applicable.

Data Availability Statement

All data supporting the results reported are available in the supplementary materials provided in Tables S1 and S2 and Figures S1 to S6. Moreover, the results are detailed within the manuscript.

Acknowledgments

We would like to thank the two anonymous reviewers who greatly improved the text. We would like to thank the observer team and local field assistants involved in field efforts in each of the expeditions (Bolivia, Brazil, Colombia, and Venezuela), the crew of each boat used, the GIS assistance of Aqualie Institute, and all institutions/organizations involved in data collection (Mamirauá Institute, Omacha Foundation, WWF offices in Bolivia, Brazil, Colombia, Aqualie Institute, FAUNAGUA, BioMA/UFRA, ICMBio/IBAMA, Solinia, Neotropical Cuencas). We also thank the SARDI strategy (South American River Dolphins Initiative) for fostering an environment of exchange and scientific partnership, and support for the commitment of transboundary efforts in the conservation of river dolphins in South America. The scientific results and conclusions, as well as any views or opinions expressed herein, are those of the author(s) and not necessarily reflect those of NOAA or the U.S. Department of Commerce.

Conflicts of Interest

The authors declare no conflict of interest. The funders had no role in the design of the study, in the collection, analyses, or interpretation of data, in the writing of the manuscript, nor in the decision to publish the results.

References

  1. Best, R.C.; da Silva, V.M.F. Amazon river dolphin, boto Inia geoffrensis (de Blainville, 1817). In Handbook of Marine Mammals 1989; Ridgway, S.H., Harrison, R., Eds.; River Dolphins and the Larger Toothed Whales; Academic Press: London, UK, 1989; Volume 4, pp. 1–23. [Google Scholar]
  2. Best, R.C.; da Silva, V.M.F. Biology, status and conservation of Inia geoffrensis in the Amazon and Orinoco river basins. Occas. Pap. IUCN Species Surviv. Comm. SSC 1989, 3, 23–33. [Google Scholar]
  3. Pilleri, G.; Gihr, M. Observations on the Bolivian (Inia geoffrensis boliviensis d’Orbigny, 1834) and the Amazonian bufeo (Inia geoffrensis geoffrensis de Blainville, 1817) with description of a new subespecies (Inia geoffrensis humboltiana). Investig. Cetacea 1977, 8, 11–76. [Google Scholar]
  4. Rice, D.W. Marine Mammals of the World: Systematics and Distribution; Special Publication Number 4. 1998. The Society for Marine Mammalogy. Available online: http://www.marinemammalscience.org (accessed on 10 November 2019).
  5. Trujillo, F.; Portocarrero, M.; Gómez-Salazar, C.; Diazgranados, M.C.; Castellanos-Mora, L.; Ruíz-García, M.; Caballero, S. Status and conservation of river dolphins Inia geoffrensis and Sotalia fluviatilis in the Amazon and Orinoco basins in Colombia, 2010. In The Action Plan for South American River Dolphins 2020; SOLAMAC: Bogota, DC, Colombia, 2010; pp. 29–57. [Google Scholar]
  6. Hrbek, T.; da Silva, V.M.F.; Dutra, N.; Gravena, W.; Martin, A.R.; Farias, I.P. A new species of river dolphin from Brazil or: How little do we know our biodiversity. PLoS ONE 2014, 9, e83623. [Google Scholar] [CrossRef] [Green Version]
  7. Latrubesse, E.M.; Stevaux, J.C.; Sinha, R. Tropical Rivers. Geomorphology 2005, 70, 187–206. [Google Scholar] [CrossRef]
  8. Godoy, J.R.; Petts, G.; Salo, J. Riparian flooded forests of the Orinoco and Amazon basins: A comparative review. Biodivers. Conserv. 1999, 8, 551–586. [Google Scholar] [CrossRef]
  9. Winemiller, K.O.; Jepsen, D.B. Effects of seasonality and fish movement on tropical river food webs. J. Fish Biology. 1998, 53, 267–296. [Google Scholar] [CrossRef]
  10. Goulding, M.; Barthem, R.B.; Ferreira, E.J.G. The Smithsonian Atlas of the Amazon; Smithsonian Institution Press: Washington, DC, USA, 2003. [Google Scholar]
  11. Goulding, M. Amazon: The Flooded Forest; BBC Books: London, UK, 1989. [Google Scholar]
  12. Martin, A.R.; da Silva, V.M.F.; Salmon, D. Riverine habitat preferences of botos (Inia geoffrensis) and tucuxis (Sotalia fluviatilis) in the central Amazon. Mar. Mammal Science. 2004, 20, 189–200. [Google Scholar] [CrossRef]
  13. Gómez-Salazar, C.; Coll, M.; Whitehead, H. River dolphins as indicators of ecosystem degradation in large tropical rivers. Ecological. Indicators. 2012, 23, 19–26. [Google Scholar] [CrossRef] [Green Version]
  14. Mosquera-Guerra, F.; Trujillo, F.; Oliveira-da-Costa, M.; Marmontel, M.; Van Damme, P.A.; Franco, N.; Córdova, L.; Campbell, E.; Alfaro-Shigueto, J.; Mena, J.L.; et al. Home range and movements of Amazon river dolphins (Inia geoffrensis) in the Amazon and Orinoco river basins. Endanger. Species 2021, 45, 269–282. [Google Scholar] [CrossRef]
  15. Ward, J.V.; Tockner, K. Biodiversity: Towards a unifying theme for river ecology. Freshw. Biol. 2001, 46, 807–820. [Google Scholar] [CrossRef]
  16. Naiman, R.J.; Bunn, S.E.; Nilsson, C.; Petts, G.E.; Pinay, G.; Thompson, L.C. Legitimizing fluvial ecosystems as users of water: An overview. Environ. Manag. 2002, 30, 455–467. [Google Scholar] [CrossRef]
  17. Dale, V.H.; Beyeler, S.C. Challenges in the development and use of ecological indicators. Ecol. Indic. 2001, 1, 3–10. [Google Scholar] [CrossRef] [Green Version]
  18. Elmqvist, T.; Folke, C.; Nyström, M.; Peterson, G.; Bengtsson, J.; Walker, B.; Norberg, J. Response diversity, ecosystem change, and resilience. Front. Ecol. Environ. 2003, 1, 488–494. [Google Scholar] [CrossRef]
  19. Anganuzzi, A.A.; Buckland, S.T. Post-Stratification as a Bias Reduction Technique. J. Wildlife. Management. 1993, 57. [Google Scholar] [CrossRef]
  20. Martin, A.R.; da Silva, V.M.F. River dolphins and flooded forest: Seasonal habitat use and sexual segregation of botos (Inia geoffrensis) in an extreme cetacean environment. J. Zool. 2004, 263, 295–305. [Google Scholar] [CrossRef]
  21. Gómez-Salazar, C.; Trujillo, F.; Portocarrero-Aya, M.; Whitehead, H. Population, density estimates, and conservation of river dolphins (Inia and Sotalia) in the Amazon and Orinoco river basins. Mar. Mammal Sci. 2012, 28, 124–153. [Google Scholar] [CrossRef] [Green Version]
  22. Sioli, H. The Amazon: Limnology and Landscape Ecology of a Mighty Tropical River and Its Basin; Springer Science & Business Media: Berlin/Heidelberg, Germany, 2012; Volume 56. [Google Scholar]
  23. Junk, W.J.; Wittmann, F.; Schöngart, J.; Piedade, M.T. A classification of the major habitats of Amazonian black-water river floodplains and a comparison with their white-water counterparts. Wetl. Ecol. Manag. 2015, 23, 677–693. [Google Scholar] [CrossRef]
  24. Gregory, K.J. The human role in changing river channels. Geomorphology 2006, 79, 172–191. [Google Scholar] [CrossRef]
  25. Mosquera-Guerra, F.; Trujillo, F.; Parks, D.; Oliveira-da-Costa, M.; Marmontel, M.; Armenteras-Pascual, D.; Usma, S.; Willems, D.; Carvajal-Castro, J.D.; Mantilla-Meluk, H.; et al. Analysis of distribution of river dolphins (Inia and Sotalia) in protected and transformed areas in the Amazon and Orinoco basins. In Scientific Committee/Meetings/SC67B|Slovenia 2018/SM; International Whaling Commission: Cambridge, UK, 2018. [Google Scholar]
  26. Mosquera-Guerra, F.; Trujillo, F.; Parks, D.; Oliveira-da-Costa, M.; Van Damme, P.A.; Echeverria, A.; Franco, N.; Carvajal-Castro, J.D.; Mantilla-Meluk, H.; Marmontel, M.; et al. Mercury in Populations of River Dolphins of the Amazon and Orinoco basins. EcoHealth 2019, 4, 743–759. [Google Scholar] [CrossRef]
  27. Mosquera-Guerra, F.; Trujillo, F.; Aya-Cuero, C.; Franco-León, N.; Valencia, K.; Vásquez, A.; Duran-Prieto, C.; Morales, M.D.J.; Pachón-Bejarano, G.A.; Mantilla-Meluk, H.; et al. Population estimate and identification of major conservation threats for the river dolphin (Inia geoffrensis humboldtiana) at the Colombian Orinoquia. Therya 2019, 11, 9–21. [Google Scholar] [CrossRef] [Green Version]
  28. Paschoalini, M.; Almeida, R.M.; Trujillo, F.; Melo-Santos, G.; Marmontel, M.; Pavanato, H.J.; Mosquera-Guerra, F.; Ristau, N.; Zerbini, A.N. On the brink of isolation: Population estimates of the Araguaian river dolphin in a human-impacted region in Brazil. PLoS ONE 2020, 15, e0231224. [Google Scholar] [CrossRef] [PubMed] [Green Version]
  29. Braulik, G.T.; Smith, B.D. Platanista gangetica (amended version of 2017 assessment). IUCN Red List. Threat. Species 2019, E.T41758A151913336. [Google Scholar] [CrossRef]
  30. da Silva, V.; Trujillo, F.; Martin, A.; Zerbini, A.N.; Crespo, E.; Aliaga-Rossel, E.; Reeves, R. Inia geoffrensis. IUCN Red List. Threat. Species 2018, E.T10831A50358152. [Google Scholar] [CrossRef]
  31. da Silva, V.; Martin, A.; Fettuccia, D.; Bivaqua, L.; Trujillo, F. Sotalia fluviatilis. IUCN Red List. Threat. Species 2020, E.T190871A50386457. [Google Scholar] [CrossRef]
  32. IWC. South Asian River Dolphin Task Team Workshop Report; University of Nottingham: Kuala Lumpur, Malaysia, 19–21 July 2019. [Google Scholar]
  33. Khan, U.; Willems, D. Report of the Trinational Workshop on the Irrawaddy Dolphin; WWF: Zeist, Netherlands; Sindh, Pakistan, 2021; virtual. [Google Scholar]
  34. Wang, D.; Turvey, S.T.; Zhao, X.; Mei, Z. Neophocaena asiaeorientalis spp. asiaeorientalis. IUCN Red List. Threat. Species 2013, E.T43205774A45893487. [Google Scholar] [CrossRef]
  35. Smith, B.D.; Beasley, I. Orcaella brevirostris (Mekong River subpopulation). IUCN Red List. Threat. Species 2004, E.T44555A10919444. [Google Scholar] [CrossRef]
  36. Williams, R.; Moore, J.E.; Gomez-Salazar, C.; Trujillo, F.; Burt, L. Searching for trends in river dolphin abundance: Designing surveys for looming threats, and evidence for opposing trends of two species in the Colombian Amazon. Biol. Conservation. 2016, 195, 136–145. [Google Scholar] [CrossRef]
  37. Brum, S.; Rosas-Ribeiro, P.; Amaral, R.D.S.; de Souza, D.A.; Castello, L.; da Silva, V.M.F. Conservation of Amazonian aquatic mammals. Aquatic. Conserv. Marine. Freshw. Ecosystem. 2021, 31, 1068–1086. [Google Scholar] [CrossRef]
  38. Hastie, G.D.; Barton, T.R.; Grellier, K.; Hammond, P.S.; SwIFT, R.J.; Thompson, P.M.; Wilson, B. Distribution of small cetaceans within a candidate Special Area of Conservation; implications for management. J. Cetacean Res. Manag. 2003, 5, 261–266. [Google Scholar]
  39. Lewis, W.M.; Hamilton, S.K.; Lasi, M.A.; Rodríguez, M.; Saunders, J.F. Ecological determinism on the Orinoco floodplain. AIBS Bull. 2000, 50, 681–692. [Google Scholar] [CrossRef] [Green Version]
  40. Barthem, R.B.; Charvet-Almeida, P.; Montag, L.F.A.; Lanna, A.E. Amazon Basin. In GIWA Regional Assessment 40b; University of Kalmar: Kalmar, Sweden, 2004. [Google Scholar]
  41. Meade, R. Suspended sediments of the modern Amazon and Orinoco Rivers. Quat. Int. 1994, 21, 29–39. [Google Scholar] [CrossRef]
  42. Junk, W.J.; Furch, K. A general review of tropical South American floodplains. Wetl. Ecol. Manag. 1993, 2, 231–238. [Google Scholar] [CrossRef]
  43. Martinelli, L.; Reynaldo, V.; Devol, A.; Richey, J.; Folsberg, B. Suspended sediment load in the Amazon basin: An overview. GeoJournal 1989, 19, 381–389. [Google Scholar] [CrossRef]
  44. Meade, R.; Weibezahn, F.; Lewis, W., Jr.; Perez, H.D. Suspended sediment budget for the Orinoco River. In The Orinoco River as an Ecosystem; Weibezahn, F., Alvarez, H., Lewis, W., Jr., Eds.; Universidad Simón Bolívar: Caracas, Venezuela, 1990; pp. 55–79. [Google Scholar]
  45. Hamilton, S.; Lewis, W. Physical characteristics of the fringing floodplain of the Orinoco River, Venezuela. Interciencia 1990, 15, 491–500. [Google Scholar]
  46. Sippel, S.; Hamilton, S.; Melack, J.; Choudhury, B. Determination of inundation area in the Amazon River floodplain using SMMR 37GHz polarization difference. Remote Sens. Environ. 1994, 48, 70–77. [Google Scholar] [CrossRef]
  47. Thomas, L.; Buckland, S.T.; Rexstad, E.A.; Laake, J.L.; Strindberg, S.; Hedley, S.L.; Bishop, J.R.; Marques, T.A.; Burnham, K.P. Distance software: Design and analysis of distance sampling surveys for estimating population size. J. Applied. Ecol. 2010, 47, 5–14. [Google Scholar] [CrossRef] [Green Version]
  48. R Core Team. R: A Language and Environment for Statistical Computing; R Foundation for Statistical Computing: Vienna, Austria, 2015. [Google Scholar]
  49. Miller, D.L. Distance: Distance Sampling Detection Function and Abundance Estimation. R Package Version 0.9.7. 2017. Available online: https://CRAN.R-project.org/package=Distance (accessed on 12 February 2019).
  50. Laake, J.; Borchers, D.; Thomas, L.; Miller, D.; Bishop, J. mrds: Mark-Recapture Distance Sampling. R Package Version 2.1.18. 2017. Available online: https://CRAN.R-project.org/package=mrds (accessed on 12 February 2020).
  51. Buckland, S.T.; Anderson, D.R.; Burnham, K.P.; Laake, J.L.; Borchers, D.L.; Thomas, L. Introduction to Distance Sampling; Oxford University Press: New York, NY, USA, 2001. [Google Scholar]
  52. Frias, M.P. Estimação dos parâmetros populacionais de densidade e abundância para os golfinhos de rio da América do Sul boto (Inia spp.) e tucuxi (Sotalia fluviatilis): Aperfeiçoamento do método e abordagens ecológicas [Estimating Density and Population Size for South American River Dolphins Boto and Tucuxi: Improving Methods and Ecological Approaches]. Ph.D. Thesis, Universidade Federal de Juiz de Fora, Juiz de Fora, Brazil, 2019; 144p.
  53. Marques, F.F.; Buckland, S.T. Incorporating covariates into standard line transect analyses. Biometrics 2003, 59, 924–935. [Google Scholar] [CrossRef] [PubMed] [Green Version]
  54. Horvitz, D.G.; Thompson, D.J. A generalization of sampling without replacement from a finite universe. J. Am. Stat. Assoc. 1952, 47, 663–685. [Google Scholar] [CrossRef]
  55. Innes, S.; Heide-Jørgensen, M.P.; Laake, J.L.; Laidre, K.L.; Cleator, H.J.; Richard, P.; Stewart, R.E.A. Surveys of belugas and narwhals in the Canadian High Arctic in 1996. NAMMCO Sci. Publ. 2002, 4, 169–190. [Google Scholar] [CrossRef] [Green Version]
  56. Vidal, O.; Barlow, J.; Hurtado, L.; Torre, J.; Cendon, P.; Ojeda, Z. Distribution and abundance of the Amazon river dolphin (Inia geoffrensis) and the tucuxi (Sotalia fluviatilis) in the upper Amazon River. Mar. Mammal Science. 1997, 13, 427–445. [Google Scholar] [CrossRef]
  57. Aliaga-Rossel, E. Distribution and abundance of the pink river dolphin, bufeo (Inia geoffrensis) in the Tijamuchi River, Beni-Bolivia. Aquat. Mammal. 2002, 28, 312–323. [Google Scholar]
  58. Aliaga-Rossel, E.; McGuire, T.L.; Hamilton, H. Distribution and encounter rates of the river dolphin (Inia geoffrensis boliviensis) in the central Bolivian Amazon. J. Cetacean Res. Manag. 2006, 8, 87. [Google Scholar]
  59. Pavanato, H.J.; Melo-Santos, G.; Lima, D.S.; Portocarrero-Aya, M.; Paschoalini, M.; Mosquera, F.; Trujillo, F.; Meneses, R.; Marmontel, M.; Maretti, C. Risks of dam construction for South American river dolphins: A case study of the Tapajós River. Endanger. Species Reearchs 2016, 31, 47–60. [Google Scholar] [CrossRef] [Green Version]
  60. Pavanato, H.J.; Salazar, C.G.; Lima, D.; Paschoalini, M.; Ristau, N.; Marmontel, M. Density, abundance and group size of river dolphins (Inia geoffrensis and Sotalia fluviatilis) in central Amazonia, Brazil. J. Cetacean Res. Manag. 2019, 20, 93–100. [Google Scholar] [CrossRef]
  61. Guyot, J.L.; Jouanneau, J.M.; Soare, L.; Boaventura, G.R.; Maillet, N.; Lagane, C. Clay mineral composition of river sediments in the Amazon Basin. Catena 2007, 71, 340–356. [Google Scholar] [CrossRef]
  62. Mosquera-Guerra, F.; Trujillo, F.; Meluk, H.M.; Valencia, A.V.; Valderrama, D.H.R.; Navarro, F.A.V.; Garzón, J.G.A.; Londoño, I. Tamaño poblacional, densidad y distribución de Inia geoffrensis y Sotalia fluviatilis en la cuenca media del río Caquetá. Momentos De Cienc. 2015, 12, 107–115, ISSN 1692–5491. [Google Scholar]
  63. Marmontel, M.; de Melo, J.F.; Frias, M.P.; Giovanni, A.; de Almeida-Coelho, H.I.C.; Pérez, H.P.J. Amazonian River Dolphin Density Estimates in the Mamirauá Sustainable Development Reserve 2017–2019. In Proceedings of the International Whaling Commission, Scientific Committee Meeting, Virtual, 12–24 May 2020. 68SC. [Google Scholar]
  64. Hamilton, S.K.; Lewis, W.M.; Sippel, S.J. Energy sources for aquatic animals in the Orinoco River floodplain: Evidence from stable isotopes. Oecologia 1992, 89, 324–330. [Google Scholar] [CrossRef]
  65. Hamilton, H.; Caballero, S.; Collins, A.G.; Brownell Jr, R.L. Evolution of river dolphins. Proc. R. Soc. Lond. Ser. B Biol. Sci. 2001, 268, 549–556. [Google Scholar] [CrossRef] [PubMed]
  66. Medina, E.; Silva, J.F. Savannas of Northern South America: A Steady State Regulated by Water-Fire Interactions on a Background of Low Nutrient Availability. J. Biogeogr. 1990, 17, 403. [Google Scholar] [CrossRef]
  67. Savage, K.M.; Potter, P.E. Petrology of modern sands of the rios Guaviare and Inirida, southern Colombia: Tropical climate and sand composition. J. Geol. 1991, 99, 289–298. [Google Scholar] [CrossRef]
  68. Chitty, C.H.I. Phytoplankton in the upper and middle Orinoco river. Internationale Vereinigung für theoretische und angewandte Limnologie: Verhandlungen 1994, 25, 1856–1861. [Google Scholar]
  69. Lasso, C.A.; Machado-Allison, A.; Taphorn, D.C. Fishes and aquatic habitats of the Orinoco River Basin: Diversity and conservation. J. Fish Biol. 2016, 89, 174–191. [Google Scholar] [CrossRef]
  70. Sioli, H. The Amazon and its main affluents: Hydrography, morphology of the river courses, and river types. In The Amazon: Limnology and Landscape Ecology of a Mighty Tropical River and Its Basin; Sioli, H., Ed.; Dr. W. Junk Publishers: Dordrecht, The Netherlands, 1984; pp. 127–165. [Google Scholar]
  71. Gravena, W.; Da Silva, V.M.F.; Da Silva, M.N.; Farias, I.P.; Hrbek, T. Living between rapids: Genetic structure and hybridization in botos (Cetacea: Iniidae: Inia spp.) of the Madeira River, Brazil. Biolical J. Linnean. Soc. 2015, 114, 764–777. [Google Scholar] [CrossRef] [Green Version]
  72. Rosenfeld, J.S. Developing flow–ecology relationships: Implications of nonlinear biological responses for water management. Freshw. Biol. 2017, 62, 1305–1324. [Google Scholar] [CrossRef] [Green Version]
  73. Gravena, W.; Farias, I.P.; da Silva, M.N.; da Silva, V.M.F.; Hrbek, T. Looking to the past and the future: Were the Madeira River rapids a geographical barrier to the boto (Cetacea: Iniidae)? Conservation. Genetics. 2014, 15, 619–629. [Google Scholar] [CrossRef]
  74. de Paiva, R.C.D.; Buarque, D.C.; Collischonn, W.; Bonnet, M.P.; Frappart, F.; Calmant, S.; Bulhoes, M.C.A. Large-scale hydrologic and hydrodynamic modeling of the Amazon River basin. Water Resour. Reearch 2013, 49, 1226–1243. [Google Scholar] [CrossRef] [Green Version]
  75. Mintzer, V.J.; Martin, A.R.; da Silva, V.M.F.; Barbour, A.B.; Lorenzen, K.; Frazer, T.K. Effect of illegal harvest on apparent survival of Amazon River dolphins (Inia geoffrensis). Biol. Conservation. 2013, 158, 280–286. [Google Scholar] [CrossRef]
  76. Mintzer, V.J.; Schmink, M.; Lorenzen, K.; Frazer, T.K.; Martin, A.R.; da Silva, V.M. Attitudes and behaviors toward Amazon River dolphins (Inia geoffrensis) in a sustainable use protected area. Biodivers. Conserv. 2015, 24, 247–269. [Google Scholar] [CrossRef]
  77. Iriarte, V.; Marmontel, M. Insights on the use of dolphins (boto, Inia geoffrensis and tucuxi, Sotalia fluviatilis) for bait in the piracatinga (Calophysus macropterus) fishery in the western Brazilian Amazon. J. Cetacean Res. Manag. 2013, 13, 163–173. [Google Scholar]
  78. Rivero, D.; Liu, Y. Venezuela’s Orinoco Mining Arc: A literature review of Environmental Impacts. Int. J. Sci. Res. Publ. 2020, 10, 202. [Google Scholar] [CrossRef]
  79. Aliaga-Rossel, E.; Mariana, E.-W. Translocation of trapped Bolivian river dolphins (Inia boliviensis). J. Cetacean Res. Manag. 2020, 21, 17–23. [Google Scholar] [CrossRef]
  80. Campbell, E.; Mangel, J.C.; Alfaro-Shigueto, J.; Mena, J.L.; Thurstan, R.H.; Godley, B.J. Coexisting in the Peruvian Amazon: Interactions between fisheries and river dolphins. J. Nat. Conserv. 2020, 56, 125859. [Google Scholar] [CrossRef]
  81. Taylor, B.L.; Wade, P.R. “Best” abundance estimates and best management: Why they are not the same. In Quantitative Methods for Conservation Biology; Springer: New York, NY, USA, 2000; pp. 96–108. [Google Scholar]
Figure 1. Rivers and stretches of rivers sampled for density and abundance estimates of South American river dolphins (boto and tucuxi) through the lowlands of the Amazon and Orinoco basins. Published studies are in red, and the present data analyzed are in blue.
Jmse 09 01184 g001
Figure 2. Flow–ecology relationship scheme of densities and abundance of river dolphins through rivers and river basins. Arrow gradient goes from green (lower density/abundance) to red (higher density/abundance).
Jmse 09 01184 g002
Table 1. Sampling effort and study areas of South American river dolphins (boto and tucuxi) abundance estimates in the Amazon and Orinoco basins, following chronological order of sampling effort from 2012 to 2018.
RiverYearSeasonWater TypeBasinCoordinates BeginningCoordinates End* River Length (km)CountrySampling Effort (km)Area (km²)
Purus2012RisingWhiteAmazon3°40′55.75” S/ 61°28′25.42” W5°16′34.79” S/ 62°55′20.59” W3211Brazil512.05538.72
Meta2012RisingWhiteOrinoco6°12′12.05” N/ 67°28′4.98” W4°21′30.86” N/ 72°5′2.86” W804Colombia/Venezuela584.84969
** Orinoco/Cassiquiare2013RecedingWhiteOrinoco2°39′41.18” N/ 67°28′53.48” W4°3′43.63” N/ 67°42′10.87” W326Colombia/Venezuela454482.06
Japurá (Caquetá) + tributaries (Apaporis, Cahuinari, Miriti)2014RisingWhite (Japurá River), black (tributaries)Amazon3°9′46.89” S/ 64°47′37.13” W1°26′11.28” S/ 70°51′33.17” W2100Brazil/Colombia1027.531767.67
Auati-Paranã channel2014RisingMixedAmazon2°32′43.04” S/ 67°22′30.14” W1°51′4.89” S/ 65°42′37.48” W432.8Brazil432.855.74
Solimões2014RisingWhiteAmazon3°9′27.35” S/ 67°57′54.33” W3°21′47.71” S/ 64°39′49.92” W1700Brazil581.391745.39
*** Juami and Japurá rivers2015RisingBlack (Juami River), White (Japurá River)Amazon1°46′49.90” S/ 67°35′39.4” W2°27′54.28” S/ 68°27′57.7” W Brazil386.95254
Guaviare2016RecedingWhiteOrinoco2°36′58.61” N/ 72°38′8.65” W3°52′23.56” N/ 67°56′5.03” W1497Colombia968593.75
**** RDSM2016RecedingPredominantly White with mixed water in confluencesAmazon3°9′35” S/ 64°47′37” W2°32′50” S/ 67°22′8” W1422.81Brazil1422.812652
Putumayo2017RecedingWhiteAmazon0°6′46.97” N/ 75°52′10.97” W2°53′39.76” S/ 69°44′2.22” W1610Cross-border: Ecuador, Colombia, Peru, Brazil11861108.66
Iténez (Guaporé)2017RisingClearAmazon13°32′21.44” S/ 61°51′13.28” W4°3′43.63” S/ 67°42′10.87” W1260Bolivia/Brazil48140.18
Meta2018RisingWhiteOrinoco6°12′12.05” N/ 67°28′4.98” W4°21′30.86” N/ 72°5′2.86” W804Colombia/Venezuela630.44969
* River length: data gathered from environmental agency websites and water resource departmental files in each country. ** Sampling during 2013 in the Orinoco and Cassiquiare channel conducted efforts in both watercourses; for this reason, sampling effort exceeds information of river length. *** The Juami river extension: no data available from environmental agency sources. **** RDSM: Reserva de Desenvolvimento Sustentável Mamirauá, bordered by Solimões and Japurá rivers.
Table 2. Boto (Inia geoffrensis) and tucuxi (Sotalia fluviatilis) estimates of density and abundance across Amazon and Orinoco river basins.
RiverInia geoffrensisSotalia fluviatilis
DNCVDNCV
Purus14.576720.3717.1492380.49
Meta1.049720.56---
Orinoco—Cassiquiare channel0.94351.36---
Japurá (Caquetá) + tributaries2.1938710.941.7931640.98
Auati-Paranã channel5.53070.515.83240.55
Solimões1.0117631.341.3423391.03
Juami-Japurá rivers1.774401.382.45991.79
Guaviare3.2811380.32---
RDSM3.1784070.743.3588760.65
Putumayo3.4938970.610.495460.95
Iténez (Guaporé)5.072040.88---
Meta1.4913970.95---
D = overall density; N = overall abundance; CV = coefficient of variation, (-) species does not occur.
Table 3. Estimated survey-specific detection probability of seeing a group of dolphins at zero distance from the trackline (g(0)).
RiverWater TypeRiver Basing(0)
Inia
geoffrensis
Sotalia
fluviatilis
PurusWhiteAmazon0.86 (0.09)0.99 (0.008)
Meta—2012WhiteOrinoco0.95 (0.04)
Orinoco—Cassiquiare channelWhiteOrinoco0.81 (0.05) *
Japurá (Caquetá) + tributaries (Apaporis, Cahuinari, Miriti)White (Japurá River), Black (tributaries)Amazon0.69 (0.04)0.83 (0.02)
Auati-Paranã channelMixed (Black and White)Amazon
SolimõesWhiteAmazon
Juami and Japurá riversBlack (Juami River), White (Japurá River)Amazon0.81 (0.05) *0.98 (0.006) *
GuaviareWhiteOrinoco0.71 (0.53)
RDSMPredominantly White with mixed water in confluencesAmazon0.79 (0.08)0.98 (0.01)
PutumayoWhiteAmazon0.56 (0.08)0.59 (0.13)
Iténez (Guaporé)ClearAmazon0.81 (0.05) *
Meta—2018WhiteOrinoco0.85 (0.11)
* global g(0) values [52].
Publisher’s Note: MDPI stays neutral with regard to jurisdictional claims in published maps and institutional affiliations.

