Abstract
Global climate models, focused on projecting anthropogenic warming, have not detected an increase in sea surface temperature (SST) at low latitudes comparable to the observed one. This appears to be one reason for the discrepancy between the model estimates of warming and reduction of the sea ice extent in the Arctic and the observed changes in the climate system. In previous studies, it was shown that short-term manifestations of the impact of low latitudes on the Arctic climate were identified in 2–3 weeks as a result of strengthening of atmospheric circulation patterns. In this paper, for the first time, a climatic relationship was established among an increase in SST, air temperature, and water vapor content at low latitudes, and a decrease in sea ice extent in the Arctic. ECMWF Re-Analysis data (ERA-Interim, ERA5), Hadley Centre Sea Ice and Sea Surface Temperature data set (HadISST), sea ice archives of the World Centers NSIDC (USA), and Arctic and Antarctic Research Institute (Russia), observations of water temperature in the Kola section (33°30’ E), calculated sea ice parameters using the Arctic and Antarctic Research Institute coupled ice-ocean circulation model (AARI–IOCM). Methods of multivariate correlation analysis, calculating spectra and coherence, and creating correlation graphs were used to obtain the results. For the first time, estimates of the effect of heat transport from low to high latitudes on climate change and sea ice extent in the Arctic over the past 40 years have been obtained, explaining a significant part of their variability. The increase in heat transport is affected by an increase in SST at low latitudes, where a significant part of the solar heat is accumulated. Due to the increase in SST, the amount of heat transported by the ocean and the atmosphere from low latitudes to the Arctic increases, leading to an increase in the air temperature, water vapor content, downward longwave radiation at high latitudes, and a decrease in the thickness and extent of winter sea ice. Potential topics include, but are not limited to: the role of heat and moisture transport in the Arctic warming, effect of SST at low latitudes on transports, linkage of warming in low latitudes and in shrinking of the Arctic sea ice.
1. Introduction
Previous studies [1,2,3] showed that the primary contributor to Arctic energy balance during cold periods of the year is atmospheric heat transport from low to high latitudes. However, in most studies, the connection between an increase in winter air temperature at high latitudes and fluctuations of the total atmospheric heat transport to the Arctic was not detected. Moreover, empirical and model estimates indicated a decrease in the total atmospheric heat transport to the Arctic [4,5,6] or even the absence of significant changes in the total heat transport [7,8,9], which is inconsistent with the observed increase in air temperature at high latitudes.
The atmospheric poleward heat and moisture transports, calculated on the basis of the ERA-Interim reanalysis for 1980–2015, show [10] that the bulk of sensible and latent heat enters the Arctic north of 70° N in winter between 0° and 80° E and between the surface and 750 hPa pressure surface. This inflow of heat determines more than 50% of the variability in winter air temperature and more than 40% of the variability in the average annual air temperature, and the inflow of water vapor enhances the greenhouse effect, slowing down the growth of ice thickness in winter and accelerating the onset of melting [11,12,13].
The influx of warm and salty water from the North Atlantic into the Barents and Greenland Seas also affects the warming and decrease of the winter sea ice extent [14,15,16]. The close relationship between the water temperature coming from the North Atlantic to the Barents Sea and the ice extent during the period of ice growth from December to the beginning of ice melting in June was confirmed in [17]. Interannual changes in the oceanic heat inflow from the North Atlantic influence water temperature fluctuations in the Kola section in the Barents Sea [18].
The variability of atmospheric heat transport to the Arctic is due to changes in atmospheric circulation in the northern hemisphere [19,20,21,22]. These changes, in particular, are the result of the effect of sea surface temperature (SST) anomalies on the intensity of atmospheric circulation [23,24,25,26]. The influence of SST anomalies at low latitudes is especially important, since most of the solar heating and global warming [27,28] are accumulated in the tropics and then transported to middle and high latitudes.
Tropical SST anomalies enhance convection in the atmosphere, leading to an increase and expansion of the Hadley circulation cell [19,29,30,31,32], the generation of Rossby waves [22,33,34,35,36], and Madden–Julian oscillations [37], and the effect on the North Atlantic Oscillation [38]. As a result, both heat and moisture transports from low to high latitudes are increased. These results were obtained by studying the influence of atmospheric circulation in low latitudes manifested in the Arctic after 2–3 weeks. However, the impact of SST at low latitudes on climatic changes in the Arctic has not been studied yet.
Global climate models underestimate the positive trends in ocean warming at low latitudes, where most of the heat energy from the sun accumulates [39,40,41,42]. As a consequence, global coupled models reproduce climate change features in certain mid- and high-latitude regions with less confidence than atmospheric circulation models based on observed warming in tropical oceans [24,43,44]. In the Arctic, the global coupled models from Coupled Model Intercomparison Project Phase 5 (CMIP5) largely underestimate the interannual temperature variability in the layer of Atlantic water and the observed temperature has increased since the late 1970s [45]. The new generation of global models from Coupled Model Intercomparison Project Phase 6 (CMIP6) underestimate the observed mean temperature in the Arctic during 1979–2014. Most CMIP6 models retain the largest discrepancy between observed and modeled Arctic sea ice distributions in September and show less ice loss in September per degree warming compared to observations [46].
The objectives of our study are to assess the effect of SST at low latitudes on the Arctic warming and reduction of Arctic sea ice, to suggest an explanation for this effect. The study includes identifying areas at low latitudes where SST affects the atmospheric and oceanic transport to the Arctic, assessing the relationship between SST and climate change at low latitudes and the parameters of sea ice and climate in the Arctic.
2. Materials and Methods
In this study the transport of sensible and latent heat to the Arctic through 70° N in winter (December–February) 1980–2015 was obtained from [10]. ERA-Interim reanalysis data [47] for 1979–2015 was used to obtain the high-resolution thermodynamic parameters of global atmosphere and vertical integrals of northward heat and moisture fluxes. Monthly mean data from the area 60–90°N include air temperature, water vapor content, and wind meridional components on the regular 1° × 1° grid and on the isobaric surfaces from 1000 to 100 hPa with a 50 hPa resolution. Integral transports of sensible (SH) and latent (LH) heat through 70°N latitude were calculated, averaged over the entire latitude circle and along its separate parts to compare with the average air temperature in the 70–90°N area. In order to take into account the vertical inhomogeneity of transport, values of SH and LH were calculated at each isobaric level with a 50 hPa grid step on a 70°N latitude through 1° longitude.
Monthly mean SST was obtained from HadISST reanalysis (http://hadobs.metoffice.com.hadsst/, accessed on 20 Janyary 2021) [48] with a 1° grid spatial resolution and SST data through the website http://www.cpc.ncep.noaa.gov/data/indices/ (accessed on 25 January 2021).
Variations of the Atlantic water inflow into the Arctic were represented by the water temperature in the 50–200 m layer in the section along the Kola meridian in the Barents Sea [18]. Data are available through the website http://www.pinro.vniro.ru/ (accessed on 1 February 2021).
As parameters for sea ice, we used the Arctic sea ice extent obtained from the National Snow and Ice Data Center (NSIDC, USA) and sea ice volume in the Arctic (Vol) based on calculations of the sea ice ocean AARI–IOCM model [49]. The AARI–IOCM model combines three models: the three-dimensional baroclinic model of water circulation, the ice cover drift model, and the thermodynamic sea ice model. The model is adapted to the Arctic Ocean and the adjoining area of the Atlantic Ocean and has a spatial resolution of 13.8 km. The size of the grid domain is 440 × 395 points. Vertical resolution is variable and computation is carried out at 33 levels. To describe the bottom topography and coast line configuration, the General Bathymetric Chart of the Oceans (GEBCO) archive was used. Average long-term monthly mean values of water discharge on 17 main rivers flowing into the Arctic Ocean were used as boundary conditions. The values of the temperature and salinity of water from the World Ocean Atlas (WOA05) were considered as initial conditions for summer and winter. The data on the sea-level air pressure and air temperature at the height of 2 m from the National Centers for Environmental Prediction and National Center for Atmospheric Research (NCEP/NCAR) reanalysis for diagnostic computations or the prognostic data of the European Center for Medium-Range Weather Forecasts, with the resolution of 2.5° × 2.5°, were used as the external forcing. The AARI–IOCM simulates, rather well, ice conditions and water circulations in the Arctic Ocean. It was recommended for use in operational practice [50].
As characteristics of climate in the Arctic and low latitudes, we used monthly, seasonal, and annual values of total content of water vapor (TCWV), surface thermal radiation downwards (STRD), surface air temperature (SAT) for 1979–2019, from the ERA5 reanalysis, averaged over the regions of 70–87.5° and 0–25° N. The sum of degree-days with frost (SDDF), which are integral indicators of the thermal forcing of winter sea ice growth, were calculated according to observations at 18 meteorological stations along the coast of the Siberian Arctic seas.
The series of the listed characteristics were compared according to the physical concepts of the relationship between them, using the methods of correlation and spectral analysis. The calculation of the spectral density was based on the cosine-transformation of the autocorrelation function with the Tukey kernel [51,52]. The spectral analysis was also used to determine the border between the climatic signal and the weather noise. Based on these results, we selected a time window for the moving average of time series in order to isolate the climate signal.
To find the influence of the low-latitude SST on winter meridional atmospheric heat transport (MAHT) to the Arctic, we used a multidimensional cross-correlation analysis of the climatic series with variable lag:
where T′, M′ are the SST and MAHT anomalies, g = 1.2, ... N are years, N is the length of the series, m = 1.2, ..., 12-months, k = 0, 1, 2, ... 5-delay (years).
Sensible heat transport at the 1000 hPa level was used, which characterized the maximum meridional transport through the Atlantic gate [10]. As a result, the areas of SST with the highest correlations and corresponding delay of MAHT relative to SST in different months were found out. Further, the influence of the atmospheric transport from low latitudes on climatic changes in the Arctic was estimated indirectly through the calculation of the relationship between air temperature and water vapor content in low latitudes and in the Arctic. The effect of heat transport in the ocean on water temperature in the Nordic Seas was estimated through the relationship between sea surface temperatures at low latitudes and in the Barents Sea (at Kola section).
3. Results
3.1. Anomalies of SST in Low Latitudes Affecting the Winter Atmospheric Heat Transport to the Arctic
The areas of the highest correlation between winter meridional atmospheric heat transport (MAHT) and SST are marked in October in the Atlantic, in February in the Indian Ocean, and in July in the Pacific Ocean, with delays of the MAHT, respectively, by 27, 23, and 30 months. For further analysis, series of the mean monthly SST, averaged in the areas of the highest correlations, were constructed. Average SST were calculated in the area of 5–25° N, 60–20° W in the Atlantic Ocean, in the area of 10–20° N, 40–110° E in the Indian Ocean, in the area of 10° S–10° N, 160° E–80° W in the Pacific Ocean for each month (1982–2015). Maximum correlation between MAHT and SST in the Indian Ocean and Pacific Ocean slightly exceeded the correlation coefficients between MAHT and SST in the same areas in October (Table 1), so we used SST in all three oceans in October (Figure 1).

Table 1.
Correlation between mean monthly SST in low-latitudinal regions of the North Atlantic (Atl), Indian (Ind), and the Pacific (Pac) oceans in the month indicated in brackets and the winter meridional atmospheric transport (MAHT) for 1982–2014 (in brackets—the MAHT delay in months. The significant coefficient correlation is more than 0.34 (95% confidence)).

Figure 1.
Patterns of correlation between SST in 40° S–40° N area in October and meridional atmospheric transport of sensible heat in December–February through 0–80° E at 70° N with 27 months lag. Thick line—coefficient correlation equal 0.30 (90% significance border).
3.2. Transferring the Influence of SST Anomalies with the Participation of Atmospheric and Oceanic Circulation
The performed correlation analysis revealed the influence of SST anomalies in the low latitudes of the Atlantic, Indian, and Pacific oceans on the winter meridional atmospheric heat transport to the Arctic. The interannual fluctuations of winter atmospheric heat transport poleward lag SST anomalies in low latitudes up to 2.5 years (from 23 to 29 months). The previous studies ascribe the transfer of low-latitude SST influence to the Arctic by means of atmospheric circulation with a delay of 1–2 weeks [32,37]. Delays of several years can occur with the involvement of the ocean in the mechanism of low-latitude SST impact on the Arctic. The North Atlantic is the region across which the ocean can have the greatest impact on the Arctic. To explain the delayed influence, a scheme of transferring the influence of SST anomalies with the participation of atmospheric and oceanic circulation is proposed (Figure 2). The scheme is based on existing ideas about the circulation of the ocean and atmosphere in the North Atlantic region of the Northern Hemisphere.
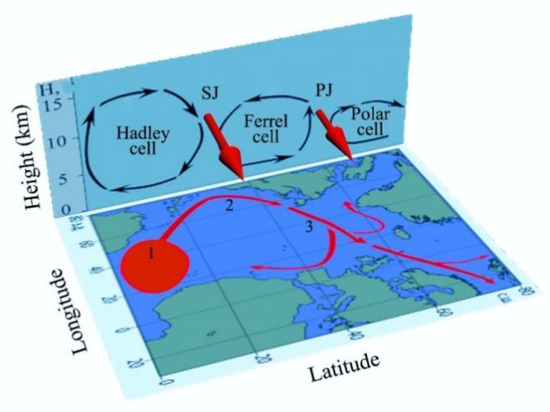
Figure 2.
The scheme of SST influence spreading from the North Atlantic tropics to the Arctic.
The scheme takes into account joint influence of SST anomalies in the low latitudes of the oceans on atmospheric circulation modes and the ocean circulation system in the North Atlantic. It is assumed that SST anomalies at low latitudes reinforce the Hadley and Ferrel atmospheric circulation cells, increase in the poleward atmospheric transport, weaken the NAO, which contributes to a decrease in heat loss by the ocean and, all together, increases the oceanic heat transport by the Gulfstream, North Atlantic, West Spitsbergen, and Norwegian currents. The final link in the scheme is the strengthening of the oceanic heat influx to the Norwegian and Barents Seas and atmospheric transport to the Arctic.
The effect of the SST anomalies on the influx of Atlantic water (AW) into the Barents Sea is confirmed by the correlation between SST in the North Atlantic tropics and water temperature at the section along the Kola meridian (Tkm) (Figure 3), which is a representative indicator of the AW influx [18]. Tkm—is the water temperature in the layer of 50–200 m in December–February, when the heat flux from above is excluded and the heat flux from the water into the atmosphere weakly affects the flux temperature in the 50–200 m layer.
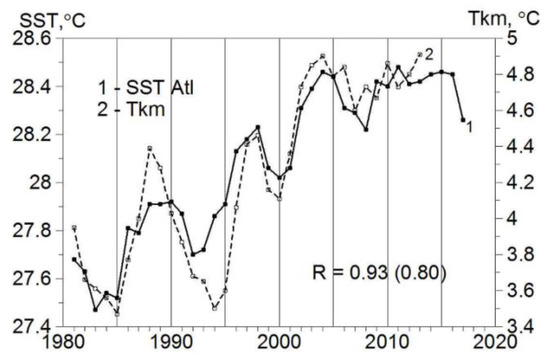
Figure 3.
Anomalies of SST in the low latitudes of the North Atlantic in October (1) and water temperature in the 50–200 m layer at the section along the Kola meridian in the Barents Sea in December–February (2). The series is smoothed with a 3-year window and normalized. The lag (27 months) between the series is taken into account. R—correlation coefficient between series (1) and (2). In brackets—between no smoothed series.
Water temperature in the Barents Sea (Tkm) and SST anomalies in the Atlantic and Indian oceans correlate with the coefficients 0.76 and 0.74, accordingly, with the same lag of 27 months. This means that the effect of the SST anomalies is transmitted through the same atmospheric circulation mode, affecting oceanic heat transfer in the North Atlantic. Such a circulation mode is the North Atlantic Oscillation (NAO), changing under the influence of the SST anomalies in the Atlantic, Indian, and Pacific Oceans [53,54,55,56]. Negative correlation between SST anomalies in all three ocean analyses and indices of the North Atlantic Oscillation confirms the special role of NAO in the transmission of the influence of low-latitude SST. The most noticeable correlation (equal to −0.68) is noted between the annual SST in the Atlantic area and annual NAO index. The correlation coefficient between mean annual SST in the Indian Ocean and annual NAO is −0.49. For the Pacific Ocean, the correlation between SST and NAO is also negative, but non-significant.
Ding et al. (2014) [44] showed that the modern warming in northeastern Canada and Greenland is associated with a negative NAO trend, which, in turn, reflects the increase in Rossby waves originating in the tropical Pacific Ocean. Earlier Hoerling et al. (2001) [54] noted a negative relationship between SST anomalies in low latitudes of the ocean and the NAO index. We found that the return relation between the NAO and SST in the North Atlantic is more notable at the lowest and highest annual NAO values (Figure 4a,b).
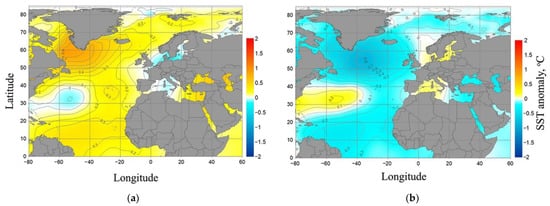
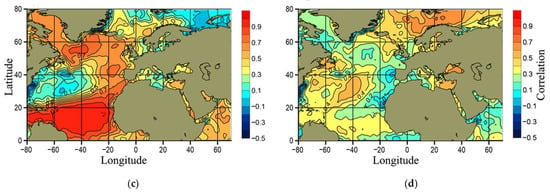
Figure 4.
Correlation between annual SST anomalies in the tropics of the North Atlantic, NAO, and SST in the rest of the North Atlantic. Upper panel—composites of annual mean SST anomalies corresponding to anomalous mean annual values of the NAO index in 1950–2015: (a) SST with anomalous negative NAO indices, (b) with anomalous positive NAOs. The lower panel shows correlations between annual SST anomalies in the tropical region of the North Atlantic and annual SST anomalies throughout the entire water area in 1980–2015, (c) synchronous correlation, (d) with a lag of 3 years relative to SST in the tropics.
Figure 4 demonstrates that the negative NAO index corresponds to the positive SST anomalies. With anomalous positive NAO indexes, the SST anomalies are negative (Figure 4b). This correspondence is explained by excitation by positive SST anomalies in the low latitudes of negative NAO phase. Negative NAO is characterized by weakening of zonal wind component over the North Atlantic and positive SST anomalies formation throughout the entire water area of the North Atlantic. With the negative SST anomalies in the low latitudes and the positive NAO index the zonal wind is amplified, which contributes to the cooling of the ocean and the formation of a negative SST anomaly.
The positive SST anomalies in the tropics of the North Atlantic, corresponding to the negative NAO index and positive SST anomalies in the region north of 40° N (Figure 4c), appear in the Norwegian and Barents Seas three years later (Figure 4d). This is consistent with the changes in the Atlantic Water temperature at the Kola section in the Barents Sea and average annual NAO index (Figure 5).
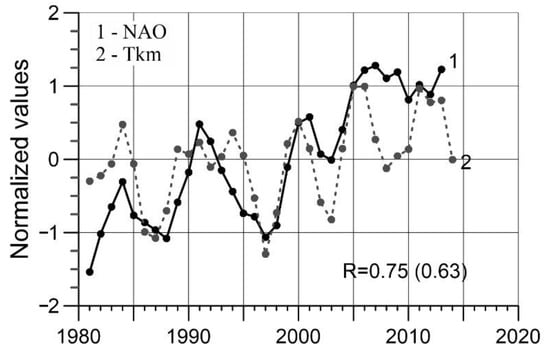
Figure 5.
Normalized average annual values of the NAO (1) and water temperature in 50–200 m layer at section along the Kola meridian in the Barents Sea (2). R is the correlation coefficient between (1) and (2), in parentheses is the correlation coefficient between no smoothed series. The timeline corresponds to temperature changes, changes in NAO are shifted by 3 years ahead.
Note that there is no direct heat transfer from the tropics. Transport is carried out by interaction between atmospheric circulation (NAO) and oceanic circulation responding to SST anomalies in the tropical Atlantic. The NAO is also influenced by the tropics of the Indian and Pacific Oceans [53,54,55,56]. In Figure 4 and Figure 5, the annual averages are used, since the effect of HAO is more noticeable on the annual averages. The rest of Figure 6, Figure 7, Figure 8, Figure 9 and Figure 10—seasonal and monthly averages are used.

Figure 6.
Variations of atmospheric parameters and sea ice in the Arctic in 1980–2020. (a) STRD in winter (1) and SDDF (2); (b) SDDF (1) and Vol (2)—the volume of ice in the Arctic Ocean in April; (c) SDDF (1) and SIE 9 from NSIDC. Series smoothed with a 3-year window. R—the correlation coefficients between series (1) and (2), in brackets—between no smoothed series.
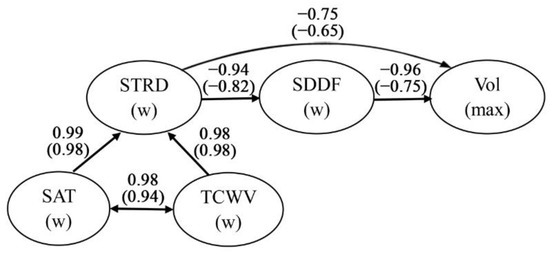
Figure 7.
Graph correlations between the characteristics of the atmosphere and sea ice in the Arctic for 1979–2020. The numbers above the arrows are the correlation coefficients between the parameters, which are indicated within the ellipses. In brackets, there is the coefficient between the series with the removed trend.
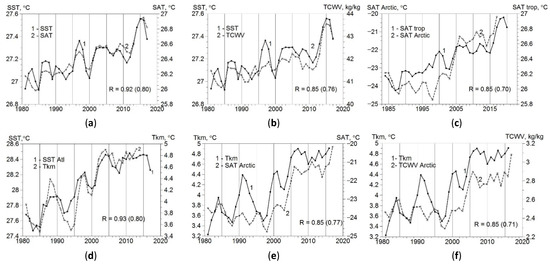
Figure 8.
Variations of SST, atmospheric parameters at low latitudes and SST, sea ice, atmospheric parameters in the Arctic. Upper panel (a) 1—SST (10° S–10° N, August), 2—SAT (0–25° N, October); (b) 1—SST (10° S–10° N, August), 2—TCWV (0–25° N, October); (c) 1—SAT (0–25° N, October), 2—SAT (70–87.5° N). Lower panel: (d) 1—SST (Atl (5–25° N, 60–20° W), 2—Tkm; (e) 1—Tkm; 2—SAT (70–87.5° N); (f) 1—Tkm; 2—TCWV (70–87.5° N). Series are smoothed with a 3-year window. R—correlation coefficient, in brackets—between unsmoothed series.
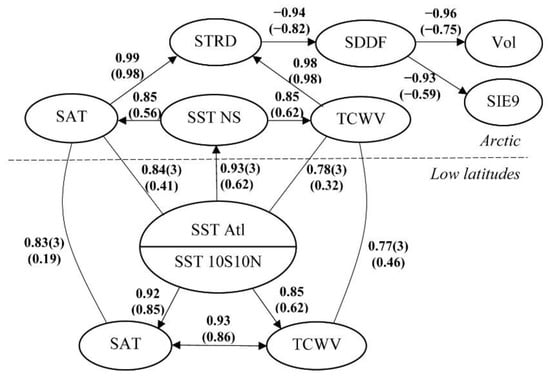
Figure 9.
Graph of correlations relating the rise of SST at low latitudes and declines in maximum sea ice in the Arctic. In brackets, there is the coefficient between the series with the removed trend.
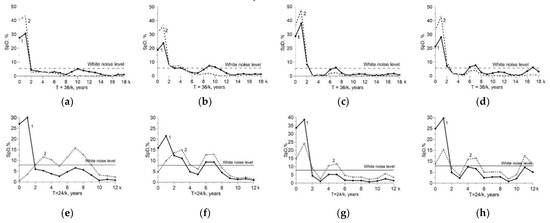
Figure 10.
Spectral densities (SpD) of variability of climate characteristics at low latitudes and in the Arctic before and after smoothing with a window of 3 years, and before and after the removal of trends. Upper row: SpD before (1) and after (2—dotted line) smoothing (a) SAT in the region of 0–25° N in autumn, (b) TCWV in the region of 0–25° N in autumn, (c) SAT in the area of 70–87.5° N in winter, (d) TCWV in the area of 70–87.5° N in winter). Lower row: SpD before (1) and after (2—dotted line) the removal of the trend (e) SAT in the area of 0–25° N in autumn, (f) TCWV in the area of 0–25° N in autumn, (g) SAT in the area of 70–87.5° N in winter, (h) TCWV in the area of 70–87.5° N in winter.
3.3. Effect of Arctic Warming on Sea Ice
The increase of the surface thermal radiation downwards (STRD) under the influence of the influx of heat and water vapor slows down the sea ice growth in winter. The characteristics of this process are the total content of water vapor (TCWV) in the atmosphere, the surface thermal radiation downwards (STRD), and the sum of degree-days with frost (SDDF) at the surface, which are closely related to each other and to the parameters of the ice cover (Figure 6).
Close connection between changes in the parameters of the atmosphere and sea ice can be represented in the form of a graph of correlations (Figure 7).
Figure 7 presents a reduced description of reliance of the sea ice growth and the maximum sea ice volume in April from the climatic changes. The impact is approximated by the sum degree-days of frost (SDDF), changing under the influence of the surface thermal radiation downwards (STRD). STRD, in turn, depends on the changes in the total content of water vapor (TCWV) and surface air temperature (SAT). The direction of the influence is indicated by the arrow, and the result of it—by correlation coefficient above the arrow. The transitivity of correlations means that the result of the consecutive impacts (multiplications of correlations) could not be higher, in absolute magnitude, than the direct correlation between the initial impact and the final result, because of the influence of unaccounted factors and noise.
The figure shows that more than 50% of interannual variability of maximum sea ice volume is connected with the change of the surface thermal radiation downwards. Change in STRD in the Arctic almost completely depends on the change in the air temperature and the total content of water vapor in the atmosphere, liable to the impact of fluxes from the low latitudes. The results of the study on this impact and the role of SST in the formation of it are presented in the following section.
3.4. Influence SST in Low Latitudes on Arctic Warming and Sea Ice
In Section 3.2, the scheme of transferring the influence of SST in the low latitudes on the heat and moisture transport to the Arctic is proposed. According to the scheme, the increase of SST in the low latitudes leads to an increase in the circulation of the atmosphere and the ocean facilitates the transfer of warmer and more humid air and warmed water to high latitudes. Comparison of the changes in ocean surface temperature and atmospheric parameters at low latitudes with the changes in SST, the sea ice, and the atmospheric parameters at high latitudes, confirms this relationship (Figure 8).
The relationships between climatic changes at low latitudes and in the Arctic are presented at Figure 9 as a generalized graph of correlations. The graph shows the influence of the SST increasing at low latitudes on the reduction of the winter volume of sea ice and warming in the Arctic.
The parameters of atmosphere and ocean are indicated in the ellipses on the scheme. The changes in the parameters are connected to each other. The connections are indicated by arrows with the corresponding correlation coefficients. The lags (in years) are placed in brackets close to the correlation coefficients. The lines without arrows represent the formal correlations between the parameters. The series of correlated parameters are smoothed by the running average with a time lag of 3 years.
In the center of the scheme in Figure 9, there is SST in the low latitudes, presented by SST in the equatorial area 10° S–10° N in August, which defines the changes in temperature and water vapor in the area 0–25° N in October, and by SST in the tropical part of the North Atlantic (5–25° N, 60–20° W) in October. Water from this part of the North Atlantic, in accordance with Figure 3), reaches the Norwegian, Barents, and Greenland Seas (North Seas) and effects on the SST changes in winter 27 month later (on the third year). The indicator of the SST changes is the water temperature in the layer 50–200 m at the section along Kola meridian in December–January. The following increase of the air temperature and the water vapor content in the Arctic contributes to the rise of longwave radiation flux to the ice and snow surface, the decrease of the sum of negative air temperatures, and the reduction of winter ice growth. The correlations between the smoothed series of atmospheric and oceanic parameters were used for the construction of the graph. A similar graph was constructed by the use of correlations between no smoothed series. The correlations values appeared to be 0.10–0.20 lower, while remaining significant at the 95% level of confidence with the same lags.
4. Discussion
4.1. Statistical Analysis of Climate Variability
Correlation analysis usually requires removing the trend from the compared series. However, the main part of the climatic parameter variability accounts for the trends where removing deprives of ‘sense’ in the series comparison. In statistics, the case of functional dependence between compared variables is considered, which does not require the exclusion of trends while assessing the parameters of the connection between them [57]. The simplest method of assessment of the functional dependence is the regression model.
We did not remove trends from the climatic series by pair correlation as there is a functional relationship between climate changes at low latitudes and in the Arctic. It arises from the exchange between areas of positive and negative radiation balance on the globe. Deviations from strict functional dependence are caused by the presence of the noise that take into account, for example, a regression model. Correlation is an approximate estimate of the regression dependence, since the square of the correlation coefficient (without removing the trend) is equal to the coefficient of determination of the regression equation.
Trend and interannual fluctuations together make up climatic variability. Moreover, the trend does not affect the time lag that really exists between fluctuations. The relationship between trends is a functional part of the relationship between latitudes. The time lag in this case cannot be taken into account. We calculated correlations without trends and supplemented the graphs with estimates of correlations after excluding trends. All correlations remained significant and the time lag between the compared variables remained. However, the exclusion of trends also excludes a significant part of the interannual fluctuations of the longest periods.
Comparison of the spectral densities of climatic series and coherence between ones before and after detrending (Figure 10e–h, and Table 2) reveals that removing the trend from the series of climatic parameters at low latitudes remove long-term changes, and short-term fluctuations at low latitudes and in the Arctic are weakly related to each other. For example, the variability of TCWV at low latitudes after excluding the trend remains 15%, and in the variability of SST, about 50%.

Table 2.
Coherence between climatic variables before (Initial) and after (Detrend) removing trend.
Spectral analysis was also used to determine the border between the climatic signal and weather noise and the effect of removing the noise. Based on these results, we applied the running average of climatic series with a window of 3 years to pick out the climatic signal (Figure 10a–d). Calculations of the spectral density of the initial and smoothed series show the main contribution of periods of more than 16 years (up to 70%) to the variability of the considered climate characteristics and a small contribution of periods less than 3 years (Figure 10a–d). From the calculations of frequency correlation (coherence, Table 2), it follows that, changes with periods of more than 16 years are closely related to each other in the compared series, in contrast to short-period fluctuations.
4.2. Comparison of the Recent Researches Results
Analysis of the results of CMIP6 22 models showed [58] that most of the models underestimated the observed average temperature in the Arctic in the period 1979–2014. The largest shifting is observed above the Norwegian, Barents, and Kara seas, connected with the underestimation of heat transport from the Atlantic in the models. Our results determine the dependence of the warming in these regions from the warming in the tropics of the North Atlantic and identify the mechanism of this dependence (Figure 9).
Hall et al. (2021) [36] confirmed the connection between the tropics and west Arctic in the synoptic scales. In the Atlantic part of the Arctic, the influence of the cyclones from the adjacent zones of the North Atlantic and North Seas prevails. This influence was presented also on our scheme (Figure 9). Papritz et al. (2021) [59] also confirm that the main source of moisture for the Arctic is the area of North Seas and adjacent part of the North Atlantic.
4.3. The Reasons of the SST Increasing at the Low Latitudes
CMIP models underestimate the positive tendencies of ocean warming in the low latitudes where most of the heat of the solar radiation accumulates [39,40,41,42]. As a result, global coupled models with less confidence represent the special aspects of climate change in particular regions of middle and high latitudes than the models of atmospheric circulation with the observed warming in the tropic oceans [24,43,44]. The reasons for the inconsistency of the simulate and the observed warming in the tropical oceans are founded in the fact that some important processes in the tropics are not considered in the coupled models [24], or the models underestimate the inner variability [41]. However, Yang et al. (2021) [60] presented that the CMIP6 models demonstrate the increase of SST variability in the North Atlantic tropics with continuation of the warming.
A possible reason for the discrepancies is the supposed absence of a positive trend of insolation of low-latitude in global models. It is known that the greatest amount of solar radiation enters the low latitudes of the Earth, and one grows [61,62,63]. These changes in insolation, as the result of Earth orbital dynamics, are not large. Their impacts intensify the heat accumulation in the ocean; that is, the largest part of the low latitudes area, low albedo of the ocean surface, non-linear feedback between temperature, content of water vapor, and downward longwave radiation. As a result, the positive trend of the insolation in the spring and in the early summer is accompanied by a notable increase of the SST in the autumn (up to 50% of the observed SST trend), air temperature, water vapor content, and downward longwave radiation in the autumn [64]. Finally, in accordance with Figure 8 and the scheme in Figure 9, these changes are evident, such as sea ice reduction and warming in the Arctic in the third year.
5. Conclusions
In this paper, the climatic coherence among SST increasing, air temperature, and water vapor content in the low latitudes, and reduction of the sea ice in the Arctic, was, for the first time, quantitatively assessed.
The ocean areas in the low latitudes where SST impacts the atmospheric and oceanic transport to the Arctic are highlighted.
The scheme of transferring the SST anomaly influences, with participation of the atmospheric and oceanic circulation, is proposed. The scheme takes into account the current understanding on the ocean and atmosphere circulation in the North Atlantic region.
The influence of SST anomalies in the tropics of the North Atlantic on the Atlantic water inflow into the Nordic Seas was confirmed, for the first time, by high correlation between SST and the water temperature along the section at Kola meridian in the Barents Sea, which is the representative indicator of change in the Atlantic water inflow.
The impact of SST is transferred with the North Atlantic Oscillation participation, which is changing under influence of SST anomalies in the Atlantic, Indian, and Pacific oceans. This is confirmed by negative correlation between SST anomalies in all three oceans and NAO indexes. The invert correlation between NAO and SST in the North Atlantic is mostly notable with the lowest and the highest annual values of NAO. The tropics of the Pacific Ocean have a much weaker influence on the Arctic compared to the Atlantic.
The positive anomalies of SST in the low latitudes contribute to the negative NAO phase when the zonal wind component above the North Atlantic weakens and the positive SST anomaly is formed at all water areas of the North Atlantic. With the negative SST anomaly in the low latitudes and positive NAO index, the zonal wind strengthens, which leads to the ocean cooling and negative SST anomaly formation. The positive SST anomalies in the tropics of the North Atlantic appeared in the Norwegian and Barents seas three years later.
More than 70% of interannual variability of the maximum sea ice volume in the Arctic Ocean is connected with the changes in downward longwave radiation. Its changes in the Arctic almost fully depend on the changes in the air temperature and water vapor content in the atmosphere, which are under influence of inflows from the low latitudes.
The coherence between climate change in the low latitudes and in the Arctic is quantitatively presented in the form of a correlation graph. The correlations allow to estimate the impact of SST increase in the low latitudes on the reduction of winter sea ice volume and warming in the Arctic. The correlations between the series of smoothed values of the atmosphere and ocean parameters were used for the construction of the graph. A similar scheme was conducted based on the correlations between the unsmoothed series. The correlation values appeared to be 0.10–0.20 lower, while remaining significant at a 95% confidence level with the same delays.
The performed research confirms the special significance of the SST increase in the low latitudes for the warming amplification and sea ice reduction in the Arctic and specifies the direction of further research and global climate model enhancement. The first priority is to study the role of the long-term insolation rise at low latitudes in the spring and summer months, in SST increase, by the use of astronomic calculations of insolation, reanalysis data and compare with the CMIP5 and CMIP6 global model simulated results.
Author Contributions
Conceptualization, G.V.A.; methodology, G.V.A.; formal analysis, G.V.A., N.I.G., A.E.V., N.E.K. and M.Y.K.; resources, N.I.G., A.E.V., N.E.K. and M.Y.K.; data curation, N.I.G., A.E.V., N.E.K. and M.Y.K.; supervision, G.V.A.; writing—original draft preparation, G.V.A.; writing—review and editing, G.V.A., visualization, N.I.G. and A.E.V. All authors have read and agreed to the published version of the manuscript.
Funding
This research was funded by the Russian Foundation for Basic Research (RFBR), grant number 18-05-00334, 18-05-60107.
Acknowledgments
The authors are grateful to the reviewers for the attention and comments that contributed to a clearer presentation of the results.
Conflicts of Interest
The authors declare no conflict of interest.
References
- Oort, A.H. Year-to-year variations in the energy balance of the arctic atmosphere. J. Geophys. Res. 1974, 79, 1253–1260. [Google Scholar] [CrossRef]
- Nakamura, N.; Oort, A.H. Atmospheric heat budgets of the polar regions. J. Geophys. Res. 1988, 93, 9510–9524. [Google Scholar] [CrossRef]
- Serreze, M.C.; Barrett, A.P.; Slater, A.G.; Steele, M.; Zhang, J.; Trenberth, K.E. The large-scale energy budget of the Arctic. J. Geophys. Res. Atmos. 2007, 112, D11122. [Google Scholar] [CrossRef]
- Hwang, Y.T.; Frierson, D.M.W.; Kay, J.E. Coupling between Arctic feedbacks and changes in poleward energy transport. Geophys. Res. Lett. 2011, 38, 1–5. [Google Scholar] [CrossRef]
- Kay, J.E.; Holland, M.M.; Bitz, C.M.; Blanchard-Wrigglesworth, E.; Gettelman, A.; Conley, A.; Bailey, D. The influence of local feedbacks and northward heat transport on the equilibrium arctic climate response to increased greenhouse gas forcing. J. Clim. 2012, 25, 5433–5450. [Google Scholar] [CrossRef]
- Koenigk, T.; Brodeau, L.; Graversen, R.G.; Karlsson, J.; Svensson, G.; Tjernström, M.; Willén, U.; Wyser, K. Arctic climate change in 21st century CMIP5 simulations with EC-Earth. Clim. Dyn. 2013, 40, 2719–2743. [Google Scholar] [CrossRef]
- Graversen, R.G. Do changes in the midlatitude circulation have any impact on the Arctic surface air temperature trend? J. Clim. 2006, 19, 5422–5438. [Google Scholar] [CrossRef]
- Sang, X.; Yang, X.; Tao, L.; Fang, J.; Sun, X. Decadal changes of wintertime poleward heat and moisture transport associated with the amplified Arctic warming. Clim. Dyn. 2021. [Google Scholar] [CrossRef]
- Mayer, M.; Haimberger, L. Poleward atmospheric energy transports and their variability as evaluated from ECMWF reanalysis data. J. Clim. 2012, 25, 734–752. [Google Scholar] [CrossRef]
- Alekseev, G.; Kuzmina, S.; Bobylev, L.; Urazgildeeva, A.; Gnatiuk, N. Impact of atmospheric heat and moisture transport on the Arctic warming. Int. J. Climatol. 2019, 39, 1–11. [Google Scholar] [CrossRef]
- Cao, Y.; Liang, S.; Chen, X.; He, T.; Wang, D.; Cheng, X. Enhanced wintertime greenhouse effect reinforcing Arctic amplification and initial sea-ice melting. Sci. Rep. 2017, 7, 8462. [Google Scholar] [CrossRef] [PubMed]
- Lee, S.; Gong, T.; Feldstein, S.B.; Screen, J.A.; Simmonds, I. Revisiting the cause of the 1989–2009 Arctic surface warming using the surface energy budget: Downward infrared radiation dominates the surface fluxes. Geophys. Res. Lett. 2017, 44, 10.654–10.661. [Google Scholar] [CrossRef]
- Yu, L.; Zhong, S.; Zhou, M.; Lenschow, D.H.; Sun, B. Revisiting the linkages between the variability of atmospheric circulations and Arctic melt-season sea ice cover at multiple time scales. J. Clim. 2019, 32, 1461–1482. [Google Scholar] [CrossRef]
- Sandø, A.B.; Gao, Y.; Langehaug, H.R. Poleward ocean heat transports, sea ice processes, and Arctic sea ice variability in NorESM1-M simulations. J. Geophys. Res. Ocean. 2014, 119, 2095–2108. [Google Scholar] [CrossRef]
- Årthun, M.; Eldevik, T. On anomalous ocean heat transport toward the Arctic and associated climate predictability. J. Clim. 2016, 29, 689–704. [Google Scholar] [CrossRef]
- Årthun, M.; Eldevik, T.; Smedsrud, L.H. The role of Atlantic heat transport in future Arctic winter sea ice loss. J. Clim. 2019, 32, 3327–3341. [Google Scholar] [CrossRef]
- Alekseev, G.V.; Glok, N.I.; Smirnov, A.V.; Vyazilova, A.E. The influence of the North Atlantic on climate variations in the Barents Sea and their predictability. Russ. Meteorol. Hydrol. 2016, 41, 544–558. [Google Scholar] [CrossRef]
- Boitsov, V.D.; Karsakov, A.L.; Trofimov, A.G. Atlantic water temperature and climate in the Barents Sea, 2000–2009. ICES J. Mar. Sci. 2012, 69, 833–840. [Google Scholar] [CrossRef]
- Huang, J.; Mcelroy, M.B. Contributions of the Hadley and Ferrel circulations to the energetics of the atmosphere over the past 32 years. J. Clim. 2014, 27, 2656–2666. [Google Scholar] [CrossRef]
- Gong, T.; Feldstein, S.; Lee, S. The role of downward infrared radiation in the recent arctic winter warming trend. J. Clim. 2017, 30, 4937–4949. [Google Scholar] [CrossRef]
- Wiese, W.U. The reasons of Arctic warming. Sov. Arct. 1937, 1, 1–7. (In Russian) [Google Scholar]
- Yoo, C.; Lee, S.; Feldstein, S.B. Arctic response to an MJO-like tropical heating in an idealized GCM. J. Atmos. Sci. 2012, 69, 2379–2393. [Google Scholar] [CrossRef]
- Compo, G.P.; Sardeshmukh, P.D. Oceanic influences on recent continental warming. Clim. Dyn. 2009, 32, 333–342. [Google Scholar] [CrossRef]
- Shin, S.I.; Sardeshmukh, P.D. Critical influence of the pattern of Tropical Ocean warming on remote climate trends. Clim. Dyn. 2011, 36, 1577–1591. [Google Scholar] [CrossRef]
- Perlwitz, J.; Hoerling, M.; Dole, R. Arctic tropospheric warming: Causes and linkages to lower latitudes. J. Clim. 2015, 28, 2154–2167. [Google Scholar] [CrossRef]
- Hao, X.; He, S.; Han, T.; Wang, H. Impact of global oceanic warming on winter Eurasian climate. Adv. Atmos. Sci. 2018, 35, 1254–1264. [Google Scholar] [CrossRef]
- Palmer, M.D.; Haines, K.; Tett, S.F.B.; Ansell, T.J. Isolating the signal of ocean global warming. Geophys. Res. Lett. 2007, 34, 1–6. [Google Scholar] [CrossRef]
- Intergovernmental Panel on Climate Change. IPCC: Climate Change 2014: Synthesis Report. Contribution of Working Groups I, II and III to the Fifth Assessment Report of the Intergovernmental Panel on Climate Change; Pachauri, R.K., Meyer, L.A., Eds.; IPCC: Geneva, Switzerland, 2014. [Google Scholar]
- Adam, O.; Schneider, T.; Harnik, N. Role of changes in mean temperatures versus temperature gradients in the recent widening of the Hadley circulation. J. Clim. 2014, 27, 7450–7461. [Google Scholar] [CrossRef]
- Garfinkel, C.I.; Waugh, D.W.; Polvani, L.M. Recent Hadley cell expansion: The role of internal atmospheric variability in reconciling modeled and observed trends. Geophys. Res. Lett. 2015, 42, 10824–10831. [Google Scholar] [CrossRef]
- Lee, S.; Gong, T.; Johnson, N.; Feldstein, S.B.; Pollard, D. On the possible link between tropical convection and the northern hemisphere arctic surface air temperature change between 1958 and 2001. J. Clim. 2011, 24, 4350–4367. [Google Scholar] [CrossRef]
- Park, H.S.; Lee, S.; Son, S.W.; Feldstein, S.B.; Kosaka, Y. The impact of poleward moisture and sensible heat flux on arctic winter sea ice variability. J. Clim. 2015, 28, 5030–5040. [Google Scholar] [CrossRef]
- Ye, K.; Wu, R.; Liu, Y. Interdecadal change of Eurasian snow, surface temperature, and atmospheric circulation in the late 1980s. J. Geophys. Res. Atmos. 2015, 120, 2738–2753. [Google Scholar] [CrossRef]
- Wettstein, J.J.; Deser, C. Internal variability in projections of twenty-first-century Arctic sea ice loss: Role of the large-scale atmospheric circulation. J. Clim. 2014, 27, 527–550. [Google Scholar] [CrossRef]
- Goss, M.; Feldstein, S.B.; Lee, S. Stationary wave interference and its relation to tropical convection and Arctic warming. J. Clim. 2016, 29, 1369–1389. [Google Scholar] [CrossRef]
- Hall, R.J.; Hanna, E.; Chen, L. Winter Arctic Amplification at the synoptic timescale, 1979–2018, its regional variation and response to tropical and extratropical variability. Clim. Dyn. 2021, 56, 457–473. [Google Scholar] [CrossRef]
- Yoo, C.; Feldstein, S.; Lee, S. The impact of the Madden-Julian Oscillation trend on the Arctic amplification of surface air temperature during the 1979–2008 boreal winter. Geophys. Res. Lett. 2011, 38, 1–6. [Google Scholar] [CrossRef]
- Hurrell, J.W.; Kushnir, Y.; Ottersen, G.; Visbeck, M. The North Atlantic Oscillation: Climate Significance and Environmental Impact; American Geophysical Union: Washington, DC, USA, 2003; Volume 134. [Google Scholar]
- Palmer, M.D.; Good, S.A.; Haines, K.; Rayner, N.A.; Stott, P.A. A new perspective on warming of the global oceans. Geophys. Res. Lett. 2009, 36, 1–5. [Google Scholar] [CrossRef]
- Bilbao, R.A.F.; Gregory, J.M.; Bouttes, N.; Palmer, M.D.; Stott, P. Attribution of ocean temperature change to anthropogenic and natural forcings using the temporal, vertical and geographical structure. Clim. Dyn. 2019, 53, 5389–5413. [Google Scholar] [CrossRef]
- Laepple, T.; Huybers, P. Global and regional variability in marine surface temperatures. Geophys. Res. Lett. 2014, 41, 2528–2534. [Google Scholar] [CrossRef]
- IPCC Working Group I; Stocker, T.F.; Qin, D.; Plattner, G.-K.; Tignor, M.; Allen, S.K.; Boschung, J.; Nauels, A.; Xia, Y.; Bex, V.; et al. IPCC, 2013: Climate Change 2013: The Physical Science Basis. Contribution of Working Group I to the Fifth Assessment Report of the Intergovernmental Panel on Climate Change. In Proceedings of the IPCC; Stocker, T., Qin, D., Plattner, G.K., Tignor, M., Allen, S.K., Boschung, J., Nauels, A., Xia, Y., Bex, V., Midgley, P.M., Eds.; Cambridge University Press: Cambridge, UK, 2013; Volume AR5, p. 1535. [Google Scholar]
- Barsugli, J.J.; Shin, S.-I.; Sardeshmukh, P.D. Sensitivity of global warming to the pattern of tropical ocean warming. Clim. Dyn. 2006, 27, 483–492. [Google Scholar] [CrossRef]
- Ding, Q.; Wallace, J.M.; Battisti, D.S.; Steig, E.J.; Gallant, A.J.E.; Kim, H.J.; Geng, L. Tropical forcing of the recent rapid Arctic warming in northeastern Canada and Greenland. Nature 2014, 509, 209–212. [Google Scholar] [CrossRef] [PubMed]
- Shu, Q.; Wang, Q.; Su, J. Assessment of the Atlantic water layer in the Arctic Ocean in CMIP5 climate models. Clim. Dyn. 2019, 53, 5279–5291. [Google Scholar] [CrossRef]
- Long, M.; Zhang, L.; Hu, S.; Qian, S. Multi-Aspect assessment of CMIP6 models for Arctic sea ice simulation. J. Clim. 2021, 34, 1515–1529. [Google Scholar] [CrossRef]
- Dee, D.P.; Uppala, S.M.; Simmons, A.J.; Berrisford, P.; Poli, P.; Kobayashi, S.; Andrae, U.; Balmaseda, M.A.; Balsamo, G.; Bauer, P.; et al. The ERA-Interim reanalysis: Configuration and performance of the data assimilation system. Q. J. R. Meteorol. Soc. 2011, 137, 553–597. [Google Scholar] [CrossRef]
- Rayner, N.A.; Parker, D.E.; Horton, E.B.; Folland, C.K.; Alexander, L.V.; Rowell, D.P.; Kent, E.C.; Kaplan, A. Global analysis of sea surface temperature, sea ice, and night marine air temperature since the late nineteenth century. J. Geophys. Res. 2003, 108, 1–20. [Google Scholar] [CrossRef]
- Kulakov, M.Y.; Makshtas, A.P.; Shutilin, S.V. AARI–IOCM—Coupled ice-ocean circulation model for the Arctic ocean. Arct. Antarct. Res. 2012, 2, 6–18. [Google Scholar]
- Kulakov, M.Y.; Demchev, D.M. Simulation of iceberg drift as a component of ice monitoring in the West Arctic. Russ. Meteorol. Hydrol. 2015, 40, 807–813. [Google Scholar] [CrossRef]
- Blackman, R.B.; Tukey, J.W. The measurement of power spectra from the point of view of communications engineering—Part I. Bell Syst. Tech. J. 1958, 37, 185–282. [Google Scholar] [CrossRef]
- Blackman, R.B.; Tukey, J.W. The measurement of power spectra from the point of view of communications engineering—Part II. Bell Syst. Tech. J. 1958, 37, 485–569. [Google Scholar] [CrossRef]
- Robertson, A.W.; Mechoso, C.R.; Kim, Y.J. The influence of Atlantic sea surface temperature anomalies on the North Atlantic oscillation. J. Clim. 2000, 13, 122–138. [Google Scholar] [CrossRef]
- Hoerling, M.P.; Hurrell, J.W.; Xu, T. Tropical origins for recent North Atlantic climate change. Science 2001, 292, 90–92. [Google Scholar] [CrossRef] [PubMed]
- Sutton, R.T.; Hodson, D.L.R. Influence of the ocean on north Atlantic climate variability 1871–1999. J. Clim. 2003, 16, 3296–3313. [Google Scholar] [CrossRef]
- Nesterov, E.S. The North Atlantic Oscillation: The Atmosphere and the Ocean; Triada LTD.: Moscow, Russia, 2013. [Google Scholar]
- Kendall, M.; Stuart, A. The Advanced Theory of Statistics: Vol. 2-Inference and Relationship, 2nd ed.; Charles Griffin and Co.: London, UK, 1967. [Google Scholar]
- Cai, Z.; You, Q.; Wu, F.; Chen, H.W.; Chen, D.; Coh, J. Arctic warming revealed by multiple CMIP6 models: Evaluation of historical simulations and quantification of future projection uncertainties. J. Clim. 2021, 34, 4871–4892. [Google Scholar] [CrossRef]
- Papritz, L.; Hauswirth, D.; Hartmuth, K. Moisture origin, transport pathways, and driving processes of intense wintertime moisture transport into the Arctic. Weather Clim. Dyn. Discuss. [preprint]. 2021. [Google Scholar] [CrossRef]
- Yang, Y.; Wu, L.; Guo, Y.; Gan, B.; Cai, W.; Huang, G.; Li, X.; Geng, T.; Jing, Z.; Li, S.; et al. Greenhouse warming intensifies north tropical Atlantic climate variability. Sci. Adv. 2021, 7, eabg9690. [Google Scholar] [CrossRef]
- Borisenkov, Е.Р.; Tsvetkov, A.V.; Agaponov, S.V. On some characteristics of insolation changes in the past and the future. Clim. Change 1983, 5, 237–244. [Google Scholar] [CrossRef]
- Borisenkov, E.P.; Tsvetkov, A.V.; Eddy, J.A. Combined Effects of Earth orbit perturbations and solar activity oп terrestrial insolation. Part 1: Sample days and annual mean values. J. Atmos. Sci. 1985, 42, 933–940. [Google Scholar] [CrossRef][Green Version]
- Fedorov, V.M. Interannual variability of the solar constant. Sol. Syst. Res. 2012, 46, 170–176. [Google Scholar] [CrossRef]
- Alekseev, G.V.; Glok, N.I.; Vyazilova, A.E.; Kharlanenkova, N.E. Climate change in the Arctic: Causes and mechanisms. IOP Conf. Ser. Earth Environ. Sci. 2020, 606, 012002. [Google Scholar] [CrossRef]
Publisher’s Note: MDPI stays neutral with regard to jurisdictional claims in published maps and institutional affiliations. |
© 2021 by the authors. Licensee MDPI, Basel, Switzerland. This article is an open access article distributed under the terms and conditions of the Creative Commons Attribution (CC BY) license (https://creativecommons.org/licenses/by/4.0/).