Article

Geometry Optimization of Heaving Axisymmetric Point Absorbers under Parametrical Constraints in Irregular Waves

School of Mechanical Engineering, Southeast University, Nanjing 211189, China
J. Mar. Sci. Eng. 2021, 9(10), 1136; https://doi.org/10.3390/jmse9101136
Submission received: 3 September 2021 / Revised: 13 October 2021 / Accepted: 14 October 2021 / Published: 16 October 2021
(This article belongs to the Section Ocean Engineering)

Abstract

:
The objective of this work is to identify the maximum absorbed power and optimal buoy geometry of a heaving axisymmetric point absorber for a given cost in different sea states. The cost of the wave energy converter is estimated as proportional to the displaced volume of the buoy, and the buoy geometry is described by the radius-to-draft ratio. A conservative wave-height-dependent motion constraint is introduced to prevent the buoy from jumping out of the free surface of waves. The constrained optimization problem is solved by a two-nested-loops method, within which a core fundamental optimization process employs the MATLAB function fmincon. Results show that the pretension of the mooring system should be as low as possible. Except for very small energy periods, the stiffness of both the power take-off and mooring system should also be as low as possible. A buoy with a small radius-to-draft ratio can absorb more power, but at the price of working in more energetic seas and oscillating at larger amplitudes. In addition, the method to choose the optimal buoy geometry at different sea states is provided.

1. Introduction

Wave energy conversion has been extensively studied since the energy crisis during the 1970s. However, this technology is still in the infant stage. Due to rather scattered working principles of wave energy conversion processes, several classifications of wave energy converters (WECs) have been proposed [1,2,3]. A well-accepted one, which is proposed by the European Marine Energy Centre (EMEC), classified WECs into nine types: Point absorber, terminator, attenuator, overtopping, oscillating water column, submerged pressure differential, … and others [1]. A point absorber features a small horizontal dimension compared to the wavelength and a relatively large motion response to incident waves. Statistical results from EMEC [1] revealed that point absorber developers occupy 30 percent of the total wave developers, implying its advantage over other WECs.
The most common working principle of a point absorber is that a buoy heaves against the seabed as a reaction to incident waves, and a power take-off (PTO) system converts the kinetic energy of the buoy to useful energy. Although other degrees of freedom, e.g., pitch for solo Duck WECs [4,5], of a point absorber may also be employed to absorb wave energy, heave seems to be the most effective [6]. An axisymmetric buoy is preferred for a heaving point absorber due to its ability to absorb power equally efficiently from waves coming from different directions, and a vertical truncated cylindrical buoy is frequently chosen [7,8,9,10,11].
In both regular and irregular waves under reactive control, the theoretical maximum absorbed power of a heaving axisymmetric point absorber depends only on the sea state, that is, the wave period and wave height in regular waves [12,13,14] and the wave spectrum in irregular waves. However, at large wave periods, buoys should perform impractically large oscillations to meet the optimal condition. To avoid this deficiency, Budal proposed to constrain the swept volume of the buoy to the maximum as its full physical volume, so that the buoy will not jump out of the water [6]. As a result, the famous Budal diagram was established. Furthermore, since the transfer function of reactive control is non-causal, which makes the calculation of control commands difficult, realistic controllers of point absorbers should normally step back to suboptimal types [15]. This enables the absorbed power to be affected by the imaginary part of the intrinsic impedance, such as the buoy mass, added mass, and hydrostatic stiffness, etc., which are all dependent on the buoy geometry. In brief, it is found that buoy geometry will influence the power absorption ability of point absorbers. As regarding vertical truncated cylindrical buoys, Falnes found that the larger value of the radius or the draft dominates the variation of the natural frequency of the buoy [6]; Zhang et al. employed a genetic algorithm to optimize the radius and draft to reduce the drift force [16]. Cochet et al. investigated a two-component point absorber with an inner and outer cylinder, and found that a smaller radius and deeper draft for the outer cylinder will lead to a larger capture width and larger resulting motion [17].
Although researchers frequently use the vertical truncated cylindrical buoy for general studies of heaving point absorbers, to the authors’ knowledge, guidance on the proper geometry design of the buoy to ensure the maximum wave energy can be absorbed remains unclear. In particular, provided the cost is given, the amount of wave power that can be absorbed remains unknown. Therefore, the objective of this paper is to identify, for a given cost of the WEC, the amount of wave energy that the WEC can maximally absorb and the optimal buoy geometry. Due to the immaturity of WEC technologies, the cost of a WEC is difficult to evaluate, and is often roughly estimated as proportional to the displaced volume of the buoy [18,19,20,21]. This can be intuitively explained as the fact that the larger the displaced volume is, the larger the cost of manufacturing, transportation, installation, maintenance, and decommissioning will be. In this paper, the displaced volume is adopted on behalf of the cost of a WEC. On the other hand, constraining the oscillation of the buoy within a reasonable range is also considered. The constraint on the maximum swept volume proposed by Budal seems to prevent the buoy from jumping out of a still water level. However, it is still possible that the buoy may jump out of the free surface due to a phase lag between the incident wave and the buoy motion, resulting in the linear wave assumption being violated. In this paper, a more conservative wave-height-dependent motion constraint is introduced to prevent the buoy from jumping out of the water more rigorously.

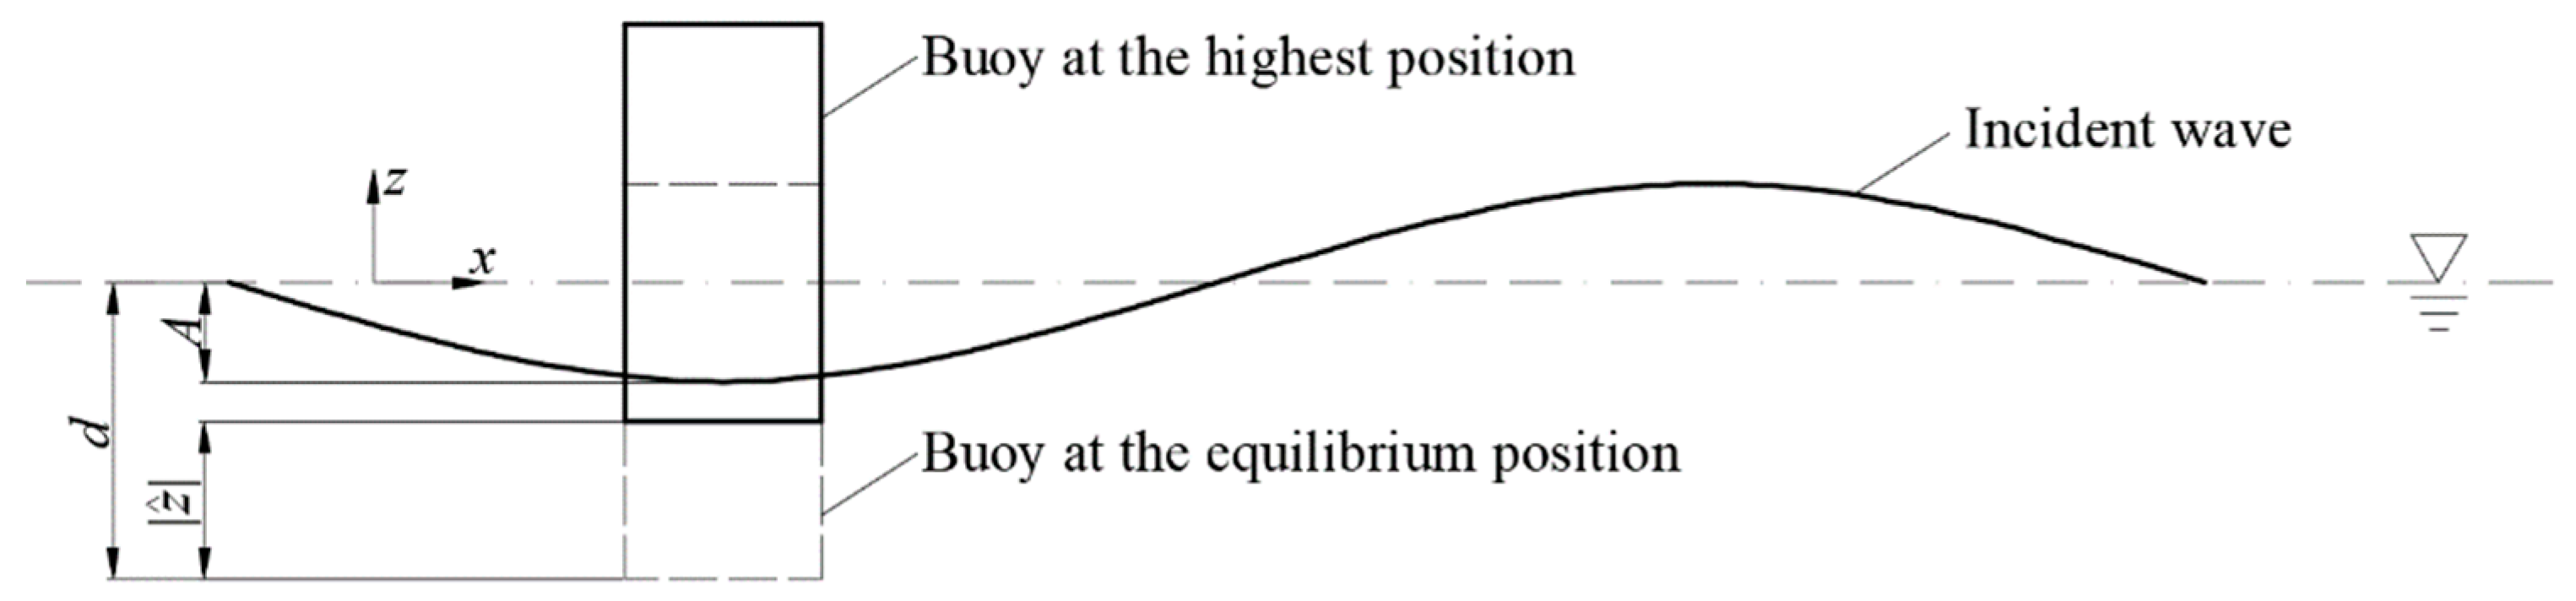
2. Configuration of the Point Absorber

Figure 1 shows the schematic diagram of the heaving point absorber. The buoy heaves against the seabed as a reaction to incident waves, and a PTO system converts the kinetic energy of the buoy to useful energy. Besides this, the buoy is also connected to the seabed by a mooring system, which is either of the slack type such as catenary chains or of the tight type such as tension legs. In this paper, the buoy shape is constrained to be a vertical truncated circular cylinder with the radius denoted r and draft denoted d. In this paper, the diameter of the heaving buoy is assumed to be small in comparison with the wavelength, so that the displacement of the buoy is linear with the wave surface. The displacement of the buoy is denoted as z with respect to the equilibrium position and the wave elevation is denoted as η. It is assumed that the motion amplitude of the buoy is relatively small, so that motion nonlinearity, such as the parametric resonance in surge and pitch due to heave motion, can be ignored. In addition, the axisymmetric buoy shape decouples the hydrodynamic coupling between heave and other degrees of freedom. The above small-motion-amplitude assumption also applies to the mooring system, so that the nonlinear dynamics in the mooring cables can be neglected. Therefore, to analyze the power absorption performance of the WEC in heave, only the dynamic modelling of the buoy in heave is required, as discussed in Section 3. Besides, as a preliminary analysis, it is assumed that the incident wave is unidirectional.

3. Modelling

3.1. The Absorbed Power of a Point Absorber

Since the model of a WEC in regular waves lays the foundation of that in irregular waves, the dynamic of a heaving axisymmetric point absorber in regular waves is considered first. The model is based on the linear wave theory, which assumes that the fluid is irrotational, inviscid, and incompressible, and both the wave steepness and the buoy’s oscillation amplitude are small. In a regular wave with the frequency of ω, the equation of motion of the buoy may be written as
( m + m r ) z ¨ + ( c p + c r ) z ˙ + ( k p + k s + k m ) z = f e ,
where z, m, mr, cr, and ks are the displacement, mass, added mass, radiation damping coefficient, and hydrostatic stiffness of the buoy, respectively; km is the stiffness of the mooring system; fe is the excitation force on the buoy exerted by the incident wave. Here, the hydrodynamic coefficients are calculated using the ANSYS AQWA package. The pretension of the mooring system and the gravity of the buoy are together counteracted by the buoyancy of the buoy; hence, they do not appear in Equation (1). A damper-spring controller with a constant stiffness kp and a damping coefficient cp is employed to model the PTO system and provides the control force as c p z ˙ + k p z . Besides, the mass of mooring lines is ignored since it is relatively small compared to the buoy mass and the added mass. The hydrostatic stiffness of the buoy in heave mode can be calculated by
k s = ρ g S ,
where ρ is the water density, g is the gravitational acceleration, and S is the water-plane area. Since the stiffness of both the PTO and mooring system should be optimized in the following work, for simplicity of notation, the above two stiffness values are combined together as an external stiffness
k c = k m + k p .
By adopting the form of complex amplitude, which holds the relation
z = Re { z ^ e i ω t } ,
where t is the time, the complex amplitude of the buoy velocity is
z ˙ ^ = i ω f ^ e ( k s + k c ) ( m + m r ) ω 2 + i ( c p + c r ) ω .
The impedance of the intrinsic and the external systems, which includes both the PTO and mooring system, can be respectively defined as
Z i = c r + ( m + m r ) ω 2 + k s i ω = c r + i ( ( m + m r ) ω k s ω ) , Z e = c p + k c i ω = c p i k c ω .
Then, it gives
z ˙ ^ = f ^ e Z i + Z e .
The absorbed power by the PTO system is attained as
P = 1 2 c p z ˙ ^ z ˙ ^ * .
Inserting Equation (7) into Equation (8) yields
P = 1 2 c p | f ^ e | 2 | Z i | 2 + Re ( 2 Z i Z e * ) + | Z e | 2 .
By decomposing Zi into its real and imaginary parts, i.e., Zi = Zir + iZii, Equation (9) may be written as
P = 1 2 | f ^ e | 2 c p + ( ( k c ω Z i i ) 2 + Z i r 2 ) / c p + 2 Z i r .
From Equation (10), the absorbed power of a WEC in a regular wave can be found. However, waves in real seas are irregular as a result of their random behavior. Here, an irregular wave is treated as the superposition of regular-wave components with discrete wave frequencies, the amplitude of which is determined from a wave spectrum [22,23]. One of the most commonly used wave spectrums is the Pierson–Moskowitz spectrum, which describes fully developed wind seas and can be expressed as
S h ( ω ) = 262.9 H s 2 ω 5 T e 4 exp ( 1054 ω 4 T e 4 ) ,
where Hs is the significant wave height and Te is the energy period. Regarding the n-th regular-wave component with the frequency of ωn, the wave amplitude can be calculated from the spectrum as
A n = 2 S h ( ω n ) Δ ω ,
where Δω is the sampling interval of discrete frequencies when discretizing the spectrum. The complex amplitude of the velocity of the buoy at each individual wave frequency is
z ˙ ^ ( ω n ) = i ω n f ^ e ( ω n ) ( k s + k c ) ( m + m r ( ω n ) ) ω n 2 + i ( c p + c r ( ω n ) ) ω n .
Then, the time-domain velocity of the buoy can be obtained by a superposition
z ˙ = n Re { z ˙ ^ ( ω n ) exp ( i ( ω n t + φ n ) ) } ,
where φn is the phase of the n-th regular-wave component designated randomly. The time-averaged absorbed power of the WEC is given by
P = c p t 2 t 1 t 1 t 2 z ˙ 2 d t .
Due to orthogonality, the influence of the coupled terms between different wave frequencies when inserting Equations (13) and (14) into Equation (15) will vanish if the time interval between t1 and t2 is sufficiently long [24]. Then, the time-averaged absorbed power of the WEC is reduced to
P = n 1 2 | f ^ e ( ω n ) | 2 c p + ( ( k c ω n Z i i ( ω n ) ) 2 + Z i r 2 ( ω n ) ) / c p + 2 Z i r ( ω n ) .
Accordingly, the displacement of the floating body is
z = n Re { z ˙ ^ ( ω n ) ω n exp ( i ( ω n t + φ n π 2 ) ) } .

3.2. Constraints

Due to the small horizontal dimension of the buoy compared to the wavelength, point absorbers need to oscillate with large amplitude to absorb sufficient power. As a result, theoretically, the buoy may jump out of the water and violate the linear wave assumption. In this paper, we introduce a wave-height-dependent motion constraint to prevent the buoy from jumping out of the free surface of the wave. Since the phase lag between the incident wave and the buoy motion is uncertain, Figure 2 shows the severest condition when the buoy is about to jump out of the free surface of a regular wave, that is, the buoy at the highest position and the free surface of the wave at the lowest position. To keep the buoy within the water, the lowest z coordinate of the buoy should be smaller than the negative wave amplitude –A, which gives
| z ^ | d A
In irregular waves, since the motion amplitude of the buoy varies wave to wave, the constraint defined in Equation (18) cannot be directly applied. Here, the concept of “significant motion amplitude”, similar to the “significant velocity” proposed by Goggins [25], is employed to represent the statistical motion amplitude of a buoy in irregular waves. From Equation (17), it is found that the motion amplitude of a buoy inherits the stochastic characteristic from the free surface elevation. To quantitatively describe the motion amplitude of a buoy in irregular waves, analogous to the significant wave height, which is the mean of the highest one-third of wave heights in a wave record due to the narrow-banded wave spectrum, the significant motion amplitude zs is defined as the mean of the highest one-third of motion amplitudes in a motion record. Figure 3 shows a time-history example of wave elevation and buoy displacement. Here, mn is defined as the mass of the buoy divided by the displaced mass. By identifying the amplitude of the buoy displacement record and taking the mean of the one-third highest values, the significant motion amplitude is found to be 0.57 m, which is easily obtained from Figure 3 through visual observation.
Based on the concept of the significant motion amplitude, the motion constraint in irregular waves can be defined similarly to Equation (18) by replacing | z ^ | with zs and A with Hs/2 as
z s d H s 2
In addition to the constraint on the motion amplitude of the buoy, for a realistic WEC, constraints on the following parameters should also be considered:
(1) External stiffness. Although previous work has reported using the spring with a negative stiffness to harvest energy from waves [26], it is neither easy nor economically cost-effective to implement the spring with a negative stiffness. In this paper, the stiffness of the PTO system is constrained to be non-negative, i.e., with a lower range of zero. On the other hand, it seems that there will always be some positive stiffness in heave in the mooring system. In fact, the stiffness of a mooring system depends on a variety of factors [27], such as whether the mooring system is slack or tensioned, the mass distribution and material of the cables, the spread type and length of the cables, whether surface buoys are attached in the cables, etc. These factors vary the stiffness of the mooring system across a wide range. In this paper, for the universality of the study, we simply assume the lower range of the mooring stiffness to be zero, too. As a combination of the stiffness of both the PTO and the mooring system, the combined stiffness satisfies
k c 0.
(2) Damping coefficient of the PTO system. The damping coefficient of the PTO system should also be constrained to be positive, since the function of the PTO system is to absorb energy from waves instead of output energy to waves, i.e.,
c p 0.
(3) Buoy mass. It can be seen from Figure 1 that, at the equilibrium position, the buoyancy of the buoy is counteracted by the pretension of the mooring system and the gravity of the buoy. Since the pretention is positive, the gravity of the buoy should be smaller than the buoyancy, which equals the gravity of displaced water. Then, the constraint on the buoy mass can be represented by
0 m n 1.

4. The Optimization Procedure and Results

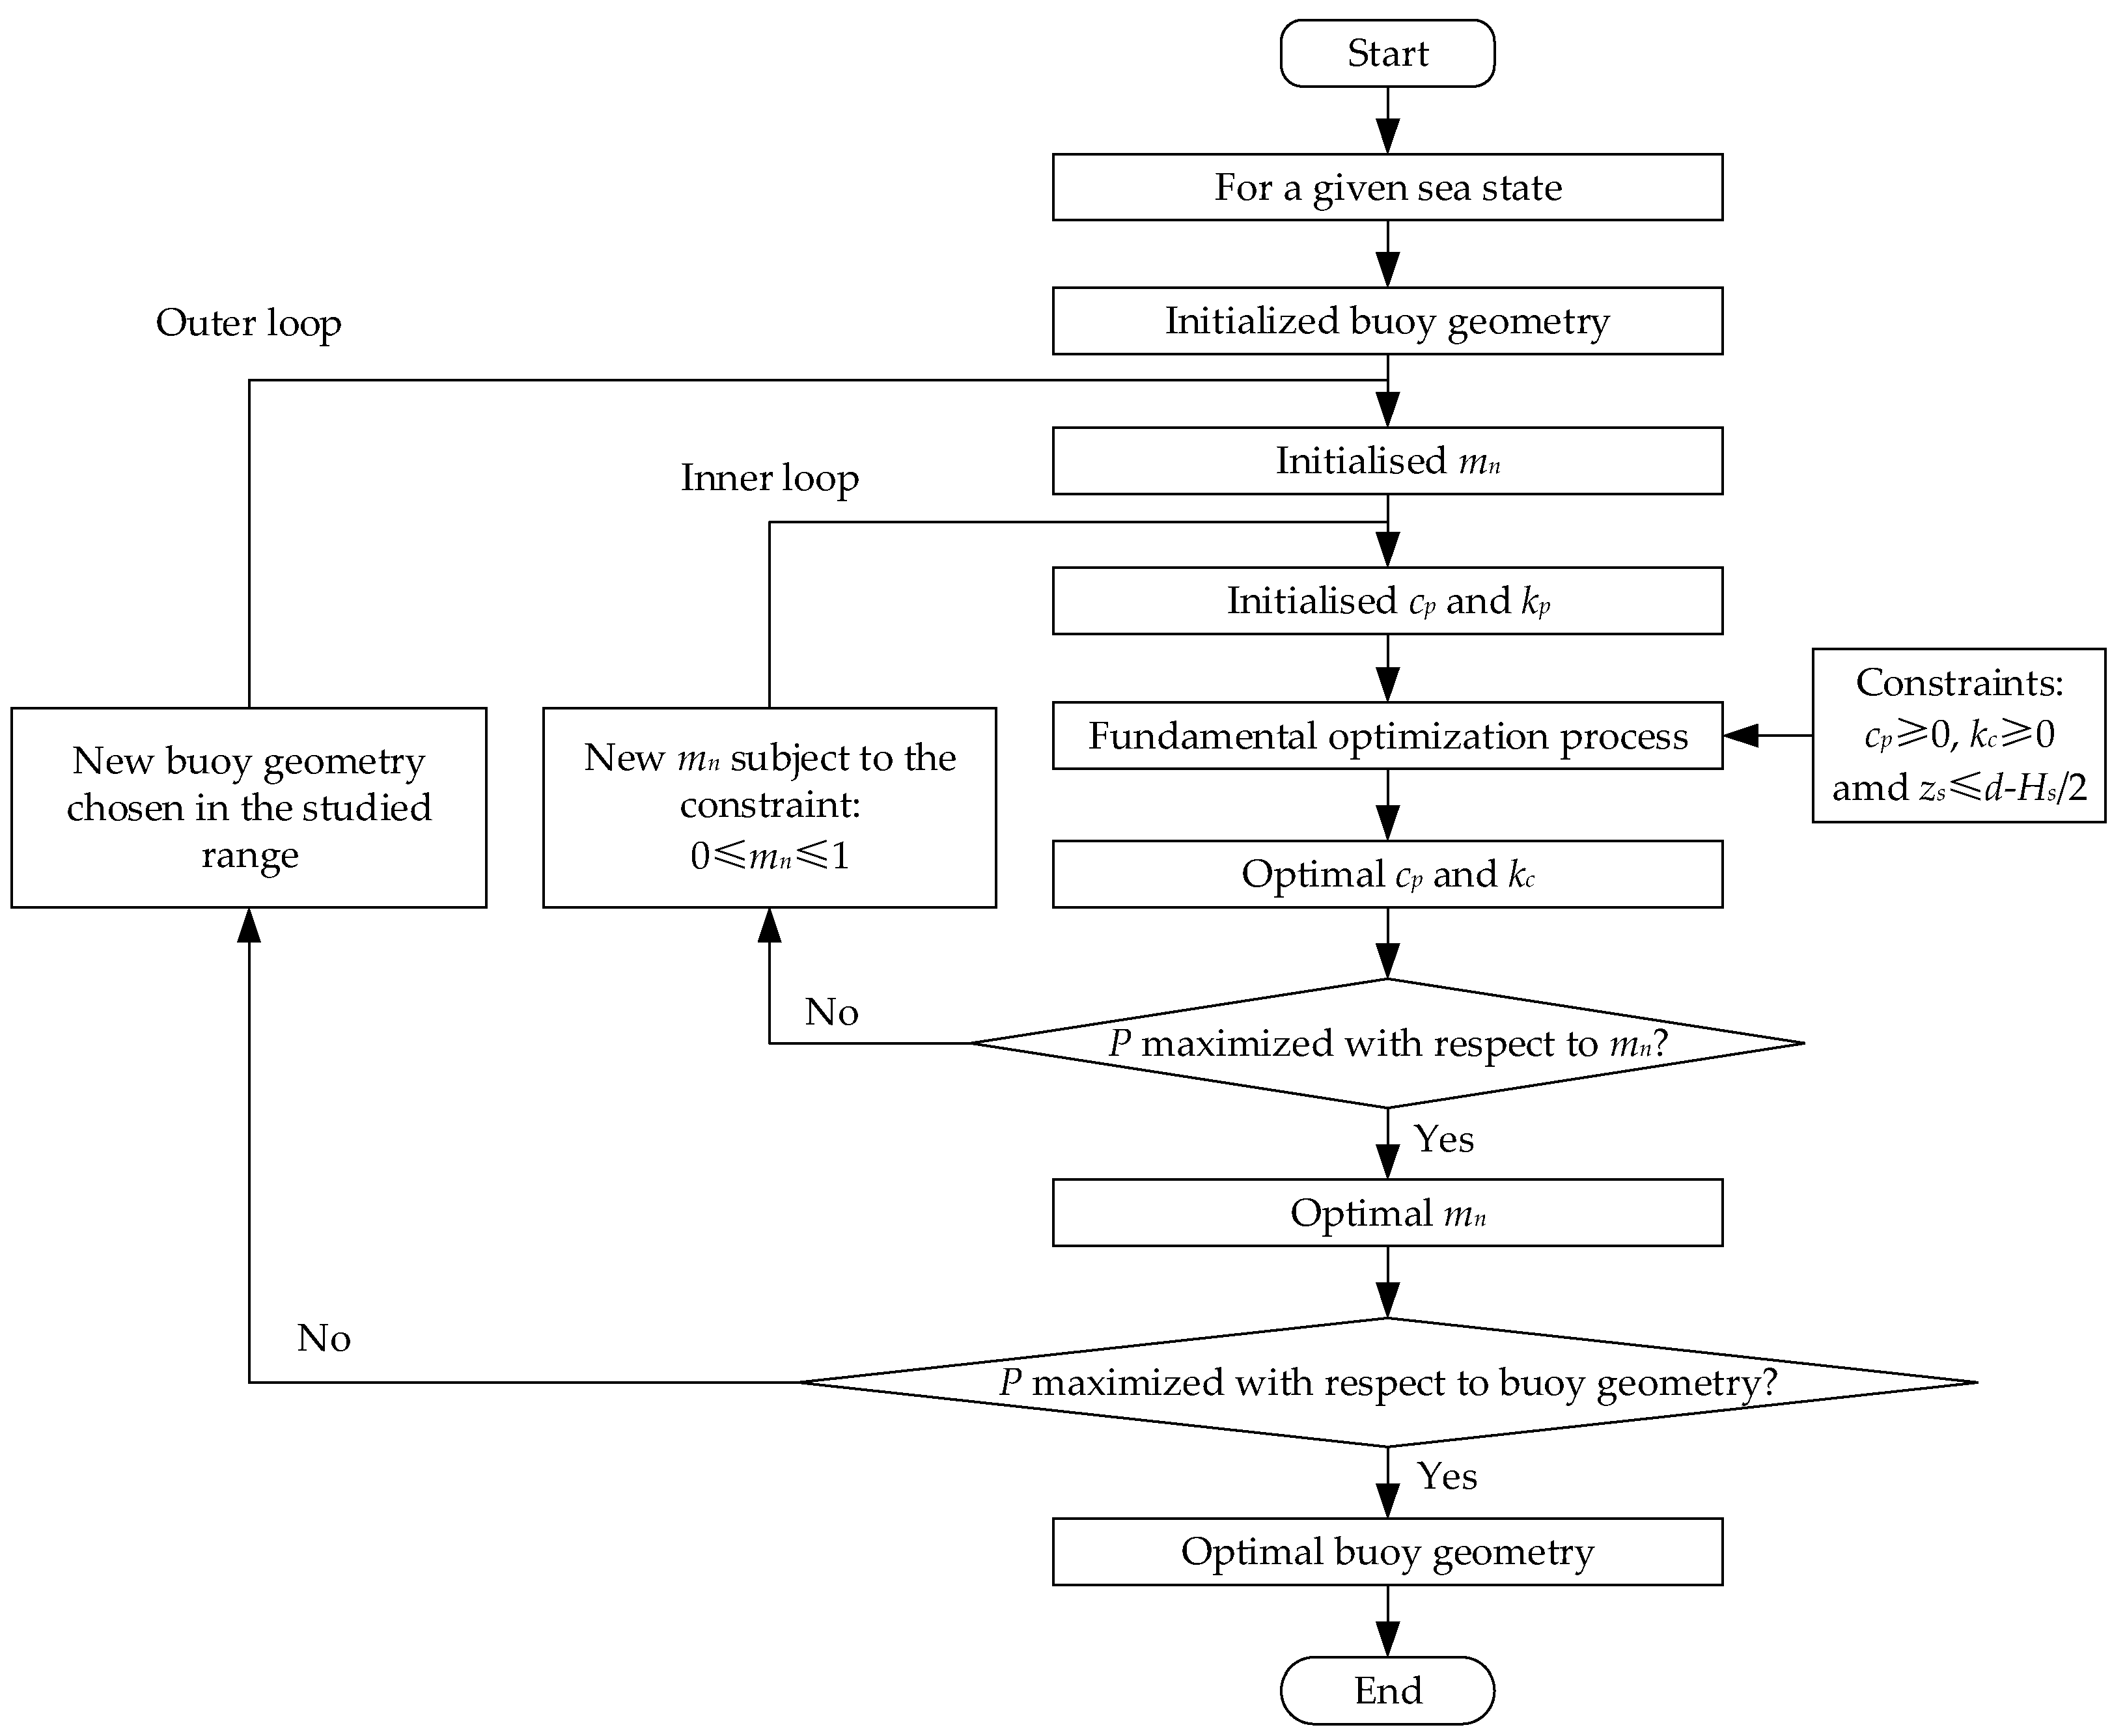
4.1. The Optimization Procedure

At this stage, it should be noted that the objective of this paper is to identify the maximum absorbed power and optimal buoy geometry for a given cost of the WEC at different sea states. To find the solution of an optimization problem, both exact and meta-heuristic methods can be employed. Meta-heuristic methods, such as genetic algorithms, are more suitable for complex optimization problems with many independent variables. McCabe et al. used a genetic algorithm to optimize a surge-and-pitch device with penalties on high velocity and large collector volumes, and an unsymmetrical shape with a bulbous body and wings that slope backwards from the bottom upwards was found to be optimal [19]. Garcia-Teruel et al. also used a genetic algorithm to optimize the geometry of a WEC hull shape, and the optimal WEC geometry for different modes of motion was identified [20]. When the optimization problem is simple with fewer independent variables, exact methods can be more effective. Goggins et al. optimized the dynamic heave velocity response of the buoy through form finding of the geometric configuration of its structure [25]. Gilloteaux et al. performed the geometry optimization of a simple heaving body and the geometry as a truncated vertical cylinder using a simplex deterministic optimization method [28]. In this paper, geometry optimization is only performed for a vertical truncated cylindrical buoy, which can be parameterized by only a few independent variables, such as the damping coefficient and stiffness of the PTO system, the pretension and stiffness of the mooring system, and the radius and draft of the buoy. Therefore, the number of independent variables is relatively small, thus exact methods are already qualified for this optimization problem.
Figure 4 shows the flowchart of solving the optimization problem. The flowchart is composed of two nested loops, named the inner loop and the outer loop. The inner loop finds the optimal buoy mass ratio mn for a given buoy geometry and sea state, while the outer loop finds the optimal buoy geometry for a given sea state. Inside the inner loop, there is a core fundamental optimization process, which finds the optimum PTO damping coefficient cp and external stiffness kc that maximize the absorbed wave power for a given buoy mass ratio, buoy geometry, and sea state under the constraints defined by Equations (19)–(21). To perform this fundamental optimization process, the MATLAB function fmincon, which employs the interior point algorithm, is adopted. In this process, initial values of cp and kc should be set as an initial guess of the optimal solution. Due to the relationship between the absorbed power with the buoy mass ratio in the inner loop and the buoy geometry in the outer loop, a bisection method is employed in both loops to identify the optimal solution.
To study the maximum absorbed power and the optimal buoy geometry for a given cost, the value of the cost should be fixed at the beginning of the optimization. Since the cost of a WEC is often estimated as proportional to the displaced volume of the buoy, the displaced volume of the buoy is set to be 200 m3 for a case study. For other values of the displaced volume of the buoy, the results can be deduced from that obtained in this paper through Froude scaling. Furthermore, when the displaced volume is fixed for a vertical truncated cylinder, the radius-to-draft ratio can uniquely define the buoy geometry. Therefore, in the optimization procedure, the buoy geometry can be equivalent to the radius-to-draft ratio.

4.2. The Optimization Results

4.2.1. The Fundamental Optimization Process

In the fundamental optimization process, the damping coefficient cp of the PTO system and the external stiffness kc is optimized for a given buoy geometry, sea state, and buoy mass ratio under the constraints defined in Equations (19)–(21). Figure 5 shows an example of the contour of the absorbed power P and significant motion amplitude zs as functions of cp and kc. Due to the constraints on cp and kc, only results in the feasible region of both variables are plotted. The absorbed power is found to be a unimodal function with cp and kc, while the significant motion amplitude of the buoy decreases with the increasing cp and kc. At the optimal solution marked with a bold “+”, i.e., cp = 3.7 × 10⁵ N.s/m and kc = 0 N/m, the significant motion amplitude, i.e., 0.71 m, is smaller than dHs/2 = 3 m, thus the motion constraints of the buoy will not apply in this case. However, at larger significant wave heights, the solution will hit this constraint. Although Figure 5 is representative for most sea states and buoy geometries, exceptions are still found at small energy periods, where the optimal kc is non-zero, which will be showed in a latter figure.

4.2.2. The Inner Loop

In the inner loop, the buoy mass ratio mn is optimized for a given buoy geometry and sea state and under the constraint on buoy mass as defined in Equation (22). It should be clarified that, in this loop, mn is optimized based on the optimal value of cp and kc, which means that when calculating the performance of the WEC for any values of mn, both cp and kc are optimized for this specific mn accordingly. Figure 6 shows an example of the maximum absorbed power Pmax and significant motion amplitude zs as functions of the buoy mass ratio mn. It is found that both the absorbed power and significant motion amplitude increase monotonically with the increasing buoy mass ratio. Therefore, to absorb more power, the buoy mass should be as large as possible. Since the buoyancy of the buoy is counteracted by the gravity of the buoy and the pretension of the mooring system, the maximum buoy mass occurs when the pretension of the mooring system vanishes. This suggests that the pretension of the mooring system should be as low as possible since there is more or less some pretension of the mooring system. The variation trend of Pmax and zs is found to be representative for other sea states and buoy geometries after extensive studies at other cases.

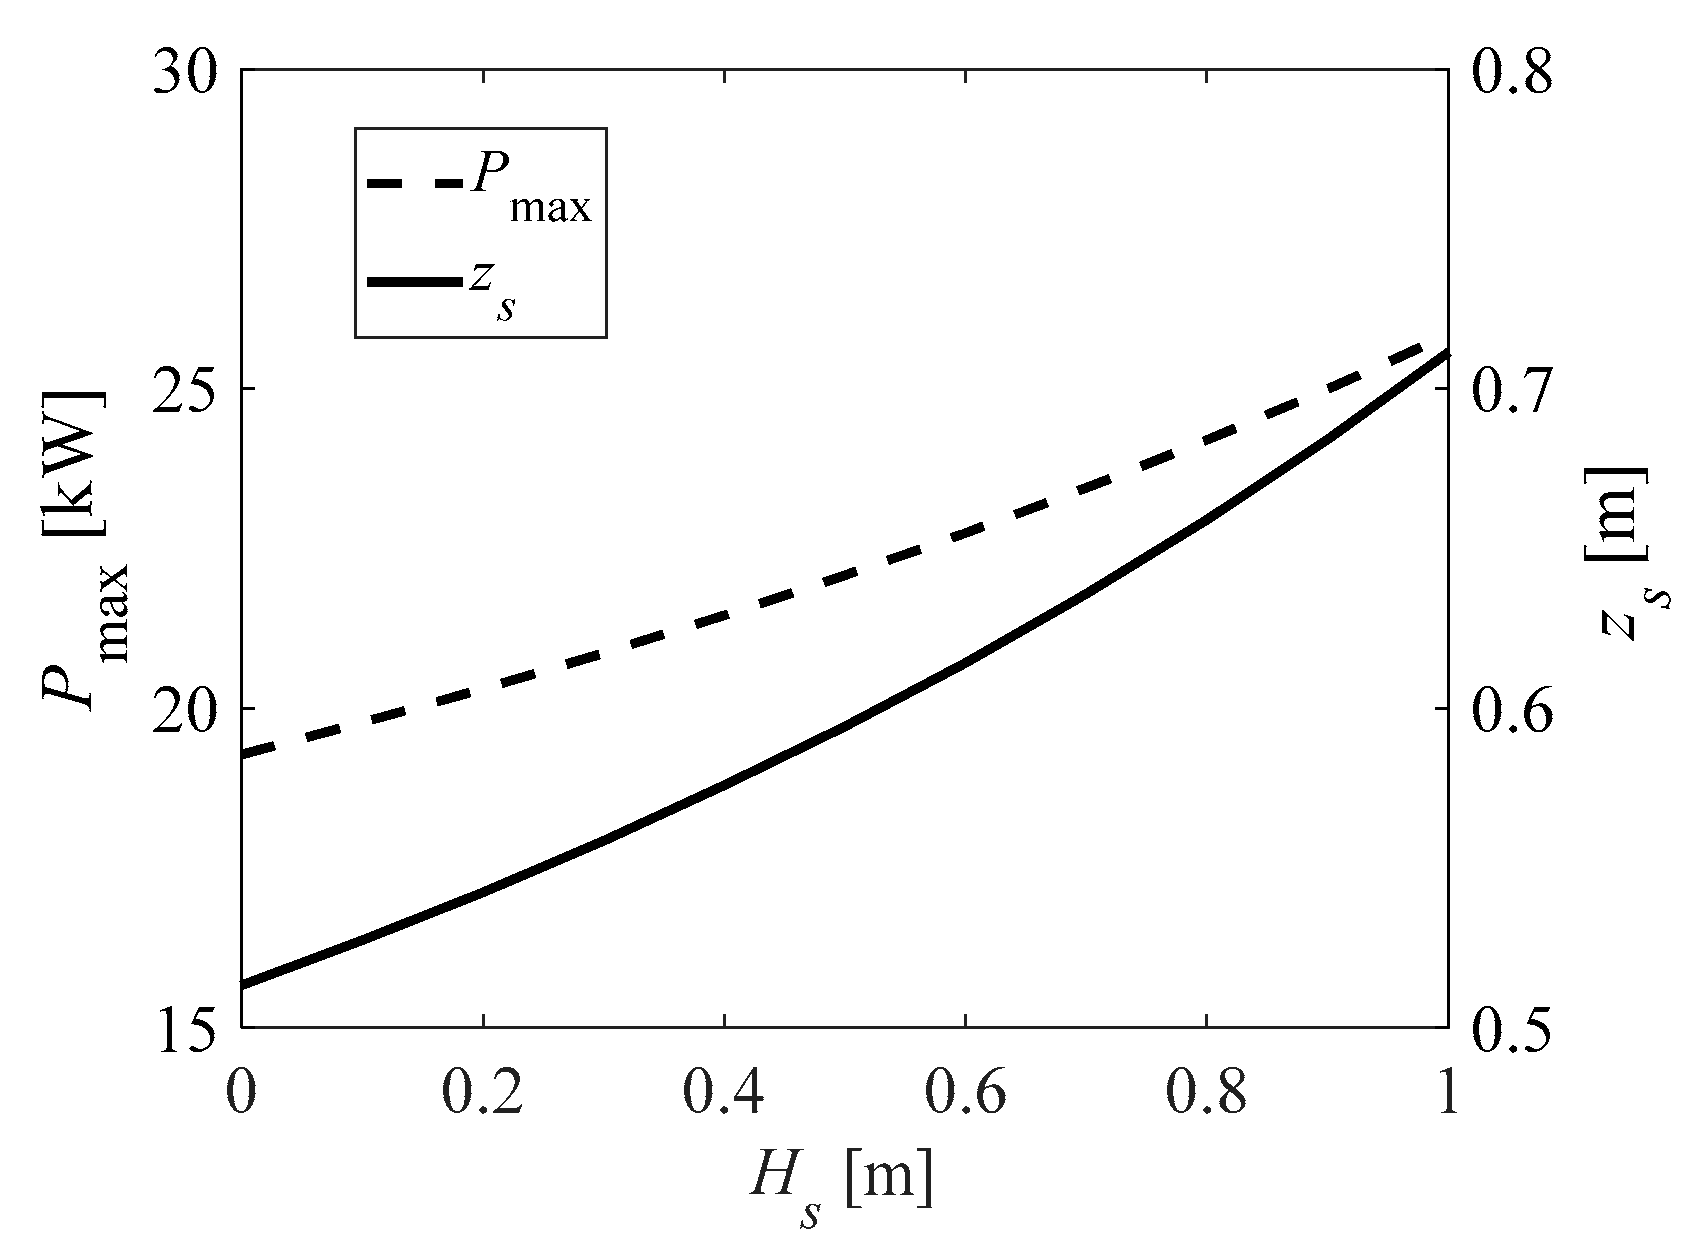
4.2.3. The Outer Loop

In the outer loop, the optimal buoy geometry is identified at the corresponding sea state. Figure 7a shows an example of the maximum absorbed power Pmax and the corresponding significant motion amplitude zs as functions of the significant wave height Hs. The curve of zs is composed of two straight lines with the slope of opposite signs. At small significant wave heights, the motion amplitude of the buoy is relatively small. Hence, only linear constraints defined by Equations (20) and (21) apply in the fundamental optimization process. The optimal solution, kp,opt and cp,opt, varies linearly with the significant wave height. As a result, the significant motion amplitude and maximum absorbed power increase linearly and quadratically, respectively, with the increasing significant wave height. At large significant wave heights, the other linear constraint defined by Equation (19) applies. Then, the optimal solution is found when zs resides on the boundary of the feasible region defined by the constraint, i.e., d-Hs/2. As a result, zs decreases with the increasing significant wave height with a slope of −1/2. In this case, the maximum absorbed power decreases rapidly with the increasing significant wave height and vanishes to zero at Hs = 2d when zs is constrained to be zero, which implies that the buoy should be equipped with an infinitely large damper to stand still in waves, thereby no energy production. Figure 7b shows the maximum absorbed power as a function of the buoy geometry, which is represented by the radius-to-draft ratio. At a small radius-to-draft ratio, since the motion amplitude of the buoy is not high enough to reach the constraint as defined in Equation (19), more wave power is absorbed at a higher wave height. Meanwhile, a higher radius-to-draft ratio means a larger radius of the buoy, implying a higher excitation force and more absorbed power. However, at large radius-to-draft ratios, which indicate a small draft, the motion amplitude of the buoy will be easily affected by the constraint, thus the absorbed power begins to decrease with the radius-to-draft ratio. Furthermore, when the draft equals half the significant wave height according to Equation (19), no power will be absorbed since the motion amplitude is constrained to be zero. Therefore, for a specific sea state, i.e., energy period and significant wave height, there is normally an optimal radius-to-draft ratio that maximizes the absorbed power. From Figure 7b, it is found that this optimal radius-to-draft ratio can be readily attained through a bisection method due to the simple variation trend. In this paper, the studied range of the radius-to-draft is 0.25~4.
In the above paragraph, the method to identify the optimal radius-to-draft ratio for a specific sea state has been introduced. However, it is not easy to form synthetic guidance on how to choose the optimal radius-to-draft ratio over a wide range of sea states from the above analyses. To solve this problem, we put together the power curve in Figure 7a at different radius-to-draft ratios as shown in Figure 8. It can be seen that the buoy with a smaller radius-to-draft ratio can produce power at a larger range of significant wave heights. In actuality, this is as expected. For a given displaced volume, the smaller the radius-to-draft ratio is, the larger the draft is. Previous findings indicate that the maximum absorbed power vanishes at Hs = 2d, hence the maximum absorbed power vanishes at a larger significant wave height for the buoy with a smaller radius-to-draft ratio. In addition, it is found that the buoy with a smaller radius-to-draft ratio can produce more power within its wave height range of power production. Although the buoy with a small radius-to-draft ratio seems to produce less power at small wave heights, which is mainly due to the smaller wave excitation force, it can produce power at large heights without violating the constraint on the motion amplitude. Since a high wave height means more incident power, it is reasonable that the buoy with a small radius-to-draft ratio can produce more power. When multiple power curves in Figure 7a are plotted for a series of radius-to-draft ratios, an envelope curve can be plotted along the outermost side of the power curves as shown in Figure 8. Then, this envelope curve represents the maximum absorbed power as a function of the significant wave height. The represented radius-to-draft ratio of each power curve is optimal for the significant wave height at the tangent point with the envelope curve. For example, the power curve for the radius-to-draft ratio of 1.0 is tangential to the envelope curve at (4.97 m, 154.4 kW), which indicates that when the significant wave height is 4.97 m, the maximum power that can be absorbed is 154.4 kW, and the optimal radius-to-draft ratio of the buoy is 1.0.
Figure 9 is an extension of Figure 8 by presenting the maximum absorbed power at a range of energy periods instead of a single energy period as in Figure 8. It can be seen that the variation trend of the maximum absorbed power at an energy period is more or less the same at different cases of significant wave heights and radius-to-draft ratios. The maximum absorbed power increases steeply with an increasing energy period at small energy periods and decreases moderately at large energy periods. The optimal energy period for the maximum absorbed power seems to be insensitive to the significant wave height and radius-to-draft ratio and is around 8 s for the displaced volume of 200 m3. According to Froude scaling, it can be inferred that, in order to realize the maximized absorbed power at an expected energy period Te, the optimal displaced volume should be around T e 6 / 1311 m3.
Based on the data shown in Figure 9 and the method of obtaining the envelope curve in Figure 8, the maximum absorbed power and the corresponding optimal significant wave height as a function of the energy period and radius-to-draft ratio can be found and is shown in Figure 10. It can be seen, the maximum absorbed power generally decreases with the radius-to-draft ratio, except for energy periods smaller than 4 s. Again, an optimal energy period, around 8 s as mentioned before, can be found for different values of the radius-to-draft ratio. The optimal significant wave height also decreases with the increasing radius-to-draft ratio, and almost remains constant for a certain value of the radius-to-draft ratio at large energy periods. It should be noted from Figure 10 that the increase in the maximum absorbed power is based on the WEC working at a sea state of large significant wave heights and resultant large motion amplitudes, which agrees with the findings in [17]. According to the data in Figure 10, we can determine how to choose the optimal geometry of the buoy for a given sea state, i.e., for a given energy period and significant wave height, to absorb the most wave energy. For example, if a sea state of Te = 8 s and Hs = 4 s is given, then the best radius-to-draft ratio can be found from subfigure (b) to be 1.406 and the maximum absorbed power can be found from subfigure (a) to be 124.9 kW. Besides, the method of choosing the shape of the buoy for a given requirement of power production and energy period is also implied. For example, if an absorbed power of 100 kW is required for a WEC and the energy period is 8 s at the site of deployment, the contour line labeled “100” from subfigure (a) suggests an optimal radius-to-draft ratio of 1.94 at Te = 8 s, and subfigure (b) gives the optimal significant wave height of 3.23 m.
Figure 11 shows the optimal external stiffness of the WEC as a function of the energy period at different radius-to-draft ratios. It can be seen that, except for very small energy periods, the optimal external stiffness is always zero. Since the external stiffness is the addition of the stiffness of the mooring system and the PTO system, the optimal value of both should also be zero. This indicates that the PTO should generally be a pure damper without any stiffness. In addition, the stiffness of the mooring system should be as low as possible. As indicated from previous investigations, the mass of the buoy should be as large as possible, thus there should be no pretension of the mooring.

5. Discussion

In this paper, the method to identify the optimal buoy geometry is an embodiment of the method of exhaustion. This method may be quite inefficient as compared to other advanced optimization methods, such as the genetic algorithm, the particle swarm algorithm, etc. However, the method employed in this paper is able to clearly present the relationship between the arguments and the objective function and the influence of the constraints. For example, a large number of computations have been performed and found that the variation trend of absorbed power versus buoy mass ratio is similar to the variable space composed of the buoy geometry and sea state, facilitating the identification of the optimal buoy mass ratio. On the other hand, both the relationship between the buoy geometry and the absorbed power and the influence of the motion constraints are explicitly shown in Figure 7, which helps in proposing an envelope curve-based method to identify the optimal buoy geometry.
In this paper, only unidirectional incident waves have been considered. When the incident wave comes from different directions, although the axisymmetric buoy geometry is not sensitive to the wave direction, the resultant incident wave spectrum will be altered, since it is a superposition of the wave spectrum from different wave directions. To limit the scope of this paper, the influence of wave direction on power absorption and buoy geometry will be studied in future work.

6. Conclusions

In this paper, heaving axisymmetric point absorbers with the shape of the buoy as a vertical truncated cylinder is considered. The objective of this work is to identify the maximum absorbed power and optimal buoy geometry of the WEC for a given cost at different sea states. The cost of the WEC is estimated as proportional to the displaced volume of the buoy, and the buoy geometry is described by the radius-to-draft ratio. A conservative wave-height-dependent motion constraint is introduced to prevent the buoy from jumping out of the free surface of waves. An envelope curve is fitted to represent the maximum power production ability as a function of the significant wave height at different radius-to-draft ratios. Results show that the pretension of the mooring system should be as low as possible. Except for very small energy periods, the stiffness of both the PTO and mooring system should also be as low as possible. A buoy with a small radius-to-draft ratio can absorb more power, but at the price of working in more energetic seas and oscillating at larger amplitudes. In addition, the method to choose the optimal buoy geometry at different sea states is provided. In order to realize the maximized absorbed power at an expected energy period Te, the optimal displaced volume should be around T e 6 / 1311 m3.

Funding

This research was funded by the NSFC of China, grant number 51905096, the Basic Research Program of Jiangsu Province, grant number BK20190373, the Innovative and Entrepreneurial Talents (Doctor) of Jiangsu Province, and was also supported by “the Fundamental Research Funds for the Central Universities”.

Conflicts of Interest

The authors declare no conflict of interest.

References

  1. Wave Developers. Available online: http://www.emec.org.uk/marine-energy/wave-developers/ (accessed on 3 September 2021).
  2. Drew, B.; Plummer, A.R.; Sahinkaya, M.N. A review of wave energy converter technology. Proc. Inst. Mech. Eng. A-J. Pow. 2009, 223, 887–902. [Google Scholar] [CrossRef] [Green Version]
  3. Falcão, A.F.O. Wave energy utilization: A review of the technologies. Renew. Sust. Energy Rev. 2010, 14, 899–918. [Google Scholar] [CrossRef]
  4. Wu, J.; Yao, Y.; Zhou, L.; Chen, N.; Yu, H.; Li, W.; Göteman, M. Performance analysis of solo Duck wave energy converter arrays under motion constraints. Energy 2017, 139, 155–169. [Google Scholar] [CrossRef]
  5. Roh, C.; Ha, Y.J.; Shin, S.H.; Kim, K.H.; Park, J.Y. Advanced maximum power control algorithm based on a hydraulic system for floating wave energy converters. Processes 2021, 9, 1712. [Google Scholar] [CrossRef]
  6. Falnes, J.; Hals, J. Heaving buoys, point absorbers and arrays. Philos. Tran. R. Soc. A Math. Phy. Eng. Sci. 2012, 370, 246–277. [Google Scholar] [CrossRef] [Green Version]
  7. Antonio, F.D.O. Modelling and control of oscillating-body wave energy converters with hydraulic power take-off and gas accumulator. Ocean Eng. 2007, 34, 2021–2032. [Google Scholar]
  8. Greenhow, M.; White, S.P. Optimal heave motion of some axisymmetric wave energy devices in sinusoidal waves. Appl. Ocean Res. 1997, 19, 141–159. [Google Scholar] [CrossRef]
  9. Bharath, A.; Nader, J.R.; Penesis, I.; Macfarlane, G. Nonlinear hydrodynamic effects on a generic spherical wave energy converter. Renew. Energy 2018, 118, 56–70. [Google Scholar] [CrossRef]
  10. Sergiienko, N.Y.; Cazzolato, B.S.; Ding, B.; Hardy, P.; Arjomandi, M. Performance comparison of the floating and fully submerged quasi-point absorber wave energy converters. Renew. Energy 2017, 108, 425–437. [Google Scholar] [CrossRef] [Green Version]
  11. Demonte Gonzalez, T.; Parker, G.G.; Anderlini, E.; Weaver, W.W. Sliding mode control of a nonlinear wave energy converter model. J. Mar. Sci. Eng. 2021, 9, 951. [Google Scholar] [CrossRef]
  12. Evans, D.V. A theory for wave-power absorption by oscillating bodies. J. Fluid Mech. 1976, 77, 1–25. [Google Scholar] [CrossRef]
  13. Mei, C.C. Power extraction from water waves. J. Ship Res. 1976, 20, 63–66. [Google Scholar] [CrossRef]
  14. Budal, K.; Falnes, J. A resonant point absorber of ocean-wave energy. Nature 1975, 256, 478–479. [Google Scholar]
  15. Salter, S.H.; Jeffery, D.C.; Taylor, J.R.M. The architecture of nodding duck wave energy generators. Nav. Archit. 1976, 1, 21–24. [Google Scholar]
  16. Zhang, Z.; He, G.; Wang, Z. Real-coded genetic algorithm optimization in reduction of wave drift forces on an array of truncated cylinders. J. Mar. Sci. Tech. 2019, 24, 930–947. [Google Scholar] [CrossRef]
  17. Cochet, C.; Yeung, R.W. Dynamic analysis and configuration design of a two-component wave-energy absorber. In Proceedings of the ASME 31st International Conference on Ocean, Offshore and Arctic Engineering, Rio de Janeiro, Brazil, 1–6 July 2012; pp. 631–640. [Google Scholar]
  18. Babarit, A.; Hals, J.; Muliawan, M.J.; Kurniawan, A.; Moan, T.; Krokstad, J. Numerical benchmarking study of a selection of wave energy converters. Renew. Energy 2012, 41, 44–63. [Google Scholar] [CrossRef]
  19. McCabe, A.P.; Aggidis, G.A.; Widden, M.B. Optimizing the shape of a surge-and-pitch wave energy collector using a genetic algorithm. Renew. Energy 2010, 35, 2767–2775. [Google Scholar] [CrossRef]
  20. Garcia-Teruel, A.; Forehand, D. Optimal wave energy converter geometry for different modes of motion. In Proceedings of the 3rd International Conference on Renewable Energies Offshore (RENEW 2018), Lisbon, Portugal, 8–10 October 2018; Routledge Taylor & Francis Group: Abingdon, UK; pp. 299–305. [Google Scholar]
  21. Babarit, A.; Clement, A.H.; Gilloteaux, J.C. Optimization and time-domain simulation of the SEAREV wave energy converter. In Proceedings of the ASME 2005 24th International Conference on Offshore Mechanics and Arctic Engineering, Halkidiki, Grecee, 12–17 June 2005; pp. 703–712. [Google Scholar]
  22. Amini, E.; Asadi, R.; Golbaz, D.; Nasiri, M.; Naeeni, S.T.O.; Nezhad, M.M.; Piras, G.; Neshat, M. Comparative study of oscillating surge wave energy converter performance: A case study for southern coasts of the Caspian sea. Sustainability 2021, 13, 10932. [Google Scholar] [CrossRef]
  23. Azhari, B.; Wijaya, F.D.; Yazid, E. Performance of linear generator designs for direct drive wave energy converter under unidirectional long-crested random waves. Energies 2021, 14, 5098. [Google Scholar] [CrossRef]
  24. Wu, J.; Yao, Y.; Zhou, L.; Göteman, M. Real-time latching control strategies for the solo Duck wave energy converter in irregular waves. Appl. Energy 2018, 222, 717–728. [Google Scholar] [CrossRef]
  25. Goggins, J.; Finnegan, W. Shape optimisation of floating wave energy converters for a specified wave energy spectrum. Renew. Energy 2014, 71, 208–220. [Google Scholar] [CrossRef]
  26. Zhang, X.; Yang, J. Power absorb performance of an oscillating-body WEC with nonlinear snap through PTO systems in irregular waves. Appl. Ocean Res. 2015, 52, 261–273. [Google Scholar] [CrossRef]
  27. Pols, A.; Gubesch, E.; Abdussamie, N.; Penesis, I.; Chin, C. Mooring analysis of a floating OWC wave energy converter. J. Mar. Sci. Eng. 2021, 9, 228. [Google Scholar] [CrossRef]
  28. Gilloteaux, J.-C.; Ringwood, J. Control-informed geometric optimisation of wave energy converters. IFAC Proc. Vol. 2010, 43, 366–371. [Google Scholar] [CrossRef] [Green Version]
Figure 1. A schematic diagram of the heaving point absorber.
Jmse 09 01136 g001
Figure 2. The severest condition when the buoy is about to jump out of the free surface of a regular wave.
Jmse 09 01136 g002
Figure 3. A time-history example of the wave elevation η (upper) and buoy displacement z (lower) for a vertical truncated cylindrical buoy with r = 10 m, d = 5 m, mn = 1, cp = 106 N.s/m, kc = 106 N/m, Te = 8 s and Hs = 2 m.
Jmse 09 01136 g003
Figure 4. The flowchart of solving the optimization problem.
Jmse 09 01136 g004
Figure 5. An example of the contour of the absorbed power P and significant motion amplitude zs as functions of the damping coefficient of the PTO system cp and external stiffness kc at the sea state of Te = 8 s, Hs = 2 m for a vertical truncated cylindrical buoy with the radius-to-draft ratio of r/d = 1 and mn = 1: (a) Absorbed power in kW; (b) significant motion amplitude in m. The optimal solution is marked by a bold “+”.
Jmse 09 01136 g005
Figure 6. An example of the maximum absorbed power Pmax and significant motion amplitude zs as functions of the buoy mass ratio mn at the sea state of Te = 8 s and Hs = 2 m for a vertical truncated cylindrical buoy with the radius-to-draft ratio of r/d = 1.
Jmse 09 01136 g006
Figure 7. (a) An example of the maximum absorbed power Pmax and the corresponding significant motion amplitude zs as functions of the significant wave height Hs for a vertical truncated cylindrical buoy with the radius-to-draft ratio of r/d = 1 at the sea state of Te = 8 s. (b) The maximum absorbed power as a function of the radius-to-draft ratio at the sea state of Te = 8 s.
Jmse 09 01136 g007
Figure 8. The maximum absorbed power Pmax as a function of the significant wave height Hs for vertical truncated cylindrical buoys with different radius-to-draft ratios r/d at the energy period of Te = 8 s.
Jmse 09 01136 g008
Figure 9. The maximum absorbed power Pmax as a function of the significant wave height Hs and energy period Te at different radius-to-draft ratios.
Jmse 09 01136 g009
Figure 10. The maximum absorbed power Pmax and the corresponding optimal significant wave height Hs,opt as a function of the energy period Te and radius-to-draft ratio r/d: (a) Maximum absorbed power in kW; (b) the corresponding optimal significant wave height in m.
Jmse 09 01136 g010
Figure 11. Optimal external stiffness kc,opt of the WEC as a function of the energy period Te at different radiu- todraft ratios.
Jmse 09 01136 g011
Publisher’s Note: MDPI stays neutral with regard to jurisdictional claims in published maps and institutional affiliations.

