Article

Fractionation Analysis of Iron in Coastal Rivers to Yantai Sishili Bay with a Bismuth Microrods-Based Electrochemical Sensor

1
School of Chemistry and Chemical Engineering, Linyi University, Linyi 276000, China
2
Research Center for Coastal Environment Engineering Technology of Shandong Province, CAS Key Laboratory of Coastal Environmental Processes and Ecological Remediation, Shandong Key Laboratory of Coastal Environmental Processes, Yantai Institute of Coastal Zone Research, Chinese Academy of Sciences, Yantai 264003, China
3
Center for Ocean Mega-Science, Chinese Academy of Sciences, Qingdao 266071, China
*
Authors to whom correspondence should be addressed.
J. Mar. Sci. Eng. 2021, 9(10), 1063; https://doi.org/10.3390/jmse9101063
Submission received: 1 September 2021 / Revised: 21 September 2021 / Accepted: 23 September 2021 / Published: 28 September 2021
(This article belongs to the Special Issue Detection of Trace Metals in Coastal Zones)

Abstract

:
As an essential metal micronutrient, Fe plays an important role in the marine biogeochemical cycling process, and the bioavailability of Fe has a direct relationship with its fractions in water. The fractionation analysis of iron in main coastal rivers to Yantai Sishili Bay was achieved with an electrochemical sensor based on bismuth microrods (BiMRs). The sensor was characterized by scanning electron microscope and electrochemical methods, and the reliability of the sensor was verified by the determination of the standard samples. Different fractions of iron in coastal river waters, including total iron (TFe), total dissolved iron (TDFe) and particulate iron (PFe), have been determined by combining simple sample pretreatments and cathodic stripping voltammetry with the BiMRs-based sensor. The average concentrations of TFe in Guangdang River, Xin’an River and Yuniao River were 4.02, 3.66 and 4.42 μmol L−1, respectively. The main fractionation of iron in three rivers was PFe, which accounts for 84.46%, 87.56% and 92.34%, respectively. Furthermore, the relationships between iron concentration and tidal action, salinity, dissolved oxygen and other factors were also investigated.

1. Introduction

Although iron (Fe) is a relatively abundant metal element in the earth’s crust, with an abundance of about 5–6% [1,2,3], its content in water environments is relatively low. The concentration of Fe in river water is about 10−6 mol L−1, and the concentration range of Fe in coastal waters is 10−9 to 10−6 mol L−1 [4,5]. For aquatic plants and algae, Fe is an essential metal element for metabolic processes such as electron transport, chlorophyll synthesis, nitrate reduction, respiration and photosynthesis [6]. It was found that Fe, like other macronutrients, is an important factor limiting marine primary productivity [7,8]. In addition to the rich nitrogen and phosphorus nutrients, Fe may be the key factor in the formation of red tide [9]. In recent years, it has been found that the bioavailability of Fe has a direct relationship with its fractionation in water [10,11]. Thus, the fractionation analysis of iron is accordingly a priority to understand coastal water dynamics.
Among the techniques for fractionation analysis of metals, electrochemical method has been widely used because of its simple equipment, fast analysis speed and high sensitivity. Voltammetry can achieve the determination of metal ions with different valence states, such as Fe3+ and Fe2+, by controlling the potential and combining with some necessary pretreatments (such as complexation) [12]. Reactive Fe species can be sensitively determined by adsorptive cathodic stripping voltammetry using 1-nitroso-2-naphthol, 2,3-dihydroxynaphthalene, 2-(2-thiazolylazo)-p-cresol or salicylaldoxime as complexing agent [13,14,15,16]. The combination of electrochemical method and titration experiment of metal ions can be used to determine the complex stability constant of metals. Subsequently, the binding strength of metals and the binding capacity of adsorbates can be judged by the complexation constant [13,17]. Voltammetry can also be directly used for the speciation analysis of metal ions. Annibaldi et al. studied the distribution of total, particulate and dissolved concentrations of Pb, Cu and Cd in the estuarine region using a mercury electrode combined with a simple pretreatment process [18].
In recent years, considering the high toxicity of mercury, much attention has been paid to the fabrication of new chemically modified electrodes for the voltammetric determination and fractionation analysis of Fe [19,20]. To date, many bismuth-based electrodes, such as bismuth film, bismuth nanotube and bismuth nanoparticle modified electrodes, have been developed for the determination of metals with the advantages of low toxicity, high sensitivity and ability to form alloys with metals, which can significantly improve the sensitivity [21,22,23,24]. It has been reported that the performance of the bismuth-based electrodes depends largely on their surface morphology, such as shapes and sizes, and the bismuth microrods (BiMRs)-based electrode has a better analytical performance for Fe determination [25].
In this work, a BiMRs-based electrochemical sensor was fabricated and used for the fractionation analysis of Fe in main coastal rivers to Yantai Sishili Bay including Guangdang River, Xin’an River and Yuniao River. The fractionation analysis of Fe in coastal water samples was achieved by the combination of simple pretreatments and cathodic stripping voltammetry. Furthermore, the distribution of total Fe (TFe), different fractions of Fe, total dissolved Fe (TDFe) and particulate Fe (PFe) as well as their relationships with environmental physical and chemical parameters were also studied.

2. Materials and Methods

2.1. Reagents and Materials

The stock standard solution of Fe was supplied by Acros Organics and the working solutions with different concentrations were obtained by corresponding dilution. The Fe standard samples (GSB 07-1188-2000) for method accuracy verification were purchased from the national standard material center (China). This was the synthetic environmental standard sample that was used in the evaluation, validation and technical arbitration of environmental monitoring and related analytical methods. If not otherwise stated, all the other reagents were analytical-grade chemicals provided by Sinopharm Chemical Reagent Co. Ltd., Shanghai, China. All the experiments were carried out at atmospheric pressure and room temperature. All containers were soaked in 5% HNO3 solution for 24 h and thoroughly washed with deionized water.

2.2. Apparatus

The morphology of the BiMRs was characterized by scanning electron microscopy (SEM Hitachi S-4800 microscope, Tokyo, Japan). All the electrochemical experiments were carried out on the electrochemical Work Station (CHI 660E, CH Instruments, Shanghai, China). The working electrode was the BiMRs-modified glassy carbon electrode (BiMRs/GCE), the reference electrode was an Ag/AgCl (3 mol L−1 KCl) and the auxiliary electrode was a platinum foil electrode. All potentials were measured with respect to the Ag/AgCl reference electrode. The physical and chemical parameters of the coastal river water samples were measured by YSI multi parameter water quality analyzer (Proplus, Dublin, Ireland).

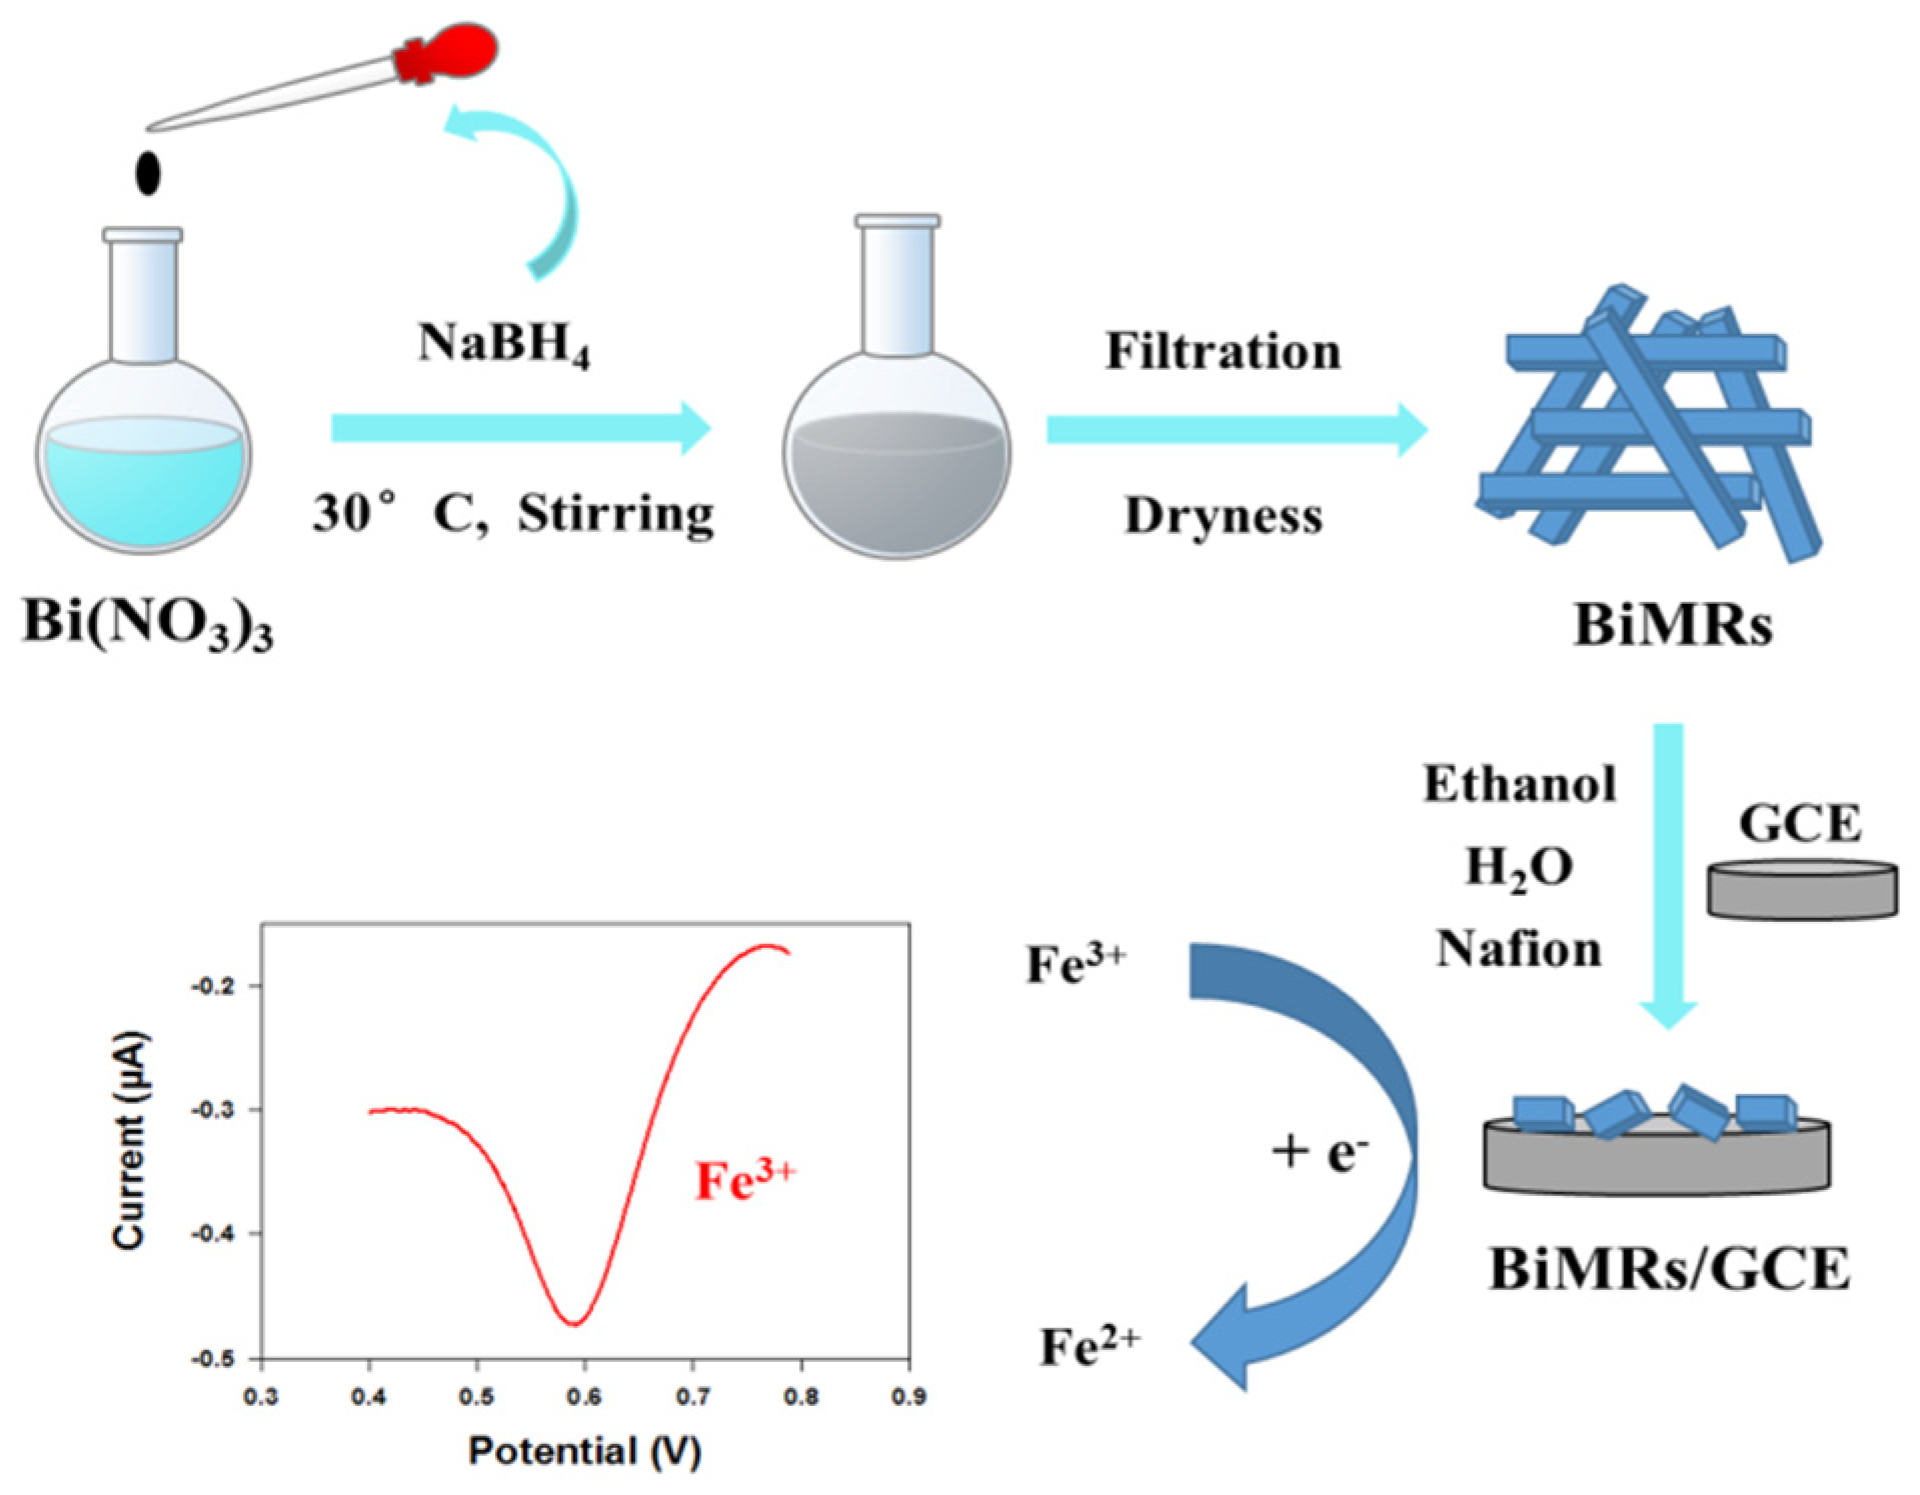
2.3. Preparation of the BiMRs/GCE

The BiMRs were synthesized by chemical reduction according to our previous work [25]. The illustration for the fabrication process of BiMRs/GCE and voltammetric detection of Fe3+ is showed in Scheme 1. The bismuth nitrate solution was transferred to a round-bottom flask and placed in an oil bath at a temperature of 30 °C. Then, the freshly prepared sodium borohydride solution (NaBH4), which acted as reductive agent, was dropped into the flask containing bismuth nitrate under stirring. In order to prepare the BiMRs, the ratio of Bi(NO3)3 and NaBH4 was set to 6. Finally, the insoluble substances appeared with the addition of reductive agent was filtered, washed with distilled water and dried in a vacuum drying oven at 60 °C for 4 h. For comparison, bismuth nanoparticles (BiNPs) were prepared as per the previous point with the ratio of Bi(NO3)3 and NaBH4 controlled as 4.5.
The BiMRs (2 mg) was dispersed in 1 mL mixture solution of ethanol (30%), H2O (63.75%) and Nafion (6.25%) with the assistant of ultrasonic for 30 min to obtain the BiMRs suspension (2 mg mL−1). Before use, the bare GCE was mechanically polished on a microcloth with alumina slurry, washed, ultrasonicated with deionized water for 1 min and subjected to potential cycling until reproducible cyclic voltammograms were obtained. Finally, the BiMRs suspension (5 μL) was dropped onto the surface of GCE and dried with the help of infrared lamp to obtain the BiMRs/GCE. The BiNP-modified GCE (BiNP/GCE) was prepared with a similar process.

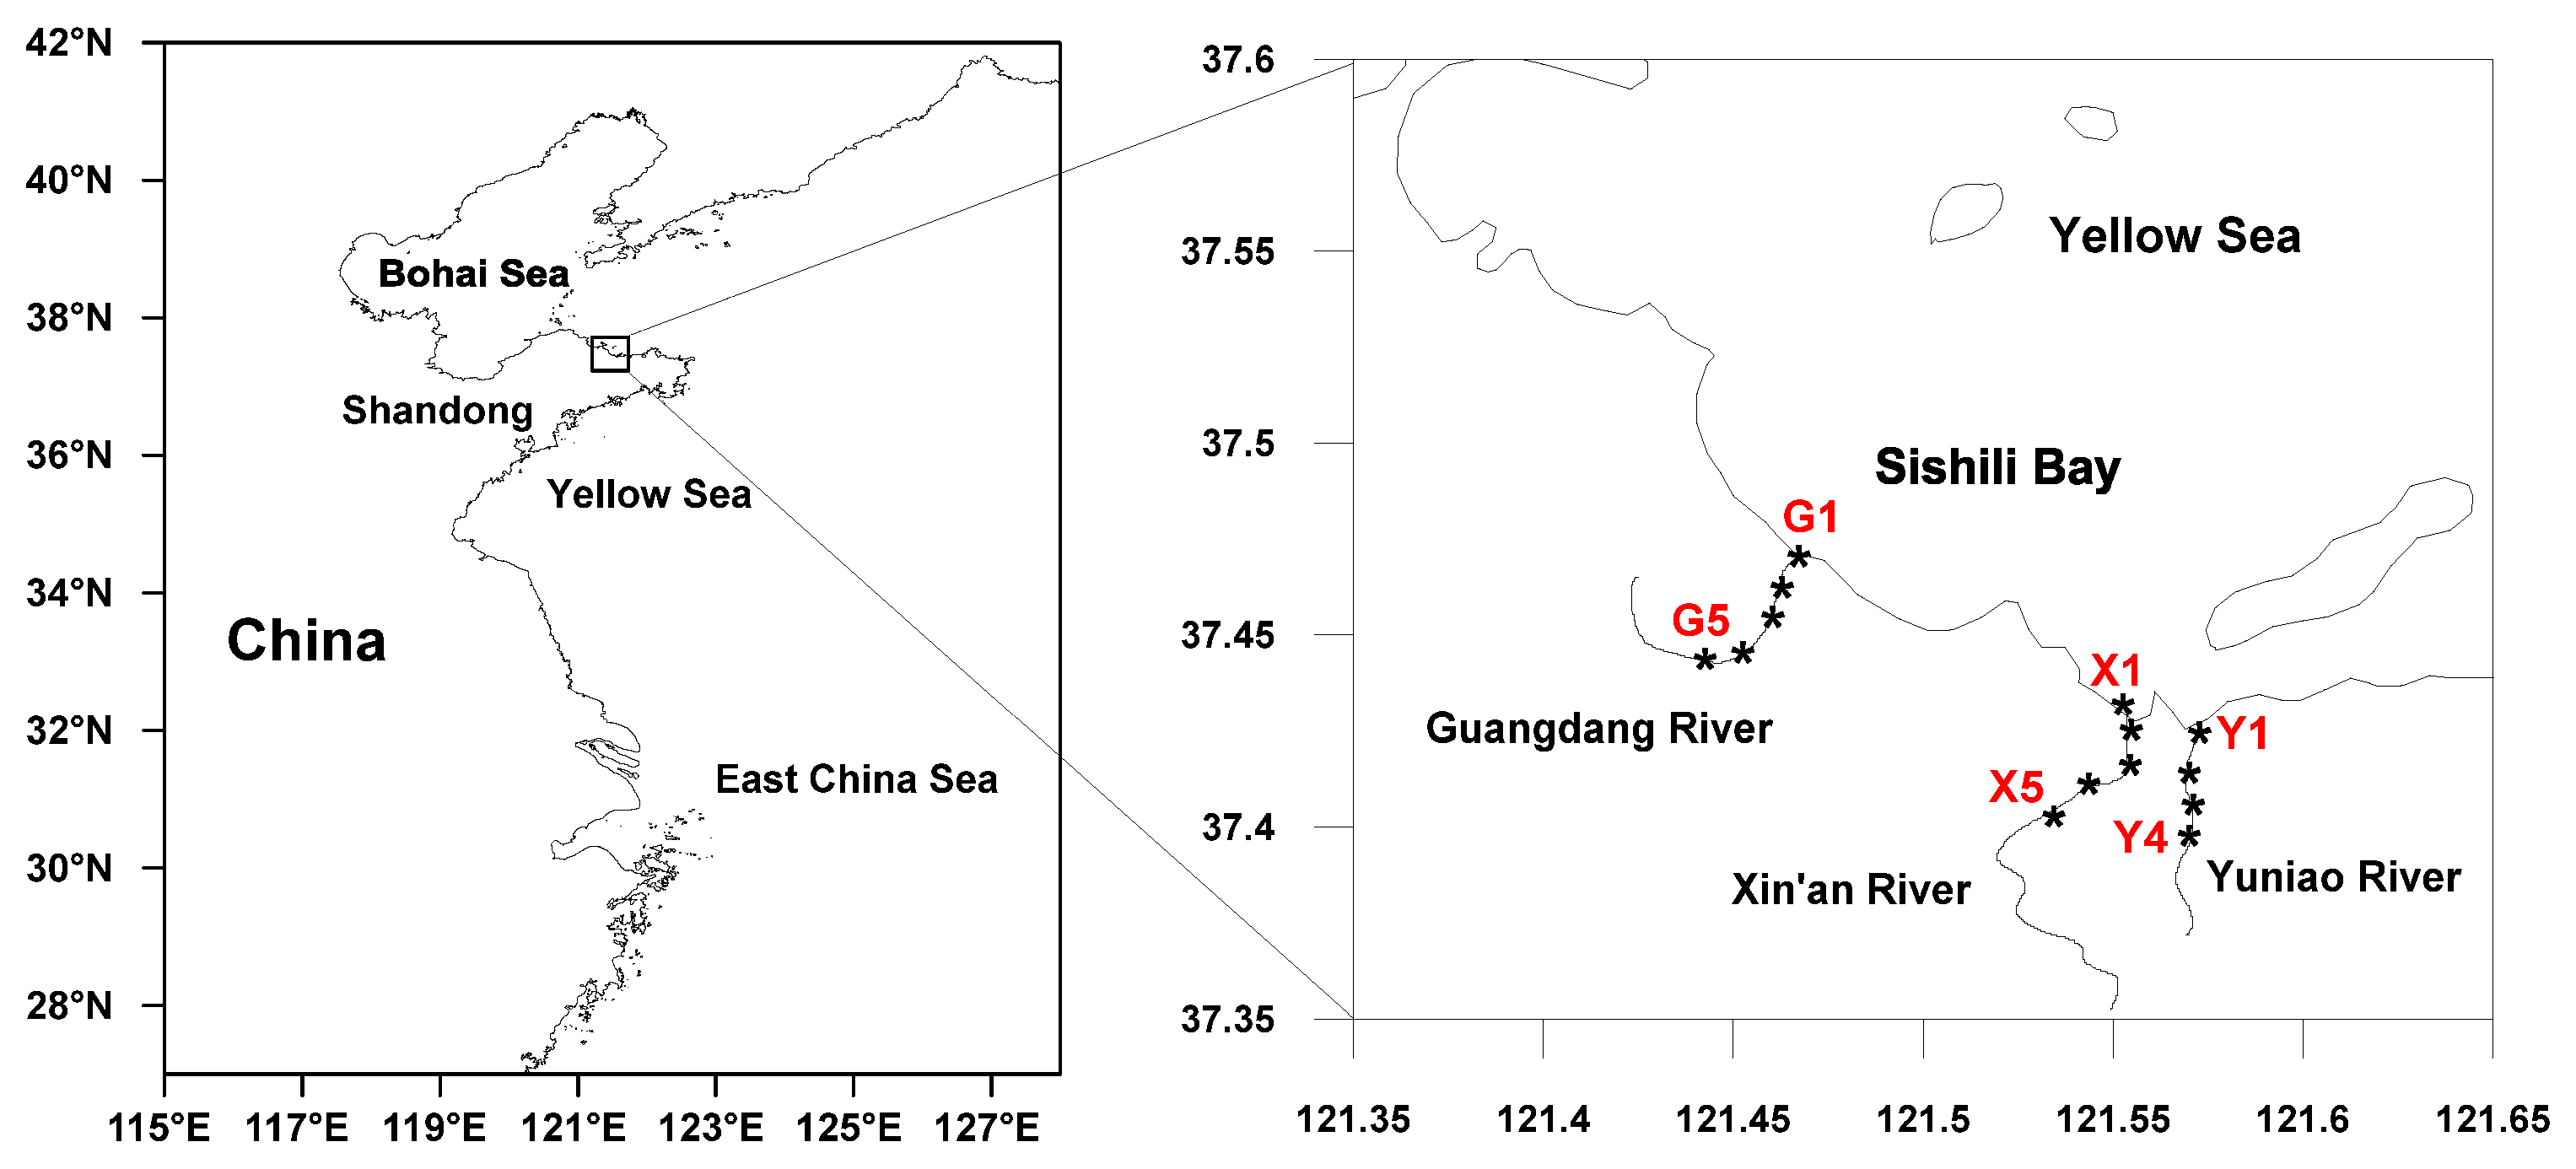
2.4. Collection and Processing of Coastal River Water Samples

A total of 14 water samples were collected from the areas near the estuaries of the Guangdang River, Xin’an River and Yuniao River, which flowed into the Yantai Sishili Bay in 14–16 June 2017. The sampling locations are showed in Figure 1. Coastal river water samples were collected into polypropylene containers washed previously with HCl (1 mol L−1) and distilled water thoroughly. After collection, the samples were processed according to the process diagram of Fe fractionation analysis, shown in Figure 2. The samples for TFe determination were acidified with HCl to pH 1.8 for 24 h to release the particulate Fe and organic matter complexed Fe. Then, the samples were filtered (0.45 μm cellulose acetate membrane) and stored in the fridge at 4 °C. The water samples for TDFe determination were filtered with 0.45 μm membrane immediately after sampling, acidified with HCl and refrigerated at 4 °C.

2.5. Electrochemical Analysis Procedure

A conventional three electrode system consisting of a BiMRs/GCE, a platinum foil auxiliary electrode and a silver chloride reference electrode (Ag/AgCl) was employed for the electrochemical detection. The differential pulse voltammograms (DPV) were recorded in the supporting electrolyte of 0.05 mol L−1 HCl. Coastal river water samples were diluted with the supporting electrolyte and analyzed by using the standard addition method. During the analysis, the modified electrode will be immersed in the electrolyte containing Fe(III) and KBrO3 for a while with stirring to let the Fe(III) absorbed onto the surface of the electrode. The presence of KBrO3 may result in an enhancement of the Fe(III) response. Then, the reduction responses of Fe(III) to Fe(II) at the electrodes were investigated by DPV, with the following parameters: initial potential 0.7 V, termination potential 0.3 V, amplitude 0.025 V, step potential 0.004 V, frequency 10 Hz and equilibrium time 2 s. Each sample was determined three times. Concentrations of TFe and TDFe were directly determined with the BiMRs/GCE, and the concentration of PFe was obtained by a subtraction method (as described in Figure 2).

3. Results and Discussion

3.1. Characterization of the BiMRs/GCE

After preparation, the surface morphology of the BiMRs was characterized by SEM. In Figure 3, the inerratic microrods can be seen clearly from the SEM images of the BiMRs under different magnifications. All the BiMRs were cuboid with an average length and width of 10 μm and 2 μm, respectively, and were uniformly distributed on the electrode surface. The surface of BiMRs was very smooth, as described in our previous work [25]. It should be noted that the surface morphology of the Bi nanomaterials varied greatly with the difference of the ratio of Bi(NO3)3 and NaBH4, and the microrod shape had the superior performance than nanoparticles for the voltammetric determination of Fe [25].

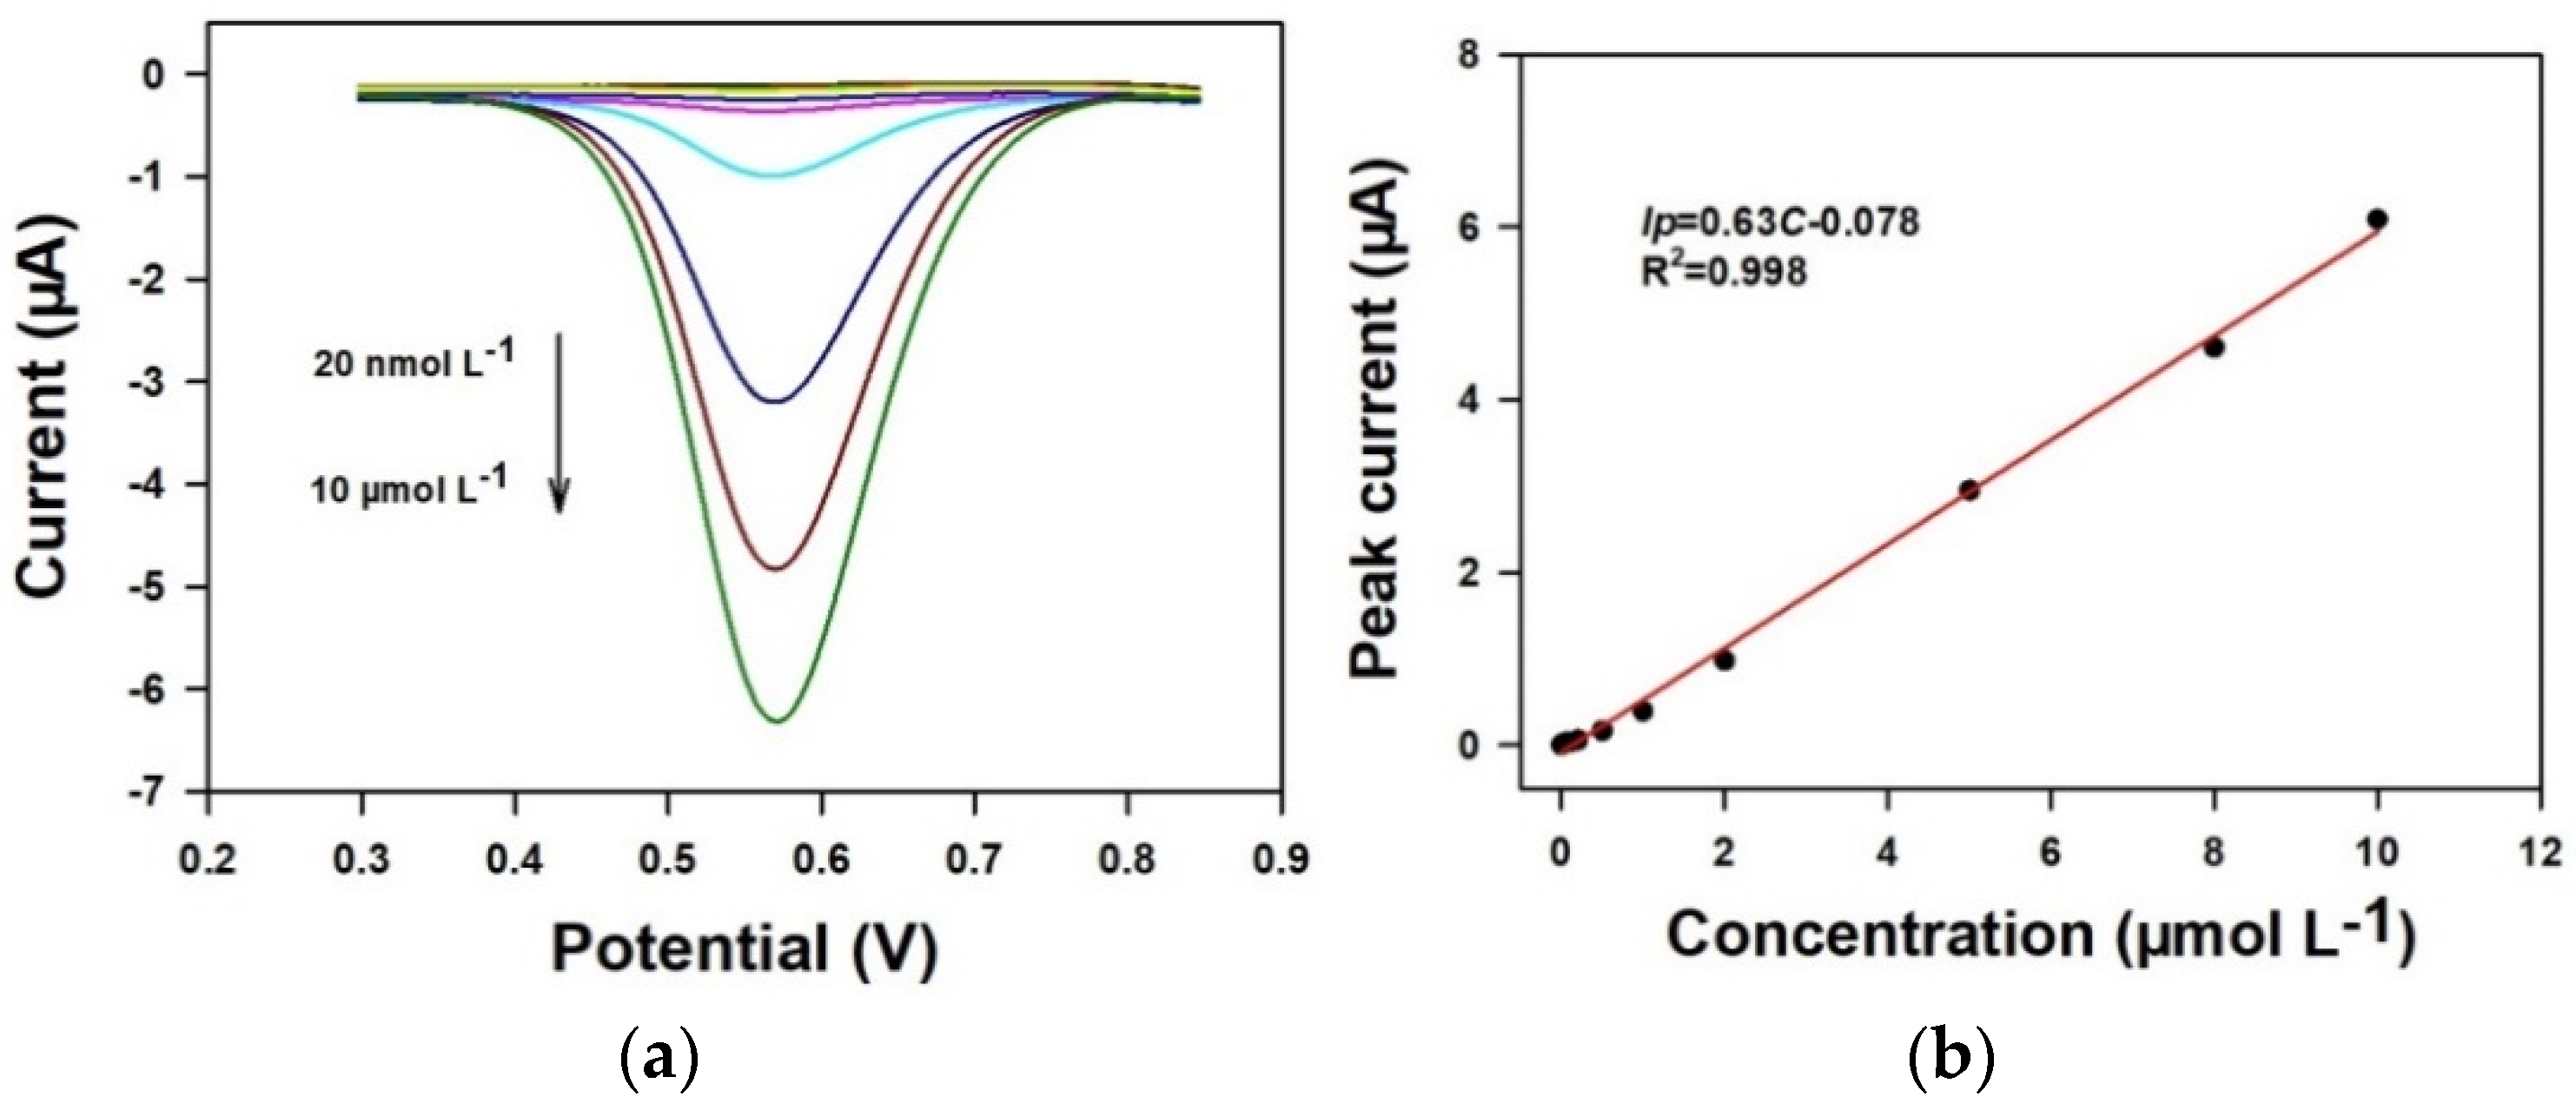
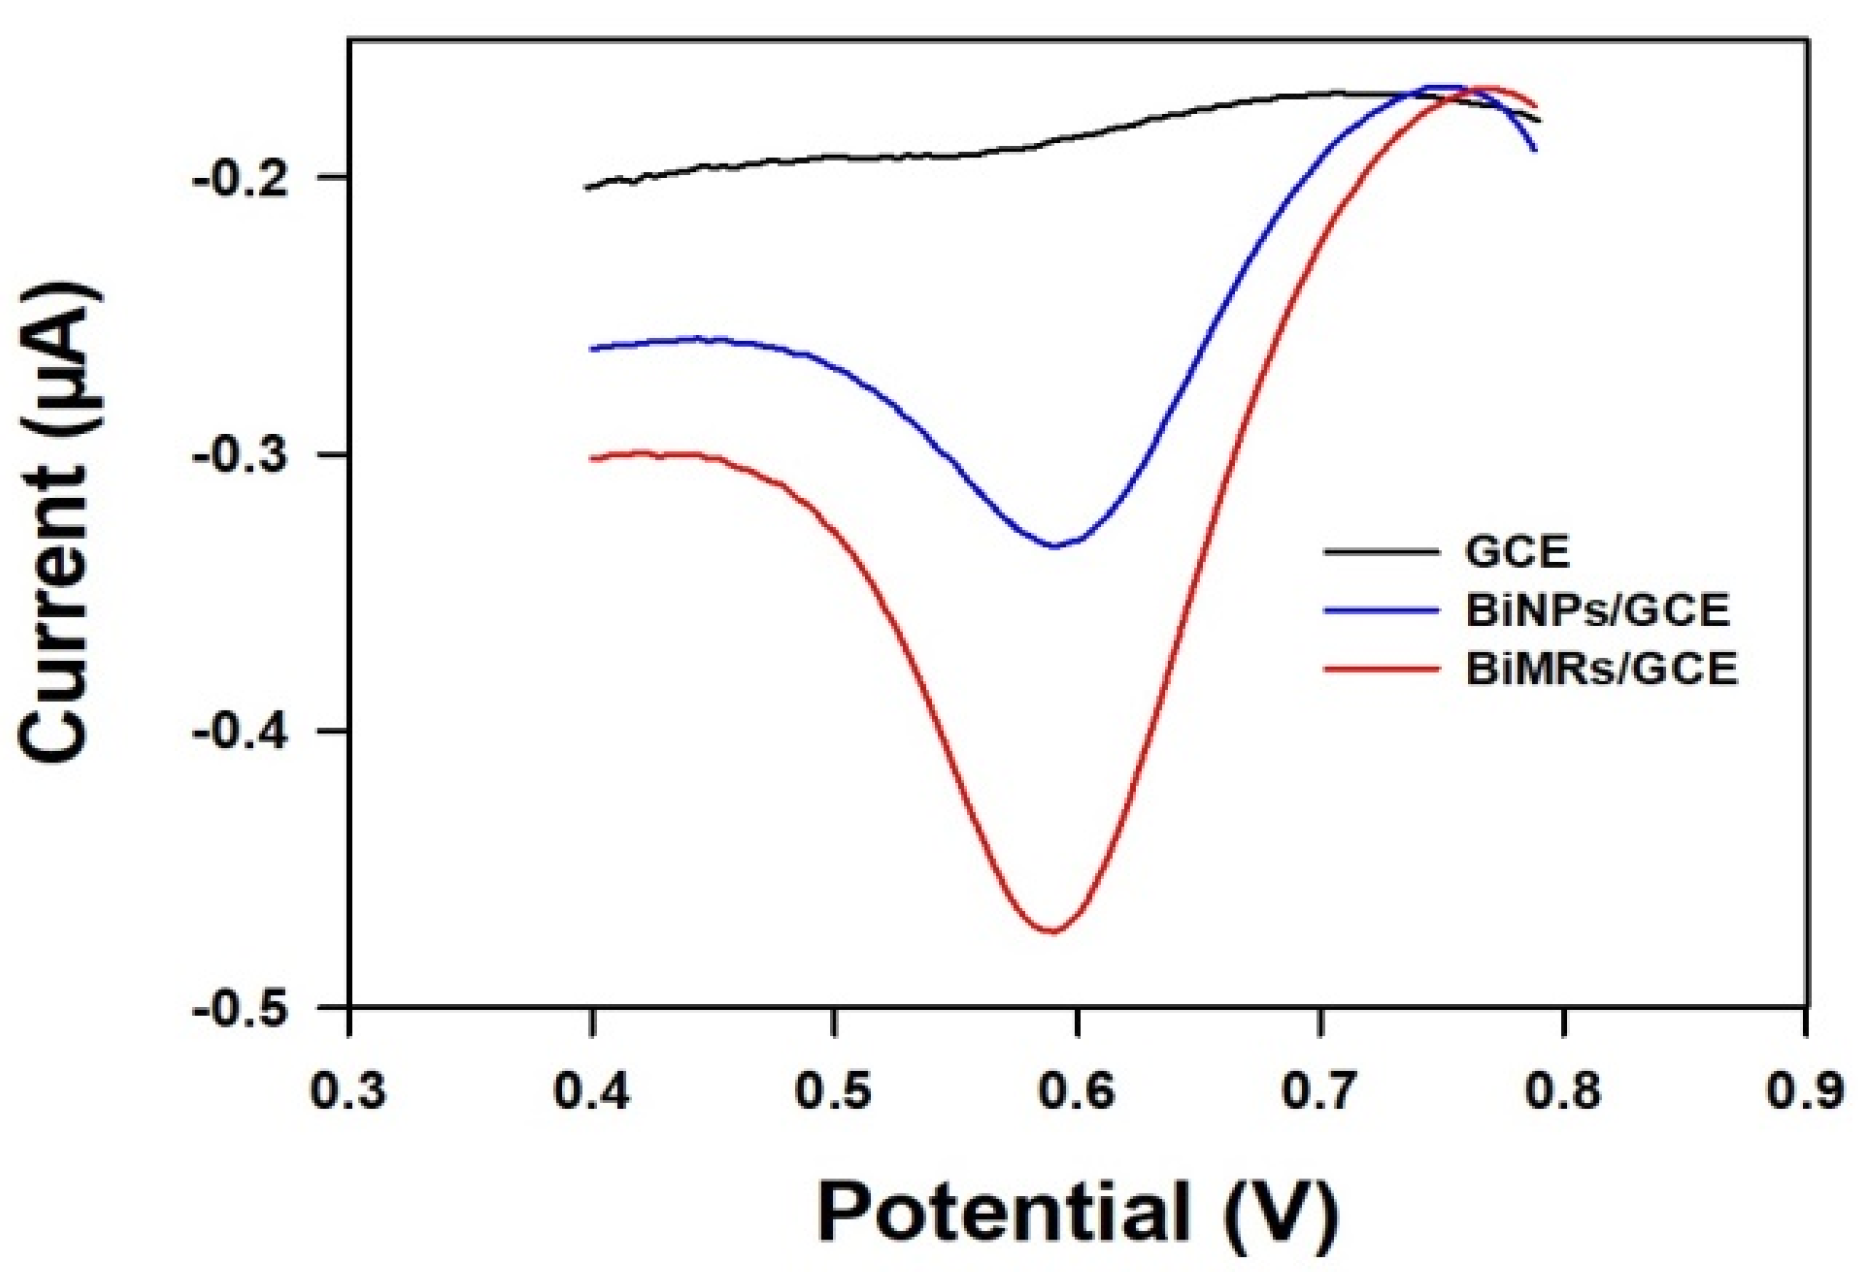
3.2. Voltammetric Response of Fe3+ on the BiMRs/GCE

To investigate the performance of the so-fabricated BiMRs-based sensor, the bare GCE, BiNP/GCE, and BiMRs/GCE were studied for the determination of 1 μmol L−1 Fe3+, and the results are shown in Figure 4. Obviously, the bare GCE had no any current signal for the electrochemical reduction of Fe3+. After the modification of BiNPs, the BiNP/GCE showed an apparent reduction current signal of Fe3+. Interestingly, the reduction current signal obtained at BiMRs/GCE was much higher than that of the BiNP/GCE. It could be concluded that Bi micro/nano-materials could improve the performance of the electrode for Fe determination, and the BiMRs had superior performance compared to BiNPs. Thus, in this work, BiMRs/GCE was adopted for the determination of Fe in coastal river waters.

3.3. Performance and Verification of BiMRs/GCE for Fe Determination

Figure 5 showed the differential pulse voltammograms (a) and corresponding calibration curve (b) obtained at the BiMRs/GEC for the voltammetric determination of Fe3+. The linear range of the BiMRs/GEC for Fe3+ determination was 0.02–10 μmol L−1 with a limit of detection (LOD) of 6.4 nmol L−1. LOD was calculated by the formula LOD = 3s/k, where s is the standard deviation of the blank measurements that was estimated by the standard deviation of the current value when measuring blank electrolyte repeatedly and k is the sensitivity of the calibration graph. In addition, Bi-based materials modified electrode also had good reproducibility, repeatability and anti-interference ability, as described in our previous work [26].
In order to verify the accuracy of the BiMRs/GEC for Fe determination, the environmental standard samples with verified Fe concentrations were analyzed. Table 1 shows the comparison of the results obtained at the BiMRs/GEC with values of the environmental standard samples. It can be seen that the results were very consistent, which reflected the accuracy of the so-fabricated BiMRs-based sensor.

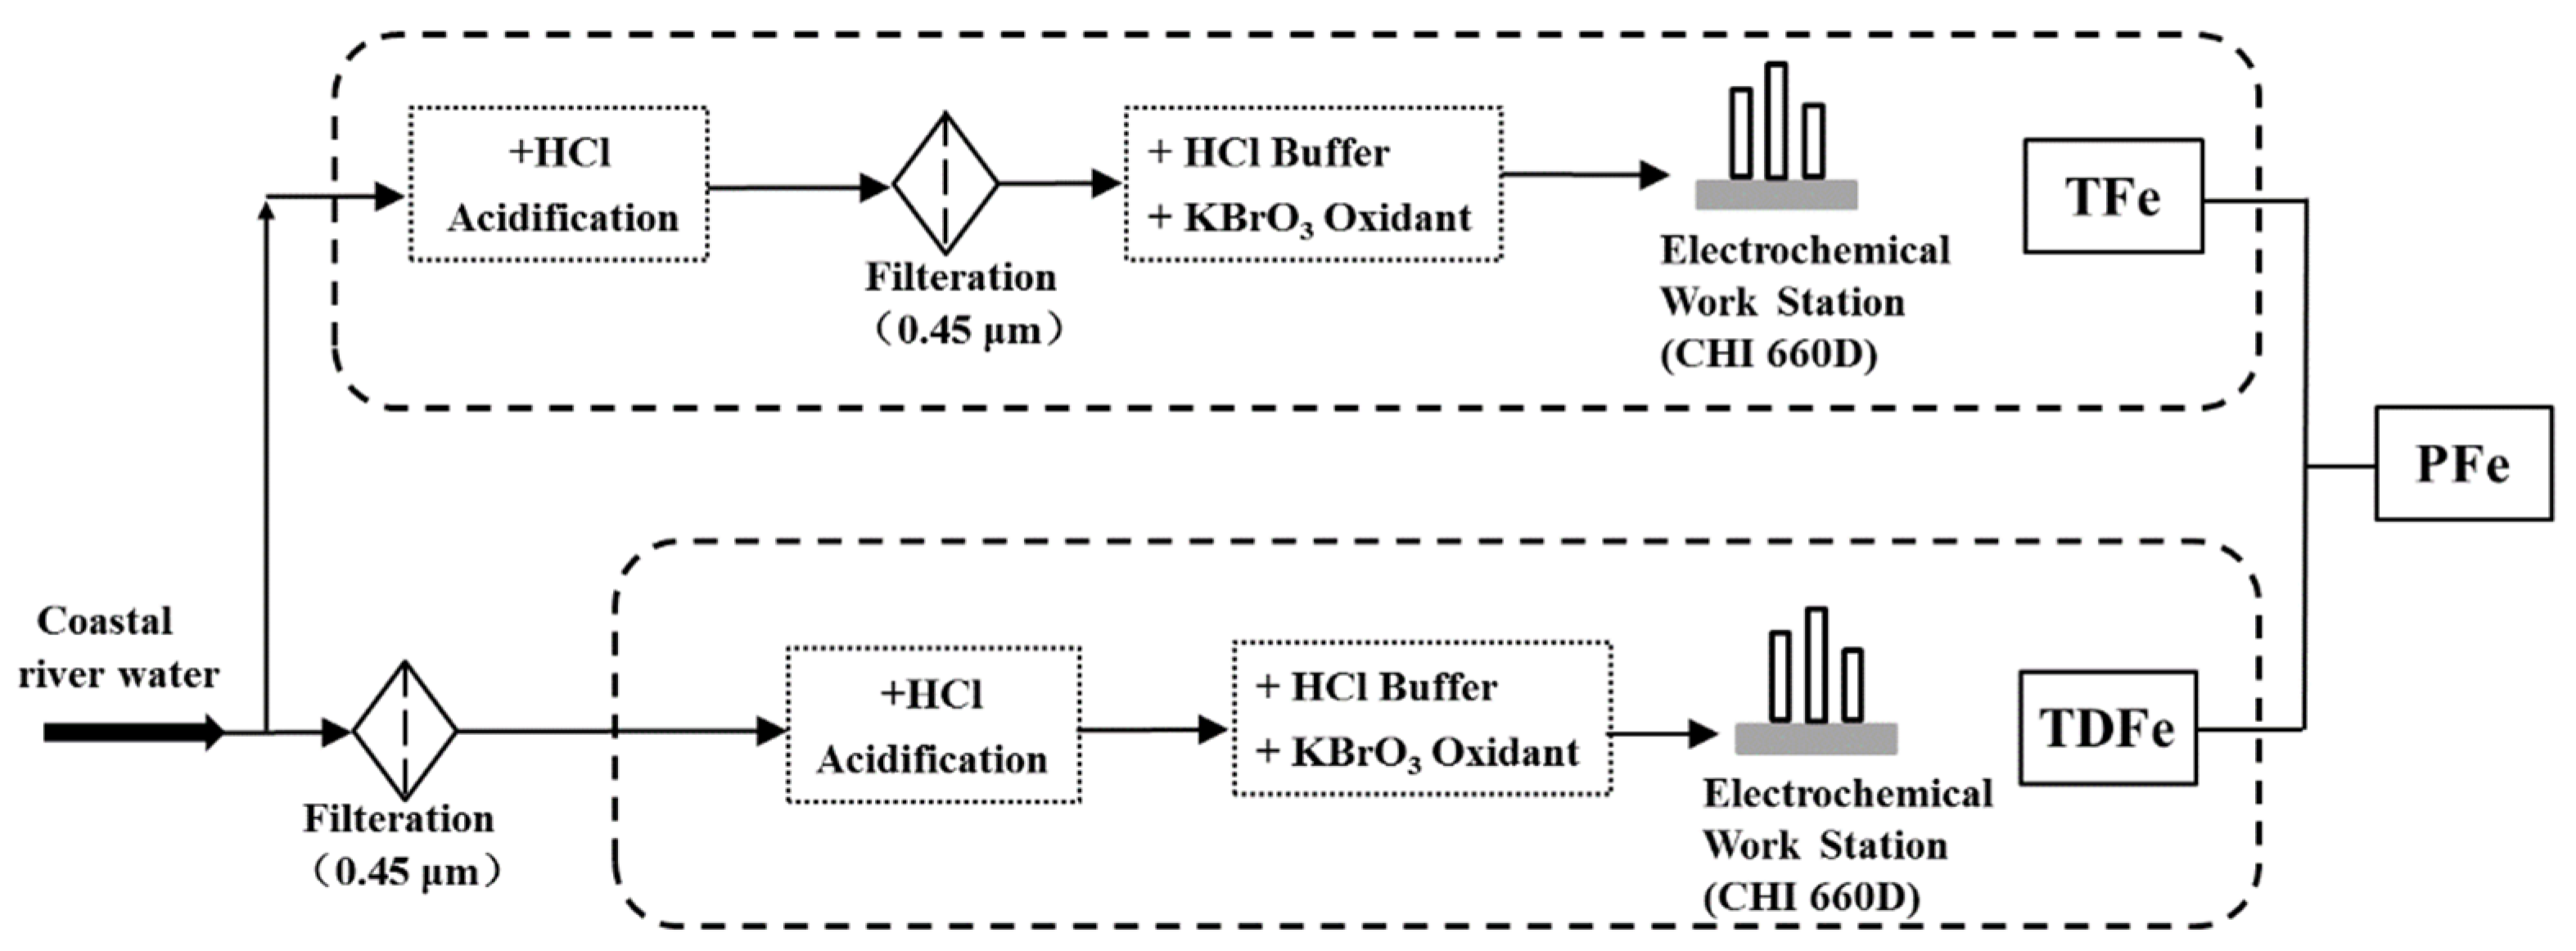
3.4. Fractionation Analysis of Fe in Coastal River Waters

The concentrations of different fractions of Fe in coastal river waters at 14 stations in the study area were determined with the BiMRs-based sensor, as shown in Table 2. It can be seen that the concentrations of Fe in the three selected rivers flowing into the Yantai Sishili Bay were relatively high, with the highest being 13.6 μmol L−1 (G4) and the lowest being 0.96 μmol L−1 (Y1). The average concentrations of TFe in Guangdang River, Xin’an River and Yuniao River were 4.02, 3.66 and 4.42 μmol L−1, respectively. The percentage of PFe in TFe was more than 80%, except for station G2, which indicated that Fe exited mainly in the form of PFe in the coastal rivers flowing into Yantai Sishili Bay. The fractionation of Fe directly affects its bioavailability, and the dissolved Fe3+ and Fe2+ in TDFe are the main bioavailable fractions [10]. The dissolved Fe2+ is unstable in the environment and easily oxidized to Fe3+. However, most of the dissolved Fe3+ exists in the form of complexation with organic ligands, and little in the form of free ions and inorganic complexes [27,28,29]. Therefore, considering the large proportion of PFe, which was not easy to be absorbed, although the contents of TFe in the three coastal rivers water were relatively high, there was not so much Fe that could be utilized by phytoplankton.

3.5. Concentration Distribution of Different Fractions of Fe in Coastal River Waters

The concentration distribution of different fractions of Fe in the three main coastal rivers is shown in Figure 6. The two curves describe the changing tendency of TFe and TDFe concentrations from the estuary to the upstream of the rivers, respectively. From the estuary to the upstream, the TFe concentration firstly increased and then decreased, with the minimum concentration at the station near the estuary. The changing trend was the same for all three rivers. Considering the tidal action, the mixing of river water with high Fe concentration and seawater with low Fe concentration was obvious and violent near the estuary. Thus, the Fe concentration at the estuary was lower than that in the rivers. With the stations away from the estuary, the influence of tide action on river water was reduced, and the Fe concentration increased accordingly. The decrease of TFe concentration at the last station might be explained by the relatively small water flow and stagnant or cut-off state of the three rivers. The TFe concentration at the last station was not affected by seawater intrusion, which could increase the PFE content, decreasing the TFe concentration. Considering the small content and little effect of seawater intrusion, the changing tendency of TDFe concentration was not obvious. The Fe concentration in coastal seawater was greatly affected by the terrestrial river containing a large amount of Fe [30].

3.6. Correlation Analysis of Fe Fractions with Physical and Chemical Parameters

The physical and chemical parameters of river water samples had a significant influence on the concentration distribution of Fe fractions. Pearson’s correlation analysis of the Fe fractions with the environmental parameters of the river waters in the studied area was carried out, and the corresponding results are shown in Table 3. The relationships between Fe fractions and salinity (SA) and dissolved oxygen (DO) in each river were analyzed in detail (Figure 7).
It can be concluded from Table 3 and Figure 7 that the concentrations of different fractions of Fe are negatively correlated with conductivity and SA, but positively correlated with DO. The concentrations of TFe, PFe and TDFe had the greatest correlation with DO, with an average correlation coefficient of 0.61. The three fractions of Fe had no obvious correlation with pH, and the absolute value of correlation coefficient was less than 0.3. As to the Guangdang River, the concentration changes of TDFe, PFe and TFe showed a consistent negative correlation with the SA of water samples and a positive correlation with DO. However, the correlation between the concentrations of different fractions of Fe and SA, as well as Do, in Xin’an River and Yuniao River was relatively poor. The reason might be that the two rivers were more seriously affected by human activities.

4. Conclusions

For the complexity of actual environmental samples, it is difficult to apply chemically modified electrodes in the analysis of environmental samples. In this paper, a BiMRs-based sensor was developed for the fractionation analysis of Fe in three coastal rivers to Yantai Sishili Bay. The BiMRs-based sensor had good sensitivity and accuracy for the voltammetric determination of Fe in coastal waters and was successfully implemented for the analysis of TFe, TDFe and PFe in Guangdang River, Xin’an River and Yuniao River. BiMRs-based sensor shows good performance in the real sample analysis, which laid a foundation for the development and application of chemical sensors in environmental sample analysis and will be helpful to the study of the different metal fractions in coastal rivers. Furthermore, the correlation analysis of Fe fractions with physical and chemical parameters of river water samples was also studied, which is conducive to the follow-up study of the migration and transformation rules and biogeochemical cycles of different iron fractions in the environment.

Author Contributions

Conceptualization, X.H. and X.S.; methodology, X.H., H.H. and C.W.; validation, X.H. and H.H.; formal analysis, X.H. and C.W.; investigation, X.H. and C.W.; resources, X.S.; data curation, X.H.; writing—original draft preparation, X.H. and H.H.; writing—review and editing, H.H. and X.S.; visualization, X.H. and H.H.; supervision, X.S.; project administration, X.H. and X.S.; funding acquisition, X.H. All authors have read and agreed to the published version of the manuscript.

Funding

This research was funded by the National Natural Science Foundation of China, grant number 21906075.

Institutional Review Board Statement

Not applicable.

Informed Consent Statement

Not applicable.

Data Availability Statement

Not applicable.

Acknowledgments

We would like to thank W. Wang for the SEM characterization of the BiMRs-based sensor.

Conflicts of Interest

The authors declare no conflict of interest.

References

  1. Taylor, S.R. Abundance of chemical elements in the continental crust: A new table. Geochim. Cosmochim. Acta 1964, 28, 1273–1285. [Google Scholar] [CrossRef]
  2. Laglera, L.M.; Santos-Echeandía, J.; Caprara, S.; Monticelli, D. Quantification of iron in seawater at the low picomolar range based on optimization of Bromate/Ammonia/Dihydroxynaphtalene system by catalytic adsorptive cathodic stripping voltammetry. Anal. Chem. 2013, 85, 2486–2492. [Google Scholar] [CrossRef] [Green Version]
  3. Worsfold, P.J.; Lohan, M.C.; Ussher, S.J.; Bowie, A.R. Determination of dissolved iron in seawater: A historical review. Mar. Chem. 2014, 166, 25–35. [Google Scholar] [CrossRef] [Green Version]
  4. Lu, M.; Rees, N.V.; Kabakaev, A.S.; Compton, R.G. Determination of iron: Electrochemical methods. Electroanalysis 2012, 24, 1693–1702. [Google Scholar] [CrossRef]
  5. Zhu, Y.; Pan, D.; Hu, X.; Han, H.; Lin, M.; Wang, C. An electrochemical sensor based on reduced graphene oxide/gold nanoparticles modified electrode for determination of iron in coastal waters. Sens. Actuators B Chem. 2017, 243, 1–7. [Google Scholar] [CrossRef]
  6. Melton, E.D.; Swanner, E.D.; Behrens, S.; Schmidt, C.; Kappler, A. The interplay of microbially mediated and abiotic reactions in the biogeochemical Fe cycle. Nat. Rev. Microbiol. 2014, 12, 797–808. [Google Scholar] [CrossRef]
  7. Martin, J.H.; Fitzwaterr, S. Iron deficiency limits phytoplank-ton growth in the north-east Pacific subarctic. Nature 1988, 331, 341–343. [Google Scholar] [CrossRef]
  8. Han, H.; Pan, D. Voltammetric methods for speciation analysis of trace metals in natural waters. Trends Environ. Anal. Chem. 2021, 29, e00119. [Google Scholar] [CrossRef]
  9. Wells, M.L.; Trick, C.G. Controlling iron availability to phytoplankton in iron-replete coastal waters. Mar. Chem. 2004, 86, 1–13. [Google Scholar] [CrossRef]
  10. Anderson, M.A.; Morel, F.M.M. The influence of aqueous iron chemistry on the uptake of iron by the coastal diatom Thalassiosira weissflogii. Limnology 1982, 27, 789–813. [Google Scholar] [CrossRef]
  11. De Jonge, M.; Lofts, S.; Bervoets, L.; Blust, R. Relating metal exposure and chemical speciation to trace metal accumulation in aquatic insects under natural field conditions. Sci. Total Environ. 2014, 496, 11–21. [Google Scholar] [CrossRef] [Green Version]
  12. Laglera, L.M.; Monticelli, D. Iron detection and speciation in natural waters by electrochemical techniques: A critical review. Curr. Opin. Electrochem. 2017, 3, 123–129. [Google Scholar] [CrossRef]
  13. Gledhill, M.; van den Berg, C.M.G. Determination of complexation of iron(III) with natural organic complexing ligands in seawater using cathodic stripping voltammetry. Mar. Chem. 1994, 47, 41–54. [Google Scholar] [CrossRef]
  14. Van den Berg, C.M.G. Chemical speciation of iron in seawater by cathodic stripping voltammetry with dihydroxynaphthalene. Anal. Chem. 2006, 78, 156–163. [Google Scholar] [CrossRef] [PubMed]
  15. Croot, P.L.; Johansson, M. Determination of iron speciation by cathodic stripping voltammetry in seawater using the competing ligand 2-(2-Thiazolylazo)-p-cresol (TAC). Electroanalysis 2000, 12, 565–576. [Google Scholar] [CrossRef]
  16. Abualhaija, M.M.; van den Berg, C.M.G. Chemical speciation of iron in seawater using catalytic cathodic stripping voltammetry with ligand competition against salicylaldoxime. Mar. Chem. 2014, 164, 60–74. [Google Scholar] [CrossRef]
  17. Pesavento, M.; Alberti, G.; Biesuz, R. Analytical methods for determination of free metal ion concentration, labile species fraction and metal complexation capacity of environmental waters: A review. Anal. Chim. Acta 2009, 631, 129–141. [Google Scholar] [CrossRef]
  18. Annibaldi, A.; IIIuminati, S.; Truzzi, C.; Libani, G.; Scarponi, G. Pb, Cu and Cd distribution in five estuary systems of Marche, central Italy. Mar. Pollut. Bull. 2015, 96, 441–449. [Google Scholar] [CrossRef]
  19. Han, H.; Pan, D.; Pan, F.; Hu, X.; Zhu, R. A functional micro-needle sensor for voltammetric determination of iron in coastal waters. Sens. Actuators B Chem. 2021, 327, 128883. [Google Scholar] [CrossRef]
  20. Zhu, Y.; Hu, X.; Pan, D.; Han, H.; Lin, M.; Lu, Y.; Wang, C.; Zhu, R. Speciation determination of iron and its spatial and seasonal distribution in coastal river. Sci. Rep. 2018, 8, 2576. [Google Scholar] [CrossRef] [Green Version]
  21. Wang, Z.Q.; Liu, G.; Zhang, L.N.; Wang, H. A bismuth modified hybrid binder carbon paste electrode for electrochemical stripping detection of trace heavy metals in soil. Int. J. Electrochem. Sci. 2012, 7, 12326–12339. [Google Scholar]
  22. Li, Y.; Sun, G.; Zhang, Y.; Ge, C.; Bao, N.; Wang, Y. A glassy carbon electrode modified with bismuth nanotubes in a silsesquioxane framework for sensing of trace lead and cadmium by stripping voltammetry. Microchim. Acta 2014, 181, 751–757. [Google Scholar] [CrossRef]
  23. Lee, G.J.; Lee, H.M.; Rhee, C.K. Bismuth nano-powder electrode for trace analysis of heavy metals using anodic stripping voltammetry. Electrochem. Commun. 2007, 9, 2514–2518. [Google Scholar] [CrossRef]
  24. Han, H.; Pan, D.; Li, Y.; Wang, J.; Wang, C. Stripping voltammetric determination of lead in coastal waters with a functional micro-needle electrode. Front. Mar. Sci. 2020, 7, 196. [Google Scholar] [CrossRef]
  25. Hu, X.; Pan, D.; Han, H.; Lin, M.; Wang, C. Preparation of bismuth-based microrods and their application in electroanalysis. Mater. Lett. 2017, 190, 83–85. [Google Scholar] [CrossRef]
  26. Hu, X.; Pan, D.; Lin, M.; Han, H.; Li, F. Graphene oxide-assisted synthesis of bismuth nanosheets for catalytic stripping voltammetric determination of iron in coastal waters. Microchim. Acta 2016, 183, 855–861. [Google Scholar] [CrossRef]
  27. Liu, X.; Millero, F.J. The solubility of iron in seawater. Mar. Chem. 2002, 77, 43–54. [Google Scholar] [CrossRef]
  28. Sukekava, C.; Downes, J.; Slagter, H.A.; Gerringa, L.J.A.; Laglera, L.M. Determination of the contribution of humic substances to iron complexation in seawater by catalytic cathodic stripping voltammetry. Talanta 2018, 189, 359–364. [Google Scholar] [CrossRef] [PubMed]
  29. González, A.G.; Cadena-Aizaga, M.I.; Sarthou, G.; González-Dávila, M.; Santana-Casiano, J.M. Iron complexation by phenolic ligands in seawater. Chem. Geol. 2019, 511, 380–388. [Google Scholar] [CrossRef]
  30. Jiann, K.T.; Wen, L.S. Distribution and lability of dissolved iron in surface waters of maginal seas in southeastern Asia. Estuar. Coast. Shelf Sci. 2012, 100, 142–149. [Google Scholar] [CrossRef]
Scheme 1. The illustration for the fabrication process of BiMRs/GCE and voltammetric detection of Fe3+.
Jmse 09 01063 sch001
Figure 1. Sampling station locations of the main coastal rivers of Yantai Sishili Bay.
Jmse 09 01063 g001
Figure 2. Process diagram for the analysis of different Fe fractions.
Jmse 09 01063 g002
Figure 3. SEM images of the BiMRs under different magnifications, (a) 2000 times and (b) 5000 times.
Jmse 09 01063 g003
Figure 4. Differential pulse voltammograms of GCE, BiNP/GCE and BiMRs/GCE in 0.05 mol L−1 HCl solution containing 1 μmol L−1 Fe3+.
Jmse 09 01063 g004
Figure 5. Differential pulse voltammograms (a) obtained on BiMRs/GCE in 0.05 mol L−1 HCl solution with successive addition of 0.02, 0.05, 0.1, 0.2, 0.5, 1, 2, 5, 8 and 10 μmol L−1 Fe3+ and the corresponding calibration curve (b).
Jmse 09 01063 g005
Figure 6. The concentrations of different Fe fractions in the main coastal rivers to Yantai Sishili Bay.
Jmse 09 01063 g006
Figure 7. The relationships between different iron fractions and dissolved oxygen (DO) and salinity (SA) of water samples in Guangdang River (ac), Xin’an River (df) and Yuniao River (gi).
Jmse 09 01063 g007
Table 1. Comparison of the determination results with the values of the environmental standard samples (n = 3).
Standard Samples
(GSB 07-1188-2000)
Analyzed
(nmol L−1)
Reference
(nmol L−1)
Sample 1 (202414)117 ± 3.31115
Sample 2 (202415)513 ± 2.96512
Table 2. The concentrations of different fractions of Fe in coastal river waters at 14 stations in the study area.
StationsTotal Dissolved FeParticulate FeTotal Fe
Concentration (nmol L−1)Percentage (%)Concentration (nmol L−1)Percentage (%)Concentration (nmol L−1)
G1580 ± 3817.982635 ± 29682.023226 ± 282
G2663 ± 4730.921842 ± 20669.082144 ± 252
G3433 ± 747.555301 ± 4092.455735 ± 113
G4943 ± 666.7412,652 ± 29393.061359 ± 301
G51091 ± 8114.296546 ± 23785.717637 ± 319
X1324 ± 2916.991564 ± 8783.011907 ± 74
X2487 ± 6716.152562 ± 11683.853061 ± 229
X3494 ± 218.495323 ± 15991.515816 ± 178
X4451 ± 448.824677 ± 10391.185114 ± 196
X5283 ± 3211.752131 ± 8988.252409 ± 73
Y1ND 1------958 ± 53
Y2439 ± 357.925105 ± 31192.085543 ± 343
Y3604 ± 288.956143 ± 19591.056747 ± 223
Y4251 ± 315.664128 ± 28094.344433 ± 310
ND 1: Not detected.
Table 3. Pearson’s correlation matrix for different Fe fractions and the physical and chemical parameters of the water sample.
Dissolved OxygenConductivitySalinitypHTDFePFeTFe
Dissolved oxygen1.00
Conductivity−0.71 21.00
Salinity−0.69 20.99 21.00
pH−0.090.380.381.00
TDFe0.64 1−0.53−0.540.241.00
PFe0.61 1−0.52−0.530.100.62 11.00
TFe0.57 1−0.47−0.500.120.59 10.89 21.00
1 means significantly correlated at 0.05 level. 2 means significantly correlated at 0.1 level.
Publisher’s Note: MDPI stays neutral with regard to jurisdictional claims in published maps and institutional affiliations.

