Article

Numerical Study on Wave-Ice Interaction in the Marginal Ice Zone

1
School of Marine Engineering and Technology, Sun Yat-Sen University, Zhuhai 518000, China
2
Southern Marine Science and Engineering Guangdong Laboratory (Zhuhai), Zhuhai 519000, China
*
Author to whom correspondence should be addressed.
J. Mar. Sci. Eng. 2021, 9(1), 4; https://doi.org/10.3390/jmse9010004
Submission received: 27 November 2020 / Revised: 16 December 2020 / Accepted: 17 December 2020 / Published: 22 December 2020
(This article belongs to the Special Issue CFD Simulations of Marine Hydrodynamics)

Abstract

:
The effect of waves on ice sheet is critical in the marginal ice zone (MIZ). Waves break large sea ice into small pieces and cause them to collide with each other. Simultaneously, the interaction between sea ice and waves attenuates these waves. In this study, a numerical research is conducted based on a computational fluid dynamics (CFD) method to investigate the response of single ice floe to wave action. The obtained results demonstrate that the sea ice has a violent six degree of freedom (6DoF) motion in waves. Ice floes with different sizes, thicknesses, and shapes exhibit different 6DoF motions under the action of waves. The heave and surge response amplitude operator (RAO) of the sea ice are related to wavelength. Furthermore, the overwash phenomenon can be observed in the simulation. The obtained results are compared with the model test in the towing tank based on artificial ice, and they agree well with test results.

1. Introduction

The marginal ice zone (MIZ) is the area between open water and level ice sheet that is directly affected by waves. The sea ice in this area mainly exists as crushed ice due to the action of waves. With the increase in global warming, the marginal ice zone has garnered more attention. The coupling effect of sea ice and wave influences the safety and navigation performance of ships sailing in this area, and hence the need to research on the interaction between sea ice and waves before moving ahead to study the ship–wave–ice interaction in the MIZ.
The research methods of wave–ice interaction include theoretical research, model tests, and numerical simulations. At the beginning of the research, field observation and theoretical study were carried out to observe the attenuation of waves, the fracture mechanism, and movement form of sea ice in the MIZ. In 1983, a special research team was setup in the MIZ field. After that, researchers studied the sea ice changes near the MIZ of Greenland and Beaufort Seas [1,2,3,4]. Marchenko A et al. [5] carried out a field observation and test on the wave–sea ice interaction process in the MIZ of Barents Sea, and they determined that the high-frequency wave will be significantly damped when propagating under the sea ice. The frequency of energy wave decreases when it is far away from the MIZ. Kovalev P D et al. [6] observed the wave–sea ice interaction process in the south eastern coastal zone of Sakhalin Island, and obtained the interaction relationship between the generation of wave–sea ice and the dissipation process. Squire V A et al. [7] studied the wave motion and the breaking process of sea ice in the MIZ. Toyota T et al. [8] studied and analysed the distribution characteristics of the size and shape of sea ice in the Antarctic marginal ice zone at the end of winter. Zhang J et al. [9] conducted theoretical and experimental research and analyses on the size and thickness distribution of ice floes in the MIZ, and to explicitly simulate the evolution of the size and thickness of ice floes, the obtained results are combined with the thickness theory of ice floes by Thorndike et al. [10]. Gupta M [11] observed the complex environment in the MIZ. Williams T D et al. [12] carried out numerical simulations of sea ice–wave interaction in the MIZ. Additionally, the results obtained from these studies provide a better understanding of the MIZ in the early stage.
There are three main research strategies for ice–wave interaction, namely theoretical research, numerical simulation, and experimental research. Concerning theoretical research, sea ice is regarded as an elastic or viscoelastic continuum, and there are mainly three theoretical models: mass loading, thin elastic plate, and viscous layer models. The mass loading model is mainly suitable for the discontinuous pancake ice area, the thin elastic plate model is best suited for the continuous ice sheet area, and the viscous layer model is mainly suitable for the grease ice area. The mass load model was first proposed and developed by Peters A S et al. [13] and Weitz and Keller [14]. To establish the numerical model of the wave dispersion relationship in the ice area, the ice floes were assumed as a series of discrete mass points that were not related to each other. The elastic sheet model [15] assumes that the ice sheet is a thin but uniform elastic plate, such that the elastic plate bending theory can be adopted. The viscous layer model, first derived by Keller J B [16], assumed that sea ice is viscous fluid while sea water was assumed to be a non-viscous fluid. By matching the vertical velocity with stress at the interfaces of sea ice, water, and air, the boundary condition of the dispersion relationship interface of the wave is obtained. Against this backdrop, Carolis D G [17] developed a two-layer viscous fluid model considering the viscosity of sea water. In 2010, Wang R and Shen H H [18] developed a viscoelastic model and generalized the already mentioned three models to predict wave propagation under different sea ice types in the MIZ.
With the development of model test and numerical calculation methods, researchers have conducted some experimental and numerical investigations on wave–ice interaction. Newyear K and Martin S [19] carried out wave propagation experiments with grease ice in a small, refrigerated water channel in Washington University. The results obtained from the experiment show that wave attenuation varies exponentially with distance, relative to frequency. Sakai S and Hanai K [20] studied the influence of the ice size, its thickness, and elastic modulus on the wavelength in a water channel. The obtained results exhibit an insignificant difference between the two ice-thickness models. When the ice length is short, the propagation speed is approximate to that in open water. Based on experiments and numerical simulations, Dai M et al. [21] studied the thickness of sea ice accumulated under wave action. In this experiment, a plastic ice model and a three-dimensional discrete element model were used to simulate the movement of ice floes under wave action. The results obtained from the experiments and numerical simulation are consistent with the theoretical calculation. Parra S M et al. [22] carried out an ice–wave interaction experiment in a wave tank and described the wave propagation along the ice sheet. Three types of ice were used in the experiment, including ice sheet, crushed ice, and grease ice. Additionally, the wave dispersion and attenuation characteristics under different ice and wave properties were studied in this experiment. The obtained results show that the wave attenuation is most robust in the ice row, and it is related to the surface wave orbital velocity. The results also show that the attenuation degree of waves is the largest in the ice sheet, which is related to the surface wave orbital velocity. Huang L et al. [23] applied the hydro-elastic wave–ice interaction method based on OpenFOAM to predict the wave propagation and ice motion in the ice–wave interaction process. Based on an unstructured grid surface-wave model, Zhang Y et al. [24] studied the wave attenuation and propagation characteristics triggered by sea ice and simulated the evolution trend of the wave–sea ice interaction process. The simulation results agree well with the mechanism of sea ice–wave generation and dissipation.
In this research, a numerical study is conducted based on the computational fluid dynamics (CFD) method to investigate the response of single ice floe under wave action. This study mainly focuses on the six degree of freedom (6DoF) motion of sea ice under different ice parameters. The calculation results are compared with the model test results in the towing tank.

2. CFD Numerical Simulation

2.1. Governing Equations

The motion of incompressible Newtonian fluid satisfies the continuity and momentum conservation equations, which can be expressed as [25]:
u i x i = 0
u i t + u j u i x j = x j ( μ u i x j ) 1 ρ p x i + S j
where u i and u j (i, j = 1, 2, 3), p, ρ and S j represent the time-averaged values of velocity components, time-averaged pressure, fluid density, and source term, respectively. The fluid density was assumed constant for incompressible Newtonian fluids.

2.2. Turbulence Model and Free-Surface Treatment

The finite-volume computational method was combined with a segregated flow solver and used to analyse the interaction between ice floes and waves. An implicit pseudo-time-marching scheme was adopted to attain convergence. To solve the resulting discrete linear system of equations during each iteration, a point-implicit (Gauss–Seidel) linear system solver with algebraic multigrid acceleration was adopted. The shear stress transport (SST) k-ω turbulence model was employed for numerical simulations. The free-surface of the ocean was modelled using the two-phase volume-of-fluid (VOF) technique with the high-resolution interface capturing (HRIC) scheme [26].

2.3. Numerical Wave Tank

The STAR-CCM+ commercial software package was used to perform numerical wave simulations. Wave generation in the STAR-CCM+ solver was realized via the inlet and outlet boundaries, at which incident–wave boundary conditions were enforced. Specifically, this approach, referred to as the boundary velocity input method, sets a velocity profile over the water depth of waves at the inlet boundary. A fifth order wave was modelled by approximating the fifth order to the Stokes theory of waves as the numerical wave type in this study. The wave generated by the fifth order is more similar to a real wave than that generated by the first order method. The wave profile, including the wave phase velocity, depends on the water depth, wave height, and current. A detailed description of fifth order VOF waves can be found in the studies conducted by Fenton J D [27].
In the simulation, the length, width, and water depth of the calculation domain are 15, 4, and 4.5 m, respectively. Due to the symmetricity of the calculation model, only half of the computational domain is calculated. Regular waves were generated at the velocity inlet, the position of the floating ice was 5 m away from the inlet, and the wave elimination function was opened near the outlet. To better ascertain the flow characteristics near the floating ice, the mesh near the ice surface and ice movement area is refined, as shown in Figure 1.
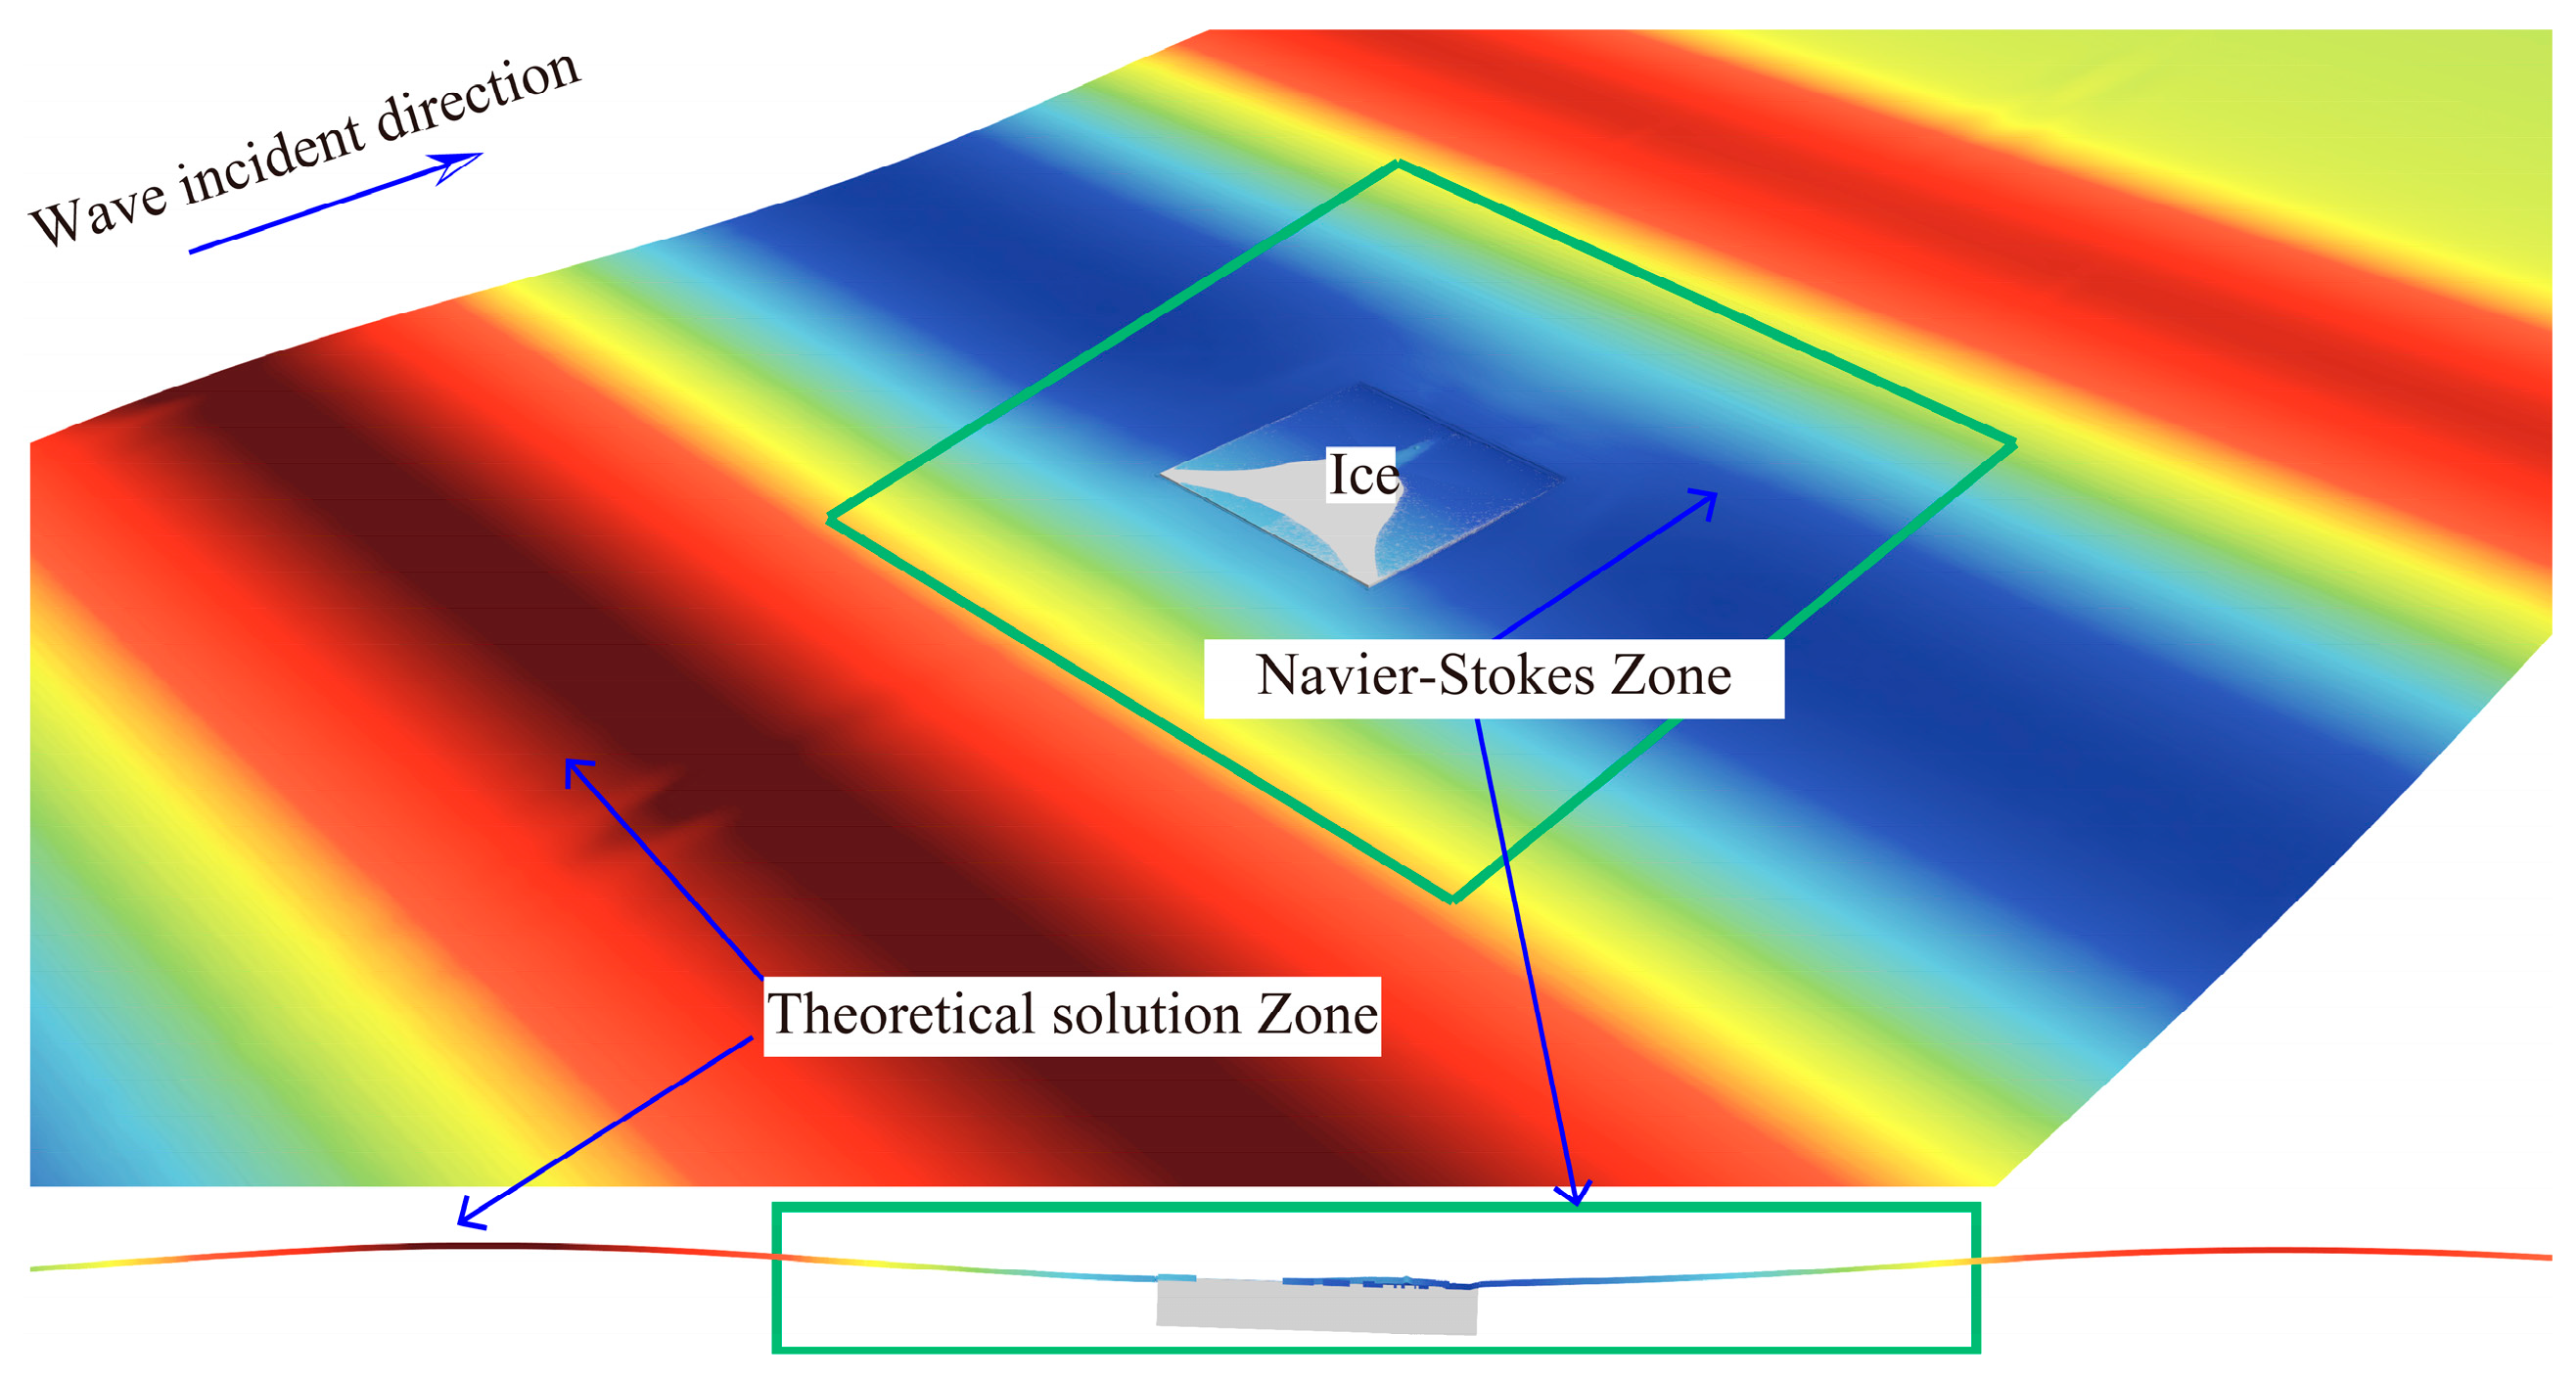
The Euler overlay method (EOM) [28] was adopted to address the reflections of surface waves at boundaries. The illustration of the Euler overlay method is shown in Figure 2. As the principal solution of this method, the simulation domain contains three zones: the inner CFD, overlay, and outer Euler wave zones.
The overlay zone located between the outer Euler and inner CFD zones gradually blends the CFD and Euler solutions, applying source terms to VOF and momentum equations. The reflections of surface waves are addressed via the forcing solution of the discretized Navier–Stokes equations towards another solution (such as a theoretical solution or simplified numerical solution) over a specified distance, which reduces the computing efficiency due to its use of a reduced-size solution domain.
Wave forcing is achieved by adding a source term to the transport (momentum) equations expressed as:
q ϕ = γ ρ ( ϕ ϕ * )
where γ , ρ , ϕ , and ϕ * represent the forcing coefficient, fluid density, current solution of the transport equation, and value towards which the solution is forced, respectively.
The forcing coefficient varies smoothly from zero at the inner edge of the forcing zone to the maximum value γ at the boundary (the outer edge of the forcing zone). x* is the relative coordinate within the forcing zone.
γ = γ 0 cos 2 ( π x * / 2 )
The volume coupling can be either one-way or two-way because the forcing zones usually do not coincide.

2.4. Numerical Model Ice

Three model ice shapes, square, circular and triangular, were used in the numerical calculation, as illustrated in Figure 3. Table 1 presents the parameters of model ice.

3. Description of Wave–Ice Model Test

The wave–ice model test was performed in the towing tank of Harbin Engineering University [29]. The length, width, and depth of the towing tank are 108, 7, and 3.5 m, respectively. The tank takes the structure of reinforced concrete while the maximum velocity of the carriage is 6.5 m/s. The wave maker used in this experiment is a three-dimensional wave maker with eight push plates imported from Denmark, which can generate regular two-dimensional waves, as well as irregular waves. The wave making period ranges from 0.4 to 4 s, and the maximum value of the regular wave height can be 0.4 m. The wave gauges are in the range of 0–10 m, the maximum permitted error of the wave height is ±(0.2 + 5% of measurement value) m, the calibration error is ≤2 cm, the sampling frequency is 4 HZ, and the sampling time is in the range of 17–20 min.
In the test, paraffin was used as the model ice. The density of sea ice was in the range of 840–910 kg/cm3 in the first year, and 720–910 kg/cm3 in the following years. The paraffin model ice had an average thickness of 20 mm, and an approximate relative density of 900 kg/cm3, which is very similar to that of sea ice.
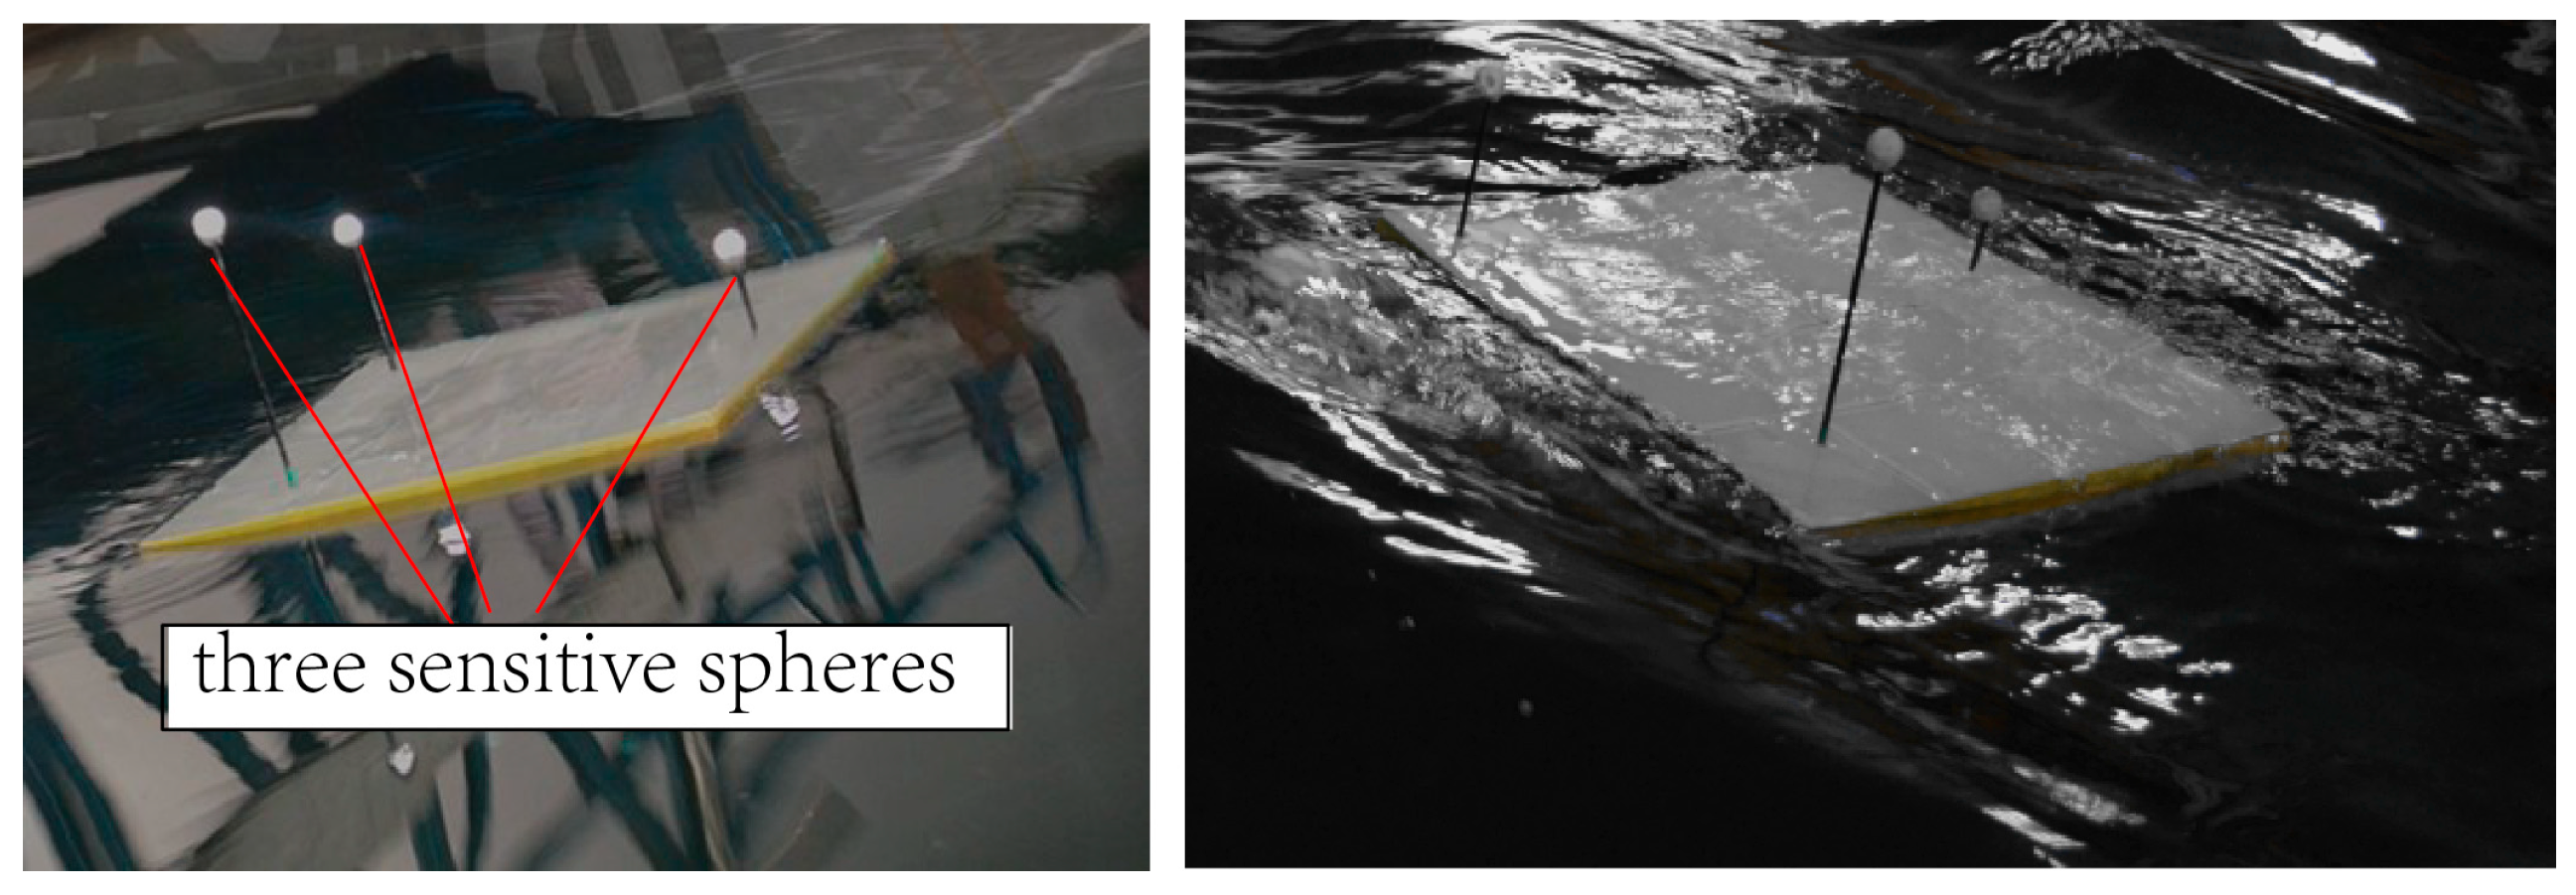
The Qualisys track manager (QTM) system is used to capture the movement of ice. The QTM system mainly consists of the following parts: high speed video motion capture camera, QTM tracking management software, calibration equipment, marking sensitive spheres, and equipment fixtures. The system can realize 2/3/6-DOF (degree of freedom) motion capture and collect 2D (two dimensional) mark data in real-time before converting it to 3D/6D (3 dimensional/ 6 dimensional) data. The QTM system mainly applies the optical principle to position three sensitive spheres at three points of the ice model, as shown in Figure 4. Additionally, it employs two high-speed camera devices to capture the real-time dynamic positions of these three spheres, which are transformed into dynamic positions at the centre of the model by calculations.

4. Results and Discussion

4.1. Wave Accuracy Verification

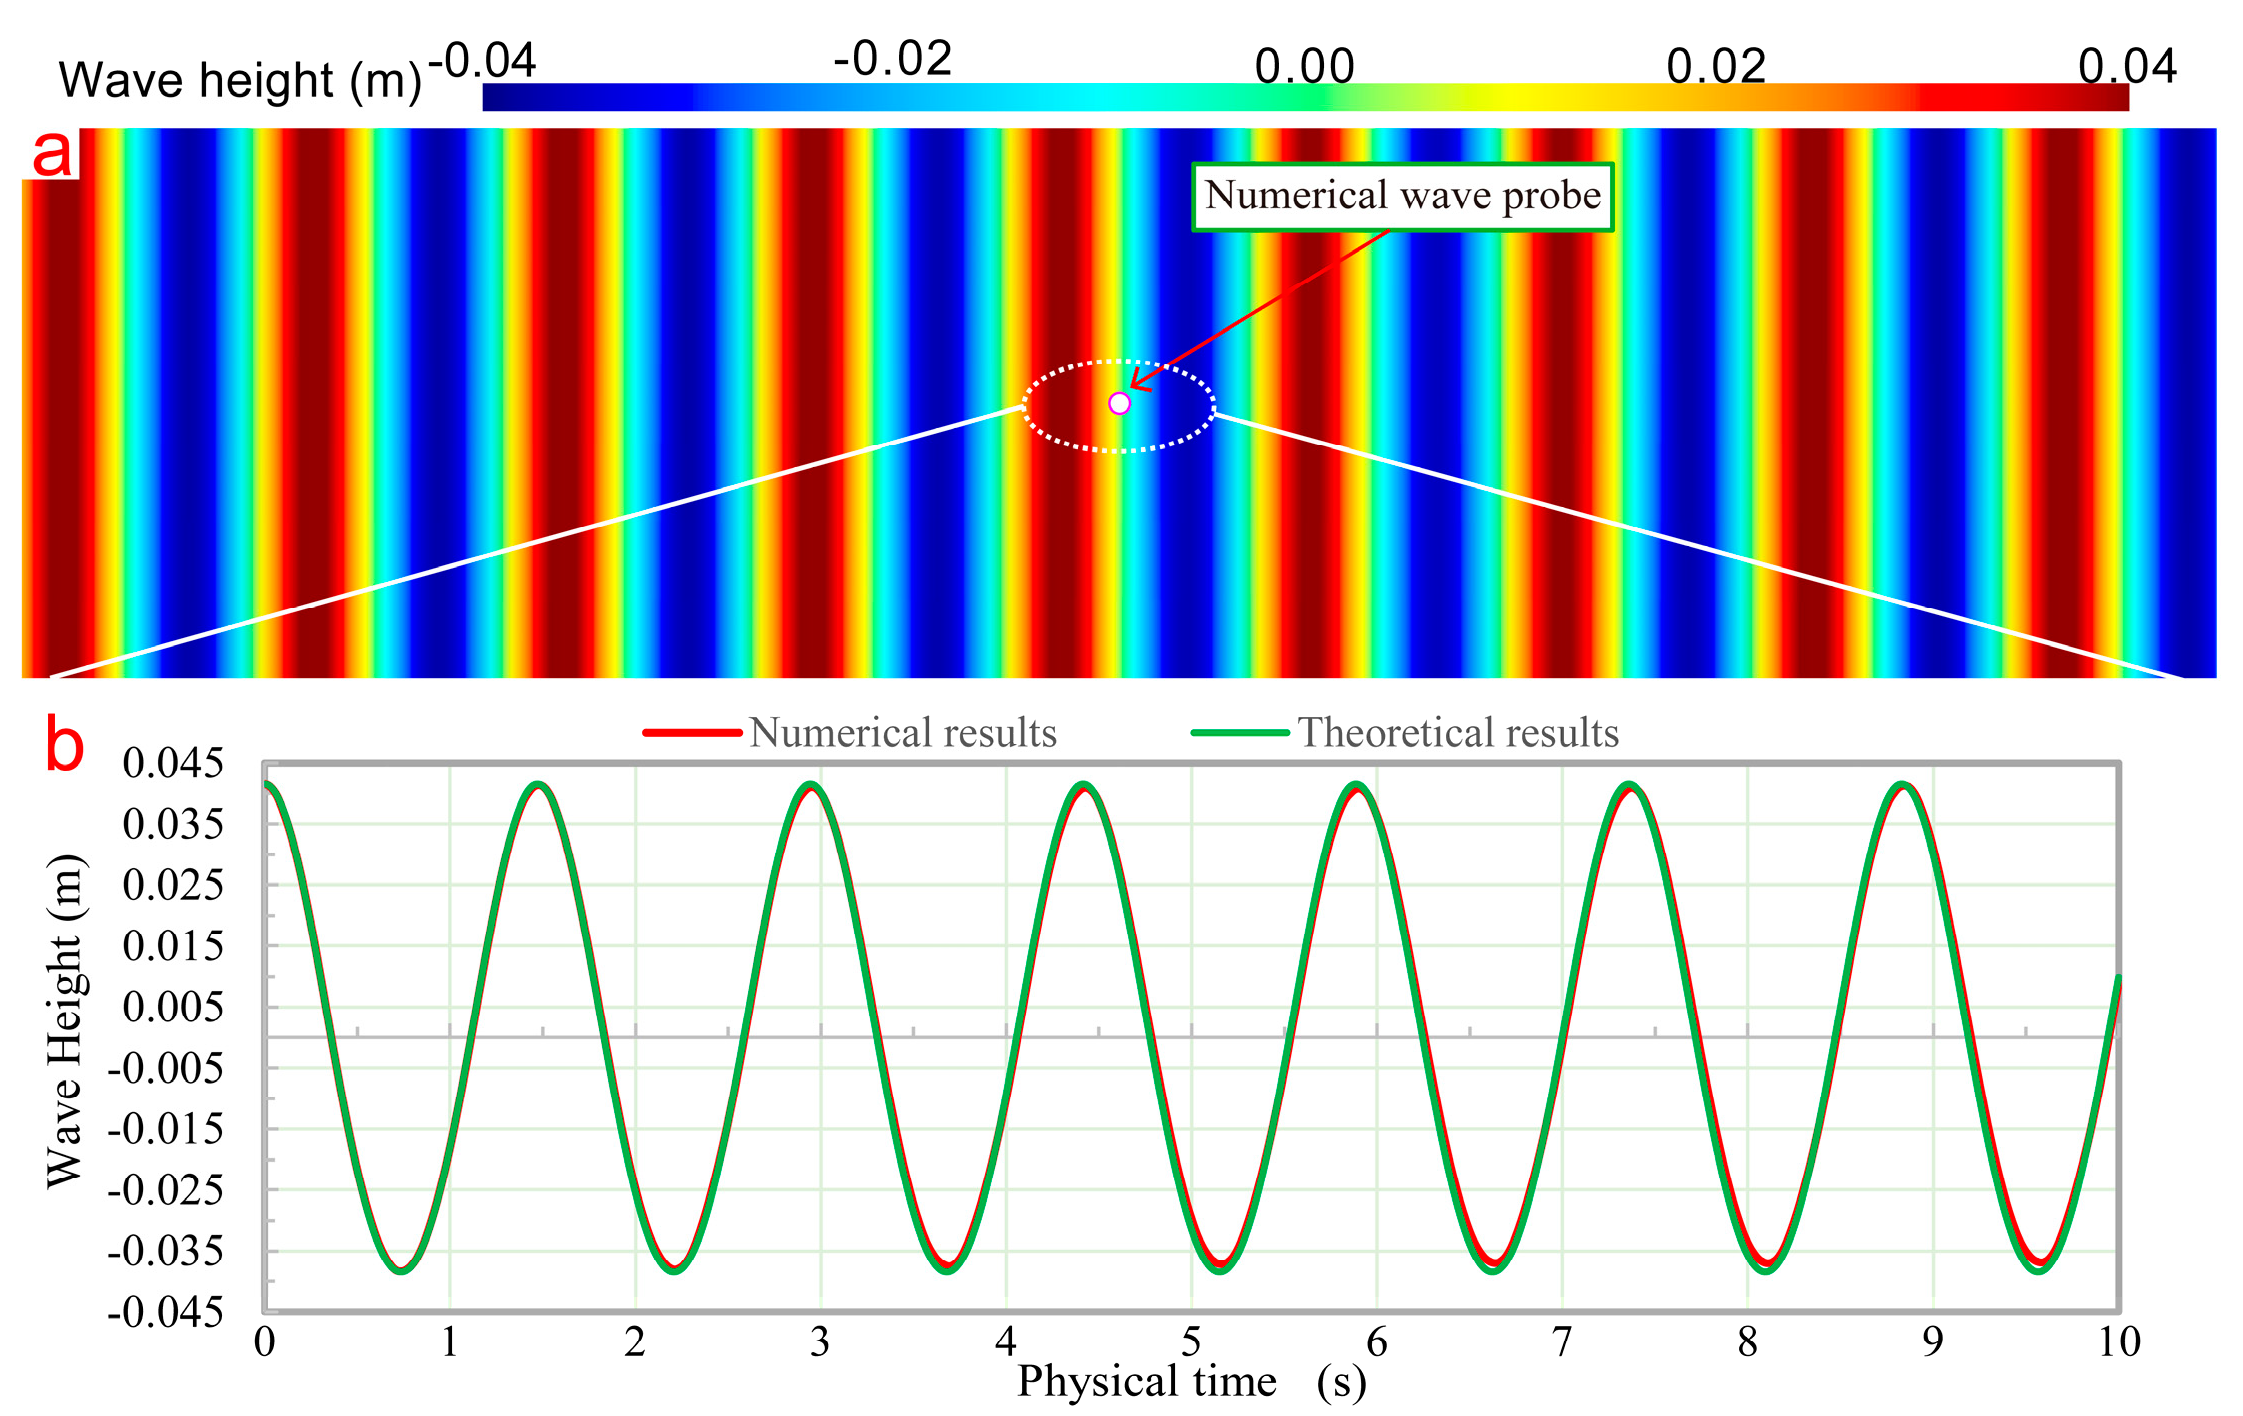
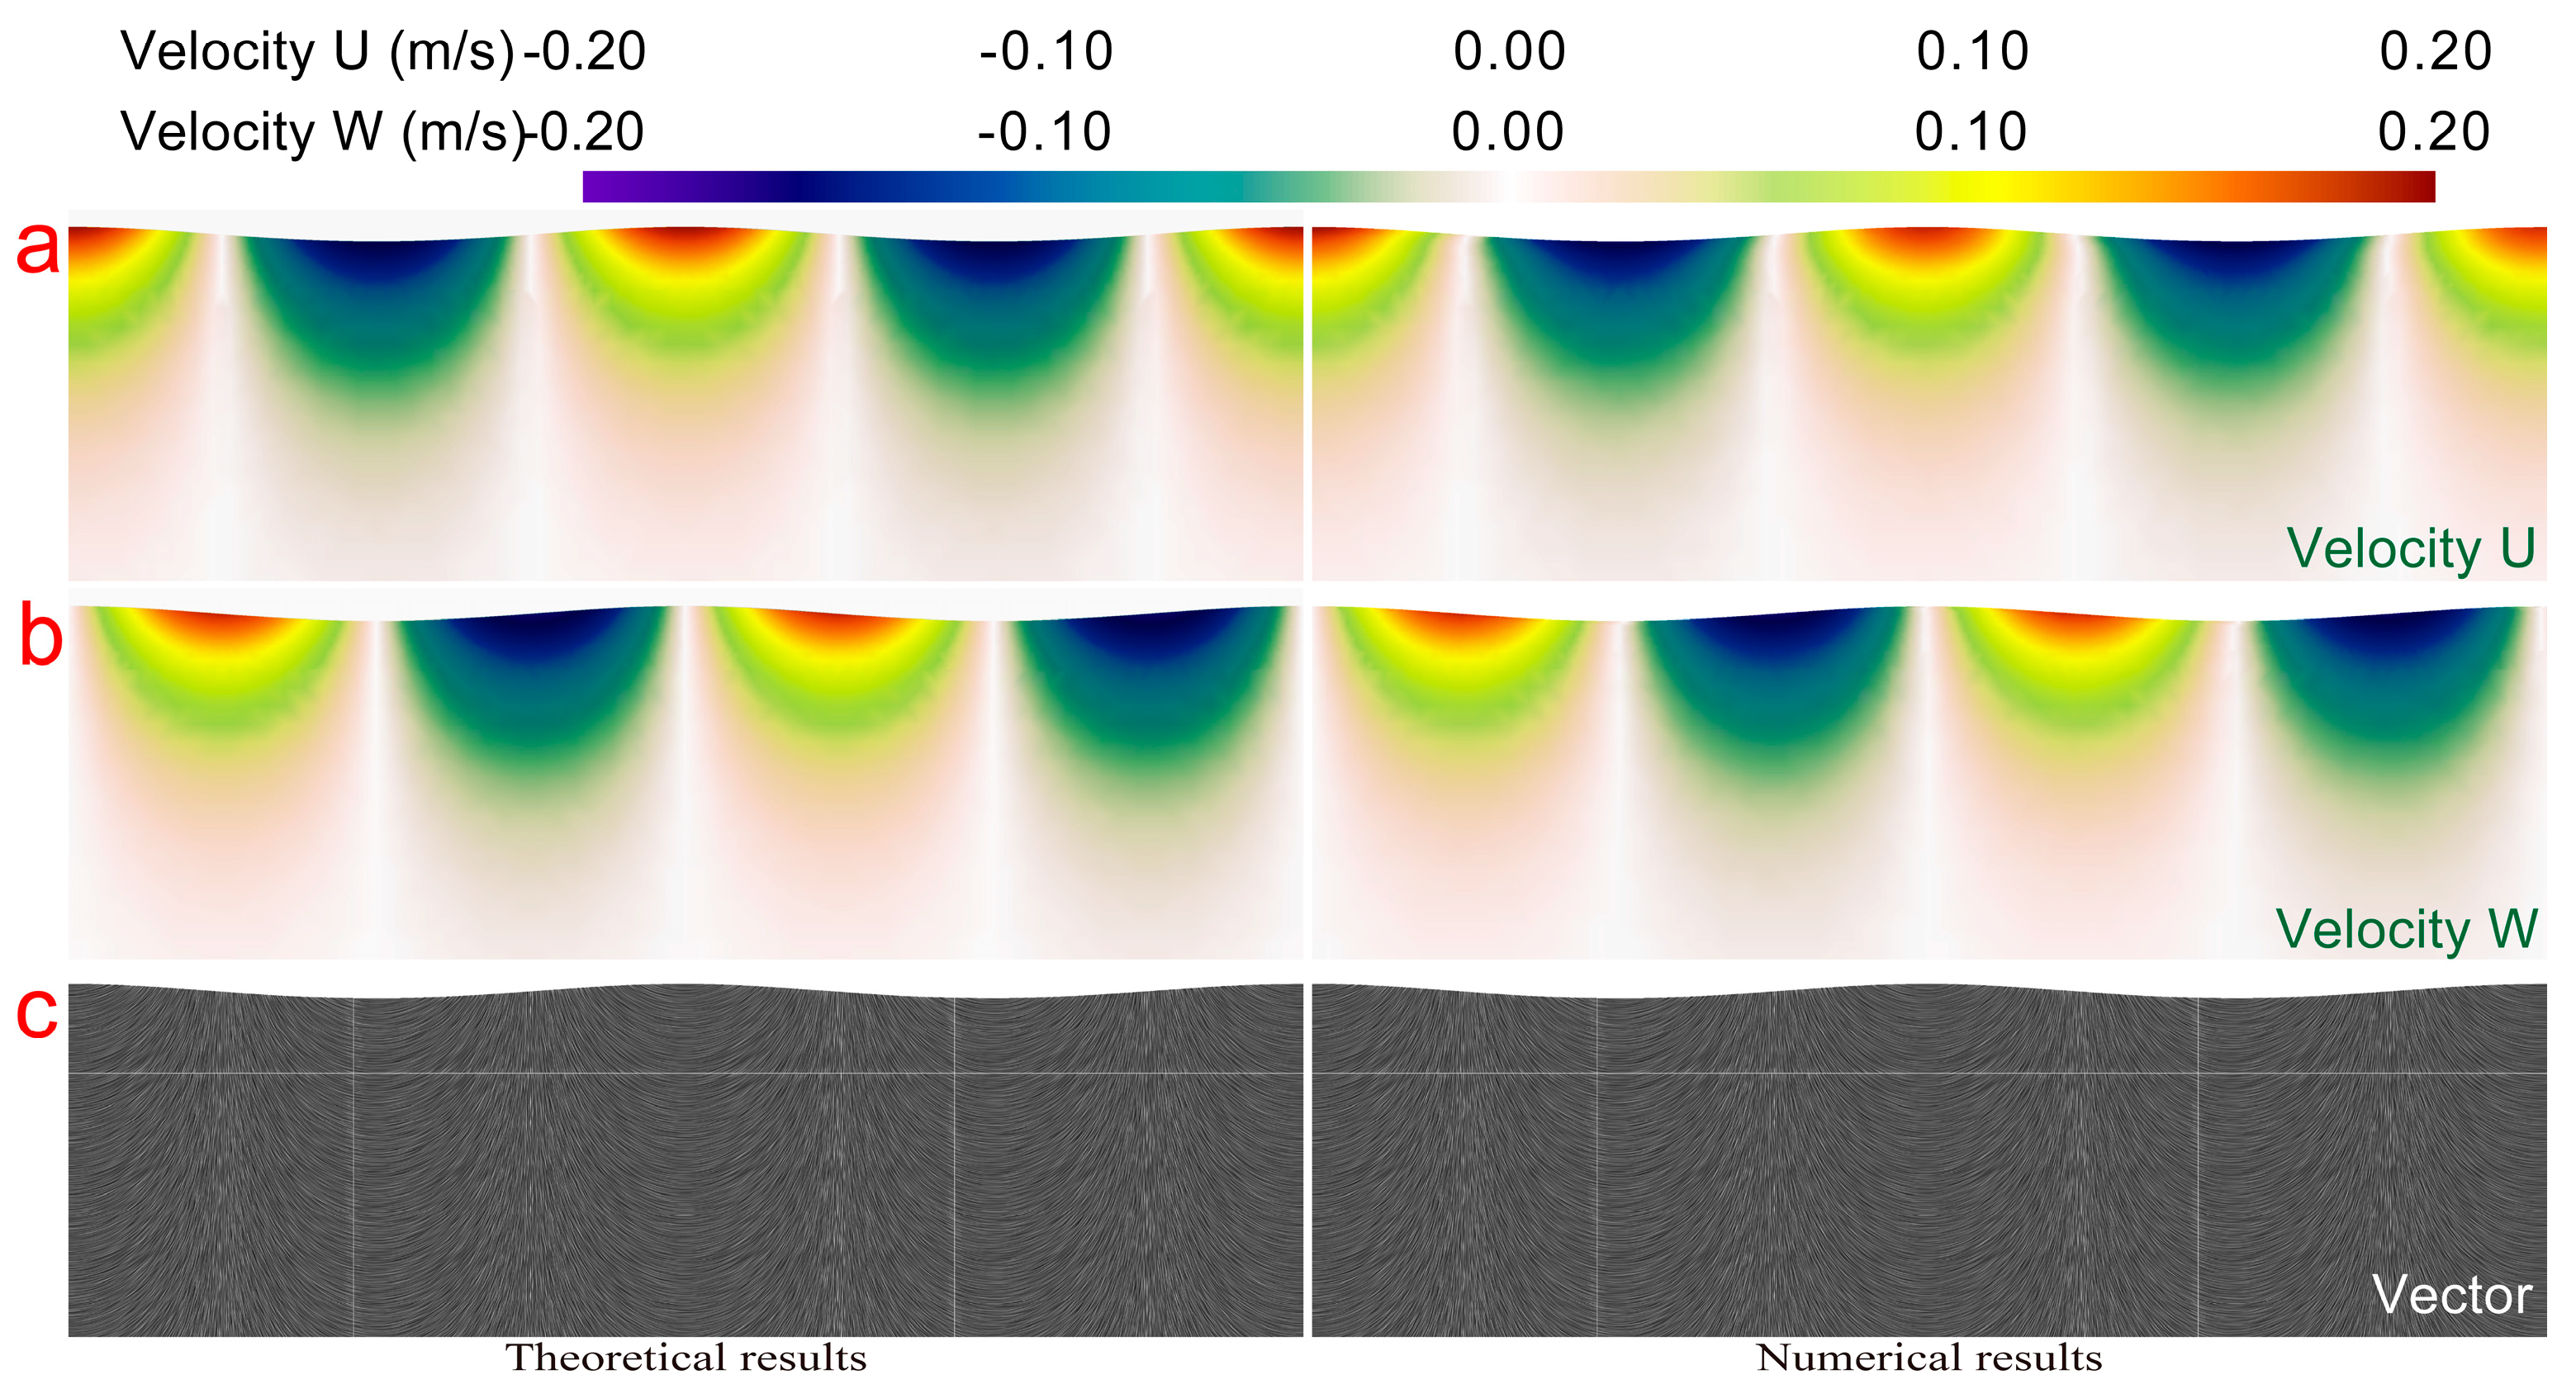
Before the calculation, the regular waves with wavelength and wave height of 3.4 and 0.08 m, respectively, were simulated, and the obtained results were compared with the theoretical solutions to verify the accuracy of the solver. To record the change in water surface, a wave height detection point was set at the centre of floating ice, as shown in Figure 5a. The comparison of free surface is presented in Figure 5b. The red and green curves represent the numerical and theoretical calculation results, respectively. It can be observed from Figure 5b that the form of the wave can stabilized, and also the wave height, as well as its phase, can be consistent with the theoretical solution. Figure 6 presents the comparison of wave velocity distribution. Figure 6a,b demonstrates the velocity distribution in the X direction, U and Z direction, W direction, respectively. Figure 6c illustrates the distribution of the wave velocity vector. The left and right sides represent the theoretical and numerical calculation results, respectively. The simulation results of the velocity distribution in the numerical wave tank agree well with the theoretical velocity distribution of the waves. Therefore, the reliability of the method used in this study is verified.

4.2. Influence of Wavelength on x, y, and z Motions

The objects floating on the water will move in 6DoF under the influence of waves, which can be roughly divided into two types: translational and rotational waves. The motion coordinates of floating ice and the wave are shown in Figure 7.
A wave is mainly determined by two parameters: wavelength ( λ ) and wave height (h). Wave steepness is the ratio of wave height to wavelength ( h / λ ), which is defined as a parameter used to represent the average slope of the fluctuation. The response amplitude operator (RAO) was defined as a dimensionless variable and used to describe the heave amplitude. The RAO value (z) is defined as: z = heave/h, where heave is the measured amplitude of heave motion.
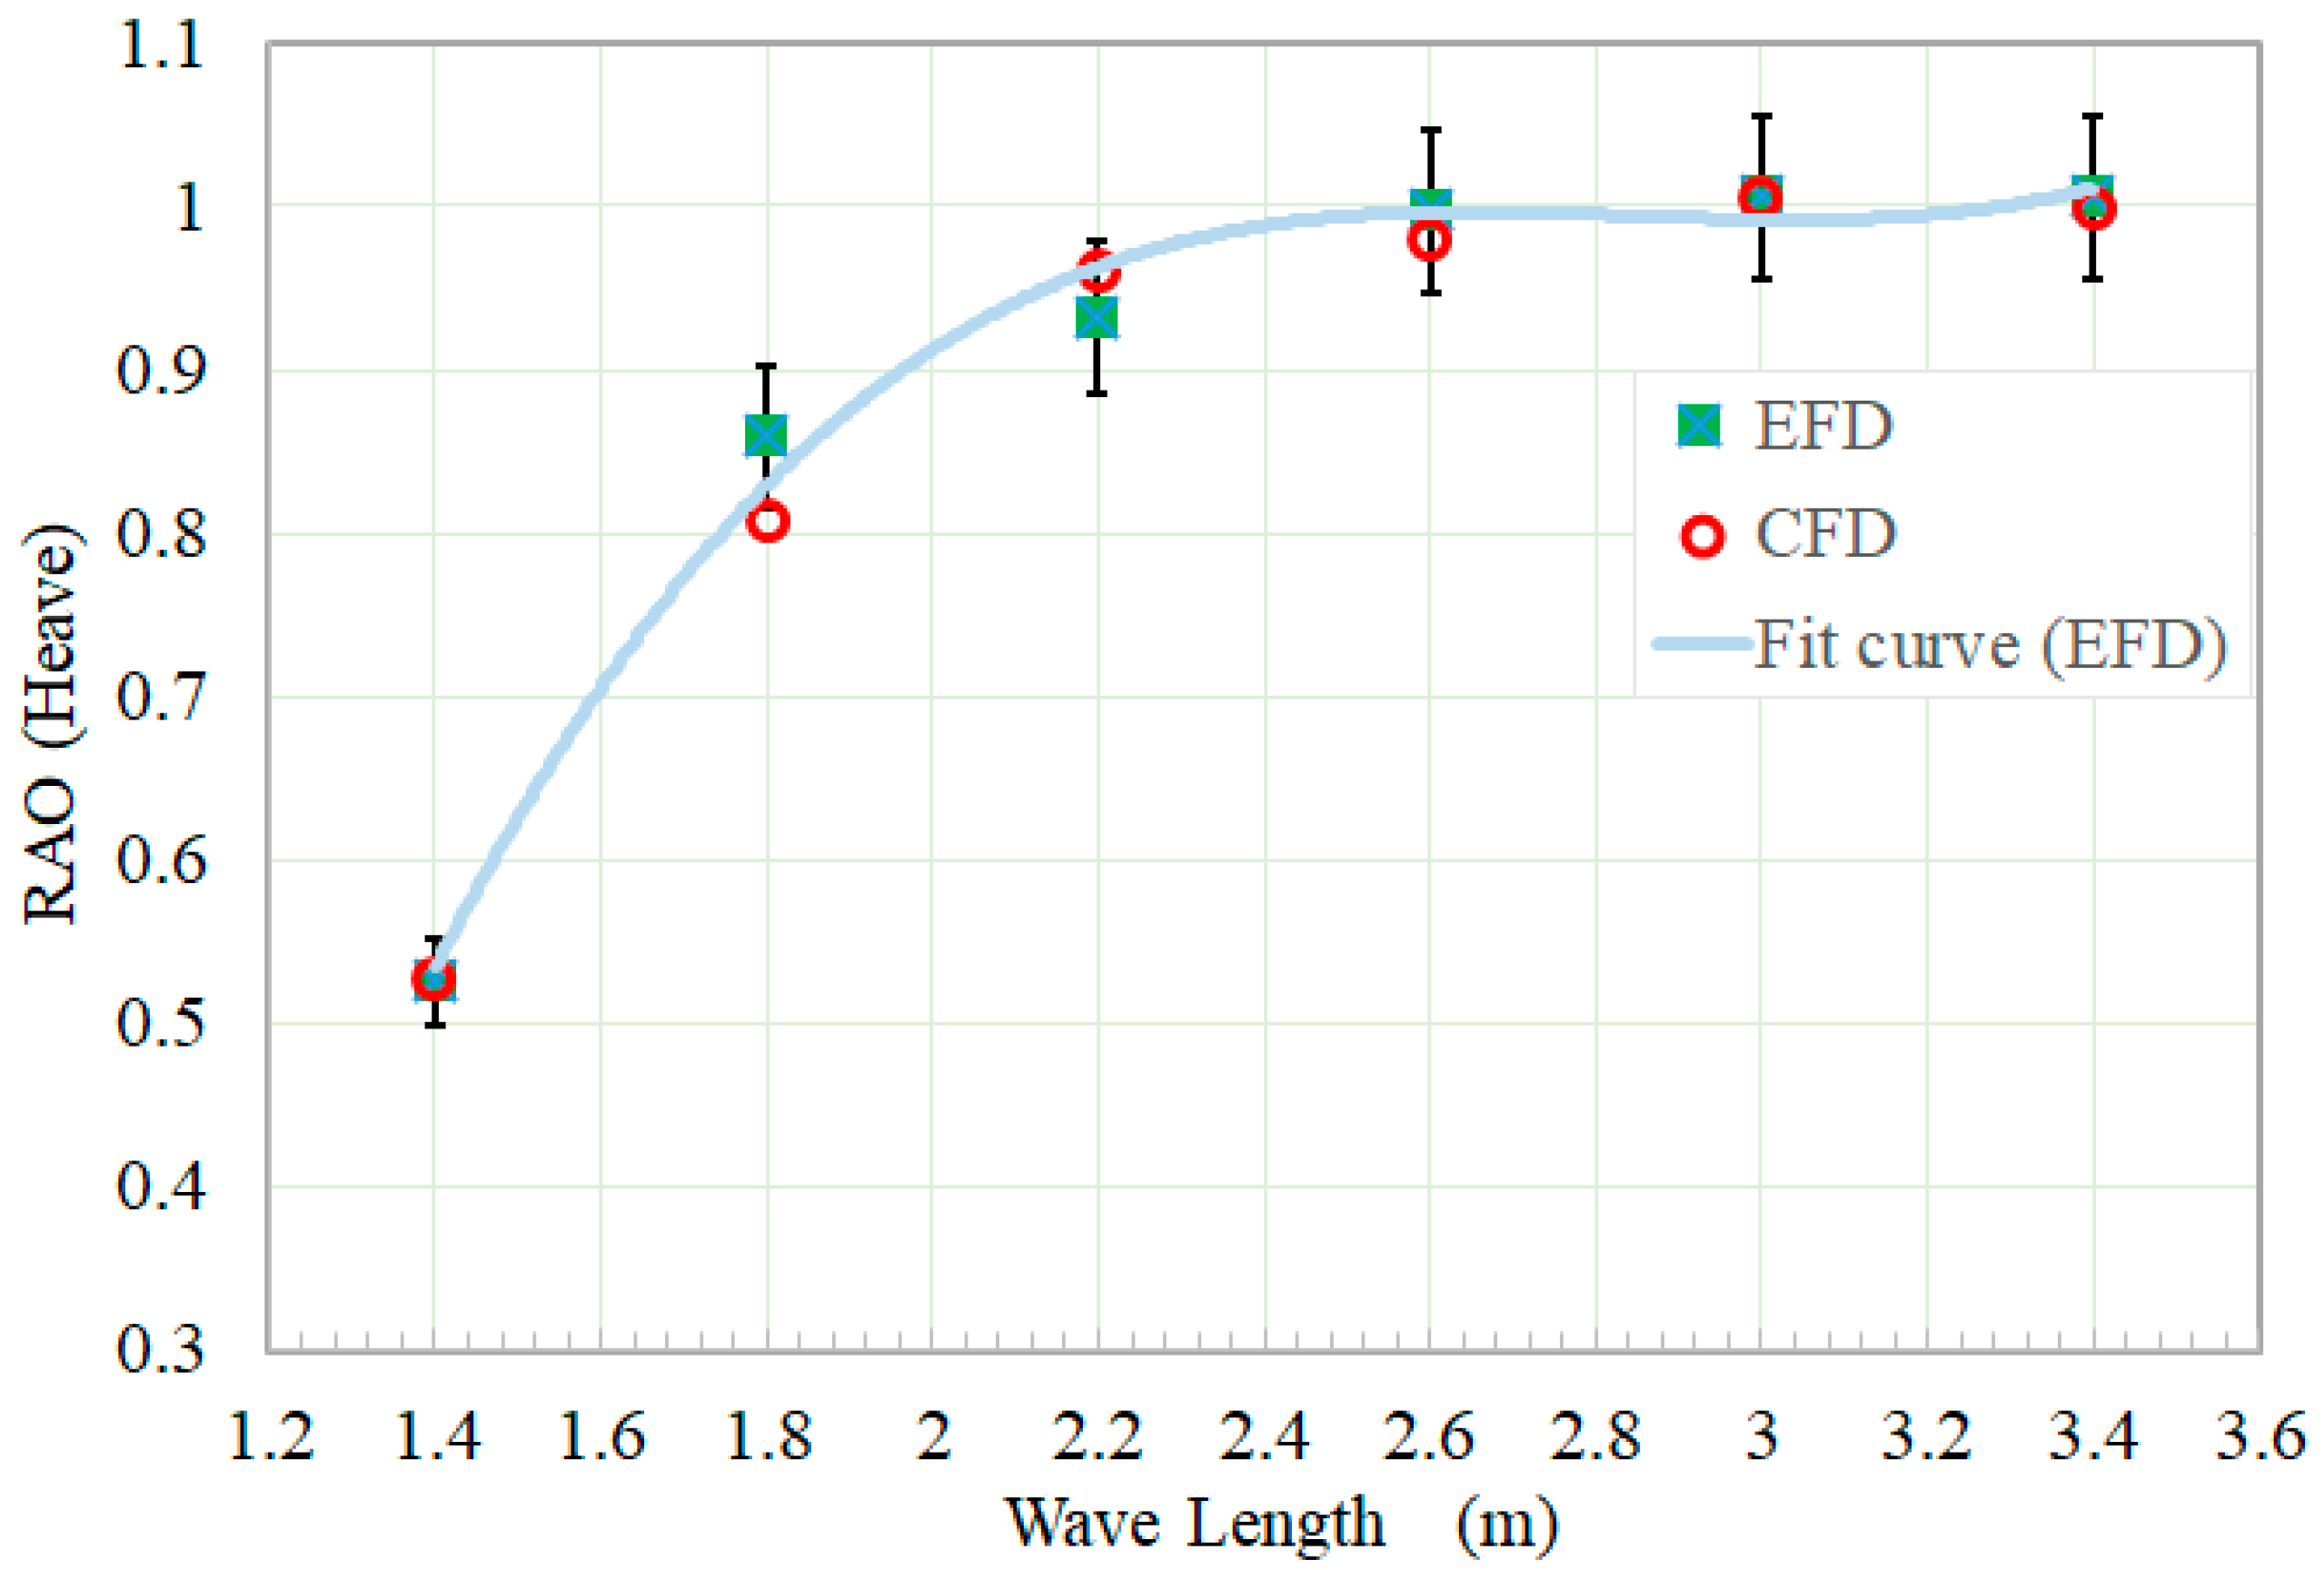
Taking ice floe S1 as the simulation model, six conditions are presented in Table 2. The wave heights of all six conditions is 0.08 m while the wavelengths at these wave heights are 1.4, 1.8, 2.2, 2.6, 3.0, and 3.4 m, respectively. The RAO values under six different conditions are shown in Figure 8. When the wave height is fixed, with an increase in the wavelength, the RAO value first rises and then tends to be stable, which is mainly caused by the diffraction and scattering of waves. When the wavelength reaches a certain value, the RAO of the model ice is maximum. Then, the existence of the model ice no longer affects the wave, and the motion of ice floe follows the motion law of fluid particles.
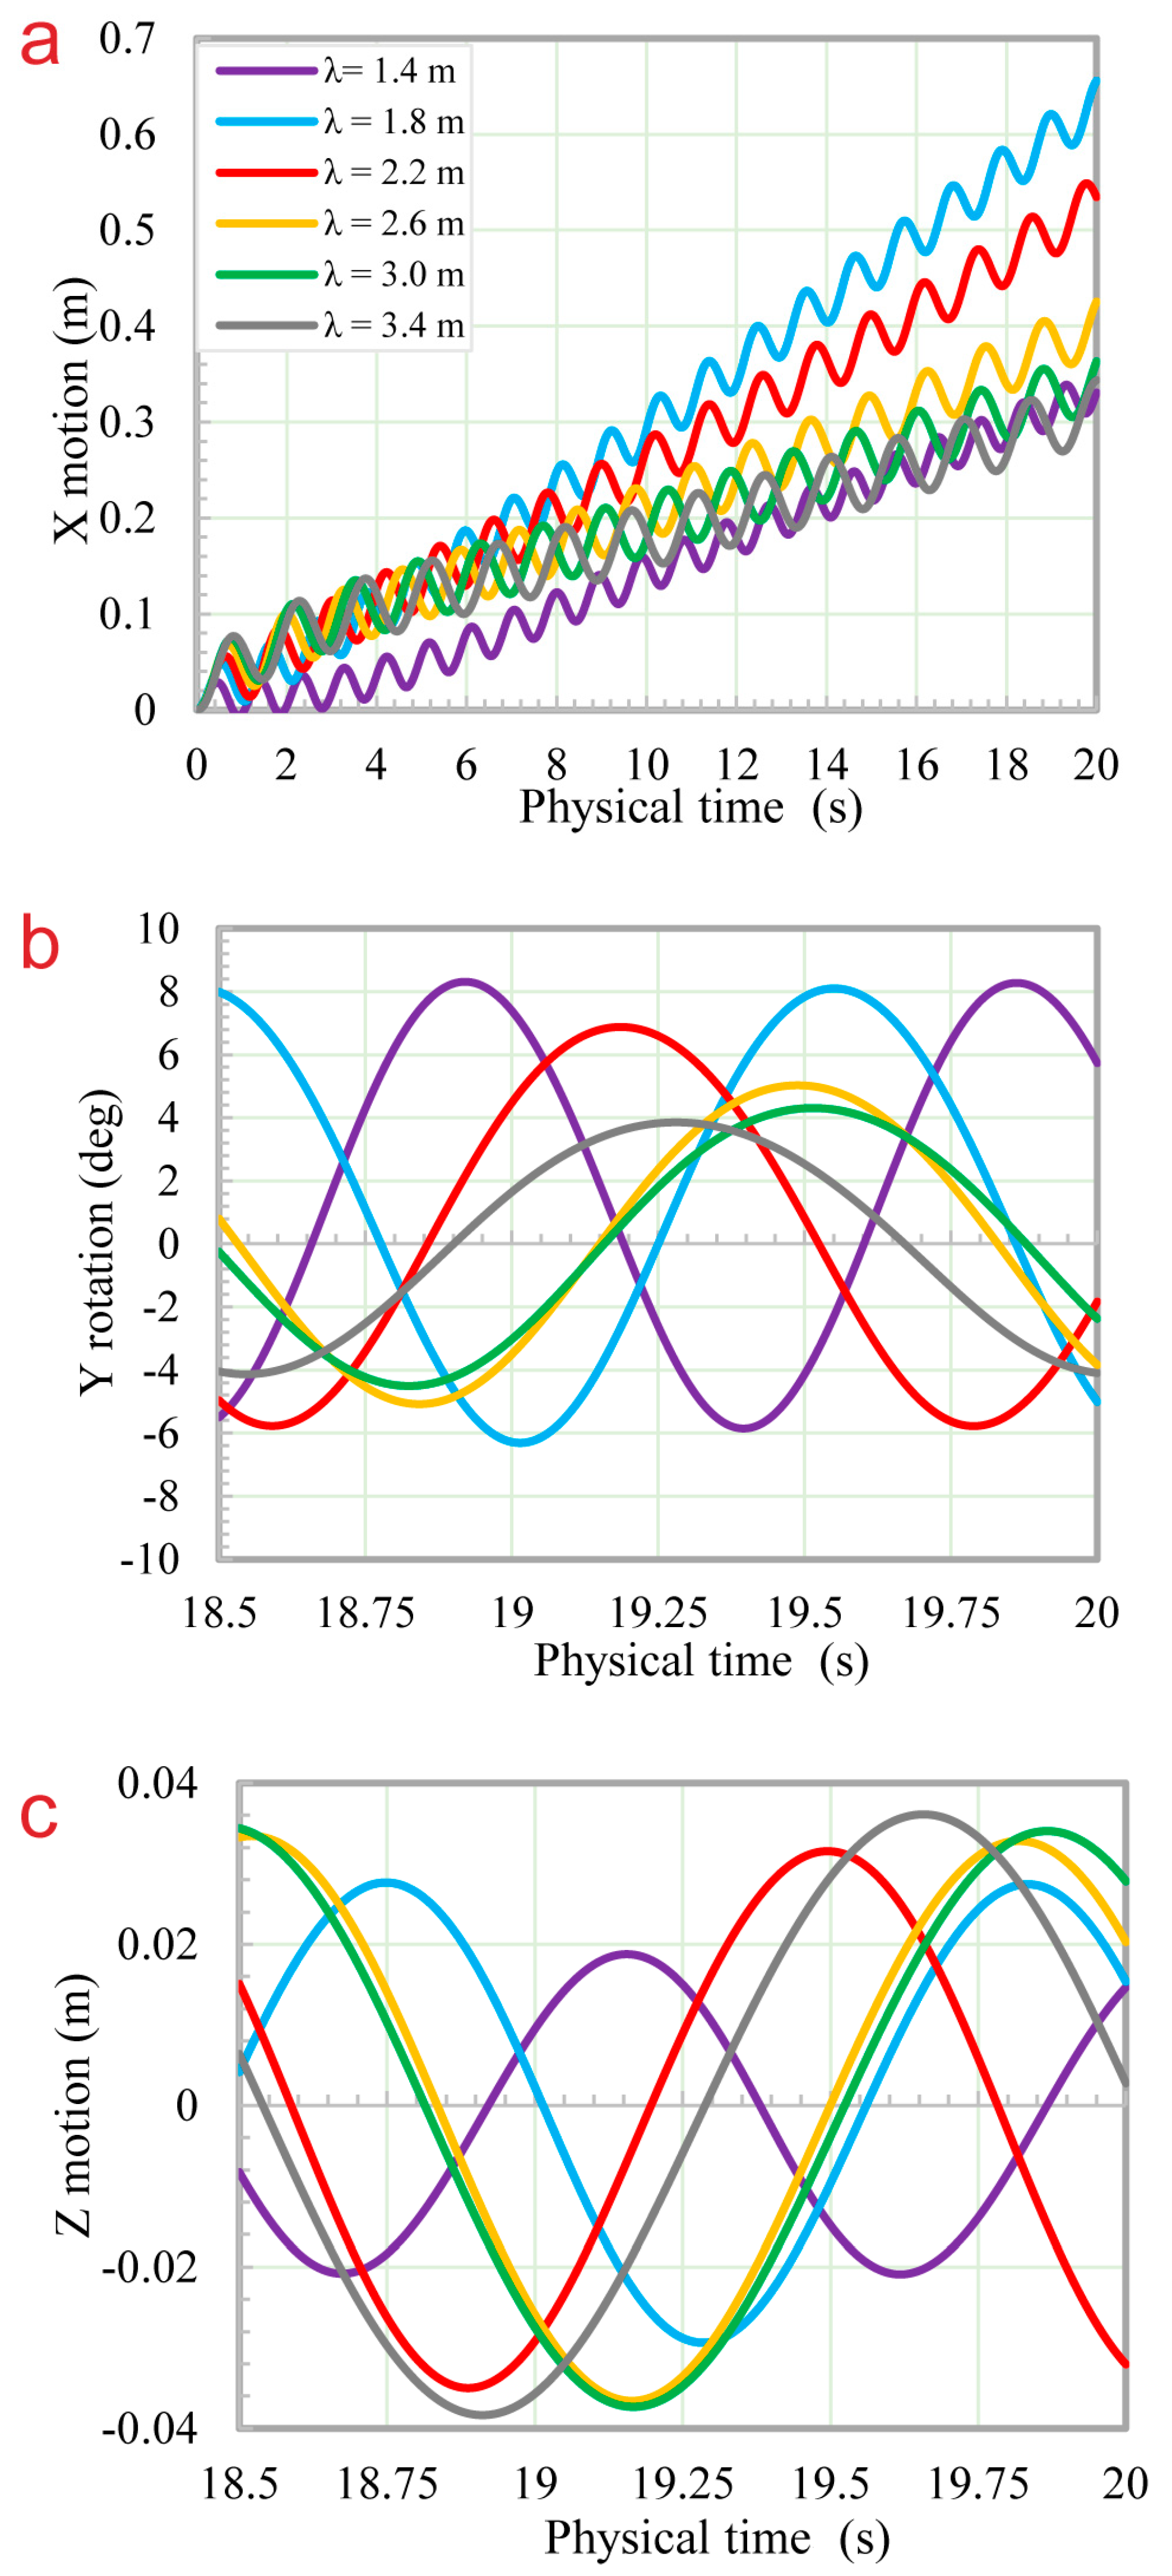
The motion of ice floes along the x, y, and z directions with a fixed wave height and varied wavelength is shown in Figure 9. The wave heights are all at 0.08 m and the wavelengths at these heights are 1.4, 1.8, 2.2, 2.6, 3.0, and 3.4 m, respectively. Under the action of waves, the ice floe moves forward continuously. The motion in the x direction is divided into two parts: oscillating surge and drift motions. Drift motion is mainly caused by the second-order drift force of waves. Figure 9a shows the drift motion along the x direction. From Figure 9a, it can be observed that the drift displacement along the x-axis is closely related to the wavelength. The wavelengths in numerical simulation are larger than the characteristic length of ice floe. The trajectory of the floating ice drifting along the x-axis is in a periodic reciprocating motion, and it gradually moves away from the initial position along the positive direction of the x-axis. Figure 9b shows the time history curve of ice floe rotating along the y-axis, and Figure 9c presents the time history curve of ice floe translation along the z-axis. Both the rotational and translational motions along the y- and z-axes, respectively, are periodic. It can be observed from Figure 9b that when the wavelength is small, the rotation amplitude along the y-axis is large, and with the increase in the wavelength, the rotation amplitude along the y-axis decreases. Figure 9c shows that the translational reciprocating motion along the z-axis is steady when the wavelength is small but intensified when the wavelength is increased.

4.3. Influence of Ice Shape on x, y, and z Motions

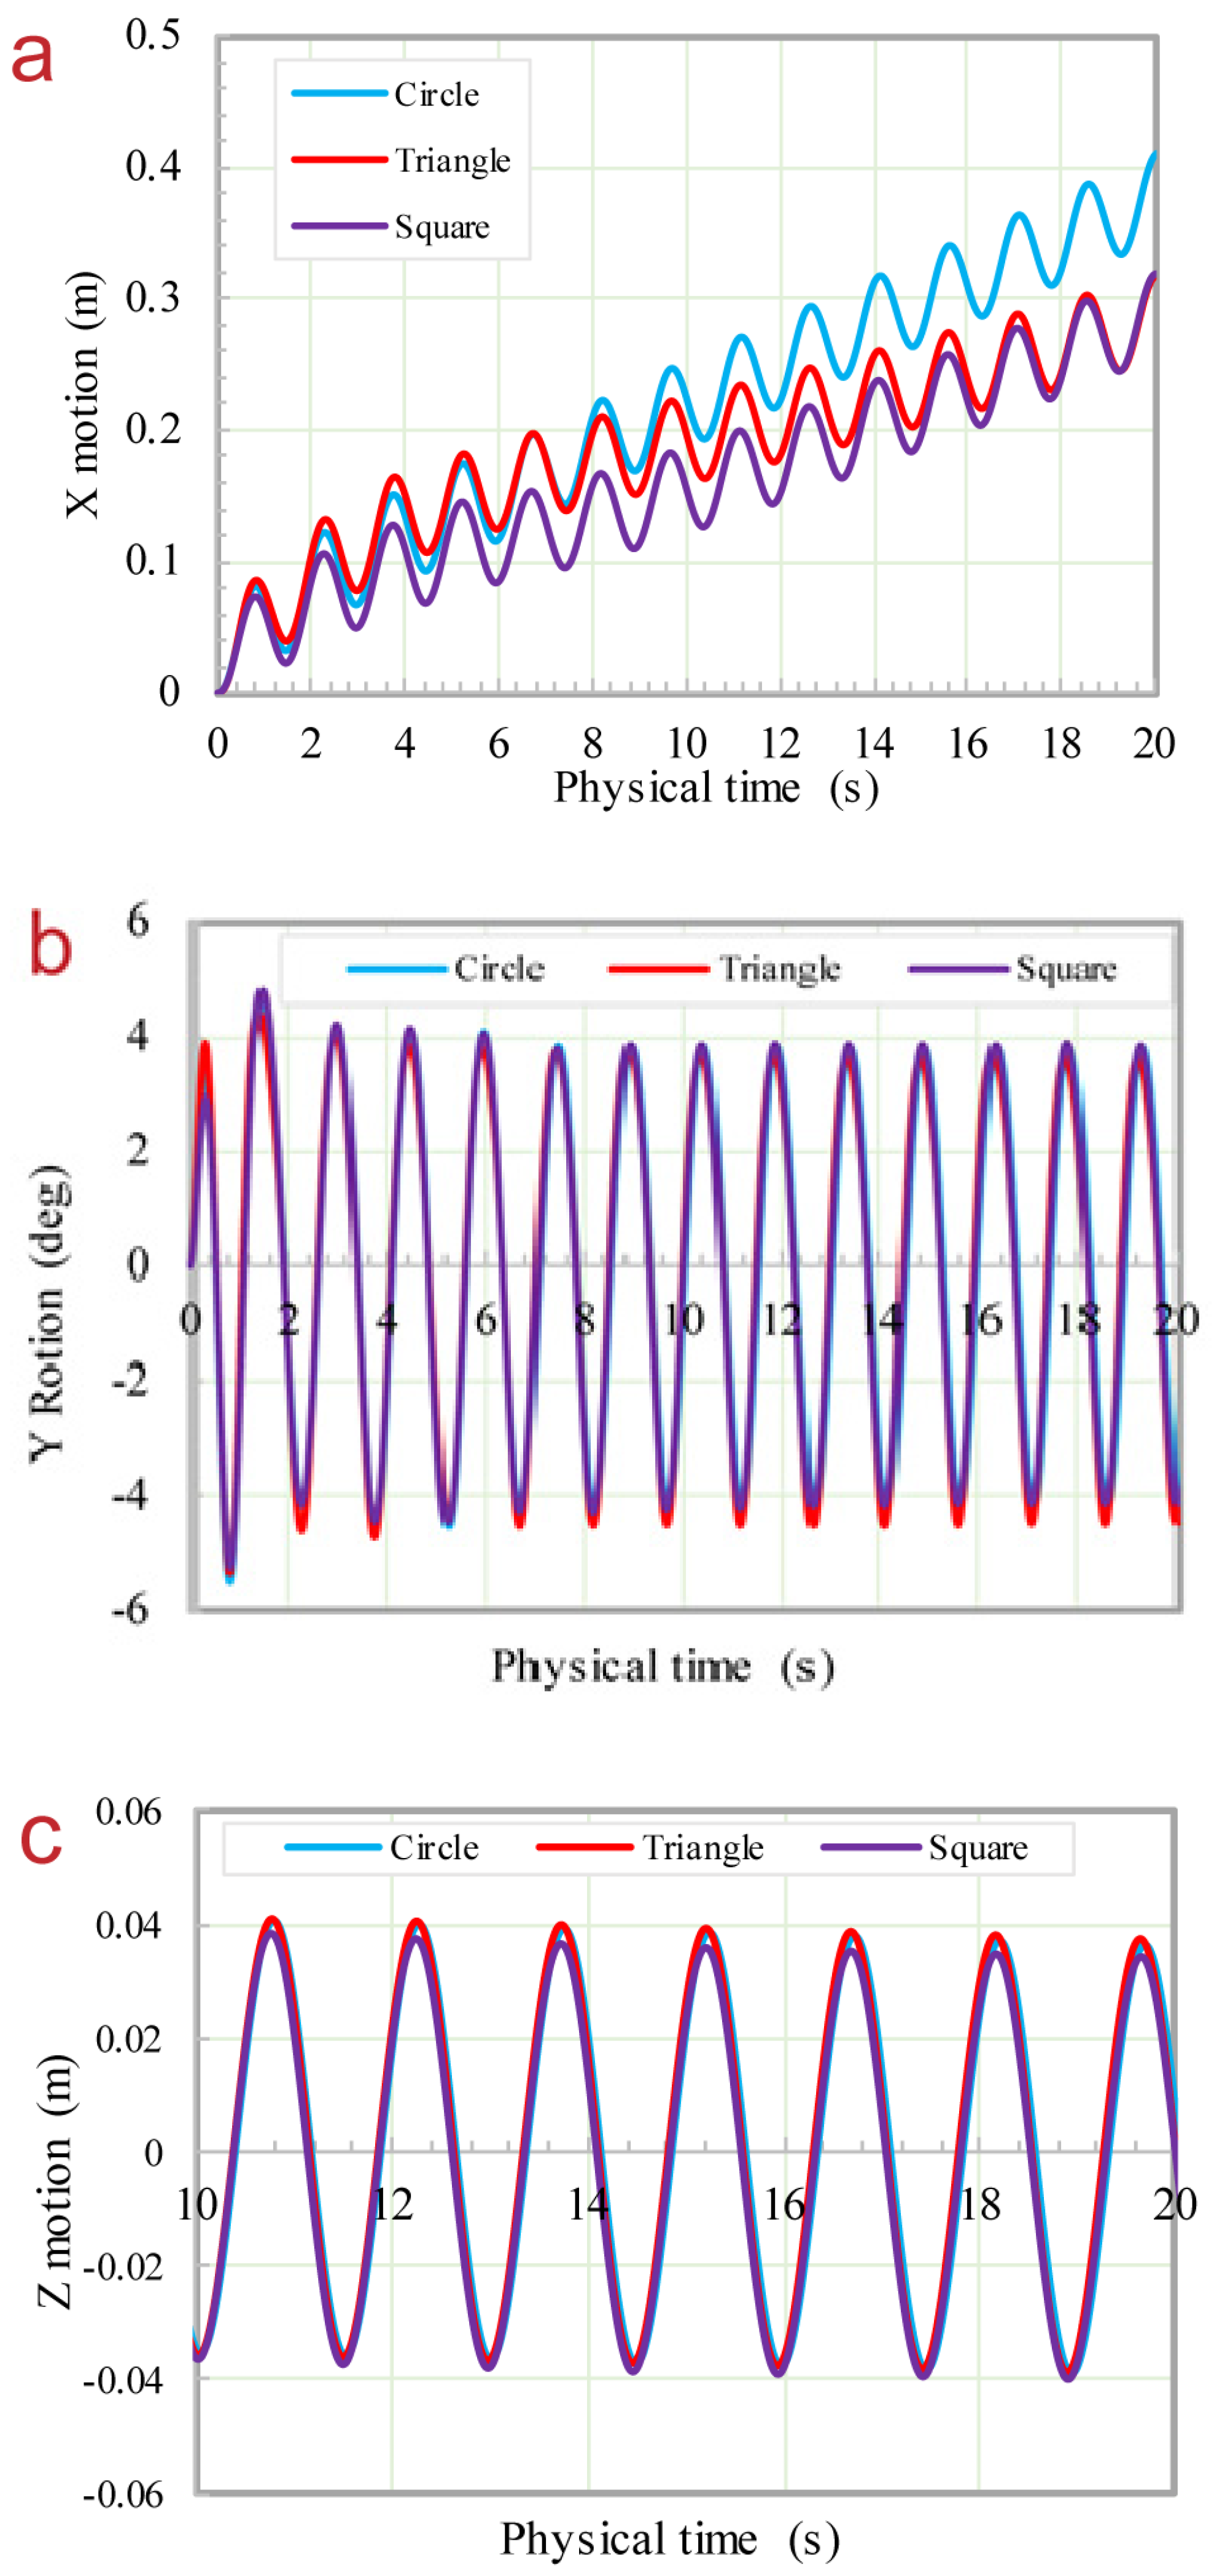
In this section, the influence of ice shape on the motion of ice floes along the x, y, and z directions is discussed. The wave height is at 0.08 m and the wavelength is 3.4 m. The ice floe models employed here are S1, C1, and T1, respectively, as shown in Table 1. From Figure 10a, it can be observed that the trajectory of floating ice drifting along the x-axis under the action of waves is in a periodic reciprocating motion, as it gradually moves away from the initial position along the positive direction of the x-axis. The drift distance of ice floe C1 along the x-axis is the longest, followed by that of ice floe T1, with ice floe S1 as the closest. Figure 10b presents the time history curve of the ice floe rotating along the y-axis, and Figure 10c shows the time history curve of the ice floe translation along the z-axis. The rotational and translational motions along the y- and z-axes, respectively, are periodic in different shapes, and the shape has no obvious effect on the motions of the y- and z-axes.

4.4. Influence of Ice Thickness on x, y, and z Motions

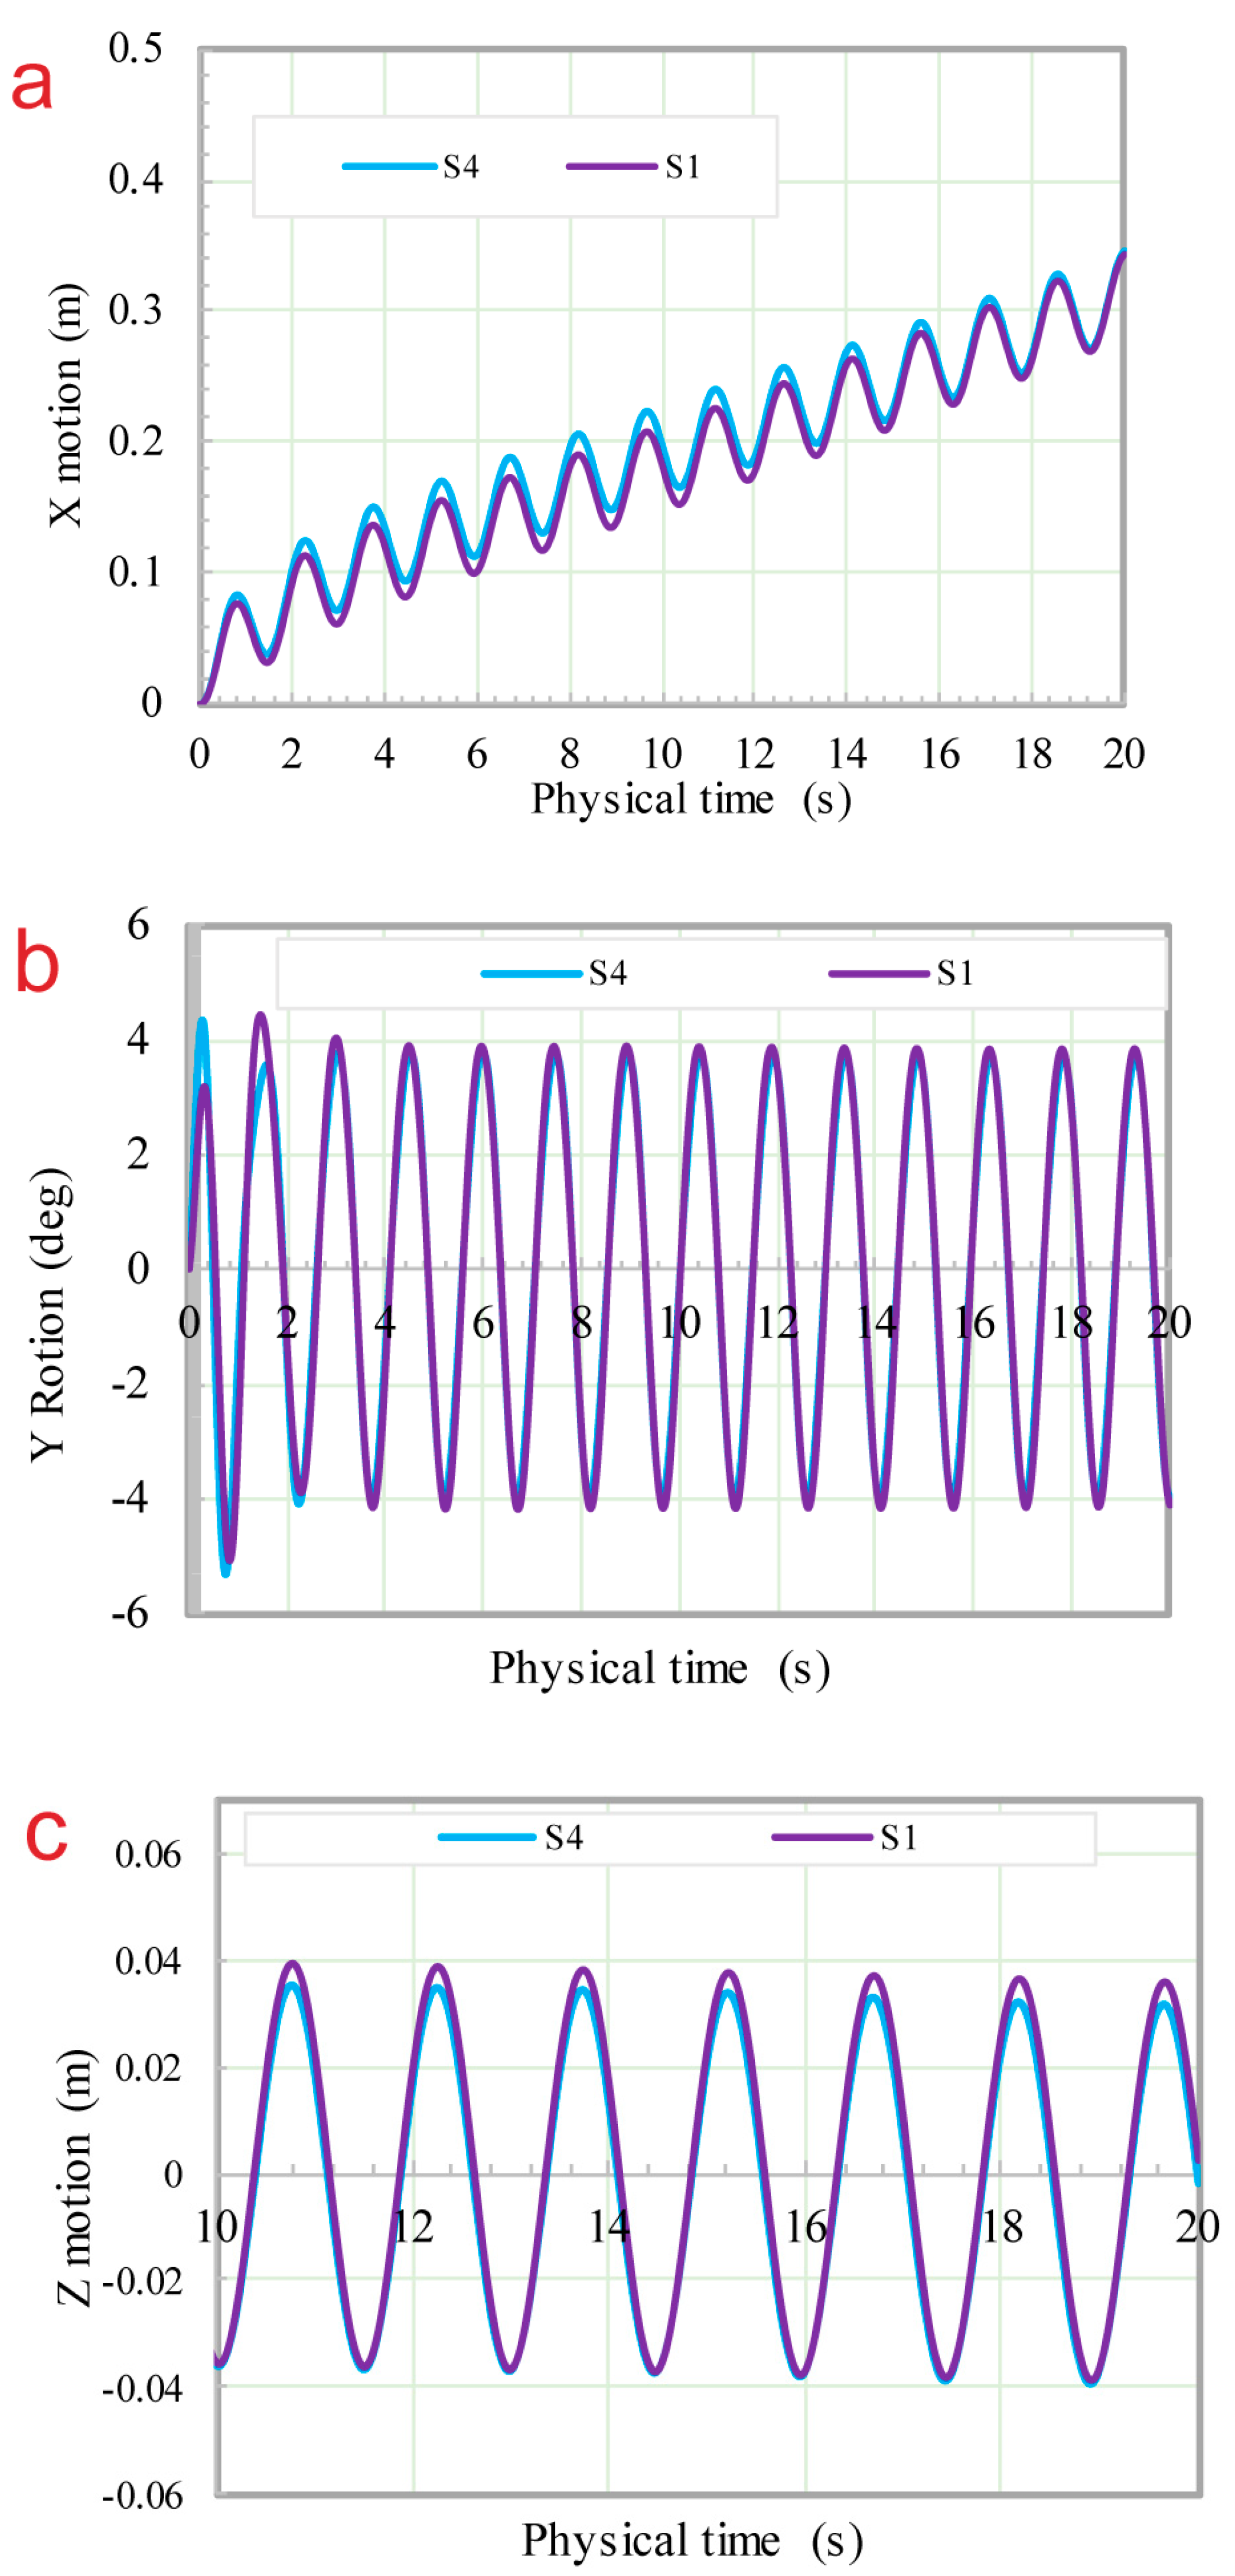
In this section, the influence of ice thickness on the motion of ice floes along the x, y, and z directions is discussed. The square ice floes S1 and S4 with thicknesses of 9 and 5 cm, respectively, are used as the calculation model. The wave height and wavelength are 0.08 and 3.4 m, respectively. As shown in Figure 11, the rotational and translational motions along the y- and z-axes, respectively, are periodic in different ice thicknesses, therefore, thickness has no significant effect on the motions of the y- and z-axes. The motion along the x-axis is a periodic reciprocating motion, which gradually moves away from the initial position, and the drift distance of the ice with a smaller thickness is longer.

4.5. Influence of Ice Size on x, y, and z Motion

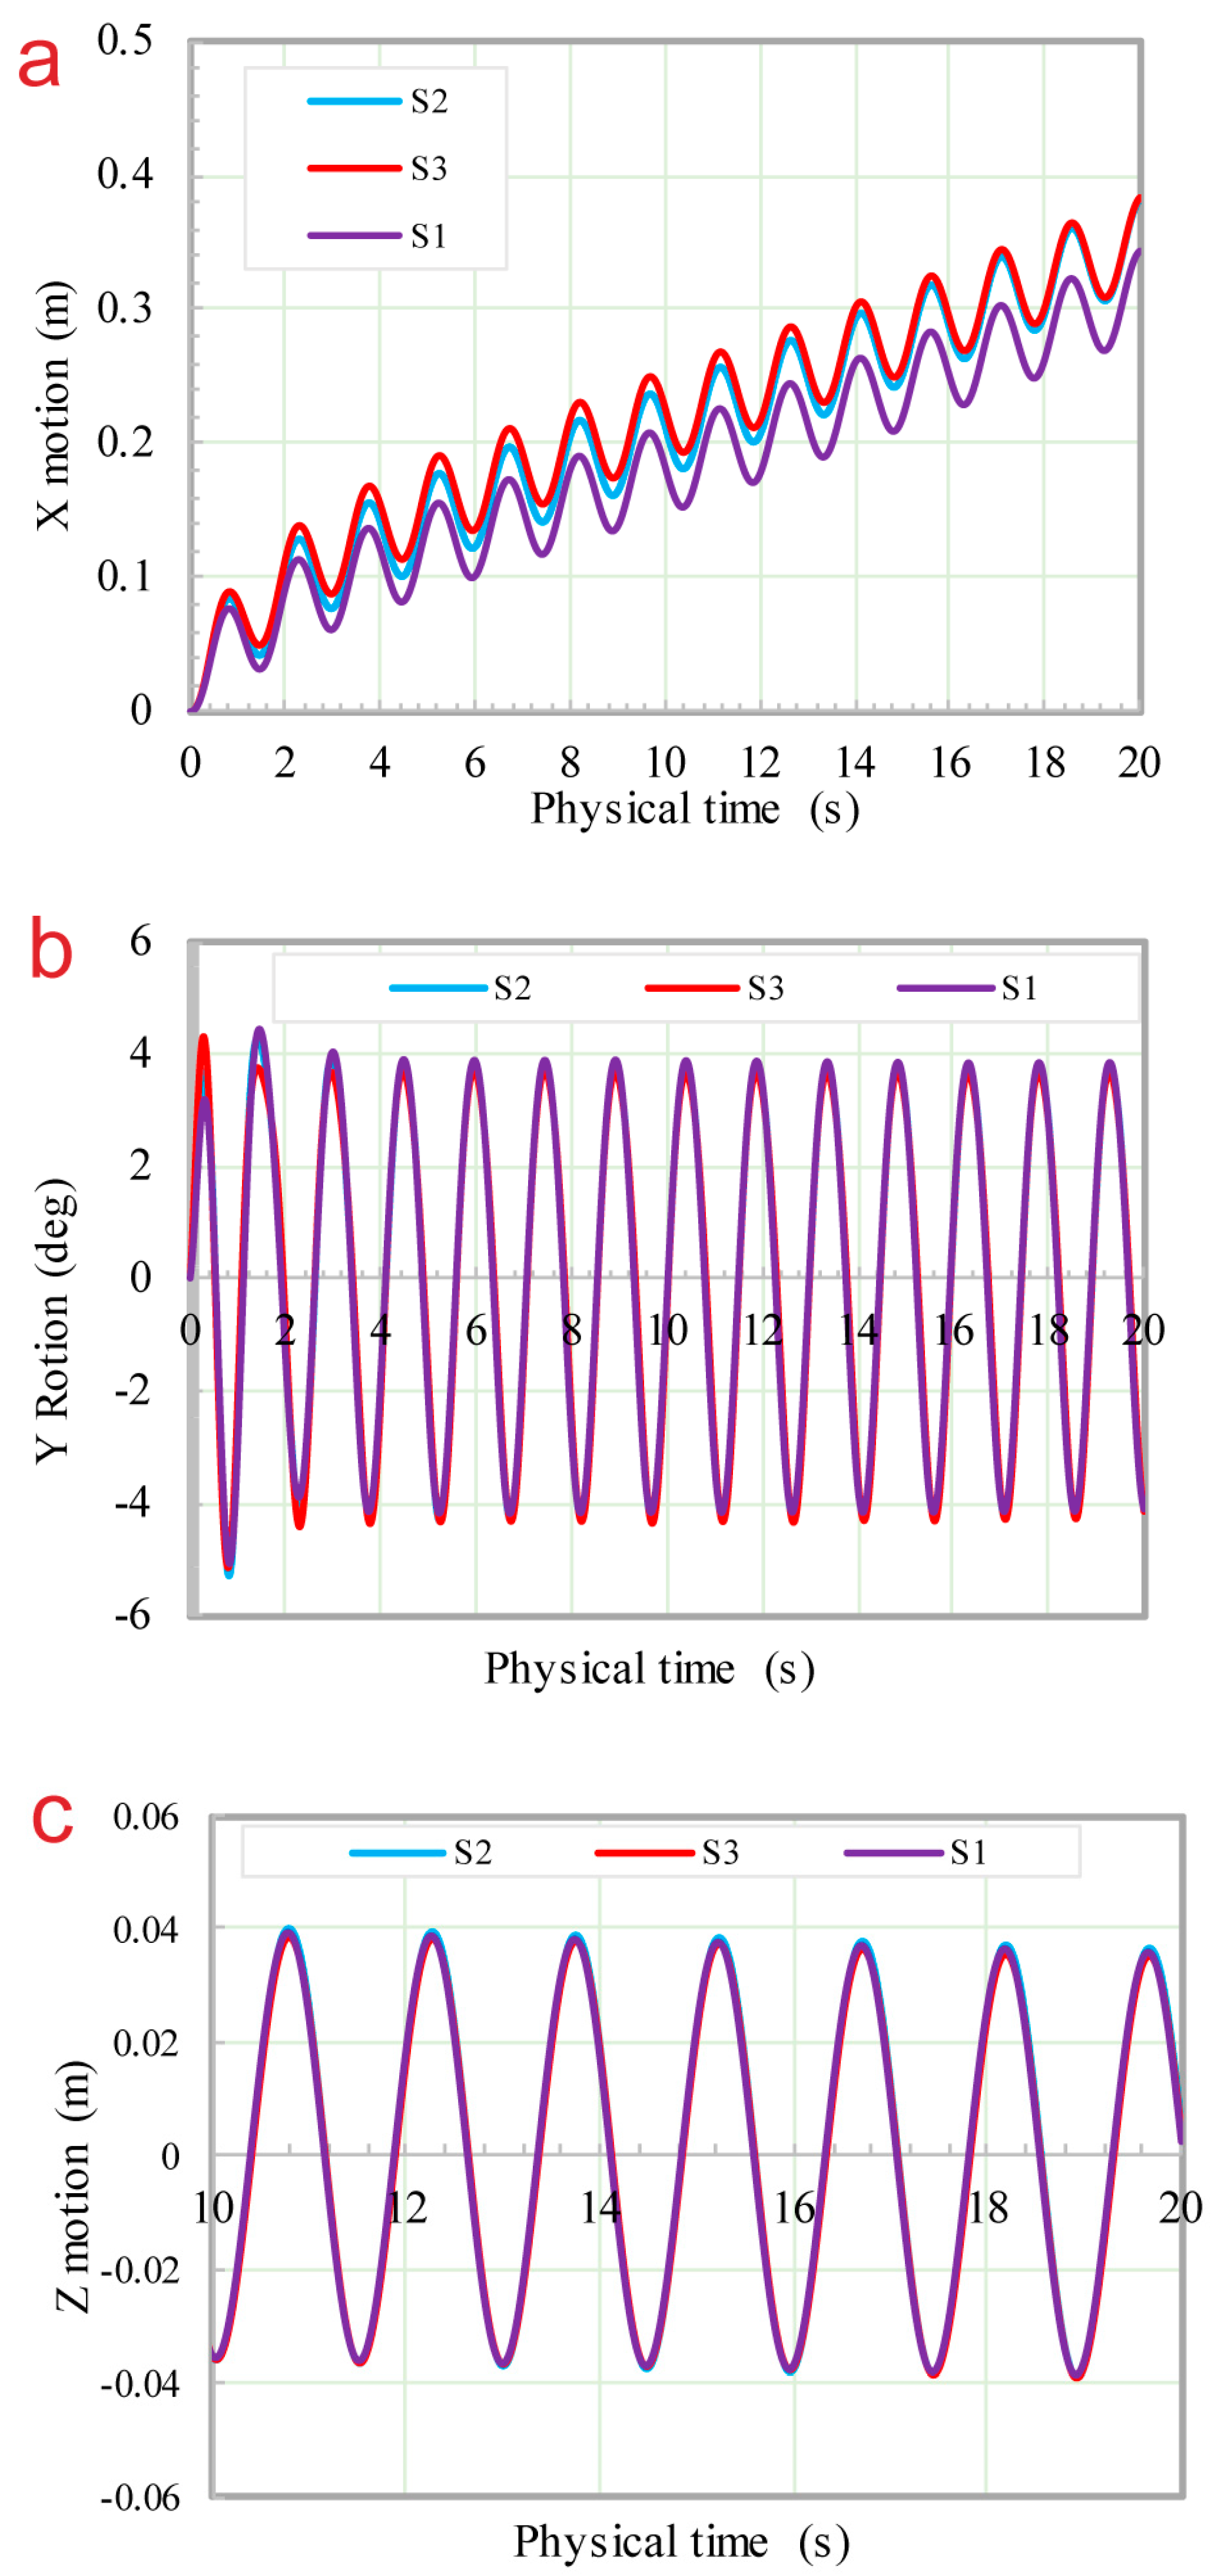
In this section, S1, S2, and S3 (Table 1) are used as the calculation models to discuss the influence of ice size on the motion of ice floes along the x, y, and z directions. As shown in Figure 12a, ice floe S3 with the smallest size has the farthest drift distance along the x axis, followed by ice floe S2, whereas ice floe S1 has the closest drift distance. Ice floes of different sizes have no significant effect on the rotational and translational motions of the y- and z-axes, respectively.

4.6. Overwash

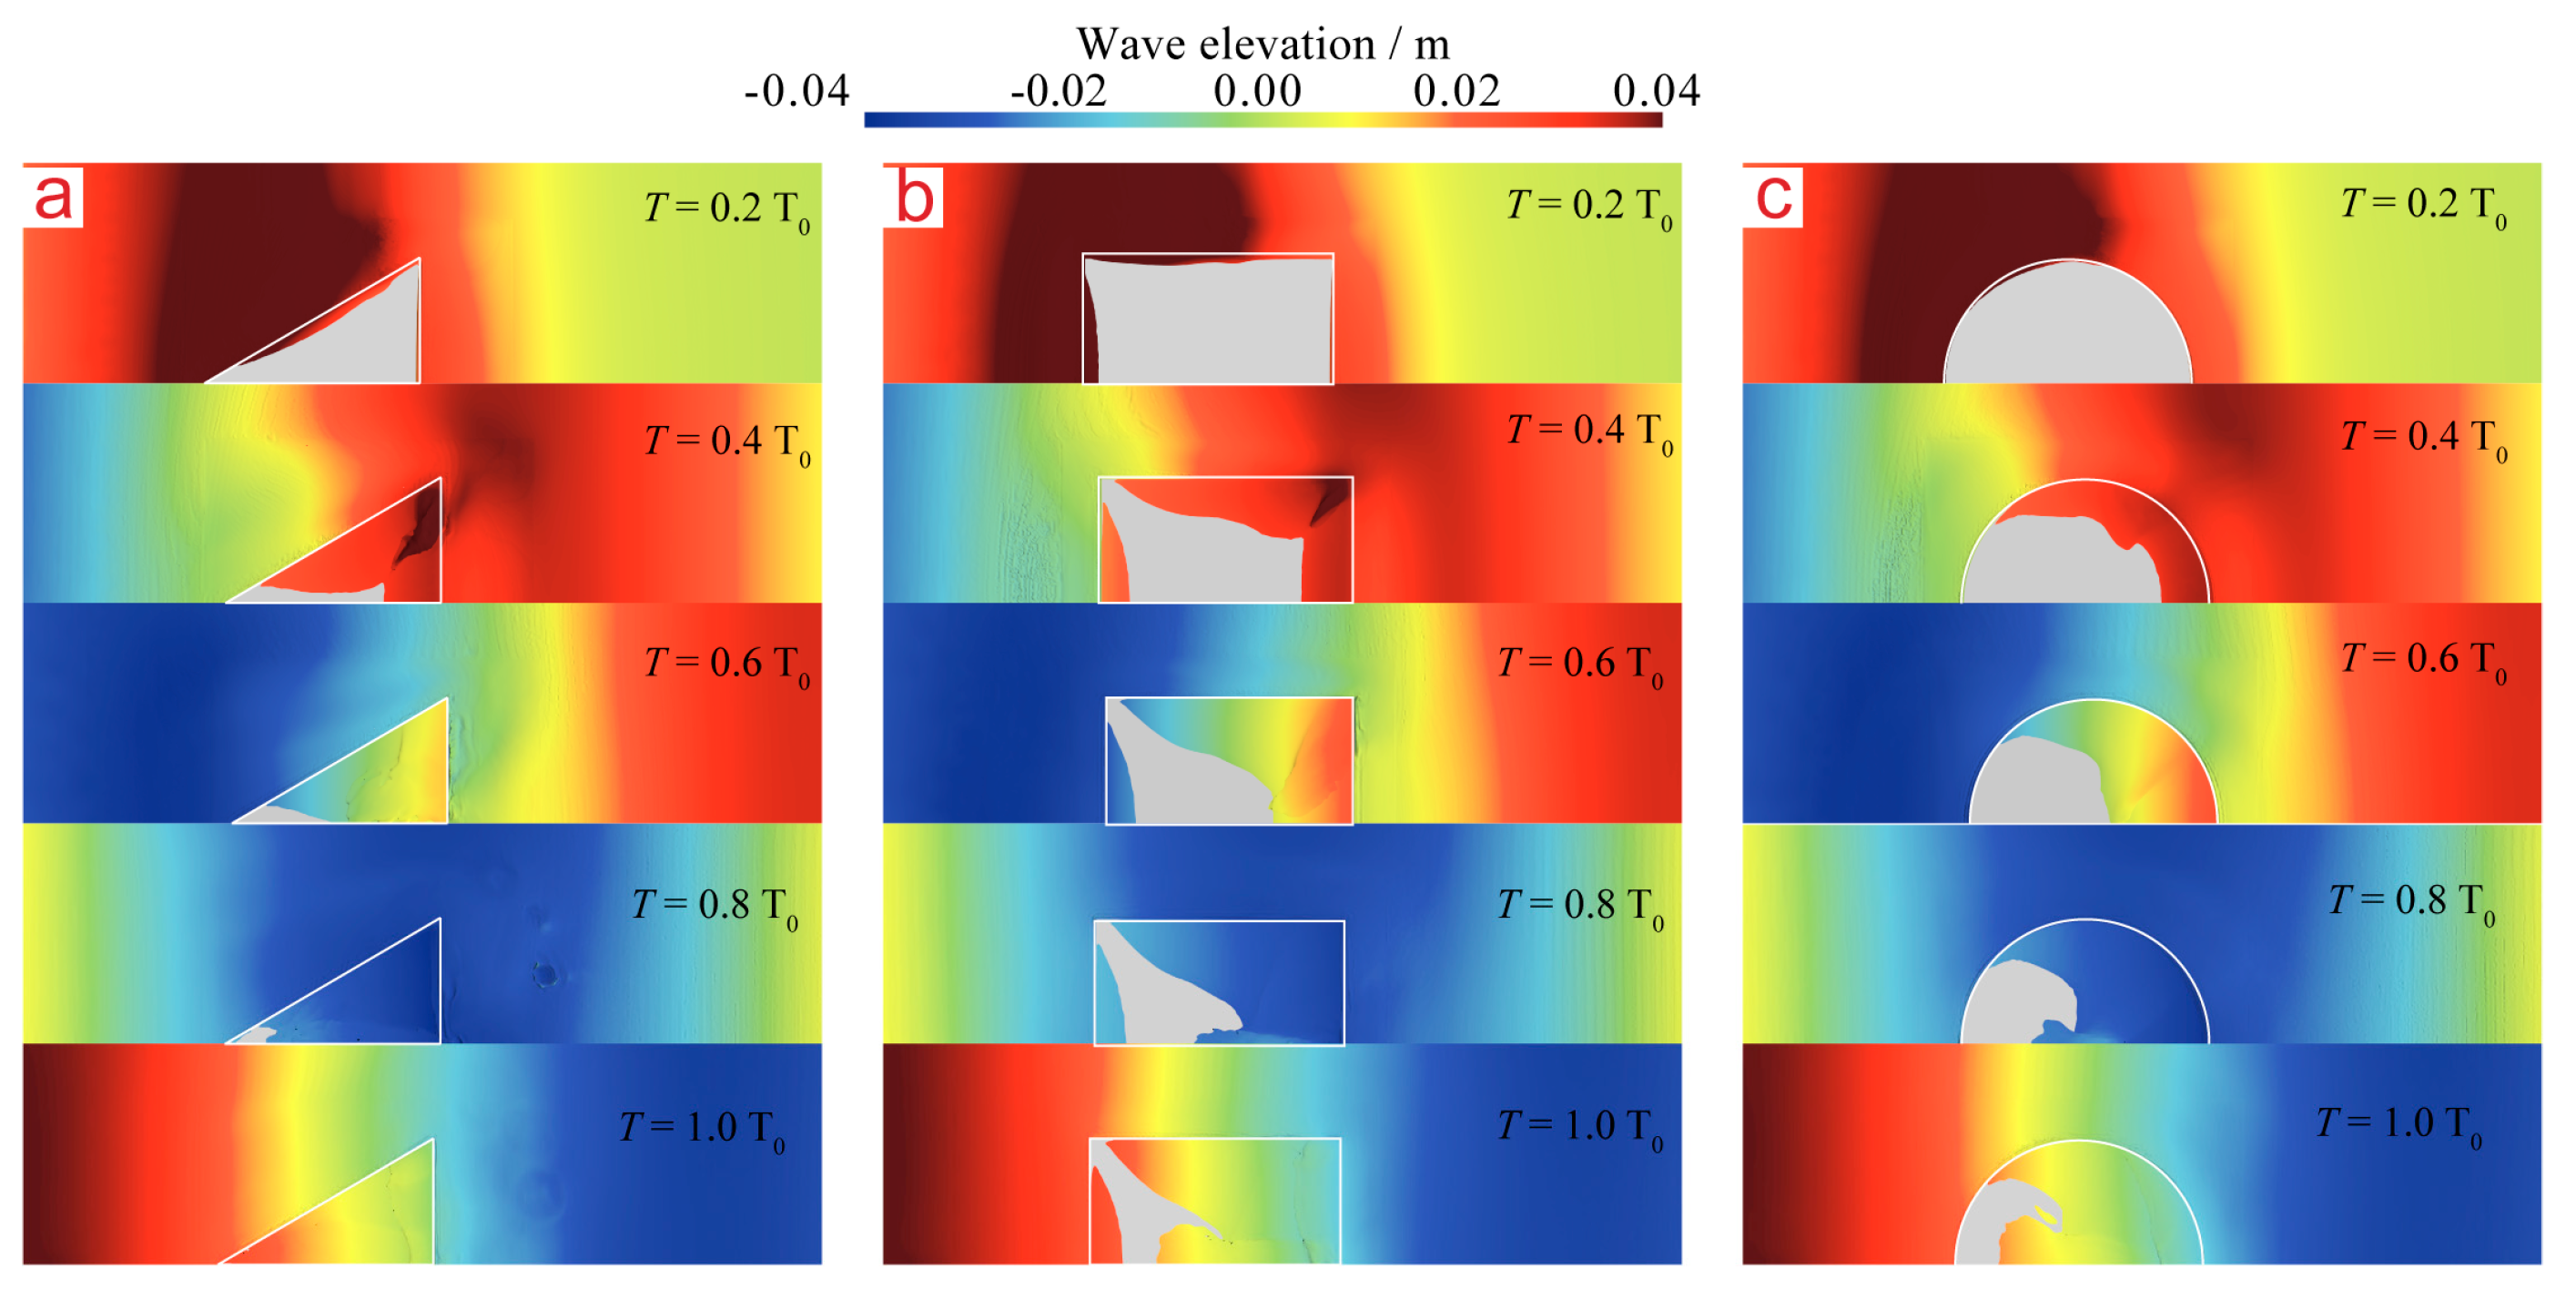
In the wave–ice floe interaction process, an obvious phenomenon called overwash can be observed. Nelli F et al. [30] used a numerical model to simulate the transmission of regular water waves by a thin floating plate. The phenomenon of waves overwash is especially studied. Tran-Duc T et al. [31] investigated the phenomena of overwash with a flexible elastic plate under wave action. Overwash is a nonlinear phenomenon in which water flows over the top of floating ice under the action of waves [32]. Figure 13 shows the wave elevation at different times after the wave–ice floe interaction. T0 represents the wave period, and Figure 13a–c show the wave elevation at T = 0.2 T0, T = 0.4 T0, T = 0.6 T0, T = 0.8 T0 and T = T0 with ice floe S1, C1 and T1, respectively. Due to the symmetricity of the computational domain and model, only half of the results are presented.
At the point T = 0.2 T0, it can be observed that the wave is at its peak and overwash is negligible at this time. From T = 0.4 T0 to T = T0, we can observe a significant overwash phenomenon. At T = 0.4 T0, the wave elevation on the surface of the floating ice is at the wave’s peak. At T = 0.6 T0, the wave elevation on the surface of the floating ice decreases. At T = 0.8 T0, the wave elevation on the floating ice is at the wave trough. Finally, at T = T0, the wave elevation increases gradually and begins to change in the next cycle.
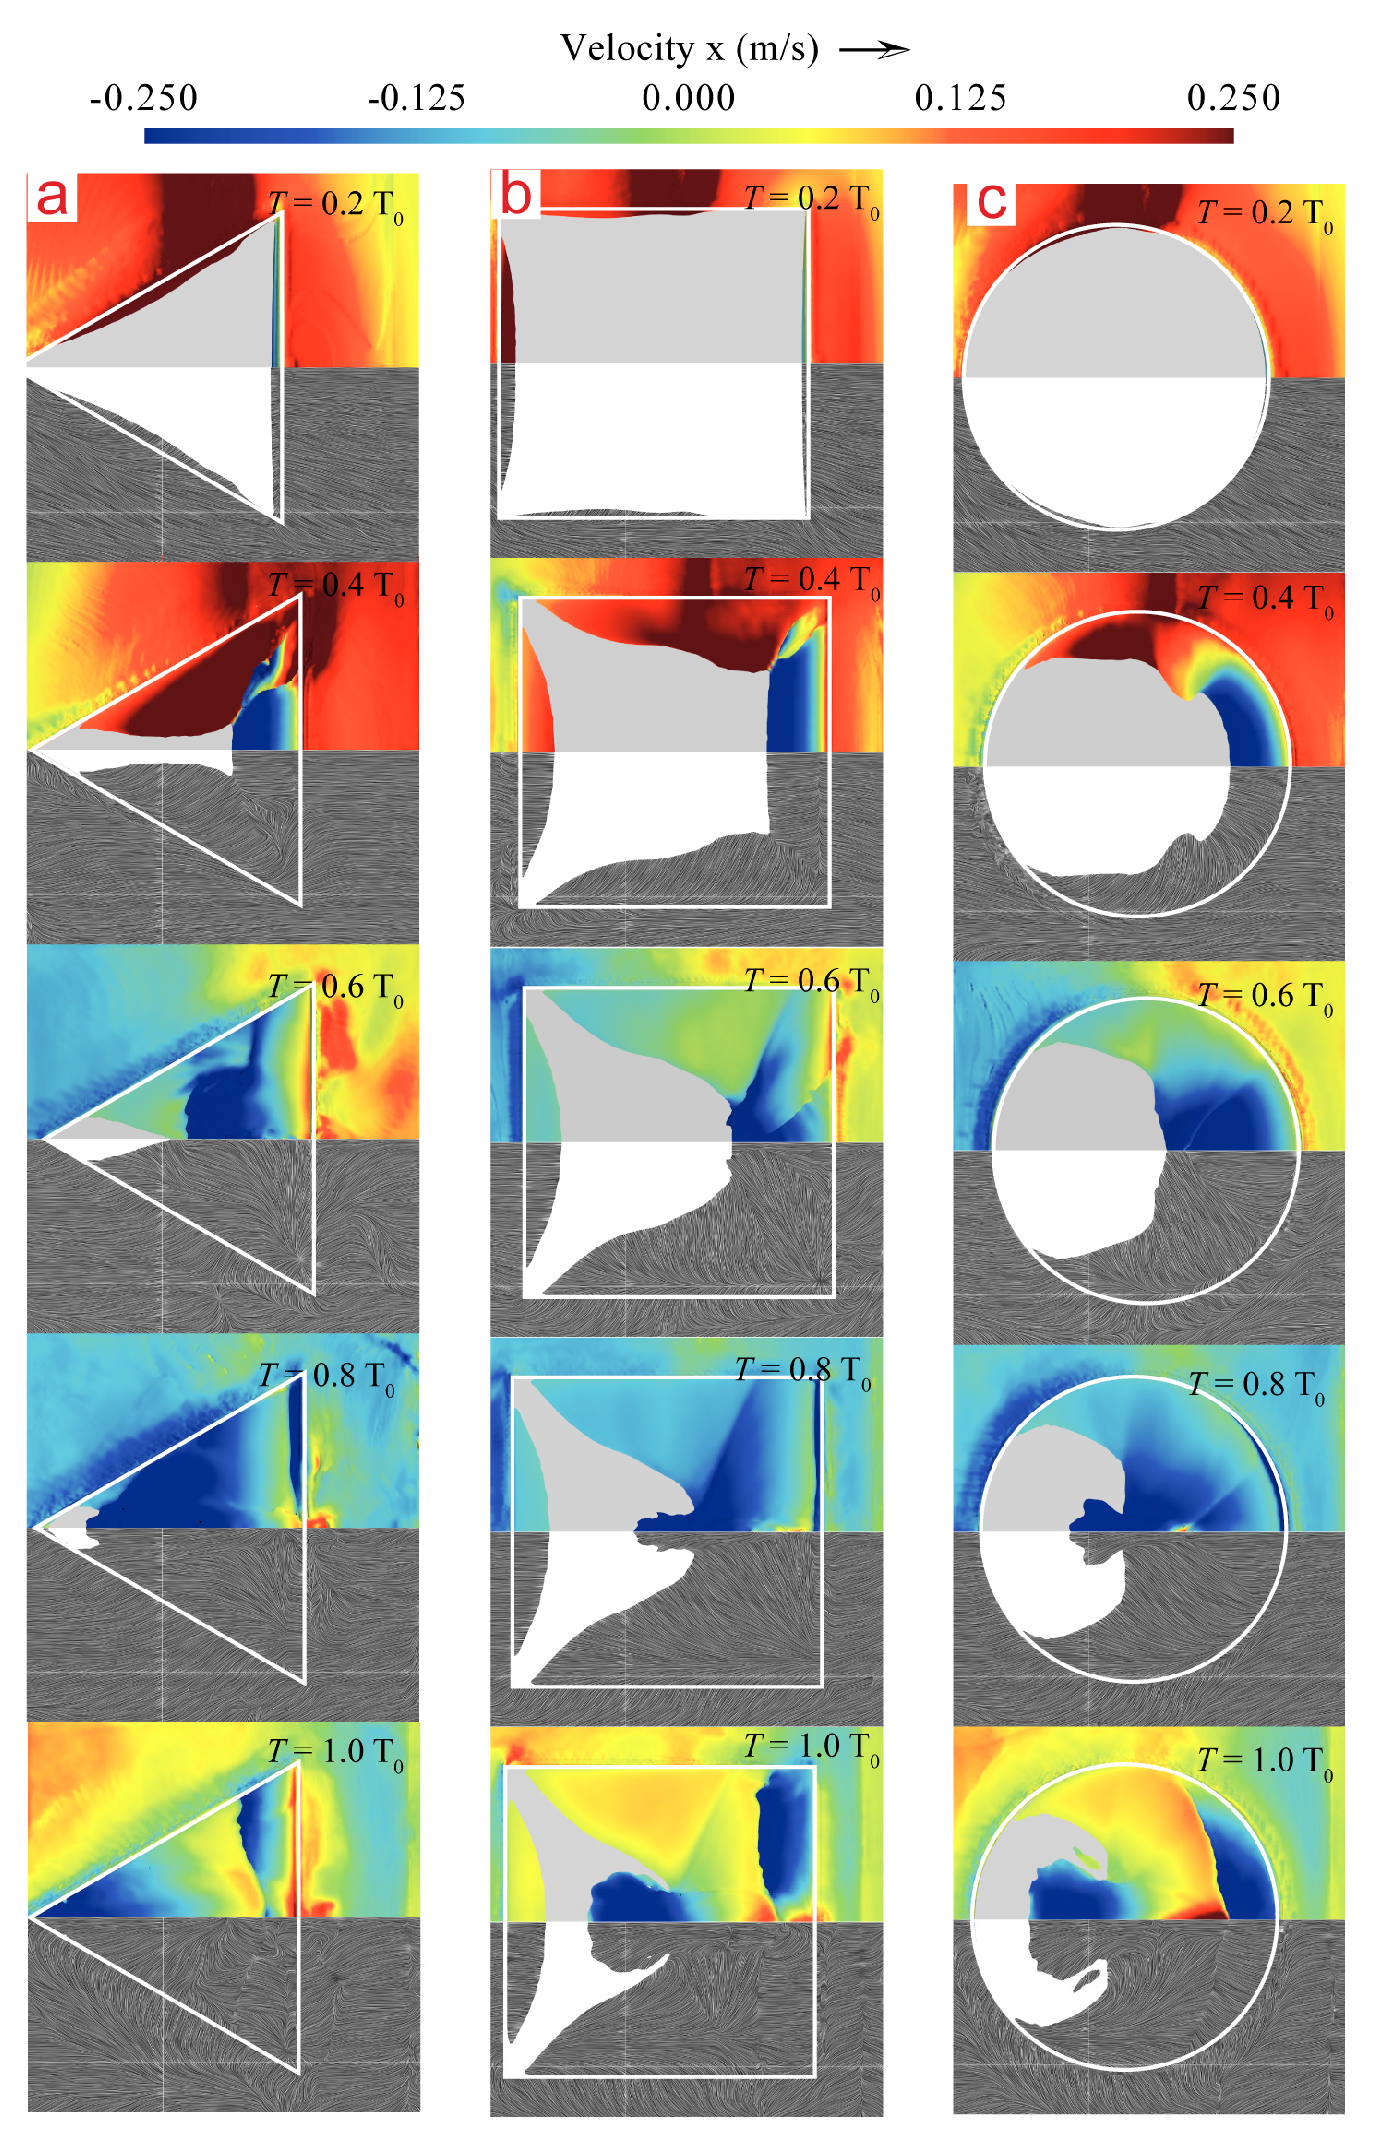
Figure 14 illustrates the velocity distribution of the fluid around the ice floes in different shapes, in which the upper and lower parts represent the velocity field and streamline distributions, respectively. Figure 14a–c illustrate the velocity distribution of the fluid around S1, T1, and C1 ice floes at T = 0.2 T0, T = 0.4 T0, T = 0.6 T0, T = 0.8 T0 and T = T0, respectively.
When the wave acts on the edge of the ice floe, the fluid around the ice floe takes a velocity direction that is consistent with the wave propagation direction at T = 0.2 T0 and T = 0.4 T0. At T = 0.6 T0, the wave slows down due to the opposite force of the propagation direction of the wave on the edge of the floating ice; the fluid velocity around the ice decreases, and even produces a velocity that is opposite to the wave propagation direction. The streamline in the lower half of Figure 14 represents the flow direction of the fluid. The overwash phenomenon on the surface of floating ice can be clearly observed in Figure 14. The exposed white area in the figure indicates a non-overwash area. It can be inferred that the overwash phenomenon is most significant at T = T0.
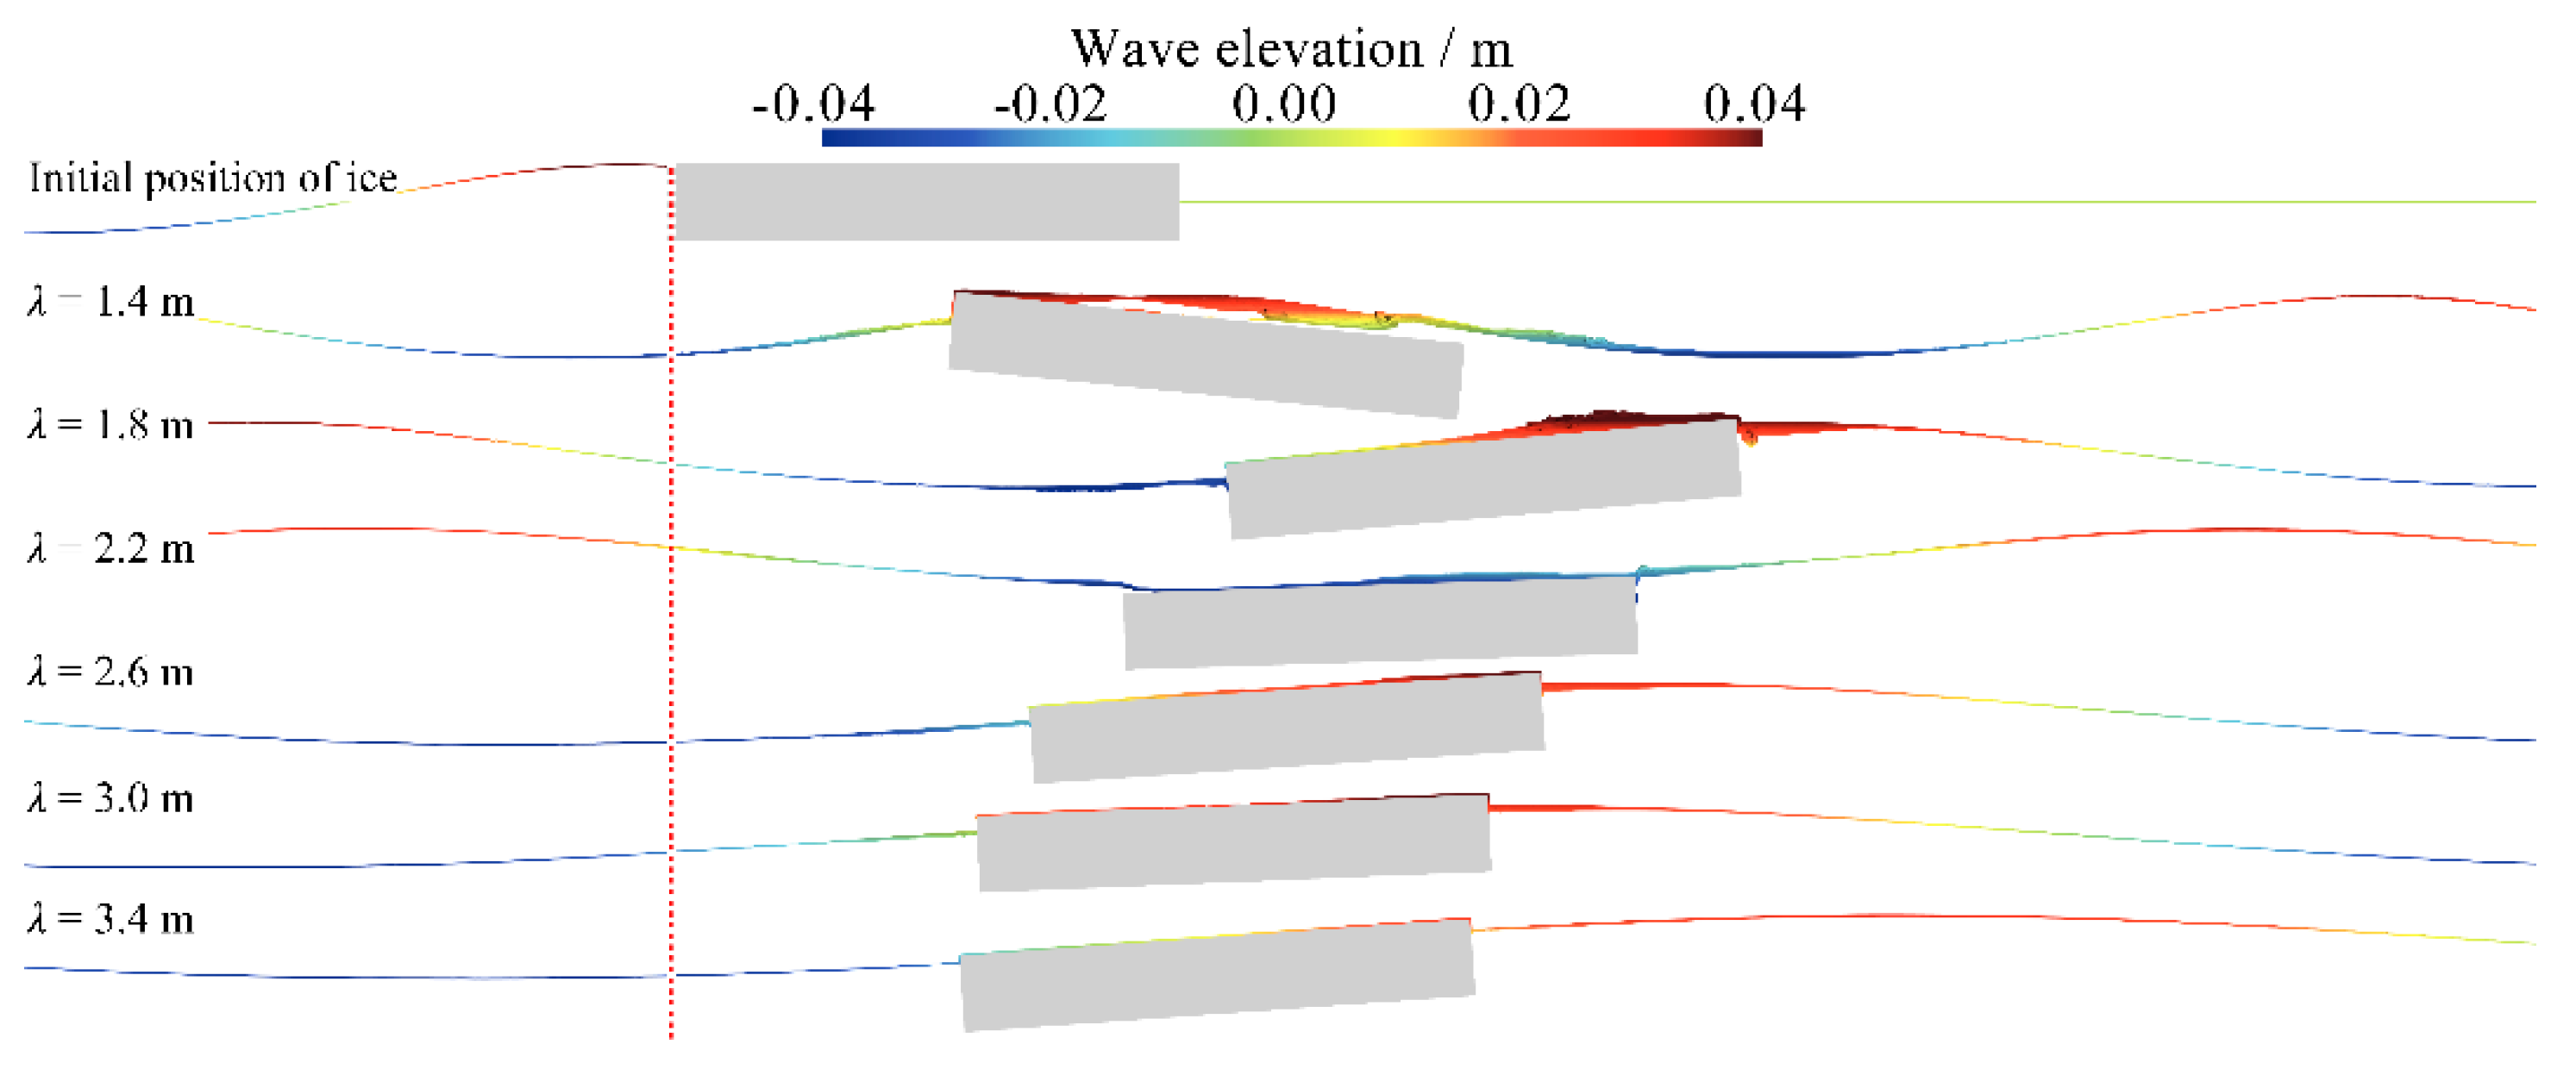
Figure 15 presents the motion attitude of ice floe S1 and its drift position in the x direction at T = 20 s. The drift distance is the longest when the wavelength is 1.8 m, but decreases with the increase in the wavelength from 2.2 to 3.4 m. The drift distance of ice floes reflects the drift velocity along the x-axis at different wavelengths.

5. Conclusions

A numerical study was conducted based on the CFD method to investigate the response of a single ice floe under wave actions. The simulation results obtained were compared with the model scale test in a towing tank while the calculated values agreed well with experimental results. The conclusions drawn from this study are summarized as follows:
(1)
After comparing the CFD and EFD (experimental fluid dynamics) results of RAO at different wavelengths, it is inferred that the numerical results agree optimally with the experimental results. Under the action of wave diffraction and scattering, the RAO value initially increased and then stabilized with an increase in wavelength.
(2)
Under the action of waves, ice floes produced a violent motion. In different conditions, the longitudinal translation, vertical heave, and pitch motions were significant and maintained a certain consistency. The motion of ice floes along the x-, y-, and z-axes is related to wavelength, ice size, ice thickness, and ice shape. When the wavelength was greater than 1.8 m, the drift distance along the x-axis decreased with an increase in wavelength. The ice floes rotated periodically along the y-axis and the rotation amplitude along the y-axis decreased as the wavelength increased. The translational motion along the z-axis was steady when the wavelength is small, but the reciprocating motion along the z-axis was intensified as the wavelength increased.
(3)
Under the same wave parameters, the circular floating ice C1 exhibited the longest drift distance along the x-axis, followed by the triangular floating ice T1; however, the square floating ice exhibited the closest drift distance. The shape of the ice has no significant influence on the motions of the y- and z-axes. The ice thickness exerted a negligible influence on the motions of the x, y, and z directions. The ice floes with the smallest sizes exhibited the longest offset distance along the x-axis, and the motion difference of the y- and z-axes, relative to size, was insignificant.
(4)
In this study, the overwash of different shapes of floating ice was analysed at different times. It was inferred that the overwash phenomenon was the most significant at T = T0 for any shape of floating ice, and the overwash changes with the wave period.

Author Contributions

Conceptualization, T.W. and W.L.; methodology, T.W.; software, W.L.; validation, R.D. and S.H.; formal analysis, W.L.; investigation, D.J.; resources, T.W.; data curation, W.L.; writing—original draft preparation, T.W., W.L. and D.J.; writing—review and editing, W.L.; visualization, S.H.; supervision, D.J. and R.D.; project administration, D.J.; funding acquisition, R.D. and D.J. All authors have read and agreed to the published version of the manuscript.

Funding

This research was funded by the Guangdong Basic and Applied Basic Research Foundation (2019A1515110721), the China Postdoctoral Science Foundation (No. 2019M663243); the Fundamental Research Funds for the Central Universities (No.20lgpy52); the Foundation of Pre-research on Military Equipment of the Chinese People’s Liberation Army (No.6140241010103; JZX7Y20190252032901); the Aeronautical Science Foundation of China (No. 201723P6001).

Institutional Review Board Statement

Not applicable.

Informed Consent Statement

Not applicable.

Data Availability Statement

Data is contained within the present article.

Conflicts of Interest

The authors declare no conflict of interest. The funders had no role in the design of the study; in the collection, analyses, or interpretation of data; in the writing of the manuscript, or in the decision to publish the results.

References

  1. Lee, C.M.; Cole, S.; Doble, M.; Freitag, L.; Hwang, P. Marginal Ice Zone (MIZ) Program: Science and Experiment Plan; Technical Report; Washington University Seattle Applied Physics Lab: Seattle, WA, USA, 2012. [Google Scholar]
  2. Kohout, A.L.; Meylan, M.H. An elastic plate model for wave attenuation and ice floe breaking in the marginal ice zone. J. Geophys. Res. Oceans 2008, 113. [Google Scholar] [CrossRef]
  3. Dumont, D.; Kohout, A.; Bertino, L. A wave-based model for the marginal ice zone including a floe breaking parameterization. J. Geophys. Res. 2011, 116, 241–253. [Google Scholar] [CrossRef] [Green Version]
  4. Toyota, T.; Kohout, A.; Fraser, A. Formation processes of floe size distribution in the marginal ice zone (Invited). Blood 1998, 92, 1297–1307. [Google Scholar]
  5. Marchenko, A.; Wadhams, P.; Collins, C.; Rabault, J.; Chumakov, M. Wave-ice interaction in the north-west barents sea. Appl. Ocean Res. 2019, 90, 101861. [Google Scholar] [CrossRef] [Green Version]
  6. Kovalev, P.D.; Squire, V.A. Ocean wave/sea ice interactions in the south-eastern coastal zone of Sakhalin Island. Estuar. Coast. Shelf Sci. 2020, 238, 106725. [Google Scholar] [CrossRef]
  7. Squire, V.A.; Dugan, J.P.; Wadhams, P.; Rottier, P.J.; Liu, A.K. Of ocean waves and sea ice. Annu. Rev. Fluid Mech. 1995, 27, 115–168. [Google Scholar] [CrossRef]
  8. Toyota, T.; Haas, C.; Tamura, T. Size distribution and shape properties of relatively small sea-ice floes in the Antarctic marginal ice zone in late winter. Deep Sea Res. Part II Top. Stud. Oceanogr. 2011, 58, 1182–1193. [Google Scholar] [CrossRef] [Green Version]
  9. Zhang, J.; Schweiger, A.; Steele, M.; Stern, H. Sea ice floe size distribution in the marginal ice zone: Theory and numerical experiments. J. Geophys. Res. Oceans 2015, 120, 3484–3498. [Google Scholar] [CrossRef]
  10. Thorndike, A.S.; Rothrock, D.A.; Maykut, G.A.; Colony, R. The thickness distribution of sea ice. J. Geophys. Res. 1975, 80, 4501–4545. [Google Scholar] [CrossRef]
  11. Gupta, M. Various remote sensing approaches to understanding roughness in the marginal ice zone. Phys. Chem. Earth Parts Abc 2015, 83–84, 75–83. [Google Scholar] [CrossRef]
  12. Williams, T.D.; Bennetts, L.G.; Squire, V.A.; Dumont, D.; Bertino, L. Wave–ice interactions in the marginal ice zone. Part 1: Theoretical foundations. Ocean Model. 2013, 71, 81–91. [Google Scholar] [CrossRef]
  13. Peters, A.S. The effect of a floating mat on water waves. Commun. Pure Appl. Math. 1950, 3, 319–354. [Google Scholar] [CrossRef]
  14. Weitz, M.; Keller, J.B. Reflection of water waves from floating ice in water of finite depth. Commun. Pure Appl. Math. 1950, 3, 305–318. [Google Scholar] [CrossRef]
  15. Wadhams, P. The seasonal ice zone. In The Geophysics of Sea Ice; Springer: Boston, MA, USA, 1986; pp. 825–991. [Google Scholar]
  16. Keller, J.B. Gravity waves on ice covered water. J. Geophys. Res. Oceans 1998, 103, 7663–7669. [Google Scholar] [CrossRef]
  17. Carolis, D.G.; Desiderio, D. Dispersion and attenuation of gravity waves in ice: A two-layer viscous fluid model with experimental data validation. Phys. Lett. A 2002, 305, 399–412. [Google Scholar] [CrossRef]
  18. Wang, R.; Shen, H.H. Gravity waves propagating into an ice-covered ocean: A viscoelastic model. J. Geophys. Res. Oceans 2010, 115. [Google Scholar] [CrossRef]
  19. Newyear, K.; Martin, S. A comparison of theory and laboratory measurements of wave propagation and attenuation in grease ice. J. Geophys. Res. Oceans 1997, 102, 25091–25099. [Google Scholar] [CrossRef]
  20. Sakai, S.; Hanai, K. Empirical formula of dispersion relation of waves in sea ice. Ice in the Environment. In Proceedings of the 16th IAHR International Symposium on Ice, Dunedin, New Zealand, 1–6 December 2002; pp. 327–335. [Google Scholar]
  21. Dai, M.; Shen, H.H.; Hopkins, M.A.; Ackley, S.F. Wave rafting and the equilibrium pancake ice cover thickness. J. Geophys. Res. Oceans 2004, 109. [Google Scholar] [CrossRef]
  22. Parra, S.M.; Sree, D.K.; Wang, D.; Rogers, E.; Lee, J.H.; Collins, C.O., III; Law, A.W.K.; Babanin, A.V. Experimental study on surface wave modifications by different ice covers. Cold Reg. Sci. Technol. 2020, 103042. [Google Scholar] [CrossRef]
  23. Huang, L.; Ren, K.; Li, M.; Tuković, Ž.; Cardiff, P.; Thomas, G. Fluid-structure interaction of a large ice sheet in waves. Ocean Eng. 2019, 182, 102–111. [Google Scholar] [CrossRef] [Green Version]
  24. Zhang, Y.; Chen, C.; Beardsley, R.C.; Perrie, W.; Gao, G.; Zhang, Y.; Qi, J.; Lin, H. Applications of an unstructured grid surface wave model (FVCOM-SWAVE) to the Arctic Ocean: The interaction between ocean waves and sea ice. Ocean Model. 2020, 145, 101532. [Google Scholar] [CrossRef]
  25. Wilcox, D.C. Turbulence Modeling for CFD; DCW Industries, Inc.: La Canada, CA, USA, 1994; pp. 15–19. [Google Scholar]
  26. Muzaferija, S. Computation of free surface flows using interface-tracking and interface-capturing methods. In Nonlinear Water-Wave Interaction; Computational Mechanics: Southampton, UK, 1998. [Google Scholar]
  27. Fenton, J.D. A Fifth-Order Stokes Theory for Steady Waves. J. Waterw. Port Coast. Ocean Eng. 1985, 111, 216–234. [Google Scholar] [CrossRef] [Green Version]
  28. Kim, J.W.; Jang, H.; Baquet, A.; O’Sullivan, J.; Lee, S.; Kim, B.; Read, A.; Jasak, H. Technical and Economic Readiness Review of CFD-Based Numerical Wave Basin for Offshore Floater Design. In Proceedings of the Offshore Technology Conference, Houston, TX, USA, 2–5 May 2016. [Google Scholar]
  29. Wang, C.; Song, M.; Guo, C.; Wang, S.; Tian, T.; Luo, W. Experimental Study of Sea Ice Motion in Waves. J. Cold Reg. Eng. 2020, 34, 04020010. [Google Scholar] [CrossRef]
  30. Nelli, F.; Bennetts, L.G.; Skene, D.M.; Toffoli, A. Water wave transmission and energy dissipation by a floating plate in the presence of overwash. J. Fluid Mech. 2020, 889. [Google Scholar] [CrossRef]
  31. Tran-Duc, T.; Meylan, M.H.; Thamwattana, N.; Lamichhane, B.P. Wave Interaction and Overwash with a Flexible Plate by Smoothed Particle Hydrodynamics. Water 2020, 12, 3354. [Google Scholar] [CrossRef]
  32. Skene, D.M.; Bennetts, L.G.; Meylan, M.H.; Toffoli, A. Modelling water wave overwash of a thin floating plate. J. Fluid Mech. 2015, 777. [Google Scholar] [CrossRef] [Green Version]
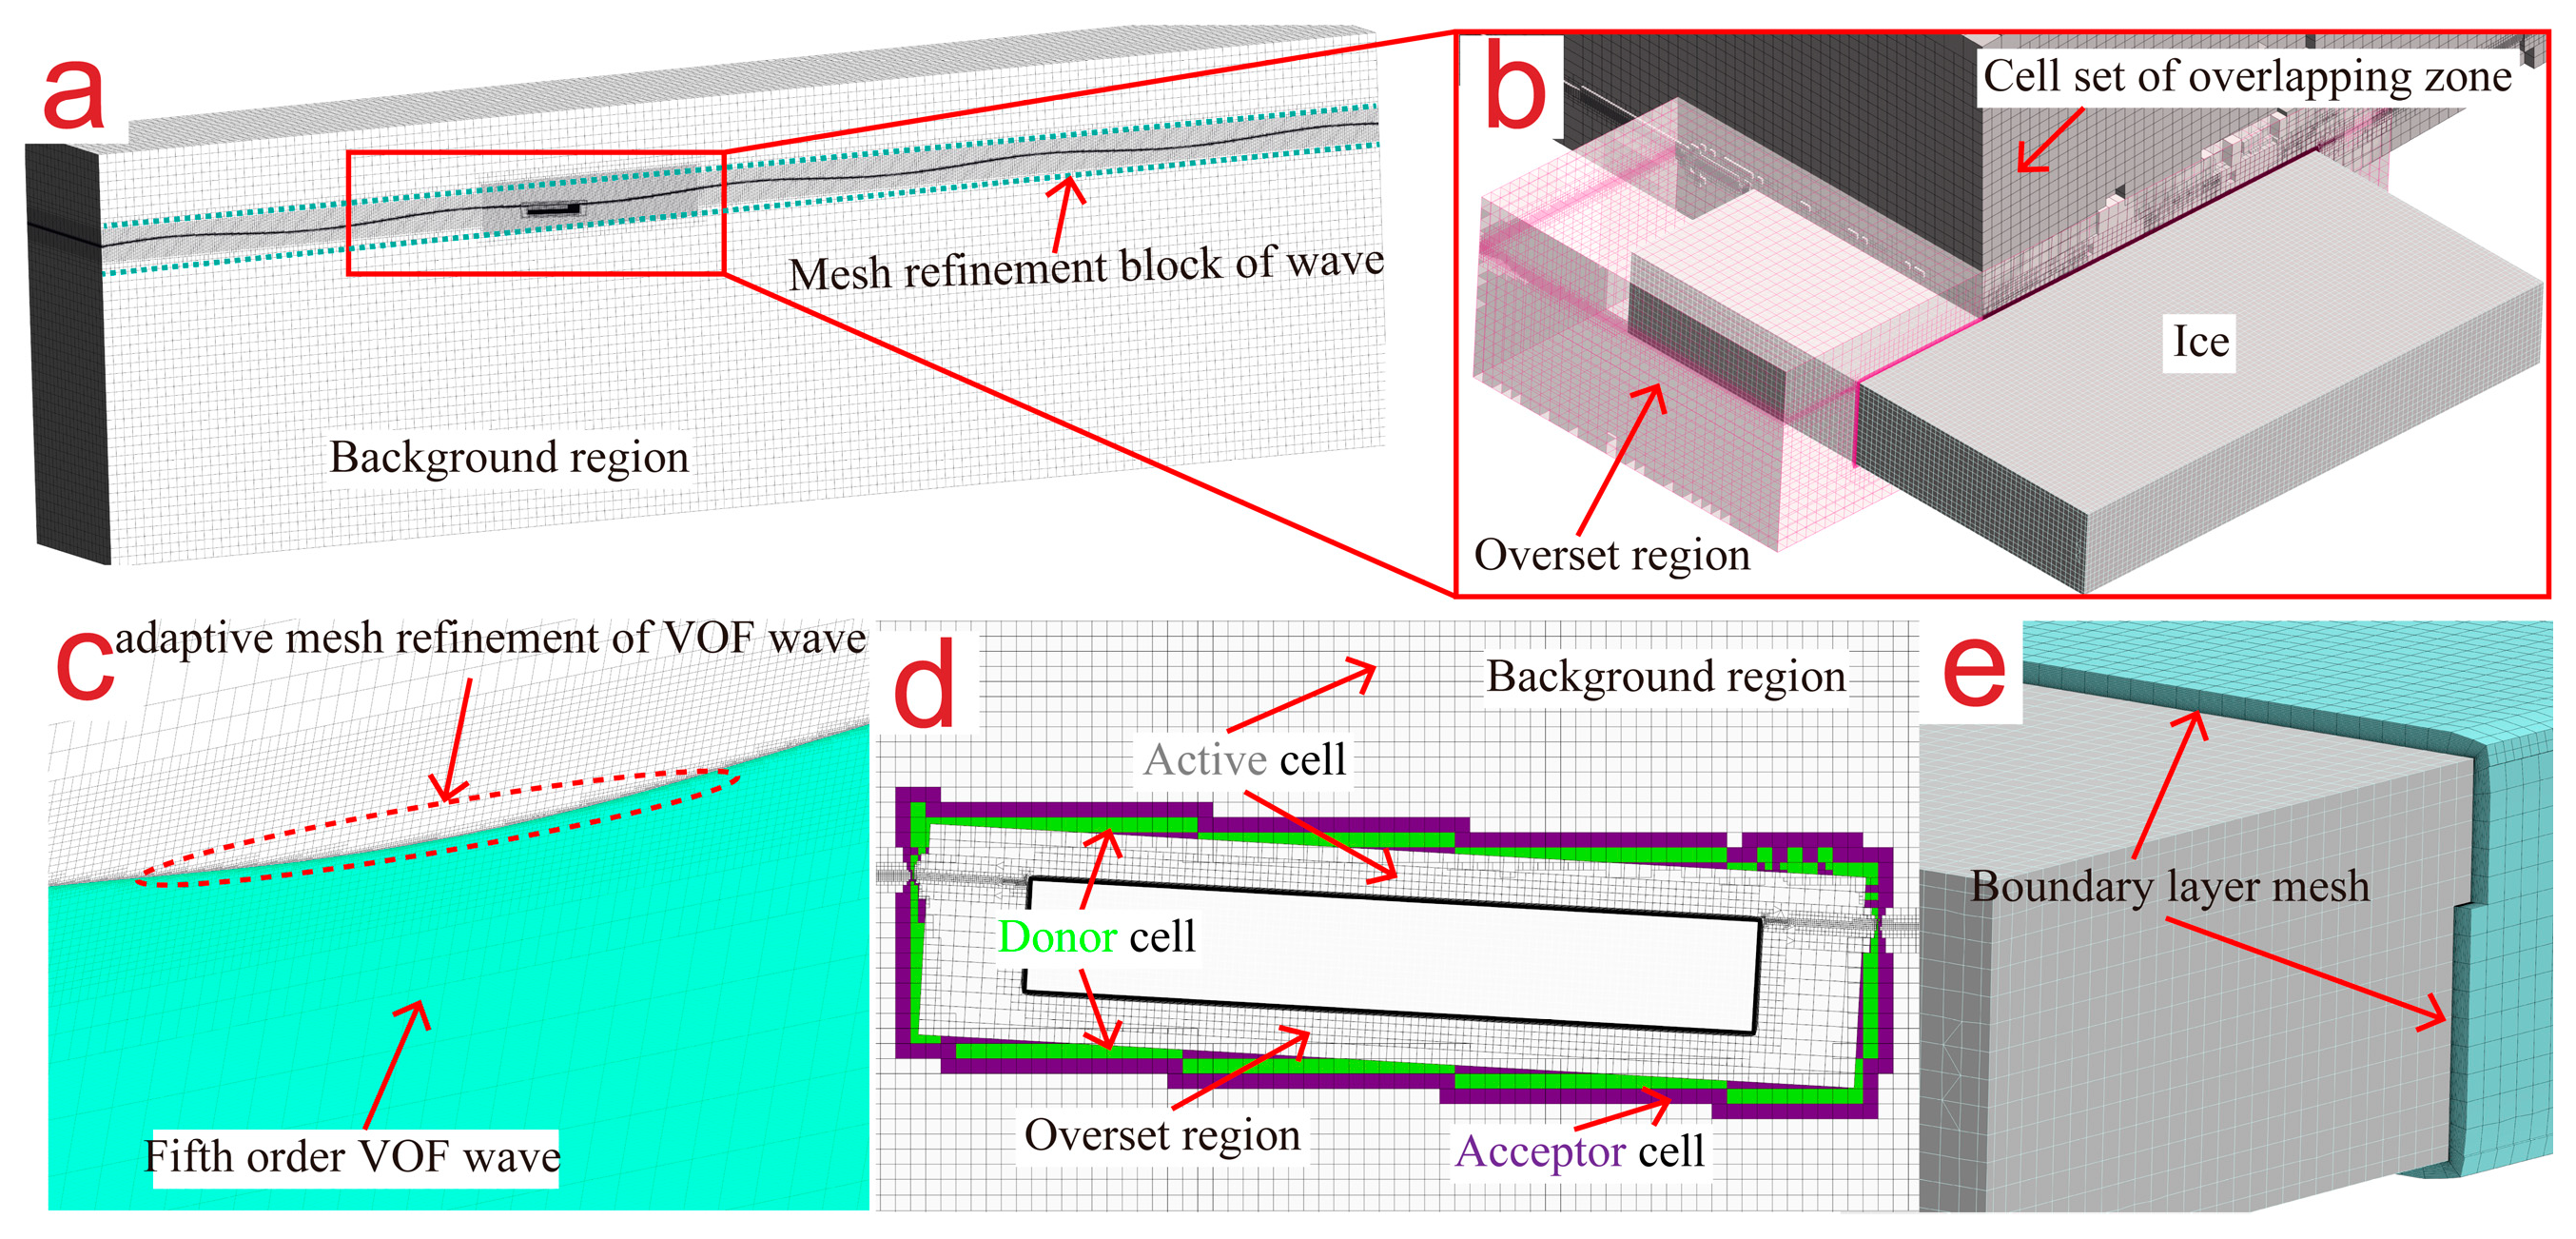
Figure 1. Computational mesh. (a) Overall of the mesh; (b) Mesh around the ice floe; (c) Adaptive mesh refinement of VOF wave; (d) Overset mesh; (e) Boundary layer mesh.
Jmse 09 00004 g001
Figure 2. Illustration of the Euler overlay method.
Jmse 09 00004 g002
Figure 3. Model ice shapes. (a) Square ice floe; (b) Circle ice floe; (c) Triangle ice floe.
Jmse 09 00004 g003
Figure 4. Model ice with sensitive spheres in wave condition. (Left: Three sensitive spheres; Right: Overwash in the test).
Jmse 09 00004 g004
Figure 5. Comparison and verification of free surface wave height. (a) Waveform and wave height detection point; (b) Comparison of free surface wave height.
Jmse 09 00004 g005
Figure 6. Comparison of wave velocity distribution. (a) Velocity distribution in the X direction; (b) Velocity distribution in the Z direction; (c) Distribution of the wave velocity vector.
Jmse 09 00004 g006
Figure 7. Motion coordinates of ice floe and waves. (a) Coordinates of floating ice and the wave in side view; (b) Coordinates of floating ice and the wave in top view; (c) Coordinates of floating ice and the wave in 3 dimensional view.
Jmse 09 00004 g007
Figure 8. Variation of the response amplitude operator (RAO) with wavelength at constant wave height.
Jmse 09 00004 g008
Figure 9. Ice floe motions along x, y, and z directions at different wavelengths. (a) X motion of ice floe; (b) Y rotation of ice floe; (c) Z motion of ice floe.
Jmse 09 00004 g009
Figure 10. Motions of ice floes along x, y, and z directions in different shapes. (a) X motion of ice floe; (b) Y rotation of ice floe; (c) Z motion of ice floe.
Jmse 09 00004 g010
Figure 11. Motions of ice floes along x, y, and z directions in different ice thicknesses. (a) X motion of ice floe; (b) Y rotation of ice floe; (c) Z motion of ice floe.
Jmse 09 00004 g011
Figure 12. Motions of ice floes along x, y, and z directions in different ice sizes. (a) X motion of ice floe; (b) Y rotation of ice floe; (c) Z motion of ice floe.
Jmse 09 00004 g012
Figure 13. Wave elevation at different times (T) after wave–ice floe interaction. (a) Triangle ice floe; (b) Square ice floe; (c) Circle ice floe.
Jmse 09 00004 g013
Figure 14. Distribution of fluid velocity around ice floes. (a) Triangle ice floe; (b) Square ice floe; (c) Circle ice floe.
Jmse 09 00004 g014
Figure 15. Floating ice attitude at T = 20 s.
Jmse 09 00004 g015
Table 1. Model ice parameters.
Model Ice TypeSymbolLength of Side/Diameter (cm)Thickness (cm)
SquareS1609
S2509
S3459
S4605
CircleC1609
TriangleT1609
Table 2. Test and simulation conditions.
Condition NumberModel Ice TypeWavelength (m)Wave Height (m)
1S11.40.08
2S11.80.08
3S12.20.08
4S12.60.08
5S13.00.08
6S13.40.08
Publisher’s Note: MDPI stays neutral with regard to jurisdictional claims in published maps and institutional affiliations.